Abstract
The new energy industry has long benefited from government subsidies in China. However, the effectiveness of subsidies as a policy tool to guide sustainable development and competition has been widely debated. This paper examines the impact of subsidy policies on the firm value of new energy companies from 2011 to 2018. Initially, we employed data envelopment analysis (DEA) to calculate corporate subsidy performance (CSP). Additionally, we investigated the impact of disclosure transparency on the relationship between government subsidies and firm value. We confirmed the significant negative impacts of subsidies and disclosure on firm value through robustness tests and sensitivity analysis. Furthermore, when considering ownership issues, we found negative impacts on firm value for state-owned firms. In contrast, privately-held firms demonstrated a positive influence on firm value. This study highlights the policy implications of subsidy effectiveness, accurate information disclosure, and corporate social responsibility on the sustainable development of subsidies in the new energy industry.
1. Introduction
Promoting a clean and low-carbon energy transition has become a global trend. China’s new energy technology has faced challenges in terms of competitiveness, leading to unsustainable resource investments. The Chinese government has implemented subsidy policies to enhance enterprise competitiveness, particularly in the new energy sector. The current reality is an imbalance between resource allocation and efficiency, with many companies exhibiting low efficiency, resource waste, and fraudulent behaviors to obtain subsidy resources. This study investigated the relationship between government subsidies’ efficiency and firm value. Furthermore, it examines the role of market protection for investors and corporate social responsibility (CSR) scores in information disclosure and their relationship with firm value.
Government subsidies are widely prevalent in the Chinese market. However, the issue of “who is important” and “who should be prioritized” can result in discrepancies between the intended and actual beneficiaries of subsidies. The positive impact of subsidy policies has not effectively explained the existing phenomena. For example, government subsidy policies often exhibit asymmetric effects with market demand, raising concerns about their effectiveness. A significant number of companies that receive government subsidies not only persist in the market but also demonstrate a state of being “stiff but deathless” (Qiao and Fei [1]). It reflects the asymmetry between government policymakers and market mechanisms. Intended to protect weaker firms, such as those experiencing losses, inefficiency, high debt, or low profitability, these companies continue to operate through government subsidies, potentially harming the interests of investors or shareholders. Despite concerns about the positive value of subsidy policies (Lee et al. [2]), there is limited research discussing the actual efficiency of subsidies, particularly in the Chinese market, where political commitments of the government and moral risks in market guarantee mechanisms are considered (Jaspersen and Richter [3]; Tao et al. [4]).
How is the firm value of new energy companies defined after receiving government subsidies? The answer is ambiguous. Firm value reflects a company’s responsibility to shareholders and sustainable development. For example, Tobin’s Q measures two essential aspects: whether a company fulfills its CSR to shareholders and whether its investments yield positive returns, generating marginal benefits or favorable future financial valuations. However, firm value measurement should be adjusted according to its environmental context. In recent years, many studies have considered CSR or ESG. Ambec and Lanoie [5] argue that improved environmental performance can enhance financial performance, potentially reducing systemic risk and increasing firm value (Albuquerque et al. [6]). However, Petitjean [7] found that eco-friendly policies, such as emission reductions and climate change initiatives, did not have financial benefits during economic downturns. The impact of CSR on firm value or financial performance remains inconclusive, possibly due to the moderating effects of shareholder–stakeholder conflicts of interest (Li and Wu [8]) or variations in institutional ownership levels and depending on economic conditions (Buchanan et al. [9]). Increased investment in CSR activities may reduce agency conflicts between managers and non-stakeholders, further enhancing reputation and profitability and increasing firm value. However, the consideration of CSR activities as costly investments (Bird et al. [10]; Jo and Harjoto [11]) may raise concerns regarding resource wastage. Many new energy companies receive substantial subsidies and face increased social pressure for more excellent CSR (Flammer [12]), which can also impact their value. Based on these reasons, we aim to fill the gap in the limited theoretical literature while providing empirical context in the new energy industry.
Our study contributes to the literature in the following ways. Firstly, the incentives provided by subsidy policies prompt governments to strengthen their regulation and internal control to influence the quality of information disclosure. For example, Liu and Guo [13] focused on how mandatory changes in environmental regulations affect the quality of corporate environmental information disclosure, finding that firms with low market values and no environmental subsidies disclosed more information due to environmental taxes. From a corporate governance perspective, the importance of information disclosure and transparency is emphasized, as increasing corporate information transparency can reduce information asymmetry between managers and external investors (i.e., equity capital agency costs) (Chen et al. [14]; Verrecchia [15]). Effective information disclosure mainly focuses on direct or indirect impacts on stakeholders, such as the quality of environmental disclosure serving as a reputational risk warning (Alsaifi et al. [16]; Schantl and Wagenhofer [17]), mitigating adverse selection and related moral hazard due to poor risk investment decisions (Botosan [18]), and further potentially significantly affecting firm value (Lee et al. [19]). This study further discusses the relationship between information disclosure transparency and the indirect effects of subsidies on firm value.
Secondly, this study empirically investigates the impact of government subsidies on new energy companies from the perspectives of efficiency and firm value, considering subsidy amounts as crucial input factors to expand empirical research in this field. Data Envelopment Analysis (DEA) serves as a decision-making tool for evaluating the efficiency of decision-making units (DMUs) by determining the efficiency of DMUs through their input and output performance. DEA results can indicate whether the same output level can be produced with a lower input level or higher output can be produced with the same input. DEA methods in the literature are advantageous for explaining uncontrollable factors, allowing for non-quantitative data and behavioral data (Charnes et al. [20]; Lovell and Pastor [21]; Zhu [22]; Cherchye et al. [23]). In this study, there are two main reasons for using DEA: first, government subsidies are allowed to exhibit heterogeneity in DEA; second, DEA imposes no binding constraints on input and output parameter specifications, which, given the unstable nature of subsidies, can improve efficiency accuracy (Liu et al. [24]). Similar approaches include that proposed by Lahouel et al. [25], who considered a reliable multi-dimensional aggregated measure covering ESG factors and used the DEA method to measure the relationship between Corporate Social Performance (CSP) and financial performance. Wang et al. [26] considered financial statement factors in a dynamic DEA model to measure firm efficiency and explore the impacts of CSR on firm performance.
The remainder of this paper is structured as follows. Section 2 reviews the literature on government subsidy policies and their main findings and impacts. Section 3 describes the DEA model and estimation equation, including input and output variables and the final efficiency value result distribution. Section 4 presents the empirical results and robustness checks. Section 5 summarizes the main findings and conclusions, including research suggestions and limitations.
2. Literature Review
Government subsidy can be regarded as a policy tool for economic interventions to encourage innovation, maintain business operations, increase firm demand for higher efficiency, or achieve policy objectives (Schwartz and Clements [27]; Liu et al. [28]). Subsidy policies have been widely discussed in numerous studies with various themes, particularly regarding policy-oriented subsidy programs in the Chinese market, which have attracted significant attention. The new energy industry in China currently receives long-term subsidies from the government, and these policies imply underlying challenges, including insufficient technological innovation, overcapacity, and environmental pollution issues, all of which impact the sustainable development capabilities and the value of enterprises. Government subsidies also provide insights into business strategies, corporate social responsibility, and sustainable growth and offer alternative interpretations of corporate governance, regulatory policies, and risk management. Government subsidies can stimulate the development of emerging industries, such as high-tech or new energy sectors, which prioritize innovation but require a more mature market presence (Tan et al. [29]; Sun et al. [30]).
Opinions on the benefits of subsidies are divided, as evidenced from prior studies (see Table 1). Those with a positive view believe subsidies can promote industry development or improve company performance and profitability. In contrast, those with an opposing view argue that subsidies may lead to policy dysfunction, such as reduced capacity utilization, uneven resource allocation, and decreased economic benefits, or that they may result from political (Hardaker et al. [31]) rather than economic benefits, causing moral crises. Furthermore, they may lead to deceptive practices, such as greenwashing. For example, Zhang [32] found that companies with high financial risk have strong incentives to engage in greenwashing following the expiration of subsidies, especially in highly polluting enterprises. Sun et al. [30] used data from the 2010 U.S. automobile market, and their findings suggested that consumer subsidies are more effective than manufacturer subsidies in promoting the popularization and technological breakthrough of electric vehicles. Lee et al. [2] explored government subsidies using large-scale statistical data to estimate accounting-based models of firm value.

Table 1.
Summary literature from a two-sided perspective of firm value.
Based on the comprehensive discussions of the studies above, the impact of subsidy policies on firm value presents a two-sided perspective, thereby providing support for the following hypotheses:
Hypothesis 1a (H1a).
Subsidy policies positively impact firm value for the Positive Opinions.
Hypothesis 1b (H1b).
Subsidy policies negatively impact firm value for the Negative Opinions.
Subsidy policies raise various corporate governance issues, making government subsidies a potentially significant signal. From a financial signaling theory perspective, government subsidies may cause market adjustments in business decision-making, and companies must adapt their inputs and outputs accordingly. For example, Yan and Li [36] argue that government subsidies can impact the credit transmission process signal, causing banks to focus more on the endorsement effect of government subsidies (i.e., the implicit guarantee of the government) rather than the credit quality of enterprises, especially during periods of monetary tightening. Information asymmetry is an essential aspect of corporate governance, and the benefits of subsidies can affect enterprise efficiency, often influenced by policy-driven motivations and standards. For example, zombie enterprises may receive subsidies due to banks’ concealment, aiming to improve the banks’ capital adequacy ratio (Qiao and Fei [1]). However, Zhang [32] also found that companies have strong incentives to engage in greenwashing following the expiration of subsidies, highlighting the importance of subsidies for green development issues. In recent years, ESG and CSR evaluations can represent sustainable development for corporate stakeholders, external investors, and supervisory authorities. They can also be seen as a manifestation of market reputation. Higher scores may also reduce information asymmetry, and many studies have found that voluntary disclosures can help obtain cheaper financial resources or policy subsidies (Dhaliwal et al. [37]). However, ESG disclosure scores may also be overly packaged and exaggerated, leading to the acquisition of more financial resources through a false reputation image (Zhang [38]).
Based on the motivation behind subsidy policies, the degree of transparency in the disclosure can influence corporate governance issues. Consequently, the information asymmetry between managers and external investors arising from subsidies can further impact firm value. Therefore, we propose the following hypothesis:
Hypothesis 2 (H2).
The level of transparency in disclosure positively affects firm value.
3. Methodology
3.1. Measuring CSP Using Data Envelopment Analysis
Data Envelopment Analysis (DEA) is a systems analysis and non-parametric technique. DEA was first proposed by Charnes, Cooper, and Rhodes [20], hence the CCR model. The model is based on Farrell’s [39] analysis of technical efficiency for a single input and output, which was then extended to handle multiple input and output problems. The CCR model uses the input and output of all evaluated Decision-Making Units (DMUs) to find an efficiency frontier under constant returns to scale. DMUs on the efficiency frontier are considered efficient, with an efficiency index of 1, while DMUs within the efficiency frontier are relatively inefficient, with an efficiency index between 0 and 1. Banker, Charnes, and Cooper [40] later expanded the CCR model into the BCC model, modifying the assumption of constant returns to scale in the CCR model allowing for variable returns to scale, and deriving pure technical efficiency and scale efficiency for comparison. Compared to traditional regression analysis methods, it has mathematical planning characteristics and solves the shortcomings of production function averaging and misuse risk. DEA has been widely applied in the efficiency and performance evaluation of DMUs in various fields, such as banking, energy, and the public sector (Emrouznejad and Yang [41]).
Consider a DMU that generates “s” outputs from “m” inputs, with a total of n DMUs in the system. Denote the quantity of the ith input used and the rth output created by the jth DMU as xij and yij, respectively. Let DMUb (b = 1, …n) represents a fixed benchmark. Based on the non-radial measure approach (as proposed by Pastor et al. [42]), the interactive benchmark model can be formulated using the following linear programming problems:
Here, the technical efficiency (TE) of the target DMUo is calculated using the fixed benchmark, DMUb. Each target DMUo has (n − 1) technical efficiencies, where n denotes the total number of DMUs. By averaging these technical efficiencies for the target DMUo with the fixed benchmark DMUb, we can determine the mean efficiency scores of the target using the subsequent equation:
where . The interactive benchmark model can be extended to incorporate various radial and non-radial efficiency measurement models.
3.2. Input and Output Variables
Many past studies have used financial ratios as input and output variables in DEA models to measure corporate performance. Wang et al. [26] used financial variables to measure the efficiency of telecommunications companies, using the dynamic production process of financial statements as the basis for input and output variables. Although input variables are often not considered in DEA models for multi-attribute decision-making or evaluation problems, they allow for heterogeneous characteristics. For example, Cherchye et al. [23] used a DEA approach to measure customer value using customer behavior data. Lahouel et al. [25] measured the relationship between corporate social performance and the financial performance of airlines, incorporating ESG variables such as resource use, emissions, innovation, governance management, workforce, rights, community, and customer/product responsibility to calculate corporate social performance efficiency to measure firm value. Moreover, the DEA method can provide reliable multi-dimensional aggregate measurements, using financial statement data in this study to reflect the utility value of each attribute affecting firm value through DEA.
Table 2 presents the input/output variable descriptions for this study. Based on the format of financial statements, revenue and market value are used as the final operational outcomes of the firm, reflecting both the book performance and market valuation performance, with revenue being included in the Income Statement, representing the net profit or loss at the end of the fiscal year. Here, market value (MV) is calculated by multiplying the number of shares outstanding by the year-end price. For input variables, stockholder equity, liabilities, and compensation from the Balance Sheet are used, representing the initial starting point of the company’s investment at the beginning of each new fiscal year. In this formula, stockholder equity (SE) represents the company’s shareholders’ net worth or ownership interest in relation to its liabilities. Expenses are included in the Income Statement, reflecting the costs required for production inputs. Employees are disclosed in the notes to the financial statements, as employee hiring is the most important asset of a company, implying corporate social responsibility and the ability to create firm value. The variable of Subsidy, as a government subsidy, is an exogenous input variable, reflecting the impact of corporate operations receiving subsidies on their operations and measuring the efficiency of corporate subsidies.
Table 2.
The description of variables in the DEA process.
Figure 1 depicts the research process flowchart employed in this study. Initially, we defined the input and output variables required for calculating efficiency values based on relevant literature. MaxDEABasic 5.2 software was then utilized to obtain efficiency values using financial statement data, including government subsidy expenses, to derive the Corporate Subsidy Performance (CSP) measure. Subsequently, we investigated the impact of financial characteristics and transparency on firm value. The specific definition and testing models for the financial characteristics are further elaborated in the subsequent sections.
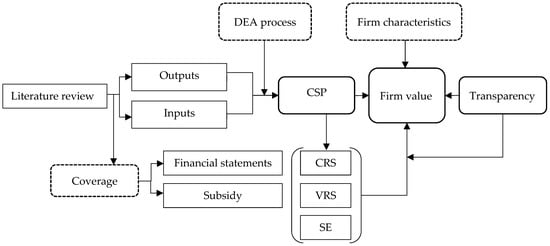
Figure 1.
Flow chart of methodology.
3.3. CSP Efficiency Distribution
The data for this study are sourced from the China Stock Market and Accounting Research Database (CSMAR), selecting a sample of new energy industry companies from 2011 to 2018. Table 3 presents the corporate subsidy performance (CSP) and distribution obtained from the input/output variables in the DEA model. The measurement objects are the new energy industry from 2011 to 2018, with the degree of information disclosure and a descriptive summary distribution of CSP. Efficiency values range from 0 to 1, with higher values implying higher corporate efficiency generated through government subsidy funds and vice versa. Panel A shows the annual average CSR for the entire industry. On average, higher CSR was generated through government subsidies in 2014, but it shows a declining trend year by year until 2018. Panel B displays the distribution of CSR for different subsidy levels. At low (10%), average (50%), and high (90%) subsidy levels, the highest average CSR was achieved in 2013, 2011, and 2014, respectively. Panel C presents the information disclosure level subgrouping. A, B, C, and D represent the levels of information disclosure from high to low, with the highest average CSR in 2013 for the highest and lowest disclosure levels. Through the distribution of CSR scores, this study initially investigated whether company and subsidy resources are effectively utilized while also examining the effectiveness and rationality of the DEA model in high-dimensional settings. Figure 2 presents a scatter plot illustrating the distributions of CSP scores, comparing the average values of total efficiency, subsidies, and transparency for each year.
Table 3.
Results of CSP scores distributions: A DEA approach.
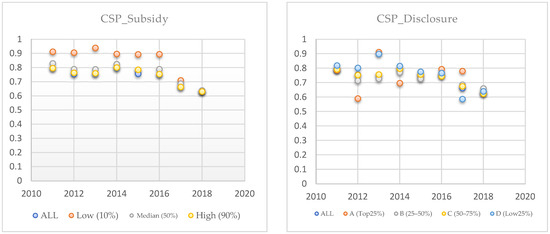
Figure 2.
CSP score distributions.
3.4. Empirical Models and Variable Definitions
This study’s empirical model primarily focused on CSP’s impact on firm value. After the first stage of DEA analysis, the final corporate subsidy performance efficiency values were obtained. In this study, we followed the approach of Wang et al. [26] and Lahouel et al. [25], testing the effect of control variables on firm value through the specification and estimation of the proposed model. Table 4 presents detailed variable explanations, definitions, and usage. The following cross-sectional regression is used:
where is the intercept term, Tobin’s Q measures firm value, CSP is the corporate subsidy performance measured through the DEA model’s CSP index, DISCORE is the information disclosure level score, FF5 represents the market five factors (Fama and French, 1992) [43], Controls is a set of control variables, including firm financial liquidity, growth, and profitability capabilities. YEAR and represent the time-fixed effect and the error term, respectively.
Table 4.
Variable definitions.
4. Results
4.1. Data and Descriptive Statistics
The research sample in this study consisted of listed companies in the new energy industry from 2011 to 2018. The data selection and references are as follows: financial variable data were sourced from the CSMAR database, information disclosure level ratings came from the Shenzhen Stock Exchange, and Eastmoney.com (accessed on 1 April 2020) provided data for new energy concept board companies. This study selected listed companies with government subsidies disclosed from 2011 to 2018 as the research sample and divided the samples based on new energy concept stocks. First, non-new energy industry-listed companies were excluded to ensure the validity of the sample. Since the industry categories disclosing government subsidies do not further subdivide the new energy industry, initially, a total of 789 companies related to 15 new energy-related items, such as biomass energy, batteries, electricity, and wind power, were selected from the concept board of Eastmoney.com (accessed on 1 April 2020). Second, according to the requirements of information quality consideration, the information quality rating of the Shenzhen Stock Exchange for A-shares is insufficient, so companies from the main board and the small and medium-sized enterprise board were retained. Third, data loss will affect the accuracy of this study, so companies with missing data from 2011 to 2018 were removed. Then, companies with the Special Treatment (ST) category were excluded because these companies are likely to have errors in their information disclosure due to poor management. Finally, we included 273 companies each year after excluding a small number of missing values, resulting in a sample size of 2172. Table 5 shows the summary statistics and correlation coefficients for firm value, CSP values obtained from DEA, raw subsidy data, and other control variables.
Table 5.
Correlation coefficients and descriptive statistics.
Before conducting cross-sectional and panel data empirical analysis, this study first examined the correlations between these variables. The table shows that Tobin’s Q and CSP are negatively correlated, with a correlation coefficient of −0.048, reaching a 5% significance level of a negative correlation. The results indicate that companies with improved performance efficiency after receiving subsidies have not seen corresponding increases in market value, and other factors may be affecting the market’s valuation of these companies. Market and CSP are positively correlated, with a correlation coefficient of 0.098 (1% significance level), indicating a positive correlation between market returns and company performance efficiency. It means that companies with improved performance efficiency after receiving subsidies can achieve higher market returns, indicating that investors believe these companies have better growth prospects in the future and are, therefore, willing to pay a higher price. SMB and CSP are negatively correlated, with a correlation coefficient of −0.111 (1% significance level). Small companies may be more likely to improve their performance efficiency after receiving subsidies, while large companies may struggle to achieve the same level of performance improvement after receiving subsidies. It may reveal that small companies have more flexibility and growth potential after receiving policy support.
HML and CSP are positively correlated, with a correlation coefficient of 0.155 (1% significance level). It indicates a positive correlation between value investment style and company performance efficiency, meaning that value investors tend to invest in companies with higher performance efficiency after receiving subsidies. It may reflect that value investors have a higher sensitivity to the impact of subsidy policies and thus concentrate their investments in more efficient companies. RMW and CSP are positively correlated, with a correlation coefficient of 0.157 (1% significance level), suggesting that companies with higher profitability can achieve higher performance efficiency after receiving subsidies. Companies can effectively use subsidies to improve profitability after receiving policy support, enhancing overall performance. Liquidity and CSP are positively correlated, with a correlation coefficient of 0.198 (1% significance level). Companies with higher liquidity are more likely to improve their performance efficiency after receiving subsidies. They can better allocate resources to areas that contribute to higher performance efficiency, thus achieving higher performance. DISCORE and CSP are significantly negatively correlated, which may indicate that companies with higher levels of information disclosure may have certain shortcomings in resource allocation and management efficiency after receiving subsidies, or these companies face higher governance costs, affecting performance efficiency. The correlation between DISCORE and Tobin’s Q is very low, which may imply that the market valuation of companies is not closely related to the level of information disclosure and may be affected by other factors. It should be noted that correlation does not imply causation. Further empirical research in this study will be conducted to verify and explain these findings.
4.2. Empirical Results
Past studies have reached different conclusions and directions regarding the relationship between subsidy policies and firm value. From a policy perspective, government subsidies are policy tools that assist firms in effectively allocating resources and investments, guiding financial performance, and enhancing market competitiveness. From a corporate governance perspective, conflicts of interest between managers and external investors may ultimately lead to changes in firm value caused by subsidy policies. On the one hand, subsidized firms can send positive signals to attract investors and external funds to improve operational efficiency; on the other hand, if subsidized firms engage in negative behaviors, they may create moral hazard issues, such as concealing the company’s proper operating conditions to obtain more subsidies or accepting subsidies without engaging in plans that benefit firm value, thereby harming shareholders and firm value.
Table 6 presents the final regression results of the impact on firm value using panel data regression. All models have considered fixed effects, which helps control for unobserved firm heterogeneity. In Models (1) and (2), the effects of corporate subsidy performance (CSP) and information disclosure level (DISCORE) on firm value (Tobin’s Q) were examined, respectively. In Model (1), the impact of CSP on firm value is negatively correlated and significant at the 5% level, with a coefficient of −0.384, implying a negative relationship between firm performance efficiency and firm value. It may indicate that firms with higher performance efficiency after receiving subsidies have relatively lower firm value. In Model (2), the impact of DISCORE on CSP also shows a significant negative correlation, suggesting that firms with higher levels of information disclosure may have relatively lower firm value. This result is similar to Qiao and Fei [1], which suggests that government subsidies may cause moral hazard issues that reduce firm efficiency, especially in the presence of zombie firms. The empirical results also imply a risk of resource misallocation in government subsidy policies and a potential crowding-out effect (Caballero et al. [44]). In Model (3) and Model (4), all control variables are included in the models, comprising market fundamentals (i.e., five factors; FF5) and firm fundamentals (i.e., liquidity, growth, and profitability). The empirical results show a significant negative relationship between CSP (β = −0.418, p-value < 0.05) and DISCORE (β = −0.160, p-value < 0.01). Model (5) considers all variables and control variables, and the results confirm the previous findings. Moreover, in Models (2), (4) and (5), the observed negative significance does not provide support for Hypothesis 2 in this study. CSP and information disclosure negatively impact firm value, suggesting that government subsidies and the government’s assessment of corporate information disclosure levels do not significantly improve incentives for firm value.
Table 6.
Baseline estimation results.
4.3. Robustness Tests
Prior studies recommend addressing endogeneity issues in empirical models to reduce biases. We employed the two-stage least squares (2SLS) and instrumental variable (IV) approaches for testing. Model (1) and Model (2) consider the time dependency of financial performance, using the method by Lahouel et al. [25], setting up a dynamic model that assumes Tobin’s Q and CSP can influence each other and have reciprocal feedback loops. This simultaneity (or reverse causality) is considered another source of endogeneity. The model is established as follows:
Models (3)–(6) use instrumental variables (IV) for testing, using SUBSIDY (calculated as subsidy amount divided by assets). According to Qiao and Fei [1], the government and industry’s average subsidy level is used as the IV. Wang et al. [26] use firm i’s change in sales in year t. Our study used the ratio of individual subsidies to individual assets. The reason is that individual firms have heterogeneity, and government subsidies may be given according to the scale of the enterprise itself. Secondly, it can exclude the influence of extreme subsidy amounts, leading to external effects. Moreover, assets and subsidies change over time and have randomness, and subsidies as external resources have unpredictability, while OLS is static analysis, and dynamic effects are endogenous factors.
Table 7 shows the robustness test results. After controlling for the lagged Tobin’s Q and excluding the association between variables, CSP is insignificant in Model (1) but significant in baseline models. Consistent with prior findings, the negative significance of disclosure (β = −0.197, p-value < 0.01) persists, indicating that it does not support Hypothesis 2 of this study. To further understand the differences, we consider interaction terms using CSP*DISCORE, which remains negatively significant (β = −0.124, p-value < 0.05), verifying the robustness of baseline models.
Table 7.
Robustness tests of the baseline model and levels of SUBSIDY.
Considering that specific time factors may bias subsidies, we treated subsidies as IV, using the ratio of individual assets. Models (3)–(6) test different interactions between information disclosure and corporate subsidy performance. Models (3) and (4) test the interaction between information disclosure rated A (using CSP*DIS_A) and B (using CSP*DIS_B) with CSP. Empirical results showed a significant negative relationship for companies with the highest government assessment of information disclosure (β = −0.421, p-value < 0.01). Interestingly, we found that in Model (4), companies with the second-highest information disclosure rating have a significant positive relationship (β = 0.176, p-value < 0.1). Models (5) and (6) test companies with lower and lowest information ratings, finding similar positive effects but not statistically significant. The results imply that government subsidy efficiency does not significantly improve the firm value and even shows a negative relationship. We believe there may still be potential for technological innovation and resource waste in the new energy industry. As external policy supervisors or investor protectors, information disclosure evaluation is a critical reference. However, empirical results show that higher information transparency does not improve the firm value and interacts with the subsidy effect, implying potential moral hazard, such as “too big to fail” zombie companies that rely on government subsidies to maintain operations and may continue to hide or falsify financials to obtain higher ratings and more government subsidies. However, for public companies, it is undeniable that information disclosure may also help companies engage in more corporate social responsibility or ESG activities to enhance firm value.
4.4. Robustness Test to Control Rights
Table 8 presents the results of a robustness test that considers the influence of control rights, specifically comparing state-owned and privately-held companies. We recognize that the execution and effectiveness of subsidy policies may differ based on the control rights within a company. Consequently, our model separately examines the outcomes of subsidy efficiency and information disclosure transparency for each control rights category.
Table 8.
Robustness test to control rights between state-owned and private-holding.
In the case of state-owned control rights, our findings indicate that subsidy policies consistently negatively impact firm value, thereby supporting the conclusions drawn in Hypothesis 1b. However, in Model 3 of Table 8, when both subsidy efficiency and information disclosure transparency are simultaneously considered, the latter does not exhibit a statistically significant effect on firm value. Conversely, the regression results for privately held control rights reveal a significant favorable influence of subsidy policies on firm value, corroborating the conclusions derived from Hypothesis 1a. Additionally, whether evaluating individual control variables or jointly considering both, information disclosure transparency consistently exhibits a significant positive relationship.
In summary, subsidy policies in state-owned enterprises are implemented more passively and have advantages, while private enterprises face competition and may not receive appropriate subsidies. Bureaucracy (Ahlin and Bose [45]) in state-owned enterprises may contribute to policy rigidity and negative value implications.
Overall, our study yields robust results that underline the divergent impact of subsidy policies on firm value depending on the underlying control rights framework.
4.5. Sensitivity Testing to DEA-BCC Results
Table 9 presents the results of sensitivity testing to the DEA-BCC results. Appendix A provides a comprehensive and detailed exposition of the corporate subsidy performance within the framework of the DEA model. Based on the DEA model mentioned above, we have divided the overall efficiency into Pure Technical Efficiency and Scale Efficiency. We describe the relationships among total efficiency, pure technical efficiency, and scale efficiency (SE) to measure the efficiency of the Decision-Making Units (DMUs) and explain the reasons for relative inefficiency. This analysis utilizes the DEA–BCC model, which assesses efficiency under both Constant Returns to Scale (CRS) and Variable Returns to Scale (VRS) assumptions. The BCC model relaxes the assumption of fixed scale returns and adds additional constraints to the model. Decision-makers can determine whether a DMU has scale efficiency by examining whether the scale efficiency value is equal to 1, providing guidance for adjusting the production scale of the DMU.
Table 9.
Sensitivity testing to the DEA-BCC results.
Since the CCR model assumes fixed scale returns, it can be used to evaluate total efficiency. On the other hand, the VRS assumption in the BCC model enables the assessment of technical efficiency. Therefore, when using the DEA method, combining the CCR and BCC models to calculate the scale efficiency value and further comparing the relative efficiency among DMUs is necessary. Through the BCC model, we can understand how much of the technical inefficiency stems from pure technical inefficiency (wastage of inputs) and how much is due to inefficiency in producing at the optimal scale in the future for the DMU.
Table 9 presents the results of regressing the Corporate Subsidy Performance (CSP) on firm value, estimated using the CRS, VRS, and SE models. We examined the outcomes before and after controlling for independent and control variables. The results consistently align with Hypothesis 1b, indicating a negative impact of CSP on firm value in both the CRS and VRS models. The robust findings suggest that decision-making units that do not achieve relative efficiency in subsidy utilization should improve their resource allocation to optimize firm value. However, the results from the SE model are not statistically significant, indicating less robustness in the findings. Additionally, across all three models, the impact of information disclosure transparency remains robust and consistent with previous findings, revealing a negative relationship with firm value. It implies that improving the institutional framework regarding information disclosure practices is essential.
In summary, our regression analysis supports Hypothesis 1b, indicating a negative impact of CSP on firm value in the CRS and VRS models. At the same time, the results are less robust for the SE model, as shown in Models (4)–(6). Furthermore, the consistent negative relationship between information disclosure transparency and firm value across all models highlights the need for institutional reforms to enhance transparency standards.
4.6. Discussions
The findings from previous studies contribute to the understanding that subsidy policies can have both beneficial and detrimental effects on firm value, indicating the presence of potential positive and negative outcomes associated with these policies.
In brief, the past research findings present a mixed picture regarding the impact of subsidy policies on firm value. While some studies support that subsidies positively influence productivity, profitability, and innovation performance (supporting Hypothesis 1a), others indicate a negative effect on firm value (supporting Hypothesis 1b). These studies shed light on the multifaceted nature of subsidy policies, highlighting their potential benefits in terms of stability, modernization, and economic growth, as well as their drawbacks, such as government failure, moral hazard, and limited effectiveness. It is evident that various factors, including industry characteristics and internal control mechanisms, influence the effects of subsidy policies.
Drawing upon the empirical results of our study, which include robustness tests, instrumental variable analysis, and sensitivity analysis, it can be inferred that subsidy policies have a detrimental impact on firm value. This finding provides support for hypothesis H1b.
Considering control rights, the findings reveal a contrasting impact of subsidy policies on firm value. For state-owned enterprises, subsidy policies negatively influence firm value, thus corroborating the assertion of Research Hypothesis 1b. In contrast, subsidy policies for privately held enterprises positively affect firm value, supporting Research Hypothesis 1a. Furthermore, in the benchmark model and three sensitivity tests conducted on the DEA–BCC results, the impact of information disclosure transparency consistently reveals a significant negative relationship with firm value, indicating a lack of support for Hypothesis 2 of this study.
Indeed, the Chinese government provides subsidies for various purposes, including investment support, employment generation, and assistance to struggling enterprises. Empirical evidence broadly supports the positive impact of subsidies on firm value (Lee et al. [2]). However, a more significant concern arises from the consistent socio-political ideology in China, suggesting that the signaling effect of subsidy policies may outweigh the expected outcomes. Moreover, the prioritization of political costs (Watts and Zimmerman [46]) over stakeholder theory (Freeman [47]) can explain the inefficiency of subsidy policies (Hu et al. [48]) and the presence of corruption and zombie companies.
Government regulation plays a crucial role in ensuring efficient and accurate resource allocation. Bureaucratic practices (Ahlin and Bose [45]) are widely recognized in Chinese society, particularly within politically connected interest networks. This can also account for the inverse effect observed in state-owned enterprises. Consequently, transparency in disclosure implies that as subsidy policies increasingly emphasize corporate social responsibility, there is a growing need for enhanced openness and transparency. However, Xue et al. [49] found that voluntary and mandatory CSR disclosure negatively impacts firm profitability. This finding deepens our understanding of Chinese-style capitalism, highlighting a need for systematic reporting and monitoring regarding the effectiveness of subsidies in Chinese society.
5. Conclusions and Suggestions
After receiving substantial government subsidies, the new energy industry faces numerous government regulatory measures. Investors also demand that companies implement more corporate social responsibility (CSR) practices. Firm value reflects the overall result of a company’s operations and can be described as the market’s valuation of the company’s sustainability. Subsidy policies in China are strategic tools to strengthen companies’ competitiveness and stimulate their investments and innovations. However, resource wastage and the uncertainty of subsidy objectives indicate that companies lag in technological capabilities and lack internal policy control.
The existing literature on subsidy effects lacks conclusive evidence regarding their impact on firm value, leading to conflicts among managers and investors. This study addresses this gap using data envelopment analysis (DEA) to examine the relationship between subsidy performance efficiency and firm value. The findings show a negative association, indicating that government subsidies have limited benefits in increasing firm value. Information disclosure also negatively affects firm value, suggesting that a higher corporate reputation only sometimes leads to higher firm value. These findings highlight the potential risks of moral hazard and fraudulent activities associated with subsidies. Robustness tests support these results and indicate that higher transparency levels may negatively impact firm value. Furthermore, the analysis reveals that subsidy policies have a significant negative effect on state-owned enterprises but a positive effect on privately-held firms, emphasizing the role of ownership in policy effectiveness.
In conclusion, this study contributes to the literature by investigating the relationship between government subsidies, information disclosure, and firm value, particularly in the Chinese market with its unique regulatory environment characterized by stricter regulations, political costs, and bureaucratic considerations. The findings underscore the importance for policymakers and stakeholders to carefully consider these factors to optimize the benefits of subsidy programs and enhance overall firm value in a dynamic and evolving business landscape. Additionally, stakeholders should prioritize transparency and accountability in information disclosure practices to ensure a more accurate assessment of firm value and promote sustainable business practices.
This study still has some limitations. Future research suggestions include considering multi-dimensional CSR or ESG variables to measure CSP, utilizing more advanced DEA methods, incorporating different industry characteristics, and considering investor behavior. Furthermore, data limitations should be considered, including biases from unreasonable subsidies and policy distortions during the COVID-19 pandemic. Other factors to consider include company size, managerial quality, and the location-specific factors of subsidy policies.
Author Contributions
Y.-C.C. contributed to this paper’s conceptualization, evaluation modeling, and writing. Y.-X.F. and Y.Q. conducted the investigation and formal analysis. Y.-C.C. and S.-M.K. conceived the simulation and evaluation reports and contributed to writing—reviewing, and editing. All authors have read and agreed to the published version of the manuscript.
Funding
This research received no external funding.
Institutional Review Board Statement
Not applicable.
Informed Consent Statement
Not applicable.
Data Availability Statement
Not applicable.
Acknowledgments
We thank the anonymous referees and academic editor for the comments. Any remaining errors are solely ours.
Conflicts of Interest
The authors declare no conflict of interest.
Abbreviations
| DEA | Data envelopment analysis |
| CSP | Corporate subsidy performance |
| CSR | Corporate social responsibility |
| ESG | Environmental, social and governance |
| DMUs | Decision-making units |
| “CCR” model | Charnes, Cooper, and Rhodes |
| “BCC” model | Banker, Charnes, and Cooper |
| CSMAR | China Stock Market and Accounting Research Database |
| 2SLS | Two-stage least squares |
| SE | Scale efficiency |
| CRS | Constant Returns to Scale |
| VRS | Variable Returns to Scale |
Appendix A
Table A1.
CSP Score Distributions Based on DEA–BCC Models.
Table A1.
CSP Score Distributions Based on DEA–BCC Models.
| Level | 2011 | 2012 | 2013 | 2014 | 2015 | 2016 | 2017 | 2018 | |
|---|---|---|---|---|---|---|---|---|---|
| Panel A: Total | |||||||||
| CRS | ALL | 0.704 | 0.647 | 0.651 | 0.708 | 0.652 | 0.640 | 0.504 | 0.491 |
| VRS | 0.780 | 0.732 | 0.733 | 0.781 | 0.725 | 0.710 | 0.545 | 0.626 | |
| SE | ALL | 0.903 | 0.886 | 0.885 | 0.903 | 0.897 | 0.903 | 0.940 | 0.777 |
| Panel B: Subsidy | |||||||||
| CRS | Low (10%) | 0.873 | 0.866 | 0.913 | 0.848 | 0.847 | 0.846 | 0.576 | 0.493 |
| VRS | 0.902 | 0.913 | 0.970 | 0.948 | 0.887 | 0.879 | 0.645 | 0.626 | |
| SE | 0.959 | 0.939 | 0.938 | 0.893 | 0.948 | 0.959 | 0.910 | 0.785 | |
| CRS | Median (50%) | 0.755 | 0.696 | 0.695 | 0.747 | 0.690 | 0.697 | 0.542 | 0.500 |
| VRS | 0.816 | 0.774 | 0.759 | 0.818 | 0.744 | 0.755 | 0.594 | 0.641 | |
| SE | 0.918 | 0.896 | 0.909 | 0.908 | 0.919 | 0.916 | 0.925 | 0.776 | |
| CRS | High (90%) | 0.705 | 0.659 | 0.656 | 0.714 | 0.690 | 0.644 | 0.504 | 0.490 |
| VRS | 0.782 | 0.745 | 0.735 | 0.787 | 0.744 | 0.715 | 0.548 | 0.628 | |
| SE | 0.901 | 0.885 | 0.888 | 0.904 | 0.919 | 0.903 | 0.936 | 0.774 | |
| Panel C: Disclosure | |||||||||
| CRS | A (Top 25%) | 0.694 | 0.429 | 0.866 | 0.567 | 0.622 | 0.703 | 0.671 | 0.485 |
| VRS | 0.750 | 0.631 | 1.000 | 0.706 | 0.663 | 0.792 | 0.720 | 0.614 | |
| SE | 0.917 | 0.711 | 0.866 | 0.816 | 0.918 | 0.883 | 0.950 | 0.790 | |
| CRS | B (25–50%) | 0.699 | 0.592 | 0.615 | 0.674 | 0.613 | 0.652 | 0.533 | 0.525 |
| VRS | 0.787 | 0.686 | 0.718 | 0.753 | 0.676 | 0.693 | 0.559 | 0.636 | |
| SE | 0.891 | 0.864 | 0.846 | 0.886 | 0.893 | 0.934 | 0.966 | 0.818 | |
| CRS | C (50–75%) | 0.699 | 0.644 | 0.651 | 0.708 | 0.649 | 0.630 | 0.519 | 0.482 |
| VRS | 0.787 | 0.733 | 0.729 | 0.784 | 0.714 | 0.691 | 0.551 | 0.595 | |
| SE | 0.891 | 0.882 | 0.888 | 0.899 | 0.904 | 0.910 | 0.955 | 0.792 | |
| CRS | D (Low 25%) | 0.735 | 0.710 | 0.899 | 0.729 | 0.677 | 0.659 | 0.405 | 0.497 |
| VRS | 0.777 | 0.769 | 0.899 | 0.791 | 0.774 | 0.784 | 0.487 | 0.747 | |
| SE | 0.946 | 0.925 | 0.899 | 0.926 | 0.879 | 0.855 | 0.870 | 0.675 | |
References
- Qiao, L.; Fei, J. Government subsidies, enterprise operating efficiency, and “stiff but deathless” zombie firms. Econ. Model. 2022, 107, 105728. [Google Scholar] [CrossRef]
- Lee, E.; Walker, M.; Zeng, C. Do Chinese government subsidies affect firm value? Account. Organ. Soc. 2014, 39, 149–169. [Google Scholar] [CrossRef]
- Jaspersen, J.G.; Richter, A. The wealth effects of premium subsidies on moral hazard in insurance markets. Eur. Econ. Rev. 2015, 77, 139–153. [Google Scholar] [CrossRef]
- Tao, Q.; Sun, Y.; Zhu, Y.; Yang, X. Political connections and government subsidies: Evidence from financially distressed firms in China. Emerg. Mark. Financ. Trade 2017, 53, 1854–1868. [Google Scholar] [CrossRef]
- Ambec, S.; Lanoie, P. Does it pay to be green? A systematic overview. Acad. Manag. Perspect. 2008, 22, 45–62. Available online: https://www.jstor.org/stable/27747478 (accessed on 25 May 2023).
- Albuquerque, R.; Koskinen, Y.; Zhang, C. Corporate social responsibility and firm risk: Theory and empirical evidence. Manag. Sci. 2019, 65, 4451–4469. [Google Scholar] [CrossRef]
- Petitjean, M. Eco-friendly policies and financial performance: Was the financial crisis a game changer for large US companies? Energy Econ. 2019, 80, 502–511. [Google Scholar] [CrossRef]
- Li, J.; Wu, D. Do corporate social responsibility engagements lead to real environmental, social, and governance impact? Manag. Sci. 2020, 66, 2564–2588. [Google Scholar] [CrossRef]
- Buchanan, B.; Cao, C.X.; Chen, C. Corporate social responsibility, firm value, and influential institutional ownership. J. Corp. Financ. 2018, 52, 73–95. [Google Scholar] [CrossRef]
- Bird, R.; Hall, A.D.; Momentè, F.; Reggiani, F. What corporate social responsibility activities are valued by the market? J. Bus. Ethics 2007, 76, 189–206. [Google Scholar]
- Jo, H.; Harjoto, M.A. Corporate governance and firm value: The impact of corporate social responsibility. J. Bus. Ethics 2011, 103, 351–383. [Google Scholar] [CrossRef]
- Flammer, C. Does corporate social responsibility lead to superior financial performance? A regression discontinuity approach. Manag. Sci. 2015, 61, 2549–2568. [Google Scholar] [CrossRef]
- Liu, G.; Guo, L. How does mandatory environmental regulation affect corporate environmental information disclosure quality. Financ. Res. Lett. 2023, 54, 103702. [Google Scholar] [CrossRef]
- Chen, K.C.; Chen, Z.; Wei, K.J. Legal protection of investors, corporate governance, and the cost of equity capital. J. Corp. Financ. 2009, 15, 273–289. [Google Scholar] [CrossRef]
- Verrecchia, R.E. Essays on disclosure. J. Account. Econ. 2001, 32, 97–180. [Google Scholar] [CrossRef]
- Alsaifi, K.; Elnahass, M.; Salama, A. Market responses to firms’ voluntary carbon disclosure: Empirical evidence from the United Kingdom. J. Clean. Prod. 2020, 262, 121377. [Google Scholar] [CrossRef]
- Schantl, S.F.; Wagenhofer, A. Optimal internal control regulation: Standards, penalties, and leniency in enforcement. J. Account. Public Policy 2021, 40, 106803. [Google Scholar] [CrossRef]
- Botosan, C.A. Disclosure level and the cost of equity capital. Account. Rev. 1997, 72, 323–349. Available online: https://www.jstor.org/stable/248475 (accessed on 25 May 2023).
- Lee, J.; Kim, S.; Kim, E. Voluntary disclosure of carbon emissions and sustainable existence of firms: With a focus on human resources of internal control system. Sustainability 2021, 13, 9955. [Google Scholar] [CrossRef]
- Charnes, A.; Cooper, W.W.; Rhodes, E. Measuring the efficiency of decision making units. Eur. J. Oper. Res. 1978, 2, 429–444. [Google Scholar] [CrossRef]
- Lovell, C.K.; Pastor, J.T. Radial DEA models without inputs or without outputs. Eur. J. Oper. Res. 1999, 118, 46–51. [Google Scholar] [CrossRef]
- Zhu, J. Data Envelopment Analysis a Handbook of Models and Methods; Springer: Berlin/Heidelberg, Germany, 2015. [Google Scholar]
- Cherchye, L.; De Rock, B.; Dierynck, B.; Kerstens, P.J.; Roodhooft, F. A DEA-based approach to customer value analysis. Eur. J. Oper. Res. 2023, 308, 1319–1331. [Google Scholar] [CrossRef]
- Liu, W.B.; Zhang, D.Q.; Meng, W.; Li, X.X.; Xu, F. A study of DEA models without explicit inputs. Omega 2011, 39, 472–480. [Google Scholar] [CrossRef]
- Lahouel, B.B.; Zaied, Y.B.; Song, Y.; Yang, G.L. Corporate social performance and financial performance relationship: A data envelopment analysis approach without explicit input. Financ. Res. Lett. 2021, 39, 101656. [Google Scholar] [CrossRef]
- Wang, W.K.; Lu, W.M.; Kweh, Q.L.; Lai, H.W. Does corporate social responsibility influence the corporate performance of the US telecommunications industry? Telecommun. Policy 2014, 38, 580–591. [Google Scholar] [CrossRef]
- Schwartz, G.; Clements, B. Government subsidies. J. Econ. Surv. 1999, 13, 119–148. [Google Scholar] [CrossRef]
- Liu, G.; Zhang, X.; Zhang, W.; Wang, D. The impact of government subsidies on the capacity utilization of zombie firms. Econ. Model. 2019, 83, 51–64. [Google Scholar] [CrossRef]
- Tan, Y.Y.; Huang, Y.L.; Liu, S.X. Two-stage mathematical programming approach for steelmaking process scheduling under variable electricity price. J. Iron Steel Res. Int. 2013, 20, 1–8. [Google Scholar] [CrossRef]
- Sun, X.; Liu, X.; Wang, Y.; Yuan, F. The effects of public subsidies on emerging industry: An agent-based model of the electric vehicle industry. Technol. Forecast. Soc. Change 2019, 140, 281–295. [Google Scholar] [CrossRef]
- Hardaker, J.B.; Lien, G.; Anderson, J.R.; Huirne, R.B. Coping with Risk in Agriculture: Applied Decision Analysis; CABI: Wallingford, UK, 2015. [Google Scholar]
- Zhang, D. Subsidy expiration and greenwashing decision: Is there a role of bankruptcy risk? Energy Econ. 2023, 118, 106530. [Google Scholar] [CrossRef]
- Pérez-Méndez, J.A.; Pérez-Urdiales, M.; Roibas, D. Evaluating the effect of subsidies for rural development on agri-food and forestry firms: Technical progress and efficiency. Appl. Econ. Anal. 2019, 27, 150–167. [Google Scholar] [CrossRef]
- Kumbhakar, S.C.; Li, M.; Lien, G. Do subsidies matter in productivity and profitability changes? Econ. Model. 2023, 106264. [Google Scholar] [CrossRef]
- Xu, R.; Shen, Y.; Liu, M.; Li, L.; Xia, X.; Luo, K. Can government subsidies improve innovation performance? Evidence from Chinese listed companies. Econ. Model. 2023, 120, 106151. [Google Scholar] [CrossRef]
- Yan, Z.; Li, Y. Signaling through government subsidy: Certification or endorsement. Finance Res. Lett. 2018, 25, 90–95. [Google Scholar] [CrossRef]
- Dhaliwal, D.S.; Li, O.Z.; Tsang, A.; Yang, Y.G. Voluntary nonfinancial disclosure and the cost of equity capital: The initiation of corporate social responsibility reporting. Account. Rev. 2011, 86, 59–100. [Google Scholar] [CrossRef]
- Zhang, D. Green financial system regulation shock and greenwashing behaviors: Evidence from Chinese firms. Energy Econ. 2022, 111, 106064. [Google Scholar] [CrossRef]
- Farrell, M.J. The measurement of productive efficiency. J. R. Stat. Soc. Ser. A 1957, 120, 253–281. [Google Scholar] [CrossRef]
- Banker, R.D.; Charnes, A.; Cooper, W.W. Some models for estimating technical and scale inefficiencies in data envelopment analysis. Manag. Sci. 1984, 30, 1078–1092. [Google Scholar]
- Emrouznejad, A.; Yang, G.L. A survey and analysis of the first 40 years of scholarly literature in DEA: 1978–2016. Socio-Econ. Plan. Sci. 2018, 61, 4–8. [Google Scholar] [CrossRef]
- Pastor, J.T.; Ruiz, J.L.; Sirvent, I. An enhanced DEA Russell graph efficiency measure. Eur. J. Oper. Res. 1999, 115, 596–607. [Google Scholar] [CrossRef]
- Fama, E.F.; French, K.R. The cross-section of expected stock returns. J. Financ. 1992, 47, 427–465. [Google Scholar] [CrossRef]
- Caballero, R.J.; Hoshi, T.; Kashyap, A.K. Zombie lending and depressed restructuring in Japan. Am. Econ. Rev. 2008, 98, 1943–1977. [Google Scholar] [CrossRef]
- Ahlin, C.; Bose, P. Bribery, inefficiency, and bureaucratic delay. J. Dev. Econ. 2007, 84, 465–486. [Google Scholar] [CrossRef]
- Watts, R.L.; Zimmerman, J.L. Towards a Positive Theory of the Determination of Accounting Standards. Account. Rev. 1978, 53, 112–134. [Google Scholar]
- Freeman, R.E. Strategic Management: A Stakeholder Approach; Pitman: Boston, MA, USA, 1984. [Google Scholar]
- Hu, J.; Jiang, H.; Holmes, M. Government subsidies and corporate investment efficiency: Evidence from China. Emerg. Mark. Rev. 2019, 41, 100658. [Google Scholar] [CrossRef]
- Xue, S.; Chang, Q.; Xu, J. The effect of voluntary and mandatory corporate social responsibility disclosure on firm profitability: Evidence from China. Pac. Basin Financ. J. 2023, 77, 101919. [Google Scholar] [CrossRef]


Disclaimer/Publisher’s Note: The statements, opinions and data contained in all publications are solely those of the individual author(s) and contributor(s) and not of MDPI and/or the editor(s). MDPI and/or the editor(s) disclaim responsibility for any injury to people or property resulting from any ideas, methods, instructions or products referred to in the content. |
© 2023 by the authors. Licensee MDPI, Basel, Switzerland. This article is an open access article distributed under the terms and conditions of the Creative Commons Attribution (CC BY) license (https://creativecommons.org/licenses/by/4.0/).