Article

Application of Hydrogen-Based Denitrification: Simultaneous Removal of Nitrate and Reactive Black 5 Dye from Textile Wastewater Containing Organic Matter

1
Graduate School of Engineering, The University of Tokyo, 7-3-1 Hongo, Bunkyo, Tokyo 113-8656, Japan
2
School of Interdisciplinary Studies, Mahidol University Kanchanaburi Campus, No. 199, Moo 9, Lumsum Sub-District, Saiyok District, Kanchanaburi 71150, Thailand
3
Integrated Graduate School of Medicine, Engineering and Agricultural Sciences, University of Yamanashi, 4-4-37 Takeda, Kofu 400-8510, Yamanashi, Japan
4
Interdisciplinary Research Centre for River Basin Environment, University of Yamanashi, 4-4-37 Takeda, Kofu 400-8510, Yamanashi, Japan
*
Author to whom correspondence should be addressed.
Sustainability 2023, 15(13), 10324; https://doi.org/10.3390/su151310324
Submission received: 28 May 2023 / Revised: 21 June 2023 / Accepted: 28 June 2023 / Published: 29 June 2023

Abstract

:
In this study, a hydrogen-based denitrification (HD) reactor was used to investigate the simultaneous treatment of nitrogen and decolorization in textile wastewater contaminated with organic matter. The reactor operated in two phases: without and with organic matter. Despite the short hydraulic retention time, the HD system successfully removed all pollutants, including nitrate, nitrite, reactive black-5 dye and chemical oxygen demand. The unhindered treatment efficiency for nitrogen and decolorization in the presence of organic pollutants was observed. With the addition of organic matter, the nitrogen removal efficiency increased slightly from 85% to 90–100%, and the decolorization rate doubled from 25% to 50–60%. Organic matter played a crucial role in stimulating heterotrophic bacteria during biological denitrification and acted as a carbon source facilitating biological denitrification and azo bond cleavage during dye degradation. Despite the generation of toxic byproducts and changes in the dominant microbial community, the treatment efficiency remained stable and improved. This approach offers a promising solution for enhancing treatment efficiency in textile wastewater, providing a cost-effective and environmentally friendly option for developing countries to treat wastewater before discharge.

Graphical Abstract

1. Introduction

Textile wastewater (TW) constitutes a significant source of wastewater, posing severe environmental and health risks. This type of wastewater is typically generated in large quantities and contains highly toxic pollutants. Previous studies have estimated that approximately 1000–3000 m3 of TW, weighing between 12 and 20 tons daily, is discharged into natural sources after textile processing [1]. However, the characteristics of TW vary depending on factors such as the type of fabric (e.g., cotton, linen, wool, synthetic) and the color used to enhance fabric qualities [2]. Furthermore, various pollutants are released at different stages of textile processing, including sizing, scouring, bleaching, mercerizing, dyeing, printing and finishing [3]. Traditional wastewater treatment processes fail to eliminate nearly 30 toxic compounds found in dyes and chemicals, leading to the accumulation of harmful substances in TW and their subsequent discharge into the environment [4].
The primary pollutants commonly detected in effluent from the textile industry include suspended solids (SS), nitrate (NO3-N) and nitrite (NO2-N) as forms of nitrogen, organic pollutants represented by chemical oxygen demand (COD) and biochemical oxygen demand (BOD), dye color and other soluble substances, as indicated in Table 1 [2,5]. Generally, biological, chemical and physical treatment methods have been employed as standard practices to enhance TW quality [6]. As demonstrated in Table 1, it is evident that the influent of textile wastewater exhibits significantly high concentrations, and despite undergoing treatment processes, its quality remains poor. This observation highlights the need for alternative treatment processes to effectively address textile wastewater, ensuring proper treatment and compliance with discharge limits. However, the combination of anaerobic and aerobic conditions in biological treatment has been frequently utilized due to its cost-effectiveness, simplicity and efficacy in dye removal. Nevertheless, conventional biological processes are unable to fully degrade certain nitrogen forms, such as NO3-N, NO2-N and toxic dye molecules [7]. For instance, reports indicate that effluent TW can contain approximately 40–100 g-NO3-N/L discharged from sodium nitrate (NaNO3) used to enhance textile fibers in dyeing baths, with around 50% of the influent dye often contaminating the discharged wastewater [8]. Consequently, tertiary treatment processes such as adsorption, membrane filtration, ozonation, photocatalytic degradation and electrochemical processes are required after biological treatment, albeit at high costs [7,9,10,11,12,13].
Conversely, Singhopon et al. [13,14] discovered that a simple and cost-effective system known as the hydrogen-based denitrification (HD) system can simultaneously remove NO3-N, NO2-N and certain dyes. HD, or hydrogenotrophic denitrification, is an autotrophic denitrification method that utilizes H2 gas as an electron donor and NO3-N and NO2-N as electron acceptors, and HCO3 or CO2 serves as an inorganic carbon source [7]. The process offers several advantages, such as a low hydrogen cost, minimal biomass accumulation, the generation of clean and non-toxic waste, the elimination of the requirement for a carbon source, a high nitrogen removal rate compared to that of heterotrophic denitrification as well as easy installation and maintenance [15]. A reliable reason for the claim can be found in the study conducted by Singhopon et al. [13,14]. Their research demonstrated that a hydrogen-based denitrification (HD) system, which is a simple and cost-effective approach, has the ability to simultaneously remove NO3-N, NO2-N and certain dyes.
The HD system, also known as hydrogenotrophic denitrification, operates by utilizing H2 gas as an electron donor and NO3-N and NO2-N as electron acceptors. In this process, HCO3 or CO2 acts as an inorganic carbon source [7]. This denitrification method offers several advantages, one of which is the low cost associated with hydrogen usage. By utilizing hydrogen gas, the HD system provides an economically feasible option for denitrification and simultaneous dye removal. The HD system has been widely employed for NO3-N and NO2-N reduction in drinking water treatment, particularly in developing countries [16,17,18]. Various HD systems, such as suspended growth, fixed-bed and sequencing batch reactor (SBR)-membrane bioreactors, have been developed, exhibiting high nitrogen removal rates [7,19,20]. However, some studies have also applied this system to reduce nitrogen in domestic wastewater. For example, Li et al. [21] established an HD system using a membrane diffusion packed-bed bioreactor for tertiary nitrogen removal from municipal wastewater, demonstrating relatively high nitrogen removal efficiency (NRE). Similarly, Visvanathan et al. [22] observed a high nitrogen removal rate when combining the HD system with a membrane bioreactor for NO3-N removal in synthetic aquaculture wastewater intended for recirculation purposes. Additionally, their results confirmed that certain organic pollutants, such as low COD concentrations, experience a decrease of 70–90% without affecting the nitrogen removal rate in a simple HD reactor [23]. Nevertheless, the HD system is not commonly employed in industrial wastewater treatment due to the presence of various pollutants and toxic chemicals.
Hence, the present study aimed to evaluate the treatment performance of nitrogen and decolorization in synthetic TW by adapting the HD system based on previous research conducted by Singhopon et al. [13,14]. The study objectives involved investigating the nitrogen removal efficiency (NRE) and decolorization efficiency (DRE) of synthetic textile wastewater by introducing organic matter (OM) at different COD concentrations, a factor that has not been extensively explored. An HD reactor was operated over a period of approximately 80 days, with and without organic matter contamination, to assess the treatment process and identify potential methods for enhancing the system’s efficiency.
Table 1. Summary of textile wastewater characteristics, for which the standards of industrial wastewater prior to discharge of different countries are compared.
ParametersIndustrial Wastewater Discharge StandardsInfluentEffluent
Reference[13][24][24][13][1][13][2]
pH5.5–96–95.5–97.06–107.777.7–8.0
BOD (mg/L)<606030800–1200100–40001050272–310
COD (mg/L)≤4002002506000–8000150–10,0003056678–932
TN (mg/L)≤100--100–700-154-
TSS (mg/L)≤1501501001500–3000100–5000975120–180
TDS (mg/L)≤3000-210087251800–60004000–90001632–1902
Cr3+ (mg/L)≤0.5-100--13-
Color (ADMI)-800–1200----
Color (mg/L)---40–500---
Color (Pt-Co)-80--50–2500-240–290

2. Materials and Methods

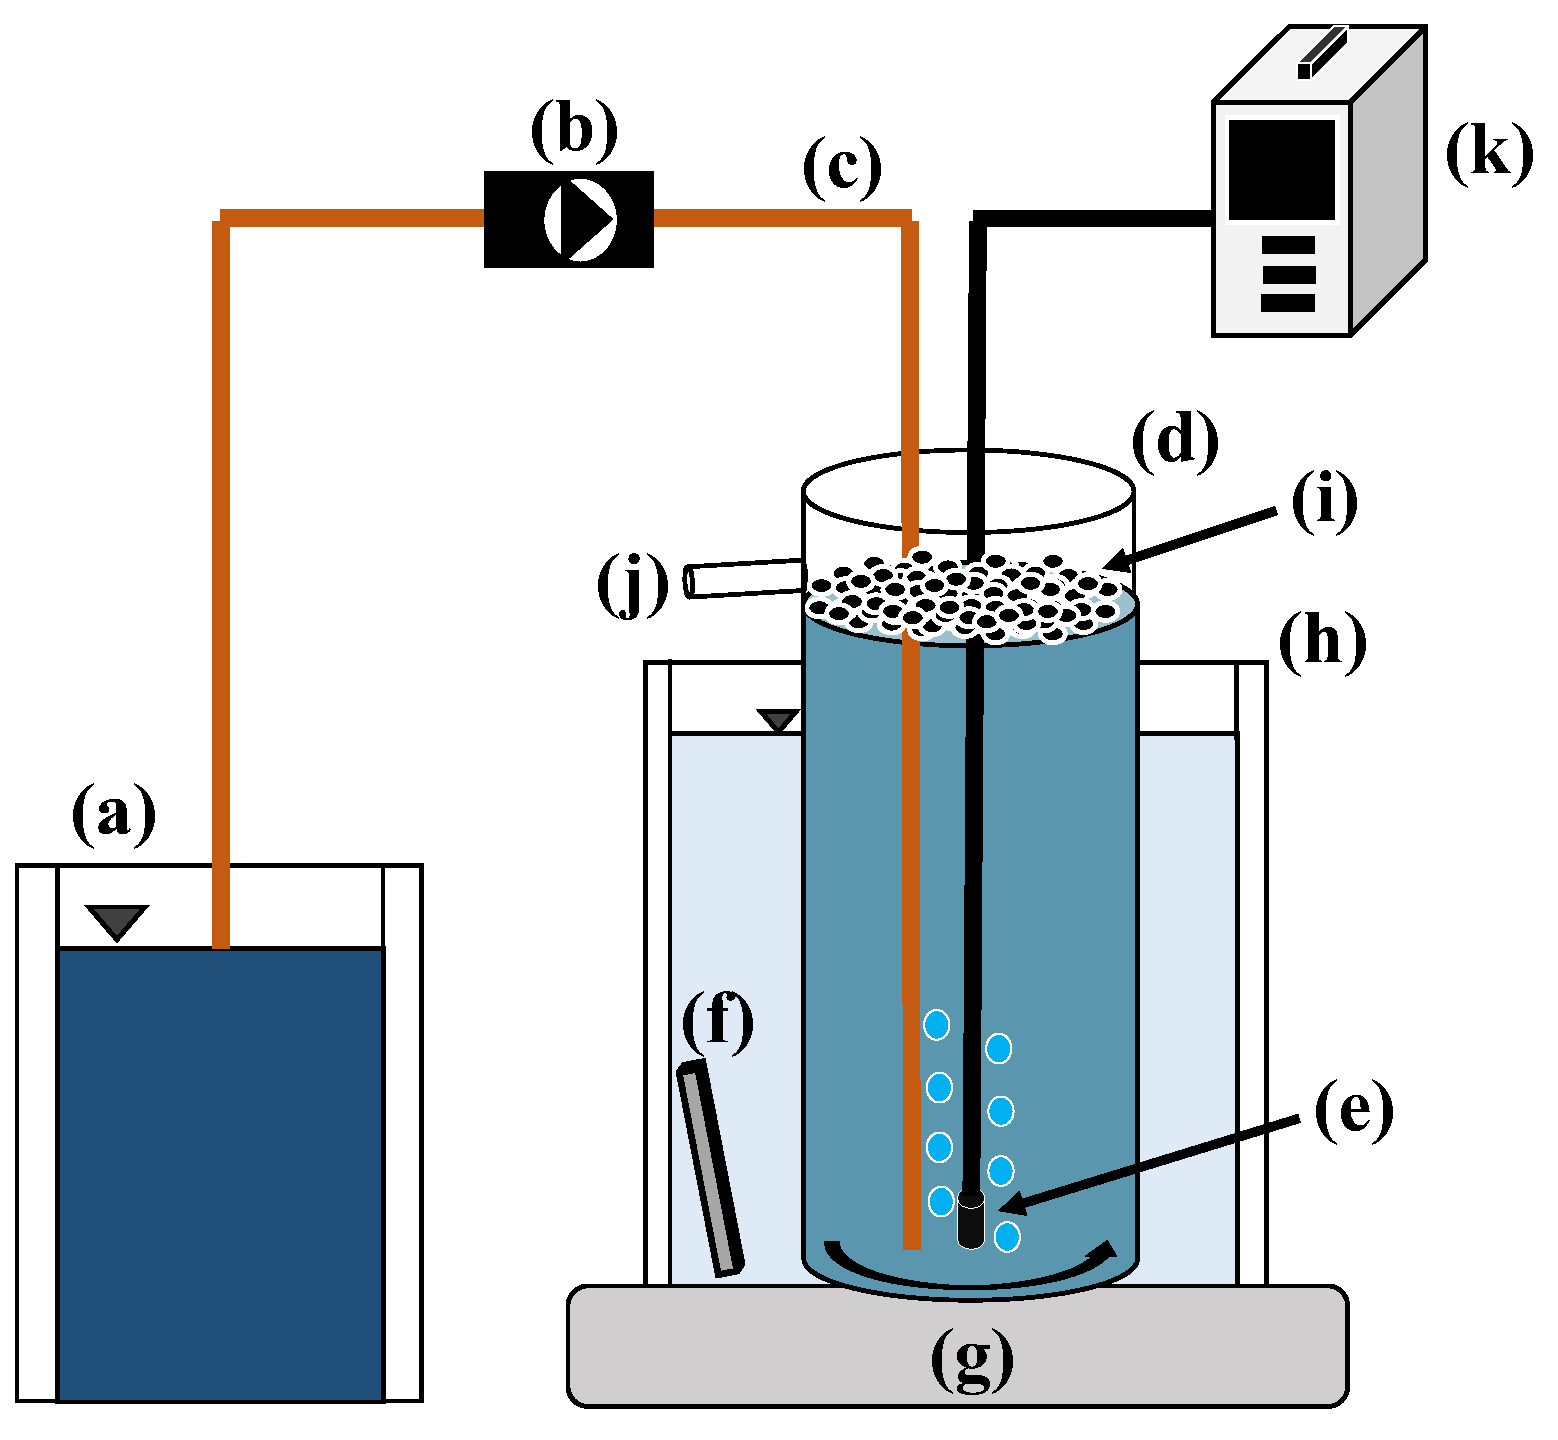
2.1. Experimental Setup

The HD reactor, with a working volume of 2 L, was constructed using a cylindrical plastic beaker measuring 14 cm in diameter and 15 cm in height. Initially, the reactor was inoculated with enhanced HD sludge that had been operating for over 400 days. The enriched sludge was added at a rate of 0.3 gVSS/L. This particular sludge exhibited a high nitrogen removal rate of approximately 85–95% under specific operating conditions, including a hydraulic retention time (HRT) of 8 h, influent feeding rate of 8.7 mL/min, H2 supply of 30 mL/min and a nitrogen loading rate (NLR) of 313 gN/m3/day. The reactor was operated continuously in accordance with the procedures outlined in a previous study [13,14].
To assess the treatment efficiency of nitrogen and decolorization, the reactor was prepared on day 0 of the experiment by introducing organic pollutants. It was placed inside a water bath to maintain a temperature range of 30–35 °C, and a magnetic stirrer was utilized to facilitate thorough mixing of the liquid and sludge. Furthermore, plastic beads were employed to cover the top of the reactor, ensuring the maintenance of anaerobic–anoxic conditions. The reactor was connected to an influent synthetic feeding tank and a gas feeding line. A schematic diagram illustrating the experimental setup is presented in Figure 1.

2.2. Synthetic Textile Wastewater Preparation

The synthetic TW used in this study was prepared based on the quality of wastewater in Thailand, as described in a previous study [13,25]. The TW was synthesized by combining tap water with specific chemical reagents, and the details of this composition can be found in Table 2. The initial concentration of NO3-N remained consistent within the range of 80–85 mg-N/L. Regarding the color model utilized in this research, reactive black 5 (RB-5) dye, sourced from Fujifilm Wako Pure Chemical Corporation, Co., Ltd. (Sigma-Aldrich, Burlington, MA, USA), was employed. This dye exhibits a disazo-vinylsulfnyl structure (C26H21N5Na4O19S6), with a molecular weight of 991.82 g/mol and a maximum identifiable wavelength (λmax) of 597 nm [26]. The initial concentration of RB-5 in this study was fixed at 30–40 mg/L. Additionally, sodium acetate (CH3COONa) was introduced as an organic carbon source, contributing to the concentration of COD.

2.3. Investigation of Nitrogen Removal and Decolorization Efficiencies

The experiment was conducted in two phases: one with OM contamination and the other without, as outlined in Table 3. During RUN 1 (days 0–20), the HD reactor was operated with initial influent concentrations of 80 mg NO3-N/L and 30 mg/L of RB-5 dye. Subsequently, in RUN 2–4, various concentrations of COD as OM were introduced to the reactor from days 21 to 80. This was carried out to investigate the impact of OM on the treatment performance of the HD system in terms of nitrogen removal efficiency (NRE) and dye removal efficiency (DRE). Specifically, the initial COD concentrations were set at 5000 mg/L for RUN 2, 3000 mg/L for RUN 3 and 1500 mg/L for RUN 4. However, the influent concentrations of NO3-N and RB-5 dye remained the same across all runs. Gas supply feeding was conducted following the methods described in a prior study [13]. The gas pipeline was fixed and consistently supplied with H2 gas at a rate of 50 mL/min. The H2 gas was generated using an H2 generator (HG-260, GL Sciences) and then delivered through an air stone diffuser. Throughout the experiment, the HD reactor was tested with an HRT of 12 h under continuous feeding conditions.

2.4. Water Sample Analyses

Prior to sampling, the measurements of dissolved oxygen (DO), pH, dissolved hydrogen (DH) and temperature were carried out within the reactors using specific instruments. The probe (YSI 58 Dissolved Oxygen Meter, Xylem Inc., Washington, DC, USA), pH meter (Horiba-B712, HORIBA Advanced Techno, Co., Ltd., Kyoto, Japan), DH meter (ENH-2000, TRUSTLEX Inc., Osaka, Japan) and digital thermometer (WT-6, Jinan Retekool Inc., Jinan, China) were utilized for this purpose. Subsequently, influent and effluent samples were subjected to centrifugation at 10,000 rpm for 5 min, and the resulting supernatant was analyzed for concentrations of NO3-N, NO2-N, RB-5 and COD. These samples were then stored at a temperature of −18 °C to facilitate further analysis. All parameter determinations were carried out in accordance with standard methods for water and wastewater analysis [27]. Specifically, the concentrations of NO3-N, NO2-N and RB-5 were analyzed using a spectrophotometer (UV-1800 Shimadzu-Spectrophotometer, Shimadzu Corp., Kyoto, Japan) employing the colorimetric method. The RB-5 concentration was determined using a standard curve generated by plotting known concentrations of RB-5 against their corresponding absorbance values at a maximum wavelength (λmax) of 597 nm [28]. Additionally, the COD concentration was determined using the closed reflux method.

2.5. Bacterial Community Analysis

The sludge samples collected at various stages of the experiment, including the initial sludge at the beginning and the end of each phase (on days 20, 40, 60 and 80 from RUN 1 to 4), were utilized for bacterial community analysis. Total DNA extraction was performed using a FastDNA® SPIN Kit for soil analysis (MP Biomedicals LLC, Santa Ana, CA, USA), following previously described methods [14] by utilizing the collected sludge samples of approximate wet weight of 0.12–0.13 g. The concentration of DNA was determined using a QuantusTM Fluorometer (Promega Corp., Madison, WI, USA) through nanodrop analysis. Subsequently, the DNA samples were sent to a commercial service for Next-Generation Sequencing (FASMAC Co., Ltd., Kanagawa, Japan). Sequencing targeted the V4 region of the bacterial 16S rRNA gene, and amplification was carried out using Univ-515F (5-GTG YCA GCM GCC GCG GTA A-3) and Univ-806R (5-GGA CTA CNV GGG TWT CTA AT-3) primers. The MiSeq platform was employed for obtaining amplified metagenomic sequences. To classify the raw sequence data taxonomically, QIIME version 1.9.0 was utilized, resulting in the identification of operational taxonomic units that were subsequently clustered at 97% similarity. The relative abundances of these taxonomic units during different operational stages were visualized using a heatmap generated using R software version 4.0.2, along with the Heatplus (version 2.30.0) and Vegan (version 2.5.6) packages.

2.6. Calculations and Statistical Analyses

The values of NLR [gN/m3/day] and NRE [%] were calculated using Equations (1) and (2), and Equations (3) and (4) were employed to determine the DRE of RB-5 [%] and the COD removal efficiency (CRE) [%]. C0 and C1 represent the initial and final concentrations, respectively, of the specific parameters indicated in each variable (NO3 for NO3 and NO2 for NO2). Q represents the flow rate of the influent feeding, and V denotes the volume of the reactor. Furthermore, ABS0 and ABS1 correspond to the measured absorbances of the initial and treated water, respectively. To assess potential variations in decolorization under different operational conditions, a 95% confidence interval was obtained using an analysis of variance (ANOVA) and least significant difference (LSD) test conducted with SPSS statistical software version 25. These analyses aimed to identify significant differences in decolorization among the experimental conditions.
NLR = ( C 0 , NO 3 [ g N / L ] × Q [ L / day ] / V [ m 3 ]
NLR = ( C 0 , NO 3 [ mg N / L ] C 1 , NO 3 [ mg N / L ] C 1 , NO 2 [ mg N / L ] × 100 / C 0 , NO 3 [ mg N / L ]
DRE = (ABS0 − ABS1) × 100/ABS0
CRE = (C0,COD [mg/L] − C1,COD [mg/L]) × 100/C0,COD [mg/L]

3. Results and Discussion

3.1. HD Performance on Nitrogen Removal

In this study, the experiment was conducted and maintained over a long-term period with an HRT of 12 h. Figure 2 displays the effluent concentrations of NO3-N and NO2-N, along with the corresponding NRE, obtained from an HD reactor under two conditions: without the presence of OM (represented as COD concentrations) and with various dosages of OM. The findings revealed that, due to the short HRT, there was frequent accumulation of NO3 and NO2 in the effluent.
At the beginning of the experiment (RUN 1), in the absence of OM contamination, both parameters exhibited higher levels in the treated water, leading to an unstable NRE during this phase. In accordance with the experimental details, varying concentrations of OM ranging from 1500 to 5000 mg COD/L were subsequently introduced into the reactor for RUN 2–4. The results showed that, in RUN 2, with an initial COD concentration of 5000 mg/L, some NO3-N concentrations remained incomplete, ranging from 10 to 15 mg/L in the effluent. However, in RUN 3–4, where a lower initial COD concentration in the range of 1500–3000 mg/L was utilized, high ranges of NRE approached close to 100%, and the concentrations of effluent NO3 and NO2 were nearly zero after day 50. This improvement may be attributed to the gradual adaptation of the bacteria in the reactor to these activities when exposed to organic pollutants. The results indicate that bacteria were more effective in reducing NO3 and NO2 at low COD dosages [29]. Thus, a small amount of organic carbon sources might be suitable for denitrification in this reactor.
On the other hand, it is possible that some heterotrophic bacteria occurred and utilized the OM as carbon sources, resulting in improved NRE after the addition of organic matter in RUN 2–4. Previous studies have confirmed that heterotrophic denitrification can occur within HD systems when supplied with various organic carbon sources [30]. The average value of NRE under different operating conditions indicated that the NRE was close to 100% when organic matter was introduced to the reactor. In contrast, the average value of NRE without and with organic matter contamination only increased from 85% to 90–100%. Therefore, the results of this study indicate that no significant effect of OM on NRE was observed. This might be due to the dominance of autotrophic denitrifying bacteria in the HD system, which required no organic carbon for their respiration. Previous studies have suggested that bacteria involved in denitrification processes, such as heterotrophic denitrifiers, rely on organic carbon as an electron donor for respiration [22]. Hence, organic carbon plays a crucial role in supporting the activities of these bacteria in biological denitrification, thereby enhancing the treatment performance of the denitrification system. Moreover, several reports have reported different stoichiometric ratios for heterotrophic denitrification. Some suggest that 4 mg of COD as an organic carbon source is required to reduce 1 mg/L of NO3-N to N2, whereas others propose that 1 mg of NO3-N reduction necessitates 2.86 mg of COD, and 6 mg of COD oxidizes 1 mg of NO3-N [31]. Previous studies recommend designing conventional wastewater treatment systems with a COD/NO3-N ratio in the range of 5.3–11 or higher to optimize the denitrification process [32,33].
Therefore, this study confirmed that the presence of OM in the reactor had no inhibition on the denitrification process through the HD system; instead, it showed a slight improvement in NRE. The organic matter employed in this study served as an organic carbon source for the bacteria in the reactor, enhancing the respiration process and resulting in increased rates of NO3-N and NO2-N removal, ultimately leading to an elevated NRE. Similarly, previous findings indicate that the presence of OM has no effect on the removal of NO3-N and NO2-N due to the co-existence of denitrifiers [29]. However, varying COD concentrations had no significant impact on the treatment performance of the HD system in this study.

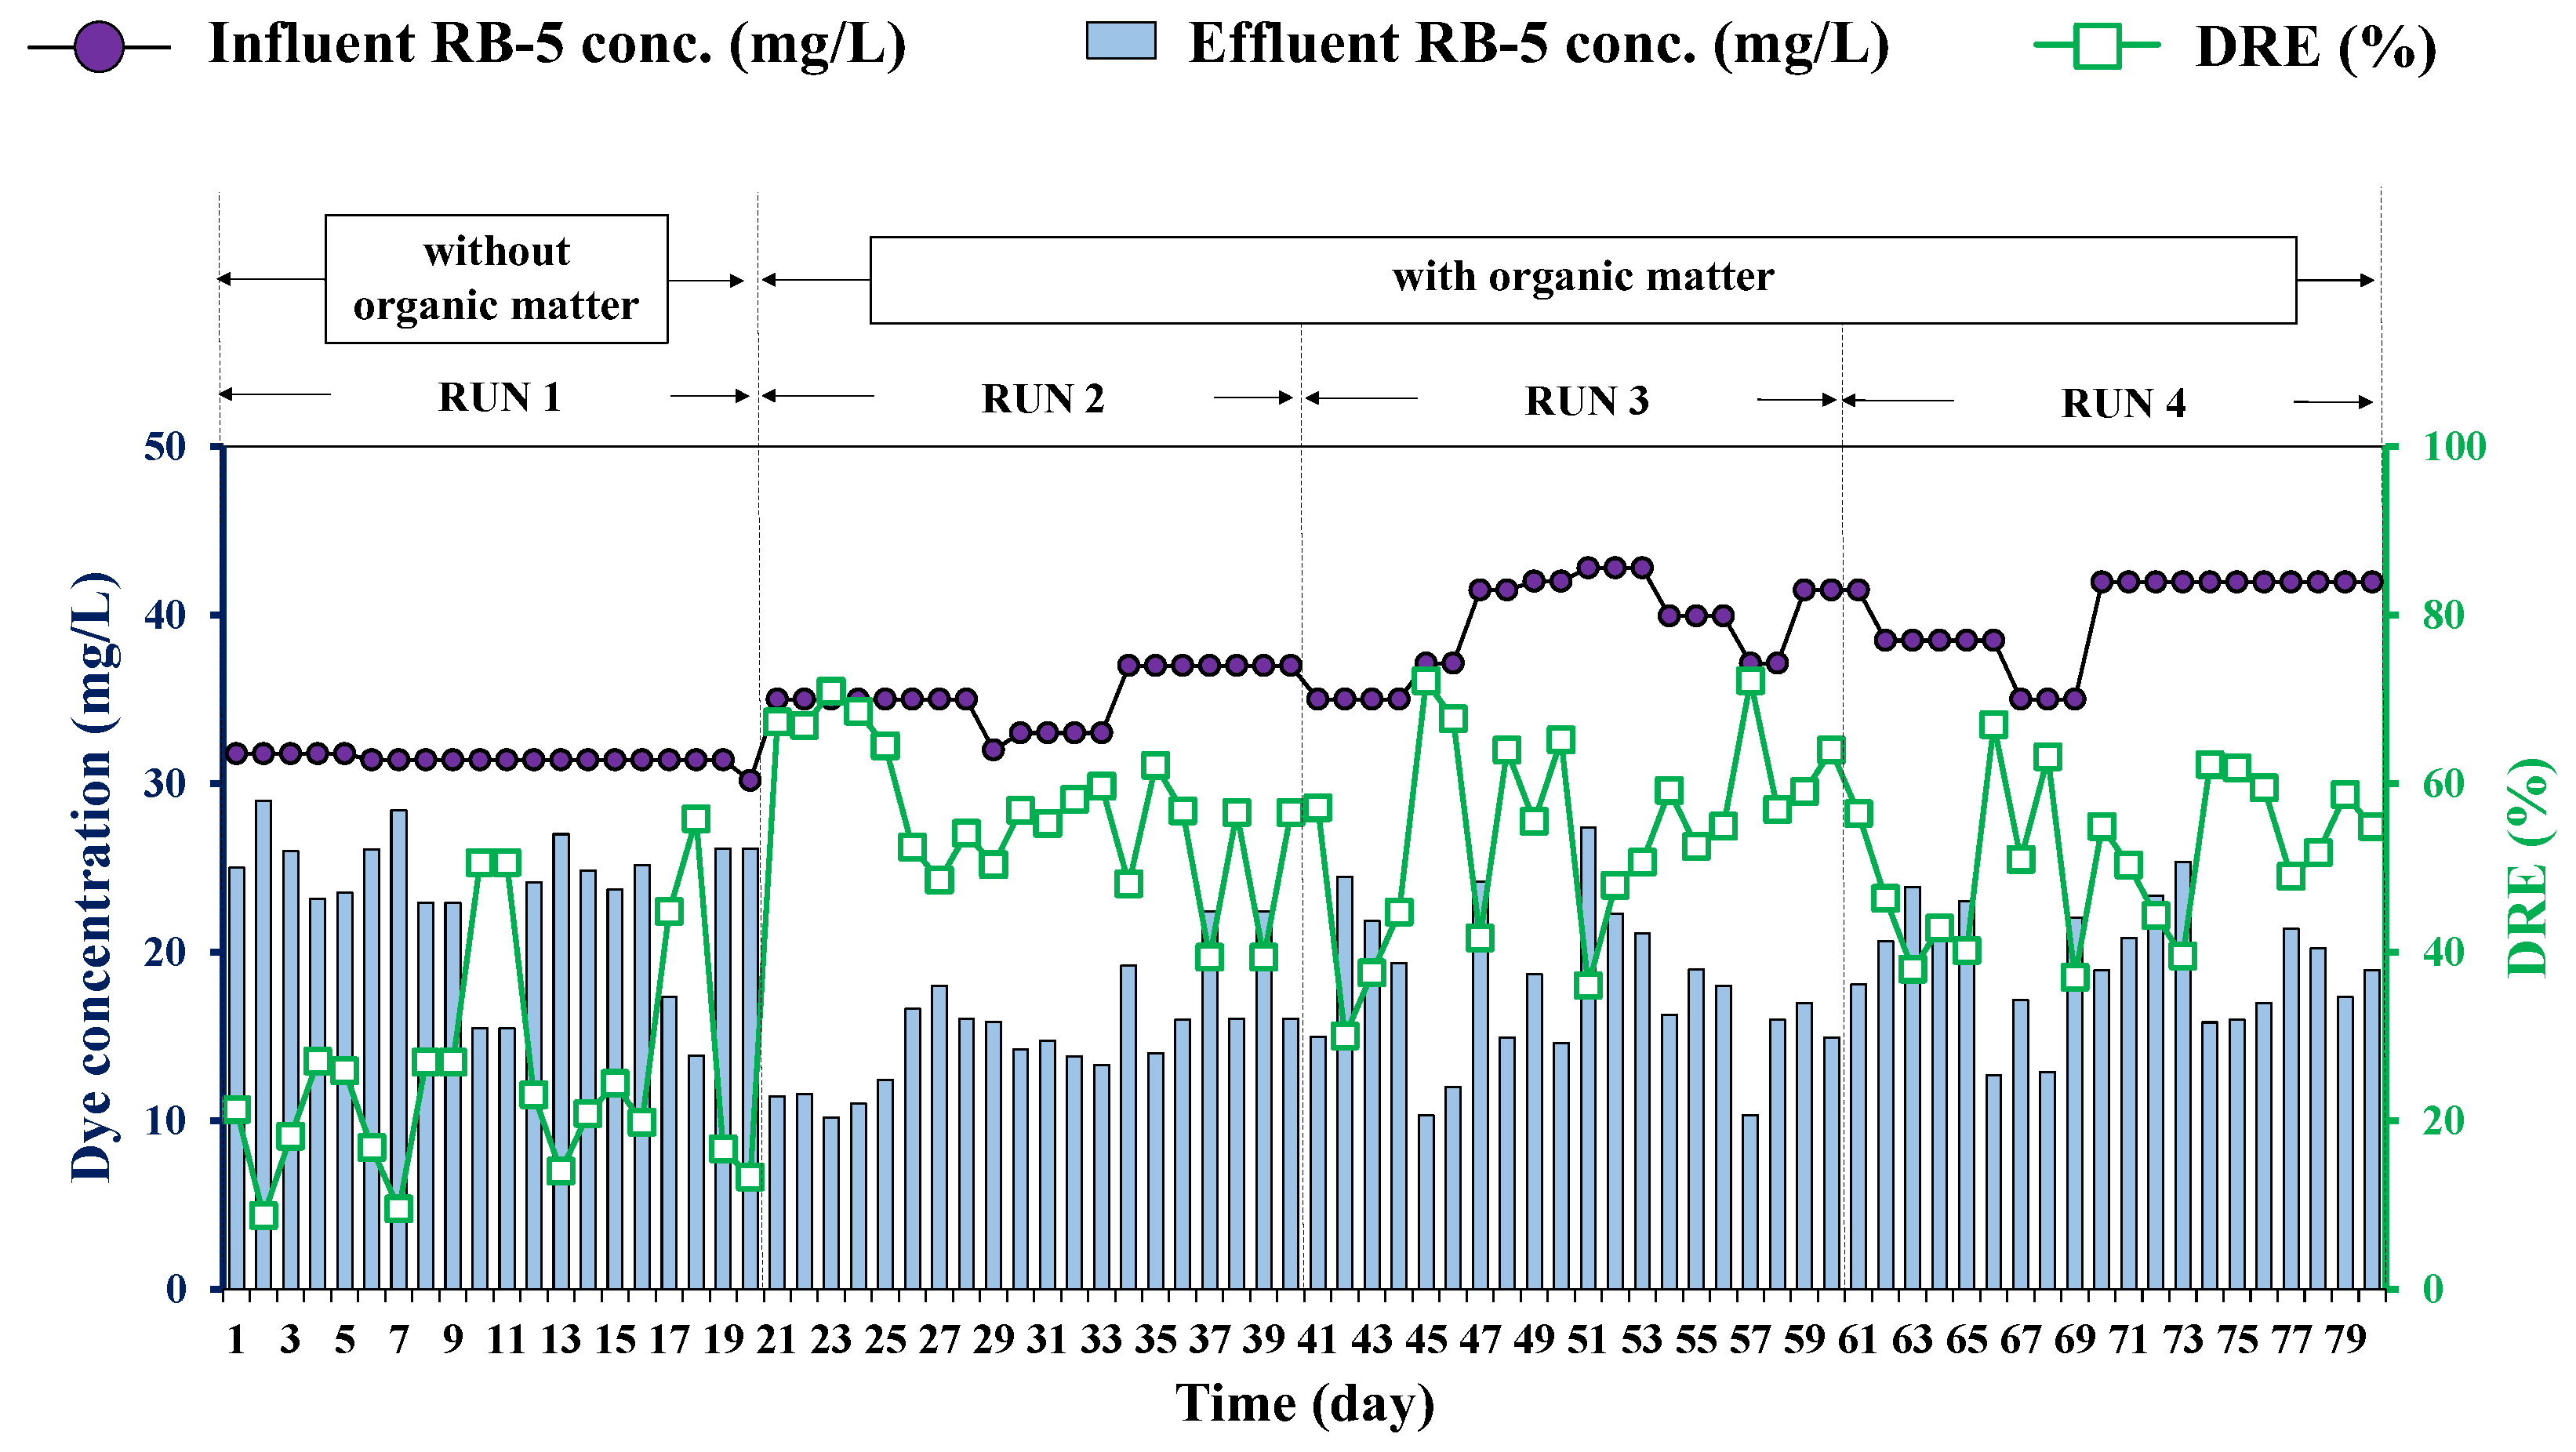
3.2. HD Performance on Decolorization of RB-5 Dye

Figure 3 illustrates the RB-5 dye concentrations and DRE from the HD reactor under different operating conditions (RUN 1–4). The results suggest that, due to the short operation time and lack of electron donors, the degradation of the dye in this study exhibited fluctuations and remained incomplete. Furthermore, NO3-N and NO2-N were more favorable electron acceptors than the dye, and they tended to compete faster for electron donors, such as H2 and organic carbons [34]. H2 gas and carbon sources had the advantage of acting as electron donors, facilitating the transformation of dye molecules into aromatic amines through anaerobic processes [35]. Therefore, biodegradation typically occurred after denitrification was completed.
The findings confirm that RB-5 can undergo reduction through the HD process alongside NO3-N and NO2-N in the presence of organic pollutants. However, significant amounts of RB-5 dye accumulated, primarily ranging from 10 to 30 mg/L in the effluent wastewater, compared to the initial dye concentration of 30–40 mg/L. In the absence of OM, the effluent dye concentrations remained high, and the average DRE value was relatively low, with a range of 25 ± 14%. Subsequently, the addition of OM in RUN 2–4 led to a doubling of the DRE ratio, reaching the range of 50–60 ± 18%. OM has been reported to be a major factor in the cleavage of azo bonds during the biodegradation process, serving as a carbon source for bacterial activities involved in dye degradation [25]. Carbon sources significantly influence energy availability and act as electron donors for the reduction required to break down azo bonds, resulting in dye removal. Some microorganisms in treatment systems cannot directly break down dye molecules; hence, carbon and nitrogen sources were introduced to facilitate co-metabolism and to enhance the rate of dye removal. The mechanism of dye degradation typically consists of two steps: the cleavage of the azo bond (-N=N-) by azo reductase in the presence of suitable electron donors, leading to the formation of amino groups (NH2) and colorless intermediates via anaerobic processes [36]. Subsequently, the amino groups and other intermediate molecules were degraded under aerobic conditions [37,38]. Therefore, organic matter played a crucial role in the breakdown of azo molecules, thereby enhancing DRE. Additionally, the results indicate that varying COD dosages had no significant impact on the decolorization rate in this study. However, previous studies suggest that higher COD dosages can improve the decolorization rate by providing sufficient electron donors, whereas low COD concentrations resulted in an insufficient supply of electron donors for the degradation process [39]. However, some studies have also indicated that higher concentrations of carbon or nitrogen sources have no pronounced effect on the decolorization rate because bacteria primarily act as co-metabolites alongside dye molecules [40]. Generally, the reductive cleavage of a single azo bond requires four electrons, equivalent to 32 mg/L of COD as the carbon source, to reduce 1 mmol of monozo dye [36,41].
In conclusion, this study demonstrates that RB-5 dye can be partially reduced alongside NO3-N and NO2-N in the presence of organic pollutants, but the process remains incomplete due to the dominance of the denitrification process. However, the addition of organic matter can improve the removal efficiency of RB-5. Higher amounts of organic carbon sources lead to increased DRE, whereas there is no significant effect of initial COD concentrations on the decolorization rate.

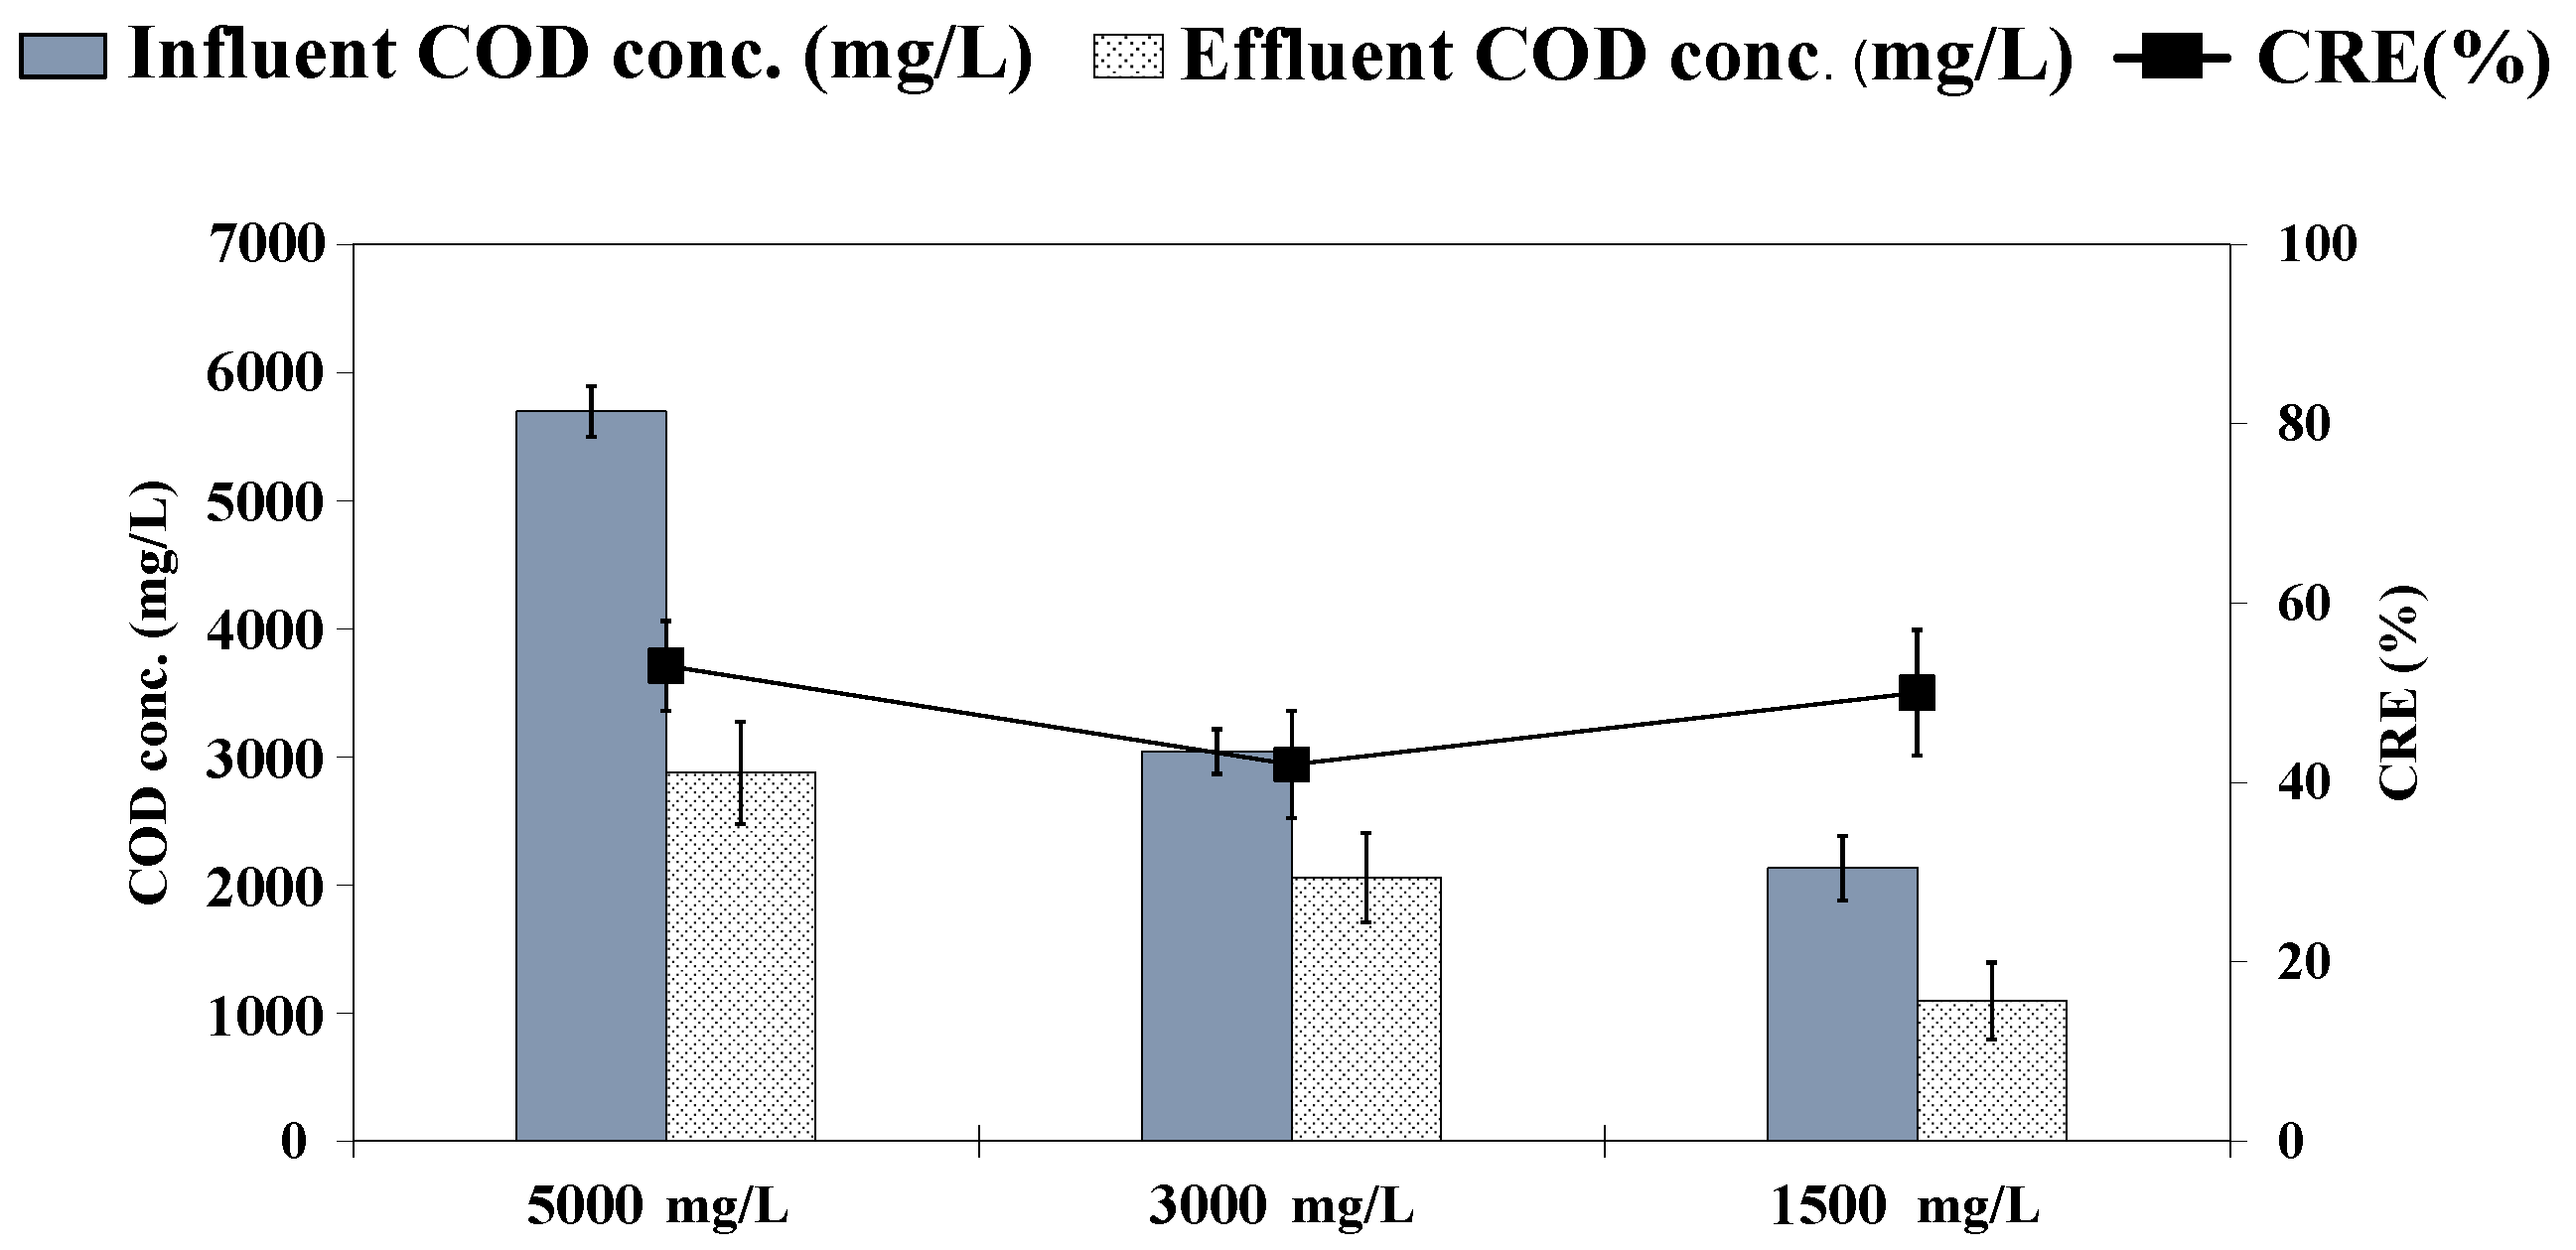
3.3. HD Performance on COD Removal

Effluent in the textile industry contains a variety of toxic pollutants resulting from different processes. One crucial parameter is the organic pollutant, which is typically quantified as the COD concentration and is often found in high levels. Under anaerobic conditions, this parameter is generally reduced, whereas under aerobic conditions, its presence is minimal. In this experiment, our focus was on assessing the treatment performance of the HD process in terms of COD removal efficiency (CRE) when applied to textile wastewater (TW) contaminated with NO3 and RB-5 dye. Figure 4 illustrates the results obtained from averaging the COD concentrations and correlating them with CRE values under various initial COD dosage conditions.
The findings reveal that a high concentration of COD still accumulated in the discharged wastewater. However, CRE remained relatively stable under different COD dosage conditions, ranging from 40% to 55%, compared to the nitrogen removal efficiency (NRE) and dye removal efficiency (DRE). The results confirm that varying COD dosages had no significant impact on the COD removal efficiency in this study. Previous studies focusing on the treatment performance of HD and the combination of HD with aerobic processes for treating organic-matter-contaminated domestic wastewater with influent COD concentrations between 1500 and 2000 mg/L have reported high CRE values ranging from approximately 70% to 90% [23]. In contrast, the observed relatively low CRE in this study may be attributed to the persistence of certain toxic chemicals following the processes of dye degradation, as dye colors often have the potential to convert into other toxic forms. Normally, certain toxic forms, including -NH2 compounds, accumulate under anaerobic conditions and are subsequently degraded under aerobic conditions [37,38]. Thus, the dye present in the effluent under anaerobic conditions was observed as both residual dye and some aromatic amines, leading to decreased COD removal rates [42]. Toxic by-products of dye degradation, such as sulfanilic acid and 1-amino-2-napthol, can significantly inhibit bacterial activity [43]. In this study, using RB-5 dye as a representative colorant, the dye was typically converted to sulfanilic acid, which easily inhibited bacterial activity in the HD reactor, which is consistent with previous findings [39,44,45,46]. Additionally, previous studies have shown that CRE increases as the dye concentration decreases due to a lack of dye metabolism after the degradation process [42]. However, some results have indicated that a high dye concentration has no significant impact on the COD removal rate, possibly because some dyes are non-toxic to bacterial activities [39,45]. A slight decrease in the COD removal rate was observed as the dye concentration increased, indicating that the dye concentration had no influence on the activity of the bacteria involved in the process.
Therefore, although the HD reactor demonstrated some capability in reducing the COD concentration, the process remained incomplete. The presence of toxic chemicals from RB-5 degradation and residual dye concentration could contaminate the discharged wastewater, resulting in low CRE. However, there was no effect of the presence of NO3-N and NO2-N on the COD removal rate. Similarly, various initial COD concentrations had no significant impact on the CRE.

3.4. Bacterial Community under Different Operating Conditions

The initial sludge of the HD reactor used in this study consisted of HD sludge that had been operated for over 400 days with an initial NO3-N concentration of 40 mg/L. The analysis of the initial sludge revealed the presence of Proteobacteria, Bacteroidetes, Firmicutes and Planctomycetes as the dominant phyla, accounting for 78.8%, 10.3%, 5.6% and 2.6%, respectively. At the class level, the microbial community showed variations, with Betaproteobacteria (59.3%), Alphaproteobacteria (12.8%), Cytophagia (4.6%) and Gammaproteobacteria (3.8%) being the most prominent classes. Specifically, Thauera spp., belonging to the class Betaproteobacteria, were identified as the dominant bacterial community at the family and genus levels during the initial stage of the reactor.
Subsequently, the reactor was operated under different conditions for more than 250 days following the methodology described by Singhopon et al. [13,14]. RUN 1 was initiated to assess the treatment performance of the HD reactor and to study the microbial community structure when contaminated with organic pollutants. Sludge samples were collected from the HD reactor at the end of each phase, on days 20, 40, 60 and 80 for RUN 1 to 4, corresponding to periods without and with OM contamination.
At the phylum level, the results of RUN 1 indicate the presence of Proteobacteria (85.6%), Chloroflexi (7.3%) and Firmicutes (4.7%). However, the composition slightly changed to Proteobacteria (60–75%) and Firmicutes (18–34%) after the addition of organic pollutants in RUN 2 to 4. The class-level analysis showed significant differences as well. In RUN 1, the microbial community consisted of Betaproteobacteria (62.4%), Gammaproteobacteria (17.1%), Anaerolineae (7.3%) and Alphaproteobacteria (6.0%). However, after introducing OM, Gammaproteobacteria, Erysipelotrichia, Clostridia and Alphaproteobacteria accounted for 55–67%, 10–19%, 7–15% and 4–7% of the community, respectively. These results indicate that the distribution of the microbial community structure was significantly affected by organic pollutants. The abundance of Gammaproteobacteria and Erysipelotrichia increased with the addition of OM, and the abundance of Betaproteobacteria and Anaerolineae decreased. Conversely, there was no impact of OM on the distribution of Alphaproteobacteria, which remained stable.
Figure 5 provides a detailed overview of the microbial communities at the family and genus levels. The main bacterial communities identified in this reactor were closely related to denitrifying bacteria, as well as some autotrophic and heterotrophic denitrifying bacteria. Previous studies have highlighted the importance of factors such as NO3-N concentration, initial dye concentration and H2 gas volume in influencing the distribution of bacterial communities in the HD process [14]. Additionally, Table 4 lists the relative abundances at the genus level and compares them with the average removal efficiency of each parameter.
In RUN 1, without OM contamination, the dominant bacterial community consisted of Rhodocyclaceae (class Betaproteobacteria), Xanthomonadaceae (class Alphaproteobacteria) and Thauera spp. (class Betaproteobacteria). The relative abundance of Rhodocyclaceae and Xanthomonadaceae increased, whereas the relative abundance of Thauera spp. decreased. Previous research has indicated that the relative abundance of Rhodocyclaceae increases with RB-5 concentration, whereas unclassified Xanthomonadaceae decreases with RB-5 concentration. Despite this, the nitrogen removal efficiency remained close to 90%, and decolorization efficiency reached approximately 25% due to the activities of these bacteria.
Upon the addition of organic pollutants in RUN 2 to 4, Thauera spp., Azoarcus spp., Alishewanella spp., Alkaliphilus spp. and Erysipelothrix spp. (all belonging to different bacterial classes) became the dominant bacterial communities. The results confirm that the relative abundances of Xanthomonadaceae and Rhodocyclaceae were inhibited by the presence of OM. In RUN 2, characterized by a high dosage of COD concentration, Azoarcus spp. and Erysipelothrix spp. showed high relative abundances. Nevertheless, nitrogen removal efficiency remained close to 90%, and the COD removal efficiency was approximately 50%, indicating a doubled decolorization rate. These bacteria played a commensal role and significantly enhanced the treatment efficiency under these conditions.
In RUN 3 and RUN 4, a low COD concentration was supplied to the reactor. The relative abundances of Thauera spp., Alishewanella spp. and Alkaliphilus spp. increased, whereas Azoarcus spp. and Erysipelothrix spp. decreased. However, organic pollutants had no inhibition on the relative abundance of Thauera spp., which exhibited a high relative abundance at low COD concentrations. This could be attributed to the adaptability of these bacteria to highly toxic pollutants, although they typically require some adaptation time. The results confirm that NRE, DRE and CRE remained stable, indicating that these bacteria effectively removed pollutants in the reactor. Therefore, this study concludes that organic pollutants significantly influenced the bacterial communities in the HD system, with the different bacterial species functioning together to enhance treatment efficiency.
The previous literature suggests that Xanthomonadaceae, often considered a suitable candidate for autotrophic denitrification, is commonly found in HD systems that use substantial amounts of salt and bicarbonate [47]. Similarly, Rhodocyclaceae is an important denitrifying bacterium involved in the reduction of NO3 to NO2 in the HD process. Previous findings have shown that its relative abundance increases with higher H2 flow rates [16]. Thauera spp., frequently detected in both autotrophic and heterotrophic denitrification conditions, plays a crucial role in HD systems [48]. The low relative abundance of Thauera spp. observed in this study could be linked to the low volume of H2 gas. Additionally, many Thauera spp. strains have been recognized as efficient degraders of aromatic compounds and exhibit versatile aromatic compound-degrading capabilities under denitrification conditions compared to aerobic conditions. These bacteria can utilize intermediate metabolites generated during dye degradation as the sole carbon source in the decolorization process [49].
The genus Azoarcus, a facultatively anaerobic, mesophilic, non-motile, Gram-negative bacterium, isolated from wastewater treatment plants, is known for its ability to degrade o-phthalate and a wide range of aromatic compounds using nitrate as an electron acceptor [50]. Azoarcus has been reported to be commonly found in various environments, including anoxic wastewater sludge, grass root soil, and nitrogen-fixing bacteria. Some Azoarcus strains also possess the capability to degrade aromatic compounds through anaerobic degradation linked to nitrate reduction [51,52,53]. They have been identified as predominant potential denitrifying genera contributing significantly to nitrogen removal in wastewater treatment plants and have been observed in activated sludge reactors treating ammonium-rich, high-organic tannery and coking wastewater [54,55]. Azoarcus has also been involved in the degradation of polycyclic aromatic hydrocarbons in municipal and industrial wastewater treatment processes. Additionally, it has been found to remove toluene and phenol under denitrification conditions [56].
Similarly, Alishewanella has been reported as an efficient degrader of textile dyes and exhibits efficient denitrification capacity under high alkaline conditions and high initial nitrogen concentrations [57]. The Erysipelothrix and Alkaliphilus genera are commonly found in textile industry effluents [58].
In conclusion, Xanthomonadaceae, Rhodocyclaceae and Thauera spp. acted as commensal bacteria in the absence of organic pollutants, and Thauera spp., Azoarcus spp., Alishewanella spp., Erysipelothrix spp. and Alkaliphilus spp. became dominant microbial communities following the addition of organic pollutants. This shift in bacterial composition contributed to enhanced nitrogen removal performance and reduced RB-5 dye and COD concentrations in the reactor. The results highlight the significant influence of organic pollutants on bacterial communities in the HD system. Despite their differences, these bacterial species worked together to enhance treatment efficiency in the reactor.

4. Conclusions

An HD reactor was established with an HRT of 12 h in the continuous feeding mode to investigate the simultaneous treatment performance of nitrogen and decolorization when TW was contaminated with OM. The reactor was operated under two distinct phases: without OM and with OM. RB-5 dye was chosen as the representative color source, and sodium acetate served as the organic source in this experiment. Although the HD system was capable of removing all pollutants, including NO3-N, NO2-N, RB-5 dye and COD, the process remained incomplete due to the relatively short HRT. It is worth noting that the presence of organic pollutants did not hinder the treatment efficiency of nitrogen and decolorization. The overall NRE was higher than the DRE, as NO3-N and NO2-N acted as more favorable electron acceptors, thus competing for electron donors at a faster rate compared to the dye. Following the addition of OM, the NRE slightly increased from 85% to 90–100%, and the decolorization rate doubled from 25% to 50–60%. Consequently, the results confirm that organic matter had a slight enhancing effect on NRE and a greater impact on DRE, although the different doses of organic matter had no significant influence on both parameters. OM played a crucial role in stimulating the activities of heterotrophic bacteria during the biological denitrification process. It also acted as a carbon source for bacterial activities, facilitating the cleavage of azo bonds during the dye degradation process. Consequently, some heterotrophic denitrification bacteria likely played a role alongside autotrophic denitrification bacteria in reducing nitrogen and dye within the reactor. Furthermore, the results indicate that a certain amount of organic matter, represented by the concentration of COD, was reduced within the HD system, typically ranging from 40% to 55% across different initial COD concentrations. As a result of the dye degradation process, various toxic chemicals, such as aromatic amines and other hazardous forms, were often generated and presented as organic pollutants once the azo bond was cleaved. Moreover, the degradation products of RB-5, acting as toxic molecules, inhibited bacterial activities within the HD reactor, leading to a decrease in the COD removal rate in this experiment. The findings of this study indicate that the HD system exhibits superior performance in the simultaneous treatment of COD, dye color and NO3-N compared to other existing treatment methods, as outlined in Table 1. Among the bacterial community, Xanthomonadaceae, Rhodocyclaceae and Thauera spp. functioned as commensal bacteria in the absence of organic pollutants. However, after the addition of organic pollutants, Thauera spp., along with some Azoarcus spp., Erysipelothrix spp., Alishewanella spp. and Alkaliphilus spp., were found to dominate the microbial community. Despite these changes, the treatment efficiency of all parameters remained stable and improved through the activities of these bacteria. In practical terms, this approach presents an opportunity to enhance treatment efficiency and enable the treatment of textile wastewater through cost-effective and environmentally friendly processes prior to discharge, making it particularly suitable for developing countries.

Author Contributions

Planning, conceptualization, formal analyses, investigation, visualization and writing—original draft preparation: T.S.; methodology and writing—review and editing: T.S. and S.R.; review: K.S. and T.K.; supervision: F.K. All authors have read and agreed to the published version of the manuscript.

Funding

This research was partially funded by the Science and Technology Research Partnership for Sustainable Development (SATREPS) program of the Japan Science and Technology Agency (JST) and the Japan International Cooperation Agency (JICA).

Institutional Review Board Statement

Not applicable.

Informed Consent Statement

Not applicable.

Data Availability Statement

Not applicable.

Acknowledgments

The authors acknowledge the Interdisciplinary Centre for River Basin Environment, University of Yamanashi, Japan, for facilitating this research.

Conflicts of Interest

The authors declare no conflict of interest.

References

  1. Meerbergen, K. Decolorization of Textile Waste Water, with an Emphasis on Microbial Treatment Processes. Ph.D. Thesis, KU Leuven, Leuven, Belgium, 2018. [Google Scholar]
  2. Yaseen, D.A.; Scholz, M. Textile dye wastewater characteristics and constituents of synthetic effluents: A critical review. Int. J. Environ. Sci. Technol. 2019, 16, 1193–1226. [Google Scholar] [CrossRef] [Green Version]
  3. Holkar, C.R.; Jadhav, A.J.; Pinjari, D.V.; Mahamuni, N.M.; Pandit, A.B. A critical review on textile wastewater treatments: Possible approaches. J. Environ. Manag. 2016, 182, 351–366. [Google Scholar] [CrossRef]
  4. Bhatia, D.; Sharma, N.R.; Singh, J.; Kanwar, R.S. Biological methods for textile dye removal from wastewater: A review. Crit. Rev. Environ. Sci. Technol. 2017, 47, 1836–1876. [Google Scholar] [CrossRef]
  5. World Bank. Environment, Health and Safety Guideline for Textile Manufacturing Finance Corporation; World Bank Group: Washington, DC, USA, 2007. [Google Scholar]
  6. Shah, M.P. Azo dye removal technologies. Austin J. Biotechnol. Bioeng. 2018, 5, 1090–1096. [Google Scholar]
  7. Xu, H.; Yang, B.; Liu, Y.; Li, F.; Shen, C.; Ma, C.; Tian, Q.; Song, X.; Sand, W. Recent advances in anaerobic biological processes for textile printing and dyeing wastewater treatment: A mini-review. World J. Microbiol. Biotechnol. 2015, 34, 165–169. [Google Scholar] [CrossRef]
  8. Cirik, K.; Kitis, M.; Cinar, O. Effect of nitrate on anaerobic azo dye reduction. Bioprocess. Biosyst. Eng. 2013, 36, 69–79. [Google Scholar] [CrossRef]
  9. Konsowa, A.H. Decolorization of wastewater containing direct dye by ozonation in a batch bubble column reactor. Desalination 2003, 158, 233–240. [Google Scholar] [CrossRef]
  10. Tizaoui, C.; Bouselmi, L.; Mansouri, L.; Ghrabi, A. Landfill leachate treatment with ozone and ozone/hydrogen peroxide systems. J. Hazard. Mater. 2007, 140, 316–324. [Google Scholar] [CrossRef] [PubMed]
  11. Allegre, C.; Maisseu, M.; Charbit, F.; Moulin, P. Coagulation-flocculation-decantation of dye house effluents: Concentrated effluents. J. Hazard. Mater. 2004, 116, 57–64. [Google Scholar] [CrossRef]
  12. Chen, X.; Chen, G.; Yue, P.L. Anodic oxidation of dyes at Nobel Ti/B-Diamond electrodes. Chem. Eng. Sci. 2003, 58, 995–1001. [Google Scholar] [CrossRef]
  13. Singhopon, T.; Shinoda, K.; Rujakom, S.; Kazama, F. Hydrogenotrophic denitrification for treating nitrate contaminated without/with reactive black 5 dye. J. Water Reuse Desalination 2020, 10, 200–213. [Google Scholar] [CrossRef]
  14. Singhopon, T.; Shinoda, K.; Rujakom, S.; Kazama, F. Factors Affecting the Simultaneous Removal of Nitrate and Reactive Black 5 Dye via Hydrogen-Based Denitrification. Water 2021, 13, 922. [Google Scholar] [CrossRef]
  15. Lu, C.; Gu, P.; He, P.; Zhng, G.; Song, C. Characteristics of Hydrogenotrophic denitrification in a combined system of gas-permeable membrane and a biofilm reactor. J. Hazard. Mater. 2009, 168, 1581–1589. [Google Scholar] [CrossRef] [PubMed]
  16. Eamrat, R.; Tsutsumi, Y.; Kamei, T.; Khanichaidecha, W.; Tanaka, Y.; Kazama, F. Optimization of hydrogenotrophic denitrification behavior using continuous and intermittent hydrogen gas supply. J. Water Environ. Technol. 2017, 15, 65–75. [Google Scholar] [CrossRef] [Green Version]
  17. Khanitchaidecha, W.; Kazama, F. Hydrogenotrophic denitrification in an attached growth reactor under various operating conditions. Water Supply 2012, 12, 72–81. [Google Scholar] [CrossRef]
  18. Chen, D.; Yang, K.; Wang, H.; Lv, B. Nitrate removal from groundwater by hydrogen-fed autotrophic denitrification in a bio-ceramsite reactor. Water Sci. Technol. 2014, 69, 2417–2422. [Google Scholar] [CrossRef]
  19. Lee, K.C.; Rittmann, B.E. Applying a novel autohydrogenotrophic hollow-fiber membrane biofilm reactor for denitrification of drinking water. Water Res. 2022, 36, 2040–2052. [Google Scholar] [CrossRef]
  20. Mohseni-Bandpi, A.; Elliott, D.J.; Zazouli, M.A. Biological nitrate removal processes from drinking water supply a review. J. Environ. Health Sci. Eng. 2013, 11, 35. [Google Scholar] [CrossRef] [Green Version]
  21. Li, P.; Xing, W.; Zuo, J.; Tang, L.; Wang, Y.; Lin, J. Hygrogenotrophic denitrification for tertiary nitrogen removal from municipal wastewater using membrane diffusion packed-bed bioreactor. Bioresour. Technol. 2013, 144, 452–459. [Google Scholar] [CrossRef]
  22. Visvanathan, C.; Hung, N.Q.; Jegatheesan, V. Hydrogenotrophic denitrification of synthetic aquaculture wastewater using membrane bioreactor. Process. Biochem. 2008, 43, 673–682. [Google Scholar] [CrossRef]
  23. Omata, J. Biological Wastewater Treatment under Hydrogen Gas Diffusion. Master’s Thesis, University of Yamanashi, Yamanashi, Japan, 2019. [Google Scholar]
  24. Mostafa, M. Waste water treatment in textile industries-the concept and current removal technologies. J. Biodivers. Environ. Sci. 2015, 7, 501–525. [Google Scholar]
  25. Panswad, T.; Luangdilok, W. Decolorization of reactive dyes with different molecular structures under different environmental conditions. Water Res. 2002, 34, 4177–4184. [Google Scholar] [CrossRef]
  26. Sairiam, S.; Thuptimdang, P.; Painmanakul, P. Decolorization of reactive black 5 from synthetic dye wastewater by fenton process. Environ. Asia 2019, 12, 1–8. [Google Scholar] [CrossRef]
  27. APHA; AWWA; WEF. Standard Methods for the Examination of Water and Wastewater, 22th ed.; Rice, E.W., Baird, R.B., Eaton, A.D., Clesceri, L.S., Eds.; American Public Health Association; American Water Works Association; Water Environment Federation: Washington, DC, USA, 2012. [Google Scholar]
  28. Supaka, N.; Juntongjin, K.; Damronglerd, S.; Delia, M.L.; Strehaiano, P. Microbial decolorization of reactive azo dyes in a sequential anaerobic-aerobic system. Chem. Eng. J. 2004, 99, 169–176. [Google Scholar] [CrossRef]
  29. Ni, S.Q.; Ni, J.Y.; Hu, D.L.; Sung, S. Effect of organic matter on the performance of granular anammox process. Bioresour. Technol. 2012, 110, 701–705. [Google Scholar] [CrossRef] [PubMed]
  30. Shinoda, K.; Rujakom, S.; Singhopon, T.; Eamrat, R.; Kamei, T.; Kazama, F. Effect of carrier filling ration on hydrogenotrophic denitrification performance. Jpn. J. Water Treat. Biol. 2020, 56, 67–78. [Google Scholar] [CrossRef]
  31. Hamdani, A.; Mountadar, M.; Assobhei, O. Simultaneous nitrate and organic matter removal from a dairy effluent by biodenitrification. Rev. Des. Sci. De. L’Eau. 2018, 31, 97–107. [Google Scholar] [CrossRef] [Green Version]
  32. Sun, F.; Wu, S.; Liu, J.; Li, B. Denitrification capacity of a landfilled refuse in response to the variations of COD/NO3-N in the injected leachate. Bioresour. Technol. 2012, 103, 109–115. [Google Scholar] [CrossRef]
  33. Henze, M.; Kristensen, G.H.; Strube, R. Rate-Capacity Characterization of Wastewater for Nutrient Removal Processes. Water Sci. Technol. 1994, 29, 101–107. [Google Scholar] [CrossRef]
  34. Lee, J.W.; Lee, K.H.; Park, K.Y.; Meng, S.K. Hydrogentrophic denitrification in a packed bed reactor: Effect of hydrogen-to-water flow rate ratio. Bioresour. Technol. 2012, 101, 3940–3946. [Google Scholar] [CrossRef]
  35. Saroyan, H.; Ntagiou, D.; Rekos, K.; Deliyanni, E. Reactive black 5 degradation on manganese oxides supported on sodium hydroxide modified graphene oxide. Appl. Sci. 2019, 9, 2167. [Google Scholar] [CrossRef] [Green Version]
  36. Rasool, K.; Mahmoud, K.A.; Lee, D.S. Influence of co-substrate on textile wastewater treatment and microbial community changes in the anaerobic biological sulfate reduction process. J. Hazard. Mater. 2015, 299, 453–461. [Google Scholar] [CrossRef] [PubMed]
  37. Zhang, Y.; Jing, Y.; Zhang, J.; Sun, L.; Quan, X. Performance of a ZVI-UASB reactor for azo dye wastewater treatment. J. Chem. Technol. Biotechnol. 2011, 86, 99–204. [Google Scholar] [CrossRef]
  38. Lellis, B.; Fávaro-Polonio, C.Z.; Pamphile, J.A.; Polonio, J.C. Effects of textile dyes on health and the environment and bioremediation potential of living organisms. Biotechnol. Res. Innov. 2019, 3, 275–290. [Google Scholar] [CrossRef]
  39. Kocyigit, H.; Ugurlu, A. Biological decolorization of reactive azo dye by anaerobic/aerobic-sequencing batch reactor system. Glob. Nest J. 2015, 17, 210–219. [Google Scholar] [CrossRef]
  40. Wang, Y.; Jiang, L.; Shang, H.; Li, Q.; Zhou, W. Treatment of azo dye wastewater by the self-flocculating marine bacterium aliiglaciecola lipolytica. Environ. Technol. Innov. 2020, 19, 100810. [Google Scholar] [CrossRef]
  41. Costa, M.C.; Mota, F.S.; Santos, A.B.D.; Mendonça, G.L.F.; Nascimento, R.F. Effect of dye structure and redox mediators on anaerobic azo and anthraquinone dye reduction. Quim. Nova 2012, 35, 482–486. [Google Scholar] [CrossRef] [Green Version]
  42. Wijetunga, S.; Li, X.F.; Jian, C. Effect of organic load on decolourization of textile wastewater containing acid dyes in upflow anaerobic sludge blanket reactor. J. Hazard. Mater. 2010, 177, 792–798. [Google Scholar] [CrossRef]
  43. Al-Amrani, W.A.; Lim, P.E.; Seng, C.E.; Wan Ngah, W.S. Factors affecting bio-decolorization of azo dyes and COD removal in anoxic-aerobic REACT operated sequencing batch reactor. J. Taiwan Inst. Chem. Eng. 2014, 45, 609–616. [Google Scholar] [CrossRef]
  44. El Bouraie, M.E.; El Din, W.S. Biodegradation of reactive black 5 by Aeromonas hydrophla strain isolated from dye-contaminated textile wastewater. Sustain. Environ. Res. 2016, 26, 209–216. [Google Scholar] [CrossRef] [Green Version]
  45. Naimabadi, A.; Movahedian Attar, H.; Shahsavani, A. Decolorization and biological degradation of azo dye reactive red 2 by anaerobic/aerobic sequential process. J. Environ. Health Sci. Eng. 2009, 6, 67–72. [Google Scholar]
  46. Erick, M.; Igor, P.; Firmino, M. Sequential anaerobic/aerobic treatment of dye-containing Wastewaters: Colour and COD Removals, and ecotoxicity tests. Appl. Biochem. Biotechnol. 2012, 166, 1057–1069. [Google Scholar] [CrossRef]
  47. Torrentó, C.; Urmeneta, J.; Otero, N.; Soler, A.; Viñas, M.; Cama, J. Enhanced denitrification in groundwater and sediments from a nitrate-contaminated aquifer after addition of pyrite. Chem. Geol. 2011, 287, 90–101. [Google Scholar] [CrossRef] [Green Version]
  48. Rujakom, S.; Kamei, T.; Kazama, F. Thauera sp. in Hydrogen-Based Denitrification: Effects of Plentiful Bicarbonate Supplementation on Powerful Nitrite Reducer. Sustainability 2023, 15, 277. [Google Scholar] [CrossRef]
  49. Stolz, A.; Ka, P. Bacterium that is able to degrade azo dyes of the Orange II type. Int. J. Syst. Evol. Microbiol. 2001, 51, 1831–1837. [Google Scholar]
  50. Junghare, M.; Patil, Y.; Schink, B. Draft genome sequence of a nitrate-reducing, o-phthalate degrading bacterium, Azoarcus sp. strain PA01(T). Stand. Genom. Sci. 2015, 10, 90. [Google Scholar] [CrossRef] [PubMed] [Green Version]
  51. Reinhold, H.B.; Hurek, T.; Gillis, M.; Hoste, B.; Vancanneyt, M.; Kersters, K. Azoarcus gen. nov., nitrogen-fixing Proteobacteria associated with roots of kallar grass (Leptochloa fusca (L.) Kunth), and description of two species, Azoarcus indigens sp. nov. and Azoarcus communis sp. nov. Int. J. Syst. Bacteriol. 1993, 43, 574–584. [Google Scholar] [CrossRef]
  52. Evans, W.C.; Fuchs, G. Anaerobic degradation of aromatic compounds. Ann. Rev. Microbiol. 1998, 42, 289–317. [Google Scholar] [CrossRef]
  53. Wang, Z.; Zhang, X.X.; Lu, X.; Liu, B.; Li, Y. Abundance and diversity of bacterial nitrifiers and denitrifiers and their functional genes in tannery wastewater treatment plants revealed by high-throughput sequencing. PLoS ONE 2014, 9, e113603. [Google Scholar] [CrossRef]
  54. Ma, Q.; Qu, Y.; Shen, W. Bacterial community compositions of coking wastewater treatment plants in steel industry revealed by Illumina high-throughput sequencing. Bioresour. Technol. 2015, 179, 436–443. [Google Scholar] [CrossRef]
  55. Angnes, G.; Nicoloso, R.S.; Da Silva, M.L.B.; De Oliveira, P.A.V.; Higarashi, M.M.; Mezzari, M.P.; Miller, P.R.M. Correlating denitrifying catabolic genes with N2O and N2 emissions from swine slurry composting. Bioresour. Technol. 2013, 140, 368–375. [Google Scholar] [CrossRef] [PubMed] [Green Version]
  56. Mechichi, T.; Stackebrandt, E.; Gad’on, N.; Fuchs, G. Phylogenetic and metabolic diversity of bacteria degrading aromatic compounds under denitrifying conditions, and description of Thauera phenylacetica sp. nov., Thauera aminoaromatica sp. nov., and Azoarcus buckelii sp. nov. Arch. Microbiol. 2002, 178, 26–35. [Google Scholar] [CrossRef] [PubMed]
  57. Kolekar, Y.M.; Konde, P.D.; Markad, V.L.; Kulkarni, S.V.; Chaudhari, A.U.; Kodam, K.M. Effective bioremoval and detoxification of textile dye mixture by Alishewanella sp. KMK6. Appl. Microbiol. Biotechnol. 2013, 97, 881–889. [Google Scholar] [CrossRef] [PubMed]
  58. Cheng, R.; Wang, X.; Zhu, H.; Yan, B.; Shutes, B.; Xu, Y.; Fu, B.; Wen, H. Isolation and characterization of a salt-tolerant denitrifying bacterium Alishewanella sp. F2 from seawall muddy water. Sci. Rep. 2020, 10, 10002. [Google Scholar] [CrossRef]
Figure 1. Schematic diagram of the experimental setup, including (a) synthetic wastewater feeding tank, (b) peristatic pump, (c) influent pipe, (d) HD reactor, (e) air stone diffuser, (f) heating rod, (g) magnetic stirrer, (h) water bath, (i) plastic beads, (j) effluent pipes and (k) H2 generator.
Sustainability 15 10324 g001
Figure 2. NO3-N and NO2-N concentrations with nitrogen removal efficiency (NRE) in RUN 1–4.
Sustainability 15 10324 g002
Figure 3. RB-5 dye concentrations and decolorization efficiency (DRE) in RUN 1–4.
Sustainability 15 10324 g003
Figure 4. Average values of COD concentrations and COD removal efficiency (CRE).
Sustainability 15 10324 g004
Figure 5. Heatmap illustrating the compositions of bacterial communities at the genus level during different operation times (expressed as relative abundance in percentage) for RUN 1–4.
Sustainability 15 10324 g005
Table 2. Composition of synthetic TW.
SubstrateConcentration
NaNO30.486 g/L as 80 mg NO3-N/L
KH2PO40.055 g/L as 12.5 mg P
NaHCO31.0 g/L as an inorganic carbon source
CaCl20.021 g/L as 7.5 mg Ca
MgSO4·7H2O0.038 g/L as 3.75 mg Mg
Trace elements I a1 mL/L
Trace elements II b1 mL/L
Reactive Black 5 dye0.030 g/L as color of 30 mg/L
CH3COONa2.085 g/L as 1500 mg COD/L
a Containing 5 g/L EDTA and 5 g/L FeSO4. b Containing 15 g/L EDTA, 0.43 g/L ZnSO4·7H2O, 0.24 g/L CoCl2·6H2O, 1 g/L MnCl2·4H2O, 0.25 g/L CuSO4·6H2O, 0.22 g/L MnCl2·5H2O, 0.22 g/L NaMoO4·5H2O, 0.19 g/L NiCl2·6H2O, 0.21 g/L NaSeO4·10H2O and 0.014 g/L H3BO4.
Table 3. Summary of the textile wastewater characteristics.
Operating DayNo OM AdditionOM Addition
Day 0–20
RUN 1
Day 21–40
RUN 2
Day 41–60
RUN 3
Day 61–80
RUN 4
Initial concentrations
NO3-N (mgN/L)80808080
RB-5 dye (mg/L)30303030
COD (mg/L)-500030001500
H2 supply conditionsContinuous supply at 50 mL/min
Table 4. Comparison of the relative abundance of bacterial communities at the genus level with the average performance in nitrogen treatment, decolorization and COD removal.
Sludge SamplesBacterial Relative Abundance (%)
Initial SludgeRUN 1RUN 2RUN 3RUN 4
Bacterial communities
   Thauera spp.51.615.54.228.328.9
    Xanthomonadaceae0.616.3---
    Rhodocyclaceae4.646.00.11.10.2
    Azoarcus--48.69.711.8
    Erysipelothrix--18.610.510.5
    Alishewanella--0.715.49.2
    Alkaliphilus--0.47.56.8
Parameters Treatment efficiency (%)
Nitrogen 86 ± 990 ± 395 ± 499 ± 2
Decolorization 25 ± 1450 ± 1858 ± 1751 ± 9
COD -47 ± 44643 ± 43450 ± 359
Disclaimer/Publisher’s Note: The statements, opinions and data contained in all publications are solely those of the individual author(s) and contributor(s) and not of MDPI and/or the editor(s). MDPI and/or the editor(s) disclaim responsibility for any injury to people or property resulting from any ideas, methods, instructions or products referred to in the content.

