
Designing and Analysing a PV/Battery System via New Resilience Indicators

Abstract
:1. Introduction
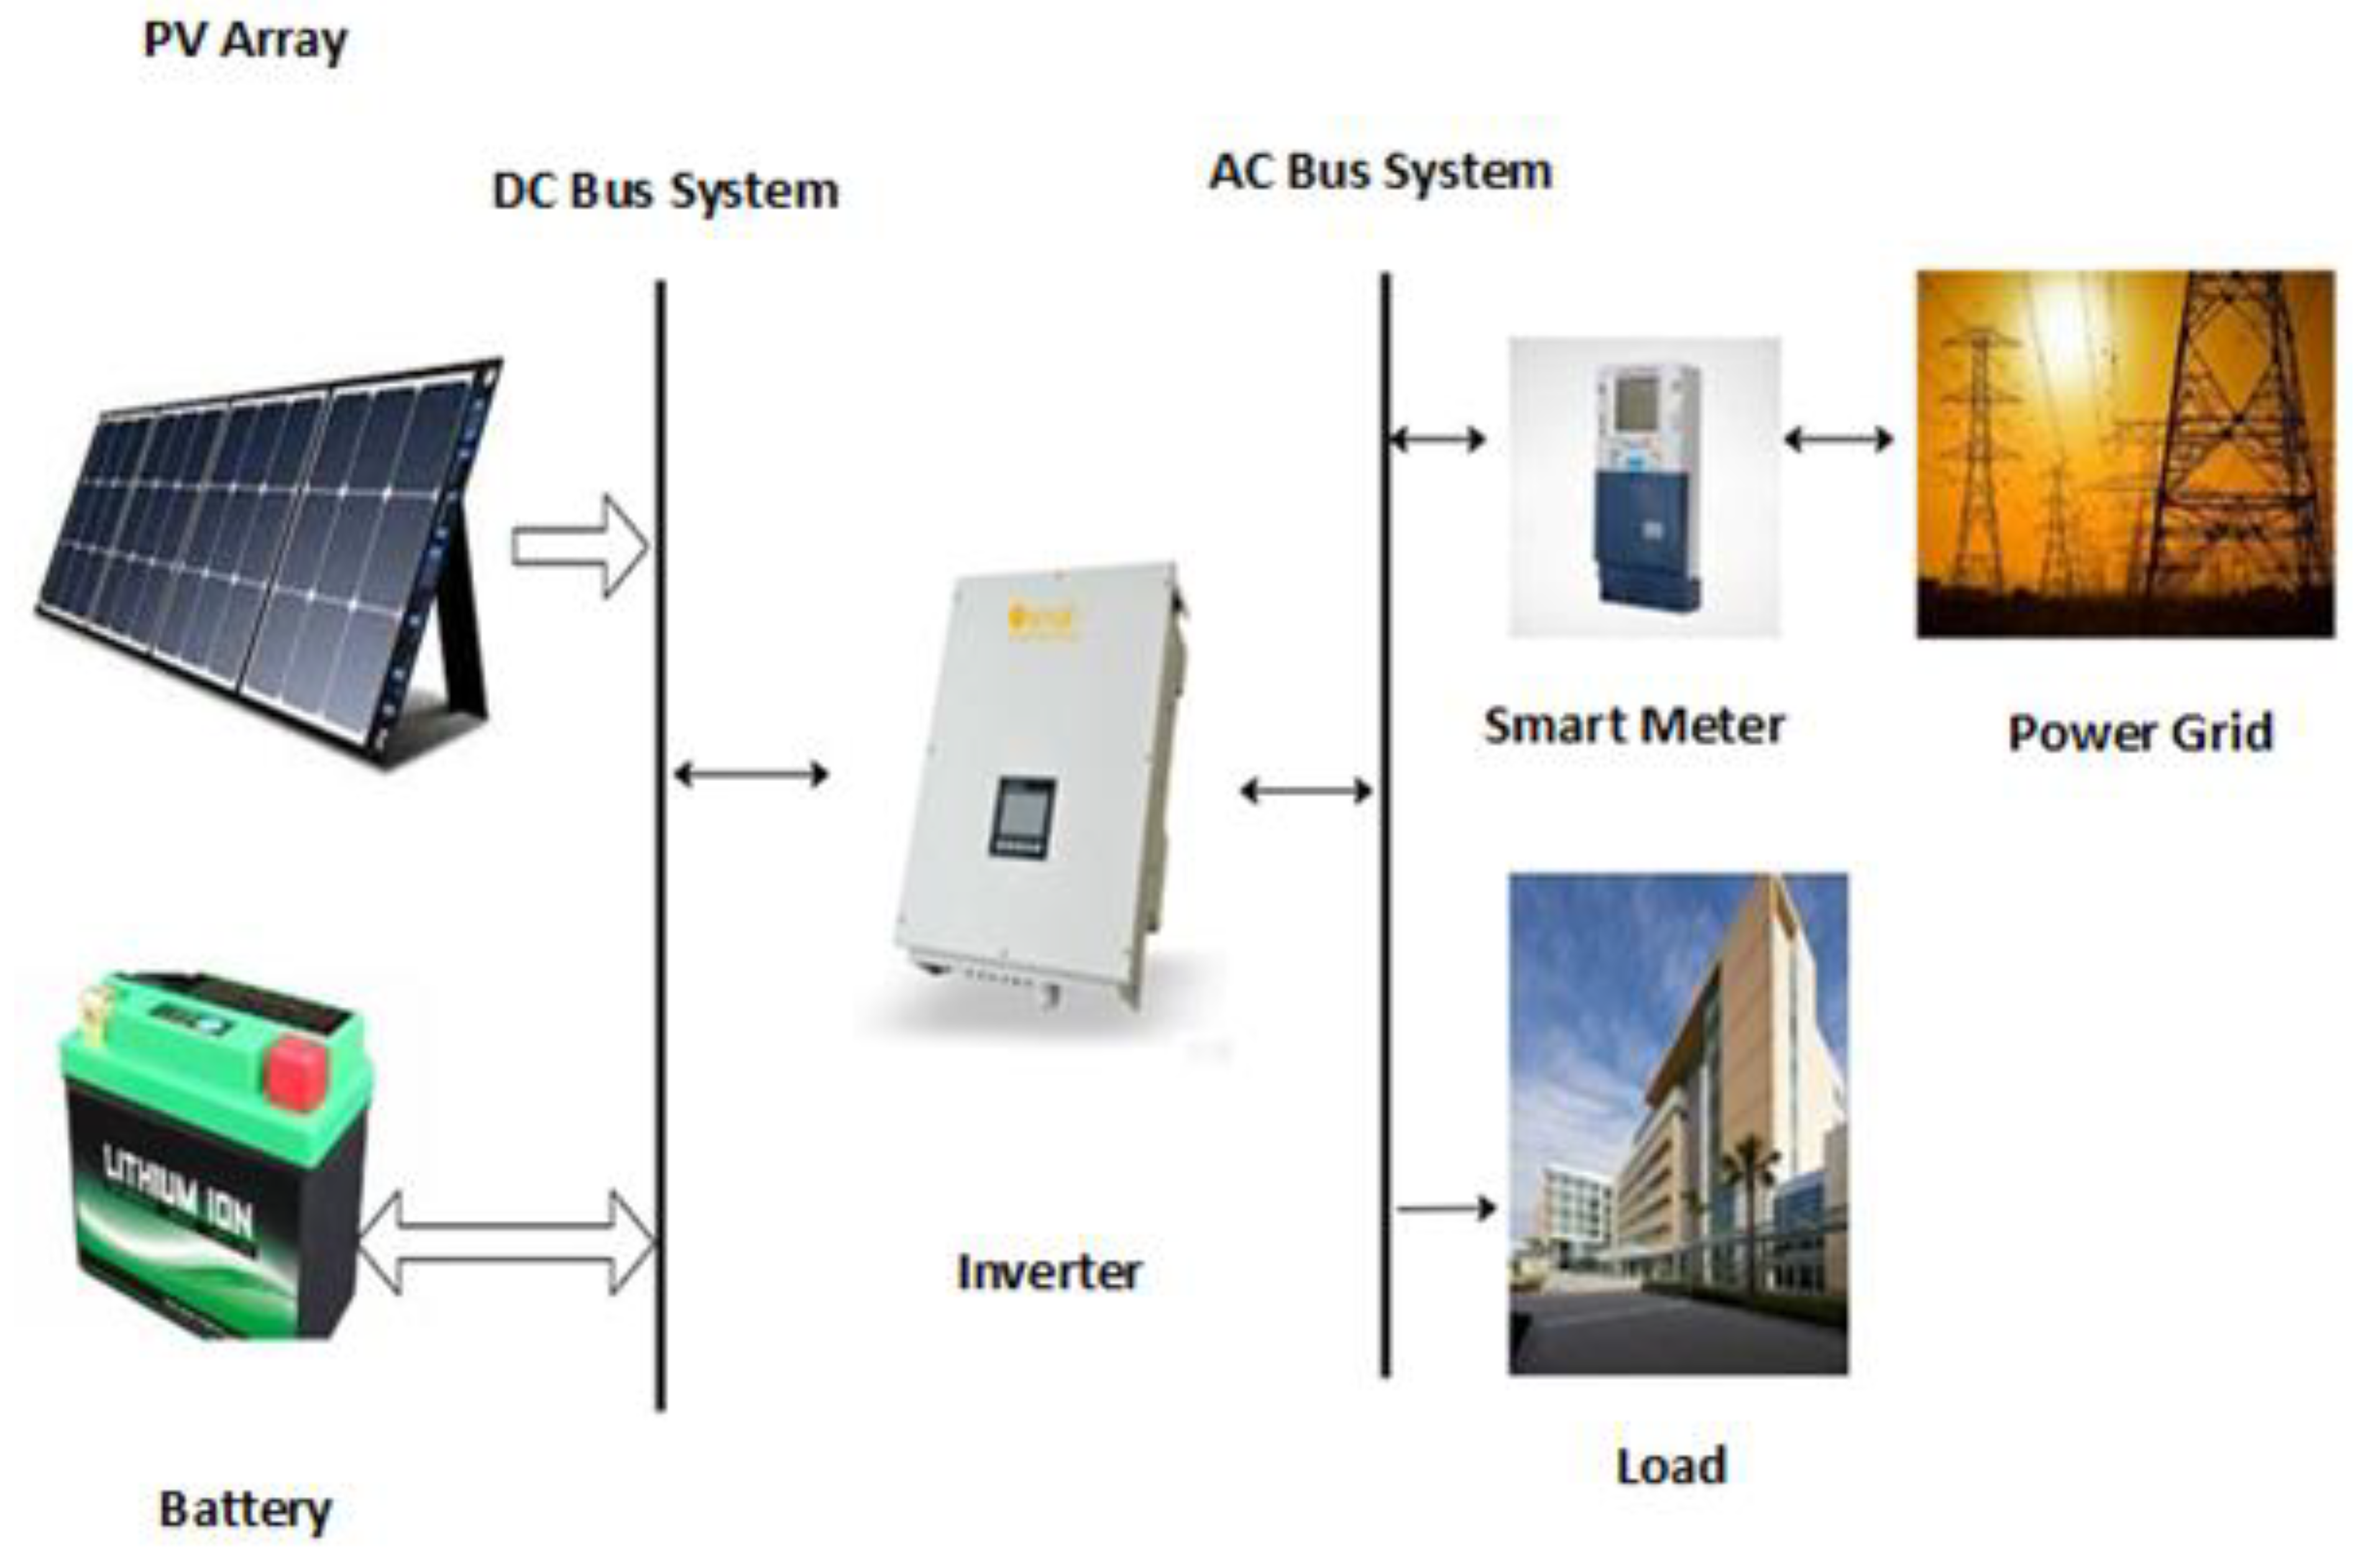
2. Methodology
2.1. Optimization Simulation by REopt
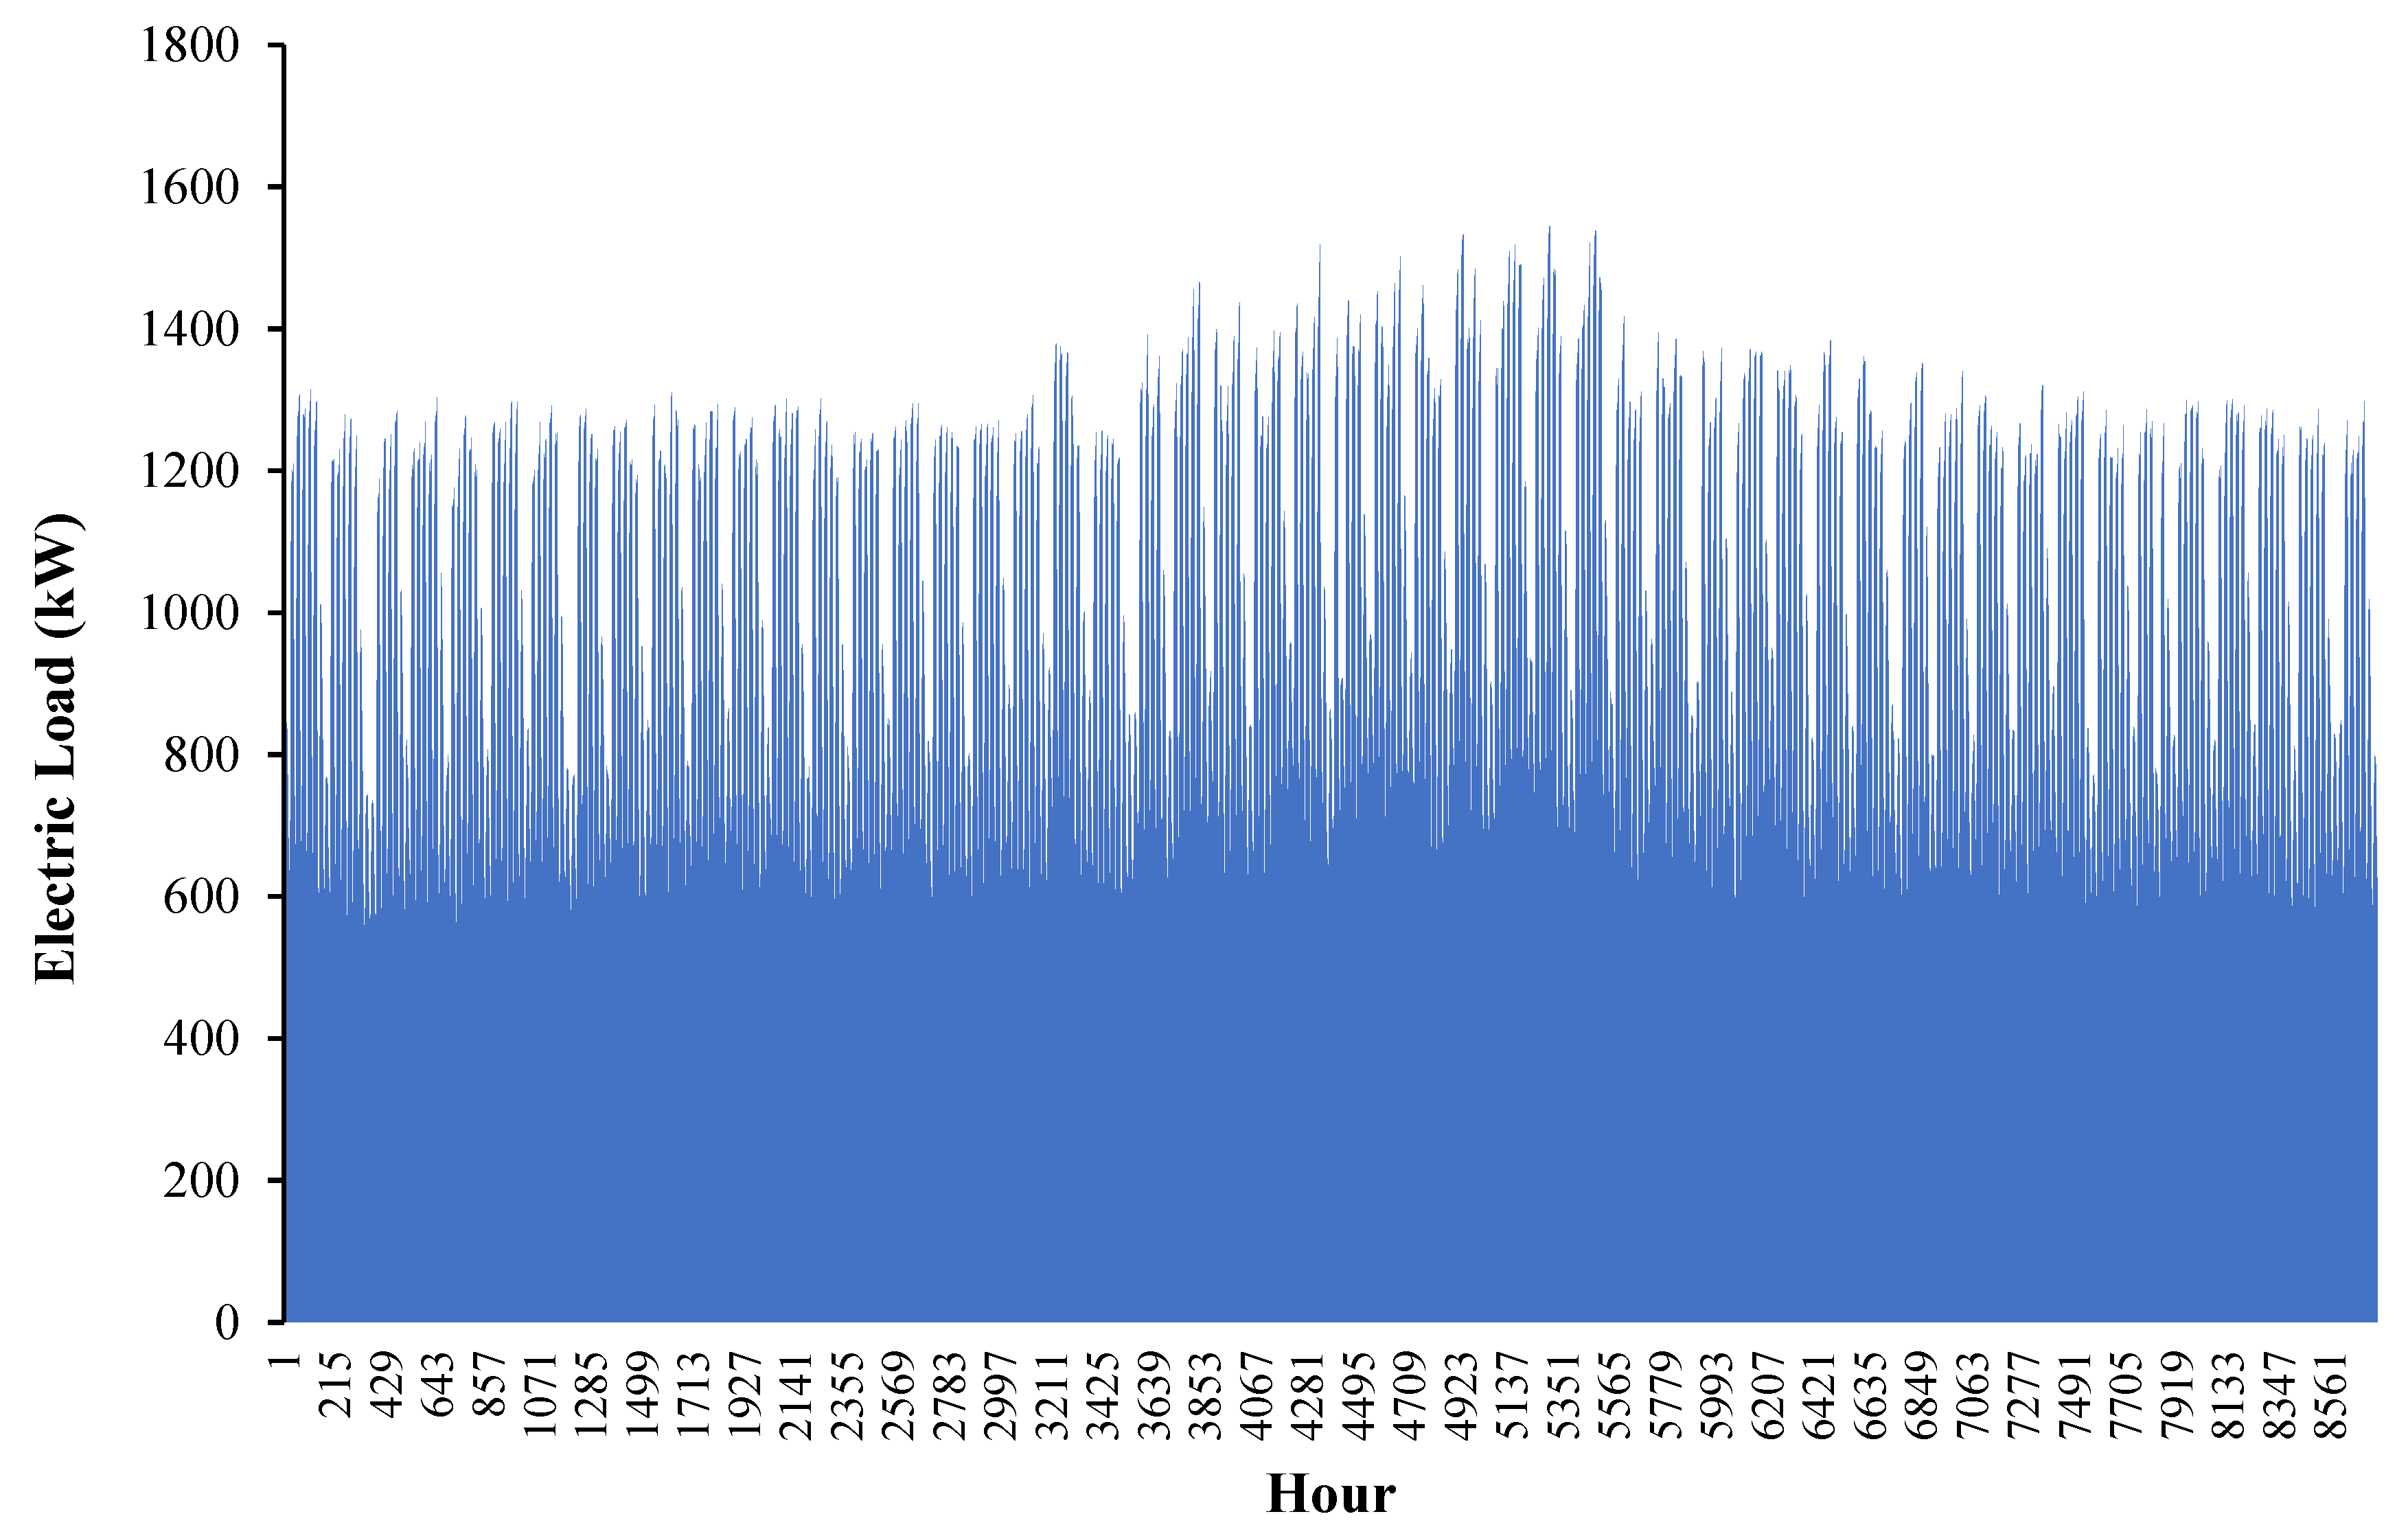
2.2. Grid Simulation
2.3. Simulation for Photovoltaic Module
2.4. Simulation for Battery
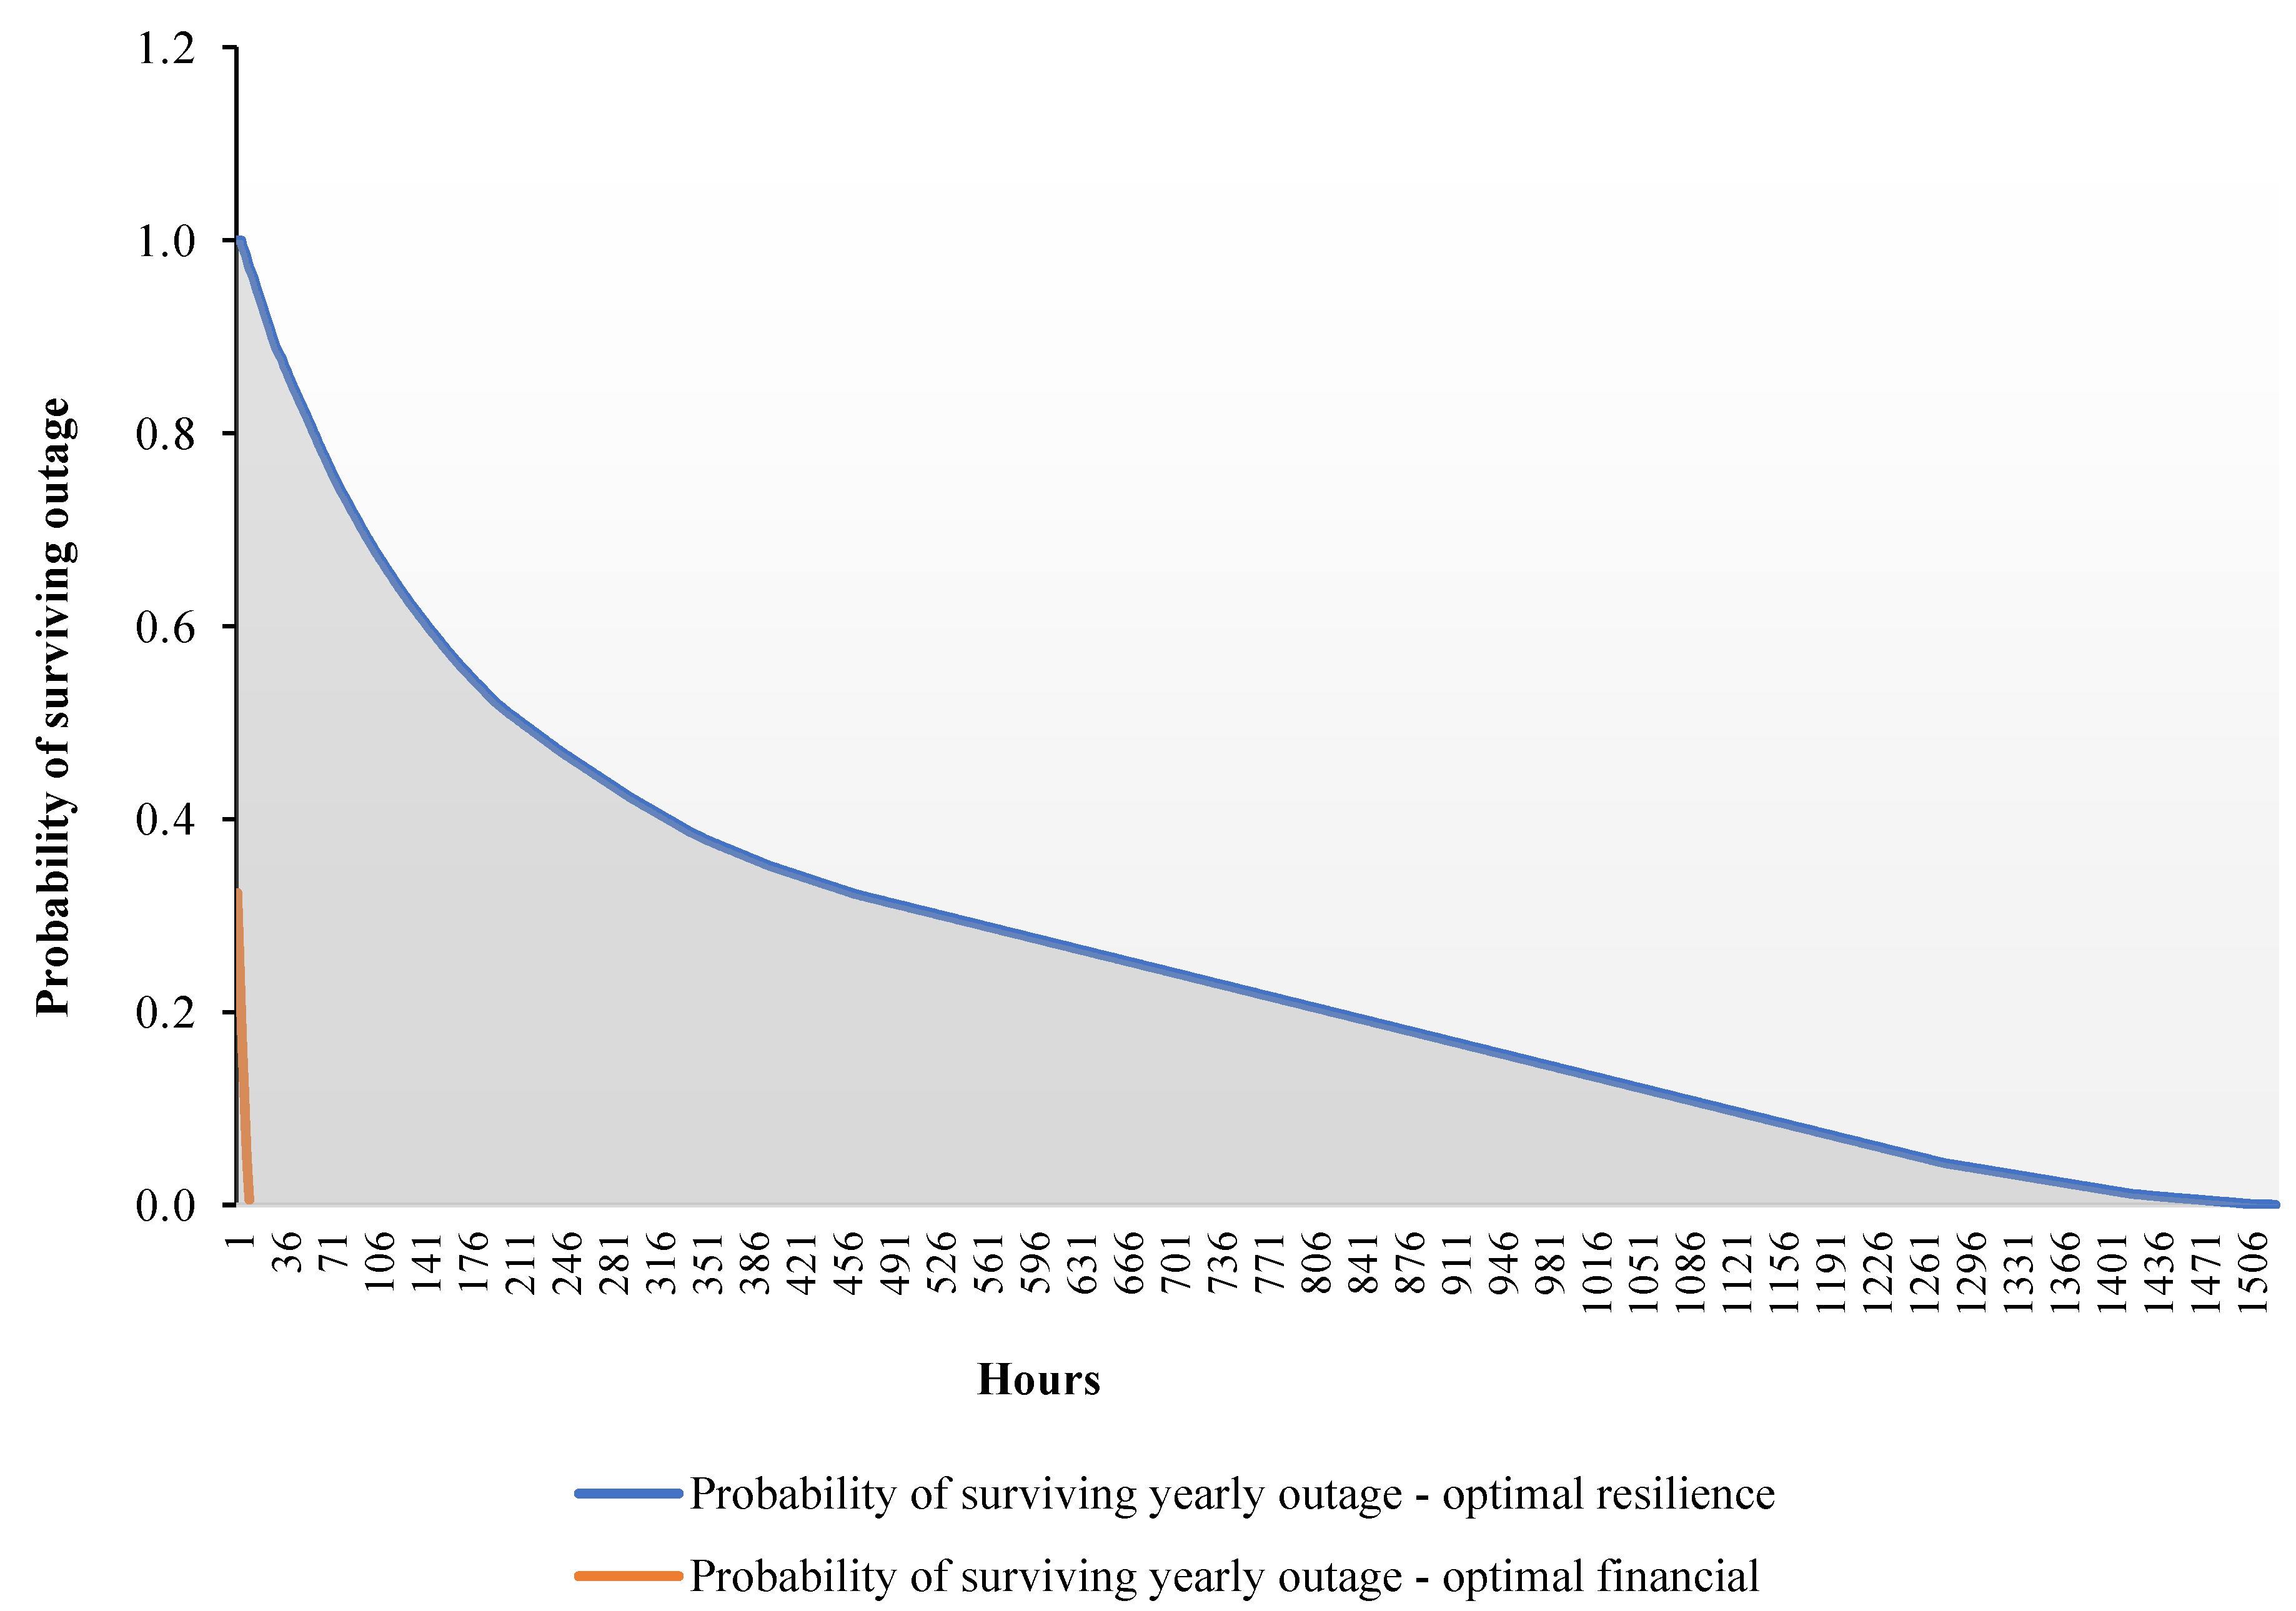
2.5. New Resilience Indicators
2.5.1. Energy Flexibility
2.5.2. Economic Resilience
2.5.3. Environmental Resilience
2.5.4. Community Resilience
3. Results and Discussion
Project Validation and Future Recommendations
- Microgrids in refugee camps should be designed, installed, and maintained by governments and humanitarian groups with adequate funding. The standardization of microgrid technology and components should be encouraged to guarantee the interoperability, dependability, and affordability of microgrid systems.
- Governments should provide legal frameworks that support the installation of microgrids in displaced camps. These guidelines should support the creation of creative finance structures and encourage participation from the private sector.
- Governments and humanitarian groups should offer financial incentives to encourage the use of microgrids. For instance, businesses that engage in microgrid projects in refugee camps might receive tax benefits.
- Governments and humanitarian groups should offer technical support to microgrid developers to guarantee the successful installation and operation of microgrids in refugee camps. Power electronic devices can often induce harmonics in the DC voltage, which will degrade the DC voltage quality [54]. Frequent charging and discharging can also cause harmonics in the system [55]. So, careful consideration needs to be made in this regard.
- Capacity-building programs should be established to train local personnel on the maintenance and operation of microgrid systems. These steps will ensure the sustainability of the systems over the long term. The microgrid is often subjected to theft in certain regions where electricity theft is prevalent [56]. Proper techniques should be used to monitor this situation [57].
- Cooperation between governments, humanitarian organizations, and private sector actors should be encouraged to facilitate the successful installation of microgrids in refugee camps. This measure will make the energy system more robust and able to endure disturbances such as natural disasters.
4. Conclusions
Supplementary Materials
Author Contributions
Funding
Institutional Review Board Statement
Informed Consent Statement
Data Availability Statement
Conflicts of Interest
Nomenclature
| DA | Days of autonomy. |
| DOD | Depth of charge of the battery. |
| STC | Standard test conditions. |
| Surface area of the PV module (m2). | |
| Battery capacity (kWh). | |
| Battery system size (kW). | |
| Maximum storage capacity of the battery (kWh). | |
| Maximum size of the battery (kW). | |
| Minimum state of charge of battery (%). | |
| In a time, step h, power delivered to the battery (kW). | |
| In a time, step h, power dispatched from the battery (kW). | |
| In a time, step h, energy stored in the battery (kW). | |
| Demand cost. | |
| Energy costs. | |
| Cost of operation and maintenance. | |
| Capital cost of PV, battery. | |
| Capital cost for technology t (USD/kW). | |
| Electricity cost in time step h (USD/kW). | |
| Demand cost for month m. | |
| O&M cost per unit size of the system for technology t (USD/kW). | |
| Rated capacity of PV array (kW) | |
| Demand cost for ratchet r. | |
| Capital cost of battery per kWh (USD/kWh). | |
| Capital cost of storage inverter per kW (USD/kW). | |
| Cash Flow For year Z | |
| After Tax Cash Flow in year Z | |
| Derating factor of solar PV array. | |
| Monthly peak demand for month m (kW). | |
| Peak demand in ratchet r (kW). | |
| Average energy demand (kWh/day). | |
| Hourly capacity factor for demand d for energy technology t in time step h at locations s (unitless). | |
| Degradation factor for technology t (unitless). | |
| Production factor for technology t, serving load l, in timestep h (unitless). | |
| The nth condition. | |
| I | Investment |
| Solar irradiation on the PV panel’s surface (kW/m2). | |
| Solar irradiation under STC. | |
| Production size restriction for load l in time step h(kW). | |
| Capacity of net metering level v at location s. | |
| N | Project life in years |
| P | Annual net cash flow |
| Pg | Grid power. |
| Load power demand. | |
| and | Power supplied by the corresponding energy sources. |
| Rated production of technology t, serving load l. in timestep h (kW). | |
| Ambient temperature (). | |
| Temperature under STC. | |
| PV cell temperature in the current time step (). | |
| Ambient temperature at condition 20. | |
| System size for energy technology. | |
| 1 if location s is operated at the Net metering level v; otherwise, 0. | |
| temperature coefficient of power (%/°C) | |
| Solar absorption factor. | |
| Efficiency of converter and battery. | |
| Efficiency of solar panel. | |
| Efficiency of the PV module under STC (%). | |
| Efficiency of the roundtrip inverter. | |
| Sets: | |
| Set of energy technologies (solar PV = PV and G = grid). | |
| Set of all ratchets. | |
| Set of all months. | |
| Set of time steps | |
| Set of loads, for site load, for Battery load, for export. | |
| Set of net metering levels. | |
| Set of all locations. | |
References
- Das, P.; Sifatul Islam, K.; Mijan Uddin, S.M. Unlocking the Resource Potential of Livestock Waste in Bangladesh. Environ. Prog. Sustain. Energy 2023, 42, e14063. [Google Scholar] [CrossRef]
- Das, P.; Islam, K.S.; Uddin, S.M.M. Biogas Production Potential from Animal Farm Waste in Bangladesh: Case Studies of Two Selected Farms. Env. Prog. Sustain. Energy 2023, e14214. [Google Scholar] [CrossRef]
- Zhao, J.; Gao, J.; Li, W.; Qian, Y.; Shen, X.; Wang, X.; Shen, X.; Hu, Z.; Dong, C.; Huang, Q.; et al. A Combinatory Ferroelectric Compound Bridging Simple ABO3 and A-Site-Ordered Quadruple Perovskite. Nat. Commun. 2021, 12, 747. [Google Scholar] [CrossRef]
- Qiu, C.; Jiang, L.; Gao, Y.; Sheng, L. Effects of Oxygen-Containing Functional Groups on Carbon Materials in Supercapacitors: A Review. Mater. Des. 2023, 230, 111952. [Google Scholar] [CrossRef]
- Chowdhury, H.; Chowdhury, T.; Hossain, N.; Chowdhury, P.; dos Santos Mascarenhas, J.; Bhuiya, M.M. Energy, Emission, Profitability, and Sustainability Analyses of a Grid-Connected Solar Power Plant Proposed in Airport Sites of Bangladesh: A Case Study. Environ. Sci. Pollut. Res. 2021, 28, 61369–61379. [Google Scholar] [CrossRef] [PubMed]
- Miskat, M.I.; Sarker, P.; Chowdhury, H.; Chowdhury, T.; Rahman, M.S.; Hossain, N.; Chowdhury, P.; Sait, S.M. Current Scenario of Solar Energy Applications in Bangladesh: Techno-Economic Perspective, Policy Implementation, and Possibility of the Integration of Artificial Intelligence. Energies 2023, 16, 1494. [Google Scholar] [CrossRef]
- Ge, L.; Du, T.; Li, C.; Li, Y.; Yan, J.; Rafiq, M.U. Virtual Collection for Distributed Photovoltaic Data: Challenges, Methodologies, and Applications. Energies 2022, 15, 8783. [Google Scholar] [CrossRef]
- Chen, J.; Sun, B.; Li, Y.; Jing, R.; Zeng, Y.; Li, M. Credible Capacity Calculation Method of Distributed Generation Based on Equal Power Supply Reliability Criterion. Renew Energy 2022, 201, 534–547. [Google Scholar] [CrossRef]
- Sun, B.; Li, Y.; Zeng, Y.; Chen, J.; Shi, J. Optimization Planning Method of Distributed Generation Based on Steady-State Security Region of Distribution Network. Energy Rep. 2022, 8, 4209–4222. [Google Scholar] [CrossRef]
- Chowdhury, T.; Hasan, S.; Chowdhury, H.; Hasnat, A.; Rashedi, A.; Asyraf, M.R.M.; Hassan, M.Z.; Sait, S.M. Sizing of an Island Standalone Hybrid System Considering Economic and Environmental Parameters: A Case Study. Energies 2022, 15, 5940. [Google Scholar] [CrossRef]
- Radaideh, A.; Bodoor, M.; Al-Quraan, A. Active and Reactive Power Control for Wind Turbines Based DFIG Using LQR Controller with Optimal Gain-Scheduling. J. Electr. Comput. Eng. 2021, 2021, 1218236. [Google Scholar] [CrossRef]
- Stathopoulos, T.; Alrawashdeh, H.; Al-Quraan, A.; Blocken, B.; Dilimulati, A.; Paraschivoiu, M.; Pilay, P. Urban Wind Energy: Some Views on Potential and Challenges. J. Wind Eng. Ind. Aerodyn. 2018, 179, 146–157. [Google Scholar] [CrossRef]
- Alsaad, M.A. Wind Energy Potential in Selected Areas in Jordan. Energy Convers. Manag. 2013, 65, 704–708. [Google Scholar] [CrossRef]
- He, Y.; Wang, F.; Du, G.; Pan, L.; Wang, K.; Gerhard, R.; Plath, R.; Rozga, P.; Trnka, P. Revisiting the Thermal Ageing on the Metallised Polypropylene Film Capacitor: From Device to Dielectric Film. High Volt. 2023, 8, 305–314. [Google Scholar] [CrossRef]
- Zhang, X.; Wang, Y.; Yuan, X.; Shen, Y.; Lu, Z.; Wang, Z. Adaptive Dynamic Surface Control with Disturbance Observers for Battery/Supercapacitor-Based Hybrid Energy Sources in Electric Vehicles. IEEE Trans. Transp. Electrif. 2022, early access. [Google Scholar] [CrossRef]
- Wang, J.; Tian, J.; Zhang, X.; Yang, B.; Liu, S.; Yin, L.; Zheng, W. Control of Time Delay Force Feedback Teleoperation System With Finite Time Convergence. Front. Neurorobot. 2022, 16, 877069. [Google Scholar] [CrossRef] [PubMed]
- Zhang, W.; Zheng, Z.; Liu, H. Droop Control Method to Achieve Maximum Power Output of Photovoltaic for Parallel Inverter System. CSEE J. Power Energy Syst. 2022, 8, 1636–1645. [Google Scholar] [CrossRef]
- Mishra, S.; Kwasnik, T.; Anderson, K. Microgrid Resilience: A Holistic and Context-Aware Resilience Metric. Energy Syst. 2022, 1–25. [Google Scholar] [CrossRef]
- Gu, Q.; Tian, J.; Yang, B.; Liu, M.; Gu, B.; Yin, Z.; Yin, L.; Zheng, W. A Novel Architecture of a Six Degrees of Freedom Parallel Platform. Electronics 2023, 12, 1774. [Google Scholar] [CrossRef]
- Chowdhury, H.; Chowdhury, T.; Sharifi, A.; Corkish, R.; Sait, S.M. Role of Biogas in Achieving Sustainable Development Goals in Rohingya Refugee Camps in Bangladesh. Sustainability 2022, 14, 11842. [Google Scholar] [CrossRef]
- Chowdhury, H.; Chowdhury, T.; Miskat, M.I.; Hossain, N.; Chowdhury, P.; Sait, S.M. Potential of Biogas and Bioelectricity Production from Rohingya Camp in Bangladesh: A Case Study. Energy 2021, 214, 118837. [Google Scholar] [CrossRef]
- Chowdhury, T.; Chowdhury, H.; Islam, K.S.; Sharifi, A.; Corkish, R.; Sait, S.M. Resilience Analysis of a PV/Battery System of Health Care Centres in Rohingya Refugee Camp. Energy 2023, 263, 125634. [Google Scholar] [CrossRef]
- Islam, K.S.; Hasan, S.; Chowdhury, T.; Chowdhury, H.; Sait, S.M. Outage Survivability Investigation of a PV/Battery/CHP System in a Hospital Building in Texas. Sustainability 2022, 14, 14965. [Google Scholar] [CrossRef]
- Chowdhury, T.; Chowdhury, H.; Miskat, M.I.; Chowdhury, P.; Sait, S.M.; Thirugnanasambandam, M.; Saidur, R. Developing and Evaluating a Stand-Alone Hybrid Energy System for Rohingya Refugee Community in Bangladesh. Energy 2020, 191, 116568. [Google Scholar] [CrossRef]
- Masrur, H.; Sharifi, A.; Islam, M.R.; Hossain, M.A.; Senjyu, T. Optimal and Economic Operation of Microgrids to Leverage Resilience Benefits during Grid Outages. Int. J. Electr. Power Energy Syst. 2021, 132, 107137. [Google Scholar] [CrossRef]
- Marqusee, J.; Becker, W.; Ericson, S. Resilience and Economics of Microgrids with PV, Battery Storage, and Networked Diesel Generators. Adv. Appl. Energy 2021, 3, 100049. [Google Scholar] [CrossRef]
- Farthing, A.; Craig, M.; Reames, T. Optimizing Solar-Plus-Storage Deployment on Public Buildings for Climate, Health, Resilience, and Energy Bill Benefits. Env. Sci Technol. 2021, 55, 12528–12538. [Google Scholar] [CrossRef]
- Anderson, K.; Li, X.; Dalvi, S.; Ericson, S.; Barrows, C.; Murphy, C.; Hotchkiss, E. Integrating the Value of Electricity Resilience in Energy Planning and Operations Decisions. IEEE Syst. J. 2021, 15, 204–214. [Google Scholar] [CrossRef]
- Becker, W.; Christensen, D.; Cutler, D.; Maguire, J.; McCabe, K.; Reese, S.; Speake, A. Technoeconomic Design of a Geothermal-Enabled Cold Climate Zero Energy Community. J. Energy Resour. Technol. Trans. ASME 2021, 143, 100902. [Google Scholar] [CrossRef]
- Nguyen, N.; Mitra, J. An Investigation into the Role of Gas Turbines in Supporting Renewable Energy Integration. In Proceedings of the 2018 North American Power Symposium, Fargo, ND, USA, 9–11 September 2018. [Google Scholar] [CrossRef]
- Mitra, J.; Nguyen, N. Grid-Scale Virtual Energy Storage to Advance Renewable Energy Penetration. IEEE Trans. Ind. Appl. 2022, 58, 7952–7965. [Google Scholar] [CrossRef]
- Pandit, D.; Muhtadi, A.; Nguyen, N.; Mitra, J. Design Optimization of Microgrid Incorporating Battery Exchange-Based Electric Vehicles. Conference Record—IAS Annual Meeting. In Proceedings of the IEEE Industry Applications Society, Vancouver, BC, Canada, 10–14 October 2021. [Google Scholar] [CrossRef]
- Muhtadi, A.; Pandit, D.; Nguyen, N. Financial Feasibility and Emission Analysis of Entirely Renewable Sources Based Stand-Alone Energy System. In Proceedings of the 2020 52nd North American Power Symposium, Tempe, AZ, USA, 11–13 April 2021. [Google Scholar] [CrossRef]
- Chowdhury, H.; Chowdhury, T.; Rahman, M.S.; Masrur, H.; Senjyu, T. A Simulation Study of Techno-Economics and Resilience of the Solar PV Irrigation System against Grid Outages. Environ. Sci. Pollut. Res. 2022, 29, 64846–64857. [Google Scholar] [CrossRef] [PubMed]
- Anderson, K.; Grymes, J.; Newman, A.; Warren, A. North Carolina Water Utility Builds Resilience with Distributed Energy Resources. INFORMS J. Appl. Anal. 2022. ahead of print. [Google Scholar] [CrossRef]
- Laws, N.D.; Anderson, K.; DiOrio, N.A.; Li, X.; McLaren, J. Impacts of Valuing Resilience on Cost-Optimal PV and Storage Systems for Commercial Buildings. Renew Energy 2018, 127, 896–909. [Google Scholar] [CrossRef]
- Simpkins, T.; Anderson, K.; Cutler, D.; Olis, D. Optimal Sizing of a Solar-Plus-Storage System For Utility Bill Savings and Resiliency Benefits. In Proceedings of the 2016 IEEE Power & Energy Society Innovative Smart Grid Technologies Conference (ISGT), Minneapolis, MN, USA, 6–9 September 2016. [Google Scholar]
- Rafa, N.; To, T.T.; Van Gupta, M.; Uddin, S.M.N. The Pursuit of Energy in Refugee Contexts: Discrimination, Displacement, and Humanitarian Energy Access for the Rohingya Refugees Displaced to Bangladesh. Energy Res. Soc. Sci. 2022, 83, 102334. [Google Scholar] [CrossRef]
- Shen, C.; Zhao, K.; Ge, J.; Zhou, Q. Analysis of Building Energy Consumption in a Hospital in the Hot Summer and Cold Winter Area. Energy Procedia 2019, 158, 3735–3740. [Google Scholar] [CrossRef]
- Ericson, S.; Cox, J.; Abdelmalak, M.; Rabinowitz, H.; Hotchkiss, E. Exceedance Probabilities and Recurrence Intervals for Extended Power Outages in the United States; National Renewable Energy Lab. (NREL): Golden, CO USA, 2022. [CrossRef]
- Xie, X.; Sun, Y. A Piecewise Probabilistic Harmonic Power Flow Approach in Unbalanced Residential Distribution Systems. Int. J. Electr. Power Energy Syst. 2022, 141, 108114. [Google Scholar] [CrossRef]
- Xu, X.; Lin, Z.; Li, X.; Shang, C.; Shen, Q. Multi-Objective Robust Optimisation Model for MDVRPLS in Refined Oil Distribution. Int. J. Prod. Res. 2021, 60, 6772–6792. [Google Scholar] [CrossRef]
- Cao, B.; Dong, W.; Lv, Z.; Gu, Y.; Singh, S.; Kumar, P. Hybrid Microgrid Many-Objective Sizing Optimization with Fuzzy Decision. IEEE Trans. Fuzzy Syst. 2020, 28, 2702–2710. [Google Scholar] [CrossRef]
- REopt Web Tool User Guides|NREL. Available online: https://reopt.nrel.gov/user-guides.html (accessed on 22 May 2023).
- Chowdhury, N.; Hossain, C.A.; Longo, M.; Yaïci, W. Optimization of Solar Energy System for the Electric Vehicle at University Campus in Dhaka, Bangladesh. Energies 2018, 11, 2433. [Google Scholar] [CrossRef] [Green Version]
- Huang, N.; Zhao, X.; Guo, Y.; Cai, G.; Wang, R. Distribution Network Expansion Planning Considering a Distributed Hydrogen-Thermal Storage System Based on Photovoltaic Development of the Whole County of China. Energy 2023, 278, 127761. [Google Scholar] [CrossRef]
- Huang, X.M.; Chen, N.; Ye, D.N.; Zhong, A.G.; Liu, H.; Li, Z.; Liu, S.Y. Structurally Complementary Star-Shaped Unfused Ring Electron Acceptors with Simultaneously Enhanced Device Parameters for Ternary Organic Solar Cells. Sol. RRL 2023, 7, 2300143. [Google Scholar] [CrossRef]
- Hu, T.; Ma, H.; Sun, H.; Liu, K. Electrochemical-Theory-Guided Modeling of the Conditional Generative Adversarial Network for Battery Calendar Aging Forecast. IEEE J. Emerg. Sel. Top. Power Electron. 2023, 11, 67–77. [Google Scholar] [CrossRef]
- Dang, W.; Liao, S.; Yang, B.; Yin, Z.; Liu, M.; Yin, L.; Zheng, W. An Encoder-Decoder Fusion Battery Life Prediction Method Based on Gaussian Process Regression and Improvement. J. Energy Storage 2023, 59, 106469. [Google Scholar] [CrossRef]
- Zhang, X.; Xiong, Y.; Pan, Y.; Du, H.; Liu, B. Crushing Stress and Vibration Fatigue-Life Optimization of a Battery-Pack System. Struct. Multidiscip. Optim. 2023, 66, 48. [Google Scholar] [CrossRef]
- Zhang, X.; Tang, Y.; Zhang, F.; Lee, C.-S.; Zhang, X.L.; Tang, Y.B.; Zhang, F.; Lee, C. A Novel Aluminum–Graphite Dual-Ion Battery. Adv. Energy Mater. 2016, 6, 1502588. [Google Scholar] [CrossRef] [Green Version]
- Lagrange, A.; de Simón-Martín, M.; González-Martínez, A.; Bracco, S.; Rosales-Asensio, E. Sustainable Microgrids with Energy Storage as a Means to Increase Power Resilience in Critical Facilities: An Application to a Hospital. Int. J. Electr. Power Energy Syst. 2020, 119, 105865. [Google Scholar] [CrossRef]
- Rosales-Asensio, E.; de Simón-Martín, M.; Borge-Diez, D.; Blanes-Peiró, J.J.; Colmenar-Santos, A. Microgrids with Energy Storage Systems as a Means to Increase Power Resilience: An Application to Office Buildings. Energy 2019, 172, 1005–1015. [Google Scholar] [CrossRef]
- Zhu, L.; Li, Z.; Hou, K. Effect of Radical Scavenger on Electrical Tree in Cross-Linked Polyethylene with Large Harmonic Superimposed DC Voltage. High Volt. 2022, early view. [Google Scholar] [CrossRef]
- Lu, L.; Wu, W.; Gao, Y.; Pan, C.; Yu, X.; Zhang, C.; Jin, Z. Study on Current Discrepancy and Redistribution of HTS Non-Insulation Closed-Loop Coils during Charging/Discharging and Subsequent Transient Process toward Steady-State Operation. Supercond. Sci. Technol. 2022, 35, 095001. [Google Scholar] [CrossRef]
- Akinyele, D.; Belikov, J.; Levron, Y. Challenges of Microgrids in Remote Communities: A STEEP Model Application. Energies 2018, 11, 432. [Google Scholar] [CrossRef] [Green Version]
- Yan, Z.; Wen, H. Electricity Theft Detection Base on Extreme Gradient Boosting in AMI. IEEE Trans. Instrum. Meas. 2021, 70, 2504909. [Google Scholar] [CrossRef]


| Model Rate (for 11 kV Line) | Grid Power Price (USD/kWh) | Demand Rate (USD/kW/month) | Sell Back Rate (USD/kWh) |
|---|---|---|---|
| Off-peak | 0.085 | 0.577 | 0.050 |
| Flat rate | 0.094 | 0.577 | 0.060 |
| Peak | 0.120 | 0.577 | 0.080 |
| Parameters | Business as Usual (BaU) | Resilience | Financial |
|---|---|---|---|
| Average Annual PV Energy Production | 7859 MWh | 5049 MWh | |
| Average Annual Energy Supplied from Grid | 8140 MWh | 2232 MWh | 4688 MWh |
| Total CO2 Emissions in Year 1 | 4947 tons | 1357 tons | 2849 tons |
| Year 1 Utility Electricity Cost—Before Tax | |||
| Utility Energy Cost | USD 976,740 | USD 267,817 | USD 562,526 |
| Utility Demand Cost | USD 9561 | USD 4544 | USD 9146 |
| Total Life-Cycle Costs | USD 11,809,978 | USD 8,853,241 | USD 8,217,548 |
| Payback Period | N/A | 6.37 years | 2.1 years |
| Internal Rate of Return | N/A | 12.2% | 38.8% |
Disclaimer/Publisher’s Note: The statements, opinions and data contained in all publications are solely those of the individual author(s) and contributor(s) and not of MDPI and/or the editor(s). MDPI and/or the editor(s) disclaim responsibility for any injury to people or property resulting from any ideas, methods, instructions or products referred to in the content. |
© 2023 by the authors. Licensee MDPI, Basel, Switzerland. This article is an open access article distributed under the terms and conditions of the Creative Commons Attribution (CC BY) license (https://creativecommons.org/licenses/by/4.0/).
Share and Cite
Amin, S.M.M.; Hasnat, A.; Hossain, N. Designing and Analysing a PV/Battery System via New Resilience Indicators. Sustainability 2023, 15, 10328. https://doi.org/10.3390/su151310328
Amin SMM, Hasnat A, Hossain N. Designing and Analysing a PV/Battery System via New Resilience Indicators. Sustainability. 2023; 15(13):10328. https://doi.org/10.3390/su151310328
Chicago/Turabian StyleAmin, S M Mezbahul, Abul Hasnat, and Nazia Hossain. 2023. "Designing and Analysing a PV/Battery System via New Resilience Indicators" Sustainability 15, no. 13: 10328. https://doi.org/10.3390/su151310328