Article

Experimental Modeling of CO2 Sorption/Desorption Cycle with MDEA/PZ Blend: Kinetics and Regeneration Temperature

1
Earth Science Department, University of Turin, Via Valperga Caluso, 35, 10125 Torino, Italy
2
Ecospray Technologies Srl, Via Circonvallazione, 14/14A, 15050 Alzano Scrivia, Italy
*
Author to whom correspondence should be addressed.
Sustainability 2023, 15(13), 10334; https://doi.org/10.3390/su151310334
Submission received: 4 May 2023 / Revised: 21 June 2023 / Accepted: 28 June 2023 / Published: 29 June 2023

Abstract

:
CO2 sorption–desorption cycles with a methyldiethanolamine (MDEA)/piperazine (PZ) blend have been performed with a rotoevaporator. Similar to other CO2 separation technologies, the heating involved in MDEA/PZ solvent regeneration is the most energy-intensive step in the overall CO2 separation process. Thus, this study investigated the desorption kinetics under low-pressure (<200 mbar) and low-temperature conditions in the range from 308 to 363 K with the aim of reducing costs. The CO2 desorption time to unload the samples from ~2.35 mol/kg to below the threshold of 1 mol/kg was reduced from 500 s at 333 K to 90 s at 363 K. The Avrami–Erofoyev model was found to fit the experimental kinetic data accurately. The Arrhenius law calculations provided an activation energy of the CO2 desorption process equal to 76.39 kJ/mol. It was demonstrated that the combination of a pressure reduction and the increase in temperature resulted in an enhancement of the desorption kinetics, especially at low temperatures. The combined effect of these two factors resulted in higher desorption kinetics compared to the individual effects of either factor alone. Solvent regeneration at a low temperature was demonstrated to be a valid option when coupled with pressure reduction.

1. Introduction

Stationary point sources such as fossil fuel-fired power plants, industrial processes like cement production, and waste incinerators represent the largest contributors to CO2 emissions, thereby exerting a significant impact on global climate change. Stationary point sources are collectively responsible for ~65% of the global greenhouse gas emissions [1]. Chemical ab-/adsorption is the most widely used technique of CO2 removal from flue gas. Utilizing an amine-based solvent offers a post-combustion CO2 capture method that distinguishes itself from others due to its high selectivity for carbon dioxide and its ability to regenerate the solvent. These advantages make it a distinct and advantageous strategy. Additionally, both ab-/adsorption (hereafter “sorption”) and regeneration columns can be retrofitted to plants, thus making amine-based capture among the most common methods for capturing CO2 from power plants [2]. In the contemporary era, amine-based technology has achieved a high degree of maturity and is the only method of CO2 capture that has been applied so far at a wholesale scale for natural gas processing, methane upgrading, hydrogen purification and removal of CO2 from industrial flue gases [3]. Capturing CO2 through amine is deeply affected by the choice of the solvent, a decision that influences the resulting reaction kinetics, the energy of regeneration and the degradation of the active solution [4]. Among the numerous solvents used as a CO2 sorbent, the present study focuses on the piperazine (PZ)-activated aqueous methyldiethanolamine (MDEA) solution. This blend (MDEA/PZ) offers advantages over the use of monoethanolamine (MEA) and MDEA alone due to its resistance to thermal and chemical degradation, as well as its high CO2 capture capacity at typical sorption/stripping conditions [5,6]. However, MDEA exhibits a slower reaction rate with CO2 compared to other alkanolamines. Consequently, MDEA solutions are commonly activated via the incorporation of a reaction kinetics promoter, such as PZ [7], to enhance the reaction rate. Nonetheless, the significant cost associated with sorbent regeneration remains one of the major hurdles in chemical sorption processes. Typically, high temperatures ranging from 383 to 453 K [8] are employed for desorption, which contributes to the overall expense. In order to address this issue, scholars have explored alternative approaches such as a membrane vacuum system [9,10] in order to minimize the desorption temperature as much as possible. This innovative technique has the potential to reduce costs by employing lower temperatures during the regeneration process.
While most of the recent amine-based CO2 capture studies focus on sorption and/or its thermodynamics, primarily via software simulations, e.g., with Aspen programs [11,12,13,14,15], comparatively little attention has been paid to the reaction kinetics of the CO2 sorption and desorption cycles with the MDEA/PZ blend [16]. This aspect plays an important role in obtaining further insights into the CO2 sorption/desorption mechanism for the purpose of boosting enhancements of the related technology [17].
In this light, the present study aims to improve the sustainability of the MDEA/PZ-based CO2 sorption–desorption/regeneration cycle. Specifically, our efforts are directed towards the establishment of a correlation between desorption reaction kinetics and relatively low desorption/regeneration temperatures ranging from 308 to 363 K. In addition, we explore the utilization of low pressure to force desorption, while preserving the active solution from degradation to as great an extent as is possible.

General Kinetic Mechanism

The reaction mechanism behind CO2 sorption by a MDEA/PZ mixture was described by [18]. Ref. [19] argued that, in an aqueous MDEA solution, bicarbonate formation and MDEA protonation are rate-limiting for the reaction with CO2. Moreover, [20] showed that the carbamate PZCOO- and dicarbamate PZ(COO-)2 formation are rate-limiting in a solvent containing PZ. Amine-driven CO2 capture reaction equilibrium is formalized by the equation below:
CO2 + Amf + H2O ⇔ CO2-Am + H2O
where Amf and CO2-Am are CO2-free amine and CO2-sorbed amine, respectively.
A fraction of CO2 is sorbed onto amine, whereas another fraction remains physically dissolved through the solvent as a function of the weak chemical bonding of carbon dioxide with the solvent functional groups [21]. Physical sorption [4] varies with the CO2 solubility, the CO2 partial pressure and the temperature of sorption [22]. Chemical sorption depends upon the stoichiometry of the CO2/solvent functional groups reaction and the concentration of the reagents. In the present study, we use the term “desorption of CO2” to signify the induced process of breaking bonds and allowing carbon dioxide to leave the amine blend, an undertaking with the potential to regenerate the sorption capacity of the latter, and to prevent the occurrence of degradation via the decomposition of the CO2–amine system into carbamate/bicarbonate [17,23].

2. Materials and Methods

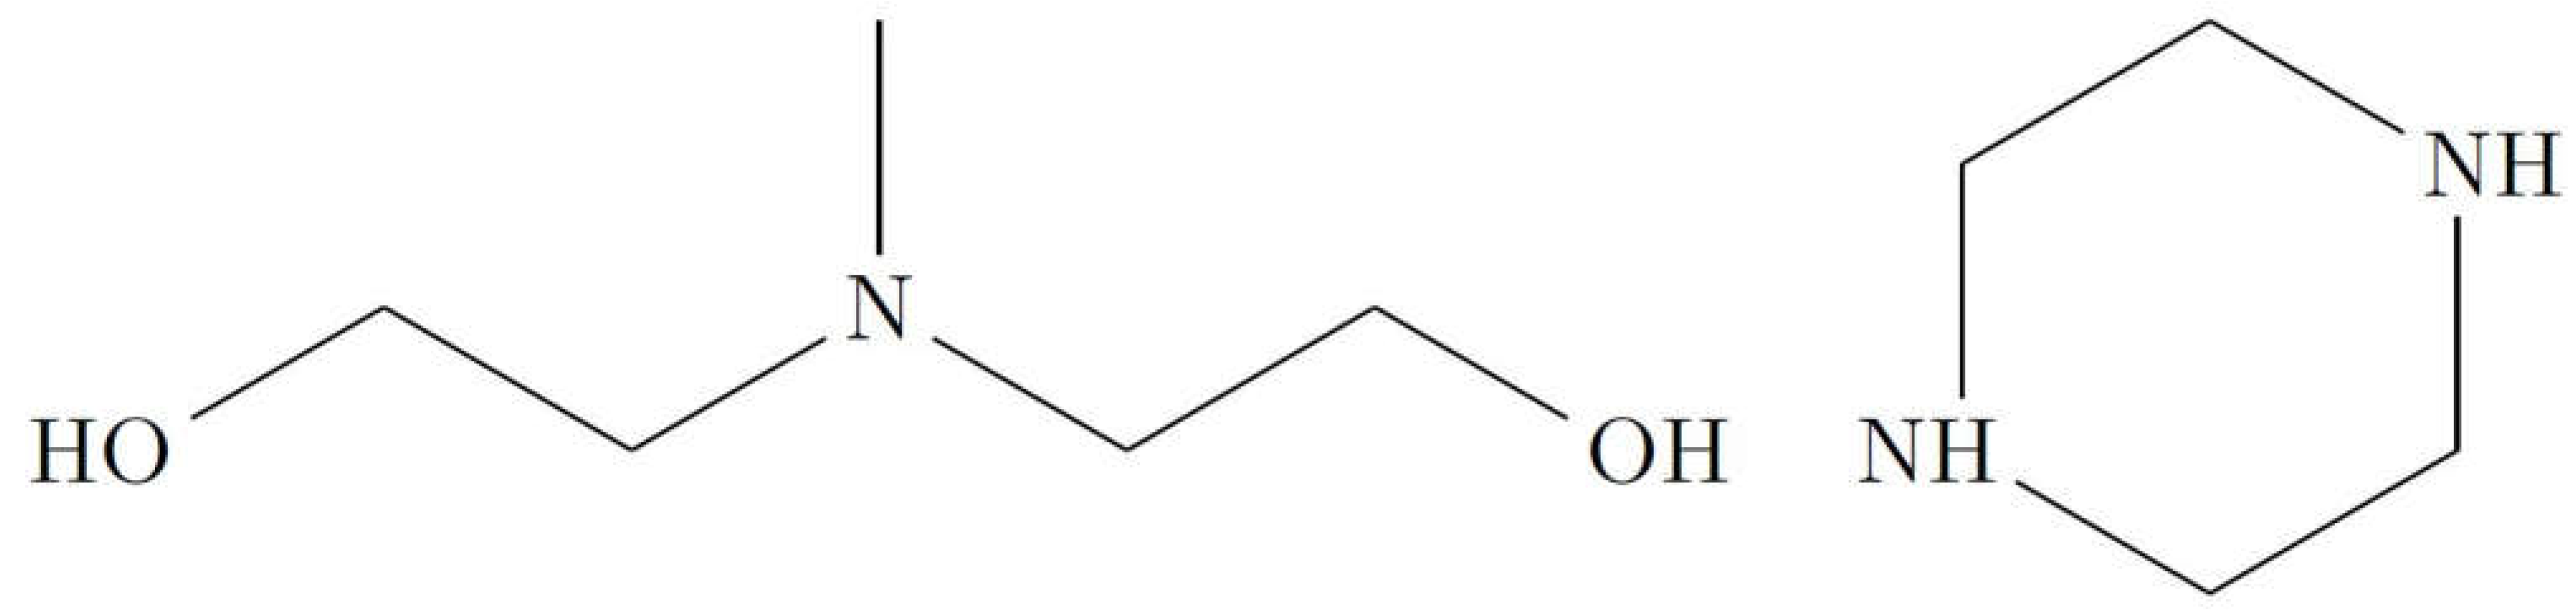
2.1. Chemical Reagents

The experiments were performed with an industrial amine blend aqueous solution (AmPZ hereafter) with a molarity of 3.73 mol/kg (methyldiethanolamine 28.11 wt.%, piperazine 11.85 wt.%). CO2 was provided by Gruppo Sapio Srl at a purity of 99.9 %. The amine blend aqueous solution is selected for its amine molarity in the optimal range of CO2 sorption efficiency [24]. MDEA, also known as 2,2′-Methyliminodiethanol or N,N-Bis(2-hydroxyethyl)methylamine, has a chemical formula of C5H13NO2. It is a tertiary amine compound with a molar mass of 119.16 g/mol and a density of 1.038 g/cm3. Piperazine, or 1,4-Diazacyclohexane, is a secondary diamine with a chemical formula of C4H10N2. It has a molar mass of 86.14 g/mol and a density of 1.1 g/cm3. Its topological formulae are shown in Figure 1.

2.2. Laboratory Equipment

The experiments were designed using a roto-evaporator IKA 3 RV eco, equipped with a heating bath up to 373 K, a speed range of 20 to 300 rpm, and a high-efficiency condenser with 1500 cm2 cooling surface. The gas–liquid interfacial area was determined geometrically such as A = 339.7 cm2. A Welch pump was provided by Gardner Denver. CO2 pressure and flows were measured and controlled by a Bronkhorst modular system, composed of: a mass stream (“valve” hereafter) (MFC D-6321), with a maximum flow range of 2 Ln/min CO2 and accuracy ± 1.0% RD plus ± 0.5% FS; a low ∆p (“flow meter” hereafter) F101E (max flow range of 3 Ln/min CO2 and accuracy ± 1.0% FS); and an El-Press (“pressure meter” hereafter) P-700 digital electronic backward pressure controller calibrated between 0.28 and 1.7 bar for the measurement of the distiller pressure. A digital PC board provides self-diagnostics, alarm and counter functions, digital communication (RS232), and remotely adjustable control settings, and an onboard interface based on the FLOW-BUS protocol makes it possible to communicate via a multi-bus system. The combination and operating sequence of the Bronkhorst devices depend on whether the sorption or desorption mode is being run, as we shall discuss below. Sorption/desorption data acquisition was performed every 5th second. pH and EC (electrolytical conductivity, µS/cm) of the amine samples were measured by a Hanna HI H-ORP meter and a Mettler Toledo Five Easy EC-meter, respectively. The samples’ masses were measured with a precision of ±0.1%.

2.3. Experimental Procedure

Each experiment was carried out on 100 g AmPZ, prepared using the chemical reagents mentioned above. Preliminary tests proved that ten consecutive CO2 sorption (6 min)/desorption (10 min) cycles were sufficient to describe the capture–release cycle of the active solution. In particular, the sorption rate falls below 50% at t > 6 min (low efficiency regime), whereas at t = 10 min, desorption has achieved its completion. The background of the experimental setup was estimated by sorption/desorption blank cycles, using the solutions described in Section 2.3.1. The same “distiller” was used as a hybrid reactor for both sorption and desorption steps, as shown in Figure 2, in order to eliminate any handling of the solution and reduce subsequent weight losses. Both the sorption/desorption apparatus and the related procedures are reported in Section 2.3.2 and Section 2.3.3, respectively.
The experimental parameters are laid out in Table 1. Experimental runs were performed, changing desorption temperature in the range of 308 to 363 K, and keeping pressure <200 mbar. An additional suite of runs was carried out at 1 atm, sharing the same thermal interval mentioned above to bring to light the effect of pressure reduction.

2.3.1. Blank Experiments

Several series of “blank” sorption/desorption experiments were performed in the empty reactor, using the procedures described in the ensuing sections, in order to correctly calibrate the setup. The average sample weight loss (mloss) due to pump suction over ten desorption steps was measured with 100 g AmPZ for temperatures ranging from 308 to 363 K. mloss was observed to be weakly sensitive to T and estimated to be about 0.6 g/cycle. Another series of “blank” experiments was performed in the empty reactor in sorption mode as a function of the inflow in order to calibrate gas valve and flow meter measurements. A linear proportionality was observed to hold between flow measurements at the valve and flow meter, with the result that FLOW_BLANKvalve = kcal· FLOW_BLANKflow meter.

2.3.2. Sorption Mode Protocol

The thermostatic bath was pre-heated at 308 K. At t0, the A-vessel rotation speed was set at 120 rpm and the system “A-vessel + amine” was submerged into the thermostatic bath. Simultaneously, a flow (L/min; normalized to room pressure) of CO2 was conveyed through a pipe to the A-vessel. The CO2 flow at the inlet of the reactor was both controlled and recorded by the valve, while the CO2 flow at the outlet was recorded by the flow meter. CO2 sorption step duration was set to be equal to 6 min. At t = 6 min, the A-vessel was removed from the thermostatic bath and separated from the distiller rotating arm. The vessel’s external walls were dried, and the system composed of “A-vessel + amine + CO2” was equilibrated at room temperature and weighed, thus enabling the determination of the carbon dioxide mass trapped within. EC and pH were systematically measured after each sorption and desorption step. The system “A-vessel + amine + CO2” was then reassembled with the distiller. The valve was closed, and the experimental setup was switched to the desorption mode.

2.3.3. Desorption Mode Protocol

The thermostatic bath was pre-heated at a given temperature (308, 323, 333, 343, 353 and 363 K). At t0, the A-vessel rotation speed was set at 120 rpm and the “A-vessel + amine + CO2” system was immersed into the heated thermostatic bath; every desorption step lasted 10 min. At t0, the flow meter and the pressure meter data acquisition started, and the diaphragm pump was turned on. The internal pressure P0 of the reactor was recorded by the pressure meter. At t = 10 min, the B-vessel was removed from the distiller column. The A-vessel was also removed from the thermostatic bath and separated from the distiller’s rotating arm. The vessel’s external walls were dried and the whole “A-B-vessels + amine + CO2” was equilibrated at room temperature and weighed. In so doing, we were able to determine initial and final CO2 concentrations in the sample, accounting also for the average weight loss established by the “blank” experiments, as stated above. The distillate was then transferred from the B-vessel to A-vessel to produce a homogeneous solution, and both vessels were reassembled with the distiller. The valve was opened to switch back the system to the sorption.

2.3.4. Data treatment

As stated in Section 2.3.2, valve and flow meter allowed us to measure the CO2 flows at the inlet and outlet of the reactor, respectively. In doing so, the instantaneous sorption rate as a function of time η(t)j at the jth-cycle was calculated, according to the equation:
η t j = 100 × 1 k c a l × μ t s o r , j Β t j  
where B(t) (L/min) = mass stream recording of the inflow (sorption mode); μ(t)sor (L/min) = flow meter recording of the outflow (sorption mode); and kcal: calibration factor defined in Section 2.3.1. Note that η includes the fractions of CO2 that are either actually sorbed by amine or dissolved into the active solution. The average of Equation (2) over N cycles is given by Equation (3)
η t = 1 N j = 1 N η t j
Note that, in addition to μ(t)sor, we also introduce the outflow in desorption mode, i.e., μ(t)des, which is used to investigate the desorption kinetics.
V C O 2   s o r , j and V C O 2   d e s , j are the sorbed and desorbed CO2 volumes at room pressure over the sorption (Δtsor,j) and desorption(Δtdes,j) jth-step, calculated using the following equations:
V C O 2   s o r , j = 0 t s o r , j η t j × B t j d t
and
V C O 2   d e s , j = 0 Δ t d e s , j μ t j d e s d t
The averages over the full series of 10 cycles of the quantities calculated by Equations (4) and (5) are referred to by V ¯ CO2 sor and V ¯ CO2 des, i.e.,
V ¯ C O 2   s o r = 1 N j = 1 N V C O 2 s o r , j  
and
V ¯ C O 2   d e s = 1 N j = 1 N V C O 2 d e s , j  
The raw CO2 mass transfer, ωCO2, is defined by the equations
ω C O 2   s o r , j = m s o r , j m d e s , j 1  
and
ω C O 2   d e s , j = m d e s , j m d e s , j  
where msor,j and mdes,j are the active solution’s masses measured after sorption and desorption, at the jth-cycle, respectively.
The average exchange capacity, Δ ω ¯ , is given by
Δ ω ¯ = j = 1 N ω C O 2   d e s , j j = 1 N ω C O 2   s o r , j × 100  
Eventually, we introduce CO2 loading, aj (mol/kg), defined as the net CO2 moles in the sample per active solution mass unity at the jth-cycle of sorption/desorption, i.e.,
a j = m s o r / d e s , j M C O 2 × m 0
where msor/des,j = net mass of CO2 trapped in the system, MCO2 = CO2 molar mass and m0 = initial mass of the active solution, at the jth cycle.
The residual CO2 loading, i.e., Res(t), has been calculated upon desorption by the relationship reported below:
R e s t = a ¯ s o r 0 t μ d e s t d t 0 μ d e s t d t × a ¯
where: a ¯ = average <asor,j-ades,j>j over sorption/desorption cycles; a ¯ s o r = average of the CO2 loading after sorption.

3. Results

3.1. Sorption–Desorption Cycles’ General Characterization

Figure 3A provides a visual representation of the sorption–desorption cycles’ behavior in terms of CO2 loading. Only experiments A1, A3 and A6, conducted at 308 K, 333 K and 363 K, respectively, are shown, as they represent average and extreme desorption temperatures. The CO2 loading/unloading cycles show a trend characterized by “oscillations”, reflecting the processes of trapping/releasing carbon dioxide. The amplitude of each oscillation is related to the desorption temperature. This is in keeping with the CO2 exchange capacity, ω ¯ of Equation (10), which increases linearly with desorption temperature (Figure 3B). The relevant effect of the desorption temperature on the CO2 exchange capacity is made apparent by the fact that a ΔT-change < 60 K, from 308 to 363 K, yields an increase in ω ¯ from ~20 to about 99%, hinting at a very low degree of active solution degradation within the explored operating conditions.
The average over the A-experiments of the sorption cycle at 308 K is reported by Figure 4. The low value of the standard deviation indicates the high repeatability of such a process. η(t) decreases with time, as expected, because of the progressive saturation of the amine’s capacity to sorb CO2. Saturation is predicted to take place at about 510–520 s, from extrapolation of the quasi-linear trend shown in Figure 4 for sorption time >360 s.

3.2. Kinetics

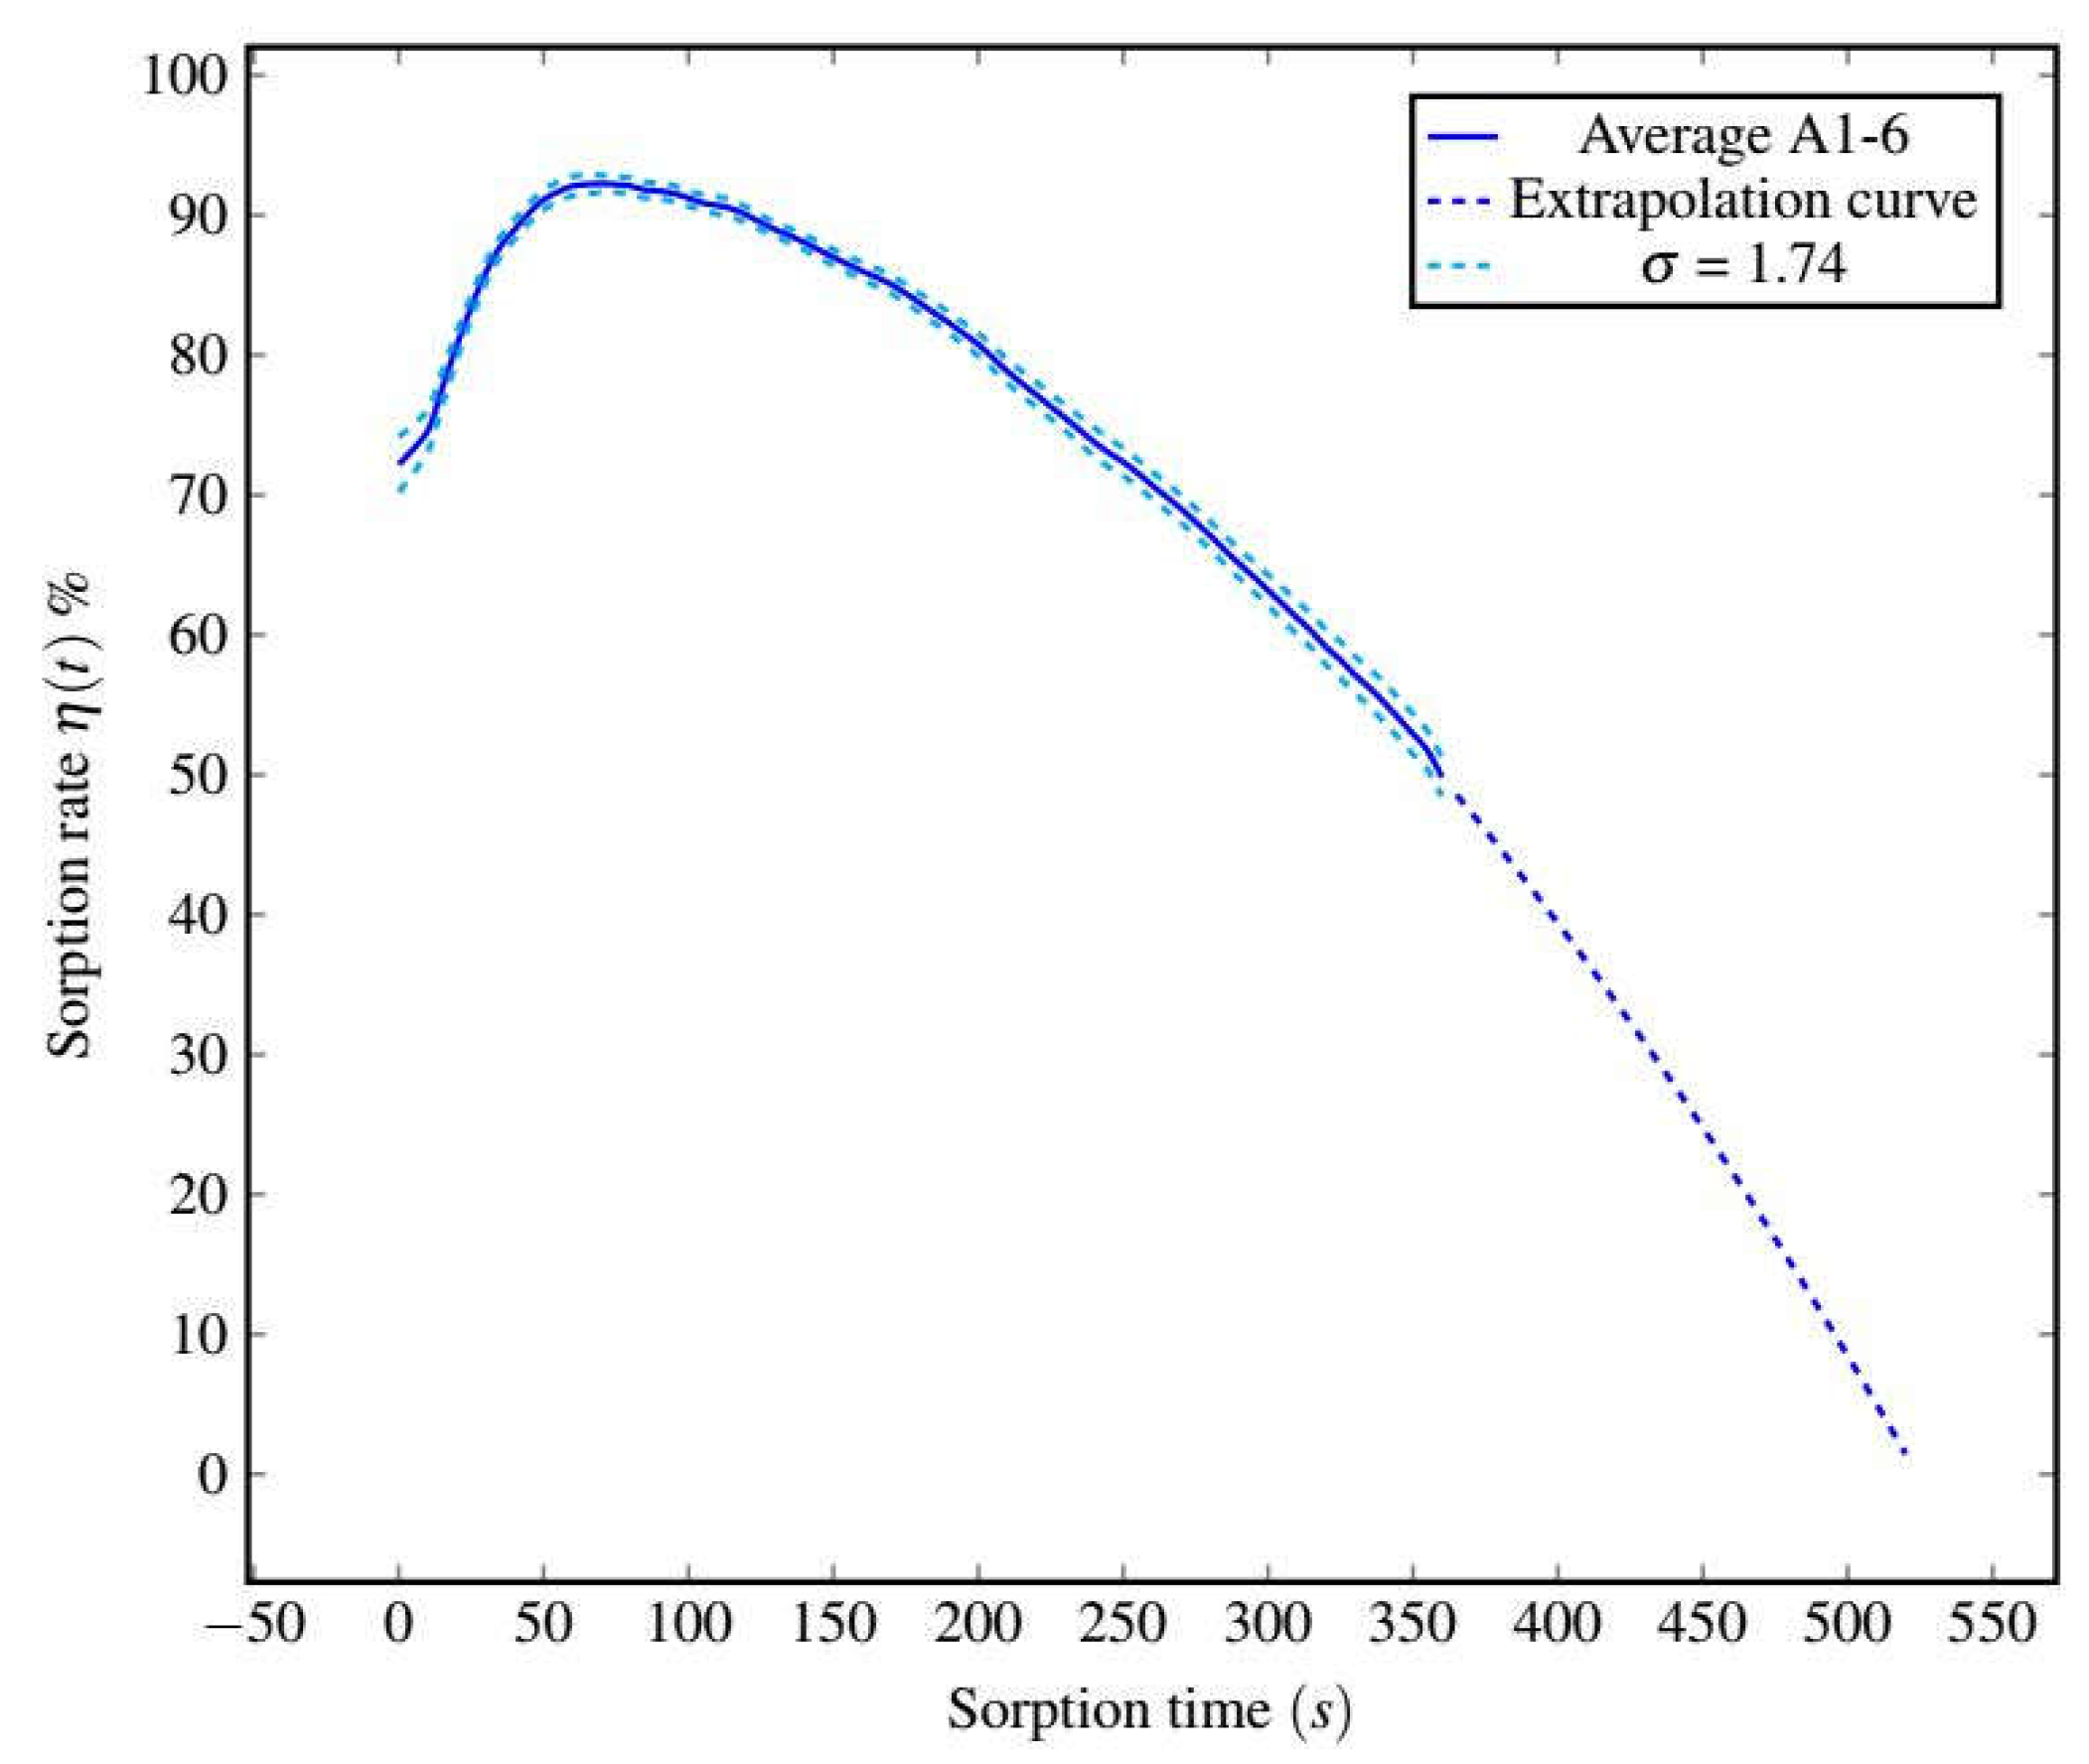
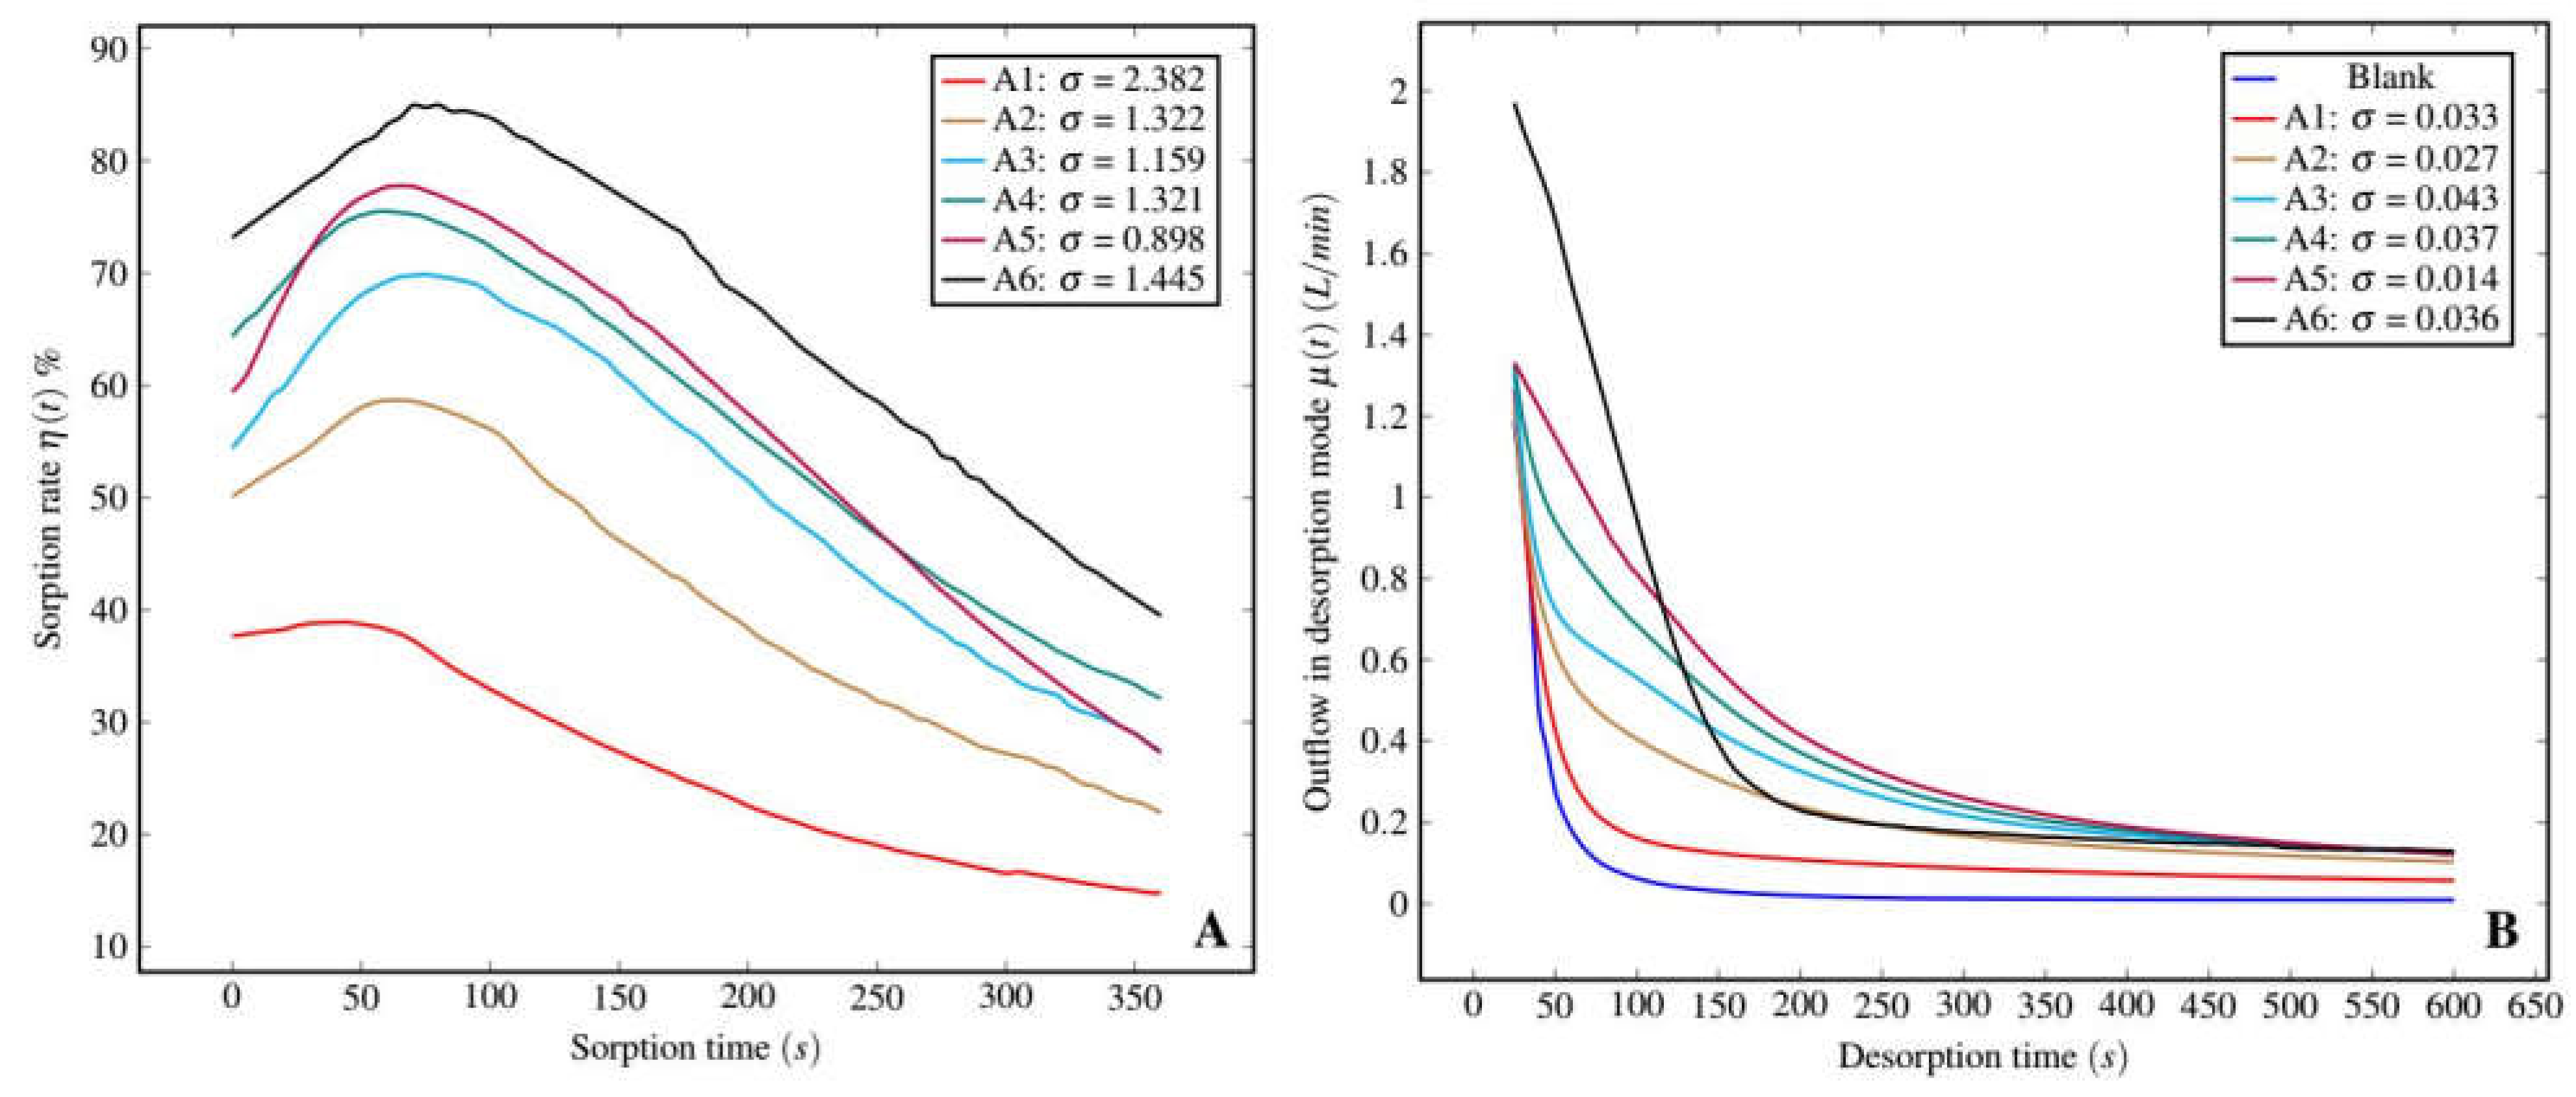
3.2.1. Experimental Results

The sorption rate, η(t), and desorption flow, µ(t)des, are plotted in Figure 5 in the T-range of 308 to 363 K. Table 2 reports the related average sorption and desorption volumes, V ¯ CO2 sor (Equation (4)) and V ¯ CO2 des (Equation (5)), respectively. We introduce μ ¯ (t ≤ 150), i.e., the average desorption outflow at a low desorption time, as most of the desorption reaction occurs over the 0–150 s interval. Additionally, we also define the “average mass differentiation”, m ¯ diff, corresponding to the mean fraction of amine mass transferred from vessel-A to vessel-B (Figure 2), during desorption, i.e., m ¯ diff = <mvessel-B/mvessel-A+CO2> × 100.
In general, the η-curves of Figure 5A exhibit similar trends, i.e., a η(t) increase is followed by a quasi-linear decrease, thus illustrating that the rate of reaction slows down as the CO2 loading in the solution increases and the concentration of CO2-free amine [Amf] decreases. η(t) depends on the efficiency of the preceding desorption process, which, in turn, is affected by the temperature used for boosting desorption.
Likewise, all of the µdes-curves share qualitatively similar patterns. The µdes-average over the 0–150 s interval ranges between 0.12 and 0.82 L/min. Note that the desorption process at 363 K exhibits a trend that, although it is in general coherence with those of the other isotherms, still displays differences. This reflects the substantial increase in the differentiation of the liquid phase, i.e., m ¯ diff, that passes from, 0.8 wt.% at 353 K to 47.4 wt.% at 363 K, the latter value corresponding to the boiling point of water at p = 700 mbar. This sharp increase is related to the substantial sample evaporation occurring primarily at a short desorption time (t < 150 s) and leading to fast CO2 desorption driven by thermal effects. The latter yields an increase in the molecular mobility of CO2 at a high temperature and a concurrent increase in the CO2 concentration in the liquid phase due to sample evaporation.
The joint effects of pressure and temperature on desorption kinetics are displayed by Figure 6, in which the Δμ(t) curve of the experimental series A and B, i.e.,
μ t = μ t 323 363   K ; P μ t 308   K ; P 0  
are shown.
A reduction in pressure leads to a general acceleration of the desorption kinetics, thus allowing for a thermal energy saving to break the adsorbent–adsorbate bonds. On average, a pressure reduction (1 bar → ~0.2 bar) boosts desorption by ~16.3% at 363 K, up to ~70.5% at 323 K (calculations from Figure 6), in keeping with the observations of [25].

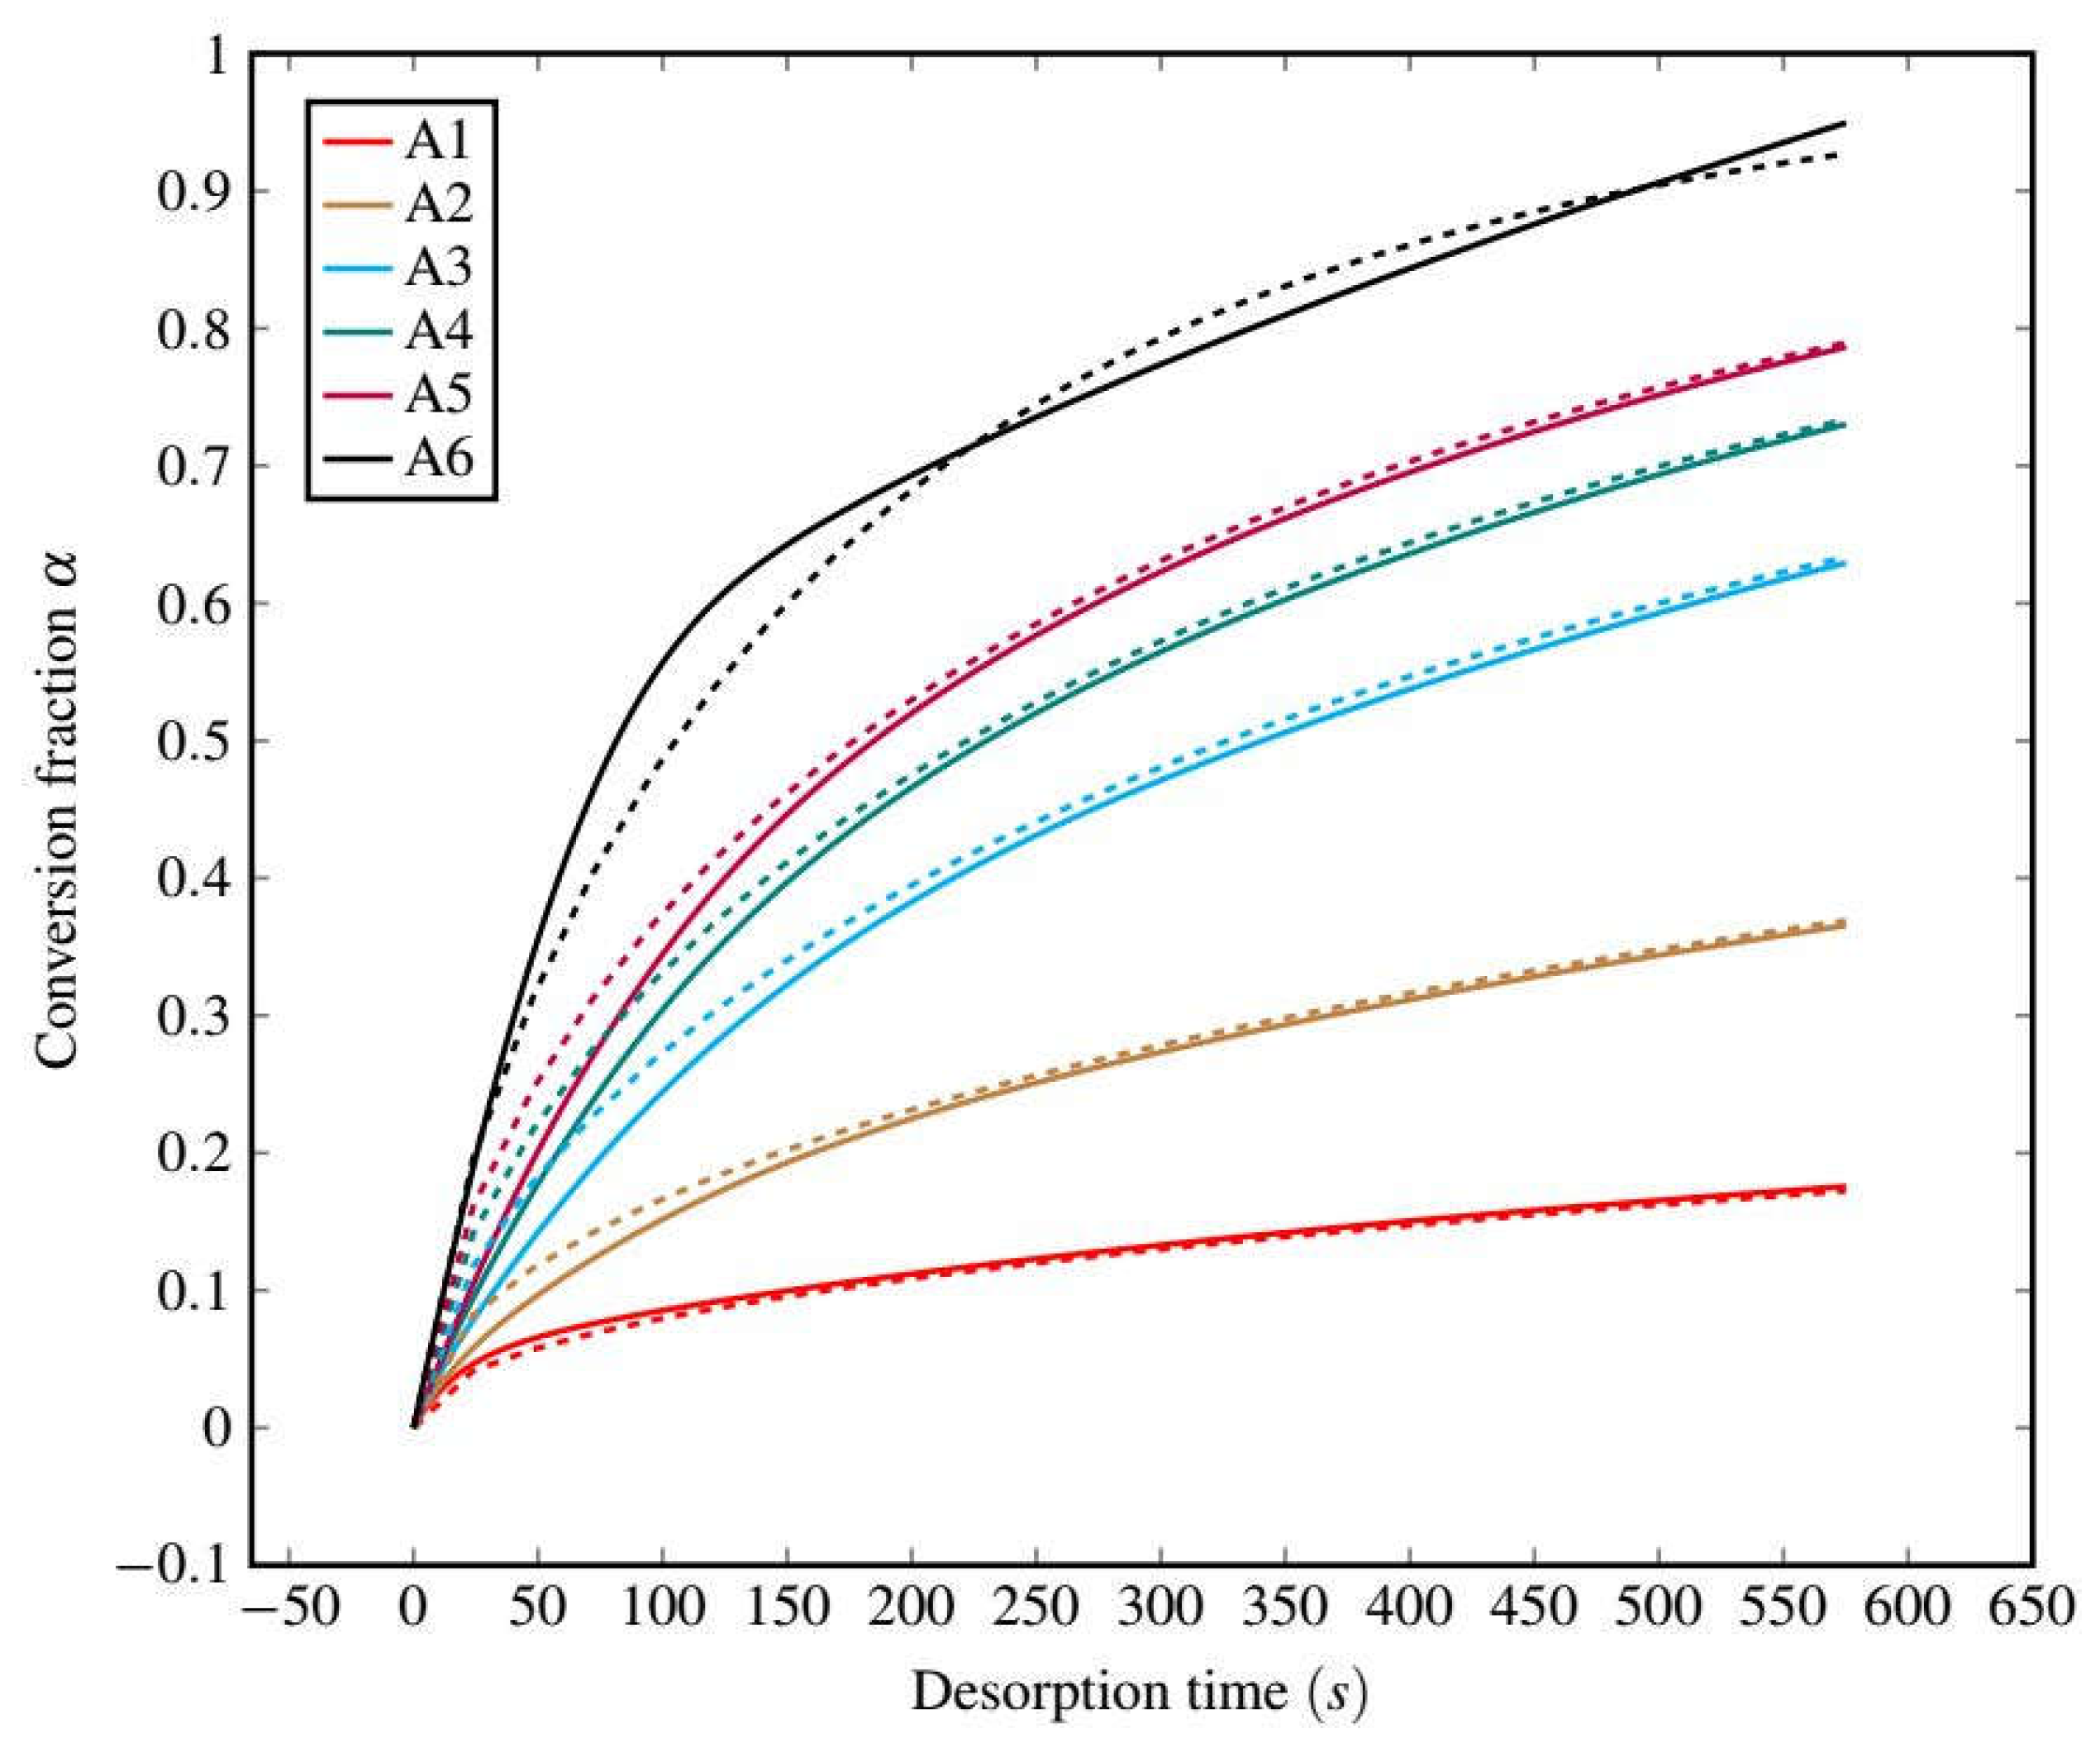
3.2.2. Desorption Kinetics Modeling

The Avrami–Erofeyev model [26] was fitted to the desorption data [17,27,28,29] and we used Equation (14) to define the following conversion variable
t = 0 t μ d e s t d t 0 μ d e s t d t
where lim t 0 α = 0 and lim t α = 1 , i.e., at infinite time, desorption has ideally achieved its full completion.
α , in turn, relates to the Avrami kinetic parameters m and k in terms of
α t = 1 exp k   t m
Figure 7 displays α(t), for the experimental series A1–A6; the parameters m and k of Equation (15) are set out in Table 3.
Note that the value of m lies in the interval 0.469−0.781, thus suggesting that different desorption mechanisms occurred. Furthermore, these results suggest a possible associated with physical desorption and chemical desorption, as proposed by [28]. The value of m increases with T, which is consistent with a faster chemical desorption induced by temperature, but for A6. In such a case, the increase in m is related to the rapid water evaporation observed at low desorption time (see value of m ¯ diff in Table 2), inducing a faster physical desorption reaction, as proven by k.
Using the Arrhenius model, we plot ln(k) as a function of 1/T in order to infer the classical parameters A and EA according to the equation below
k T = A e E A R T
and visually displayed by Figure 8.
A and EA are determined to be as large as 5.25·1010 s−1 and 76.4 kJ mol−1, respectively. Such an EA figure is in good agreement with those previously observed by [30], such as an MDEA-based amine blend at ambient pressure conditions ranging between 50 and 85 kJ mol−1.
Figure 9 illustrates the decrease in residual CO2 loading Res as a function of desorption time, calculated using Equation (12).
The analysis quantifies the diminishing time required to reduce the CO2 loading from its initial maximum value (in the range 2.34–2.26 mol kg−1) to a common reference of 1 mol kg−1 as the temperature increases. At 333 K, it takes 500 s to reach this reference value. Conversely, at temperatures of 343 K, 353 K, and 363 K, it takes 345 s, 260 s, and 90 s, respectively. For lower temperatures, the threshold of 1 mol kg−1 was not reached within the limited desorption time. However, at 308 K and 323 K, after 600 s of desorption, the CO2 loadings still reduces at 1.95 mol kg−1 and 1.49 mol kg−1, respectively.

4. Conclusions

The present study contributes to shedding light on the desorption kinetics of the CO2 removal process using MDEA/PZ under simulated sorption/desorption cycles. We examined the desorption behavior at low pressures (<200 mbar) and within a temperature range of 308 to 363 K by employing a roto-evaporator system.
Our findings reveal that the combination of pressure and temperature significantly influences desorption reactions. Notably, at low pressure (~200 mbar), we observed a substantial enhancement in CO2 extraction, with improvements of up to 70.5% at 323 K and 16.3% at 363 K compared to room pressure, as illustrated in Figure 6. This suggests that pressure reduction could serve as a promising alternative to high-temperature regeneration in the CO2 removal process.
Furthermore, the application of the Arrhenius law to analyze the desorption process in the low-pressure regime yielded an activation energy of EA = 76.39 kJ mol−1, underscoring the relevant temperature sensitivity of this process. The analysis of the time required to decrease the CO2 loading from its maximum value to a common reference (1 mol kg−1) using Equation (12) demonstrates that 500 s is needed at 333 K vs. 90 s at 363 K, as displayed by Figure 9. These rapid desorption kinetics have practical implications for the design of industrial CO2 removal and transportation systems, particularly in scenarios where short residence times in terms of the stripper are necessary due to high reagent flow velocities.
Importantly, our study demonstrates that, if an industrial CO2 stripping system can accommodate longer residence times, sufficient CO2 desorption kinetics can still be achieved by reducing the desorption temperature to 333 K, balancing the trade-off between energy consumption and desorption performance.
Overall, the findings presented in this study contribute to a better understanding of desorption kinetics in the context of CO2 removal processes. The insights gained have implications for the optimization of industrial CO2 capture systems, promoting sustainability by enabling more efficient approaches to CO2 removal and transportation.

Author Contributions

Conceptualization, Q.W., E.D., A.P., A.D.R. and A.M.V.; methodology, Q.W. and E.D.; investigation, Q.W., E.D. and L.P.; resources, Q.W., E.D., C.C, L.P, A.P., A.D.R. and A.M.V.; data curation, Q.W., E.D. and C.C.; writing—original draft preparation, Q.W., E.D., C.C. and A.P.; writing—review and editing, Q.W., E.D., C.C., L.P., D.B., M.B., A.B., A.P. A.D.R. and A.M.V.; visualization, Q.W.; supervision, E.D., C.C. and A.P.; project administration, A.P.; funding acquisition, A.P. All authors have read and agreed to the published version of the manuscript.

Funding

This research was funded by ECOSPRAY TECHNOLOGIES S.r.l., Italian Ministry for Education, University and Research (MIUR; project PRIN2017-2017L83S77) and Ministry for Ecological Transition (MiTE; project CLEAN), for possible applications of exchanged CO2 to fly ash treatment.

Institutional Review Board Statement

Not applicable.

Informed Consent Statement

Not applicable.

Data Availability Statement

Derived data supporting the findings of this study are available from the corresponding author Q.W. on request.

Conflicts of Interest

The authors declare no conflict of interest. The funders had no role in the design of the study; in the collection, analyses, or interpretation of data; in the writing of the manuscript, or in the decision to publish the results; they provided the samples only.

References

  1. Gür, T.M. Carbon dioxide emissions, capture, storage and utilization: Review of materials, processes and technologies. Prog. Energy Combust. Sci. 2022, 89, 100965. [Google Scholar] [CrossRef]
  2. Aghel, B.; Janati, S.; Wongwises, S.; Shadloo, M.S. Review on CO2 capture by blended amine solutions. Int. J. Greenh. Gas Control 2022, 119, 103715. [Google Scholar] [CrossRef]
  3. Barzagli, F.; Giorgi, C.; Mani, F.; Peruzzini, M. Reversible carbon dioxide capture by aqueous and non- aqueous amine-based absorbents: A comparative analysis carried out by 13C NMR spectroscopy. Appl. Energy 2018, 220, 208–219. [Google Scholar] [CrossRef]
  4. Khalid, M.; Dharaskar, S.A.; Sillanpaa, M.; Siddiqui, H. (Eds.) Emerging Carbon Capture Technologies: Towards a Sustainable Future; Elsevier: Amsterdam, The Netherlands, 2022. [Google Scholar]
  5. Closmann, F.; Nguyen, T.; Rochelle, G.T. MDEA/Piperazine as a solvent for CO2 capture. Energy Procedia 2009, 1, 1351–1357. [Google Scholar] [CrossRef] [Green Version]
  6. Dugas, R.; Rochelle, G. Absorption and desorption rates of carbon dioxide with mo- noethanolamine and piperazine. Energy Procedia 2009, 1, 1163–1169. [Google Scholar] [CrossRef] [Green Version]
  7. Svensson, H.; Hulteberg, C.; Karlsson, H.T. Heat of absorption of CO2 in aqueous solutions of N-methyldiethanolamine and piperazine. Int. J. Greenh. Gas Control 2013, 17, 89–98. [Google Scholar] [CrossRef]
  8. Artanto, Y.; Jansen, J.; Pearson, P.; Do, T.; Cottrell, A.; Meuleman, E.; Feron, P. Performance of MEA and amine-blends in the CSIRO PCC pilot plant at Loy Yang Power in Australia. Fuel 2012, 101, 264–275. [Google Scholar] [CrossRef]
  9. Yan, S.; Fang, M.; Luo, Z.; Cen, K. Regeneration of CO2 from CO2-rich alkanolamines solution by using reduced thickness and vacuum technology: Regeneration feasibility and characteristic of thin-layer solvent. Chem. Eng. Process. Process Intensif. 2009, 48, 515–523. [Google Scholar] [CrossRef]
  10. Fredriksen, S.; Jens, K.-J. Oxidative degradation of aqueous amine solutions of MEA, AMP, MDEA, Pz: A review. Energy Proc. 2013, 37, 1770–1777. [Google Scholar] [CrossRef] [Green Version]
  11. Zhang, W.; Liu, H.; Sun, Y.; Cakstins, J.; Sun, C.; Snape, C.E. Parametric study on the regeneration heat requirement of an amine-based solid adsorbent process for post-combustion carbon capture. Appl. Energy 2016, 168, 394–405. [Google Scholar] [CrossRef]
  12. Abd, A.A.; Naji, S.Z.; Barifcani, A. Comprehensive evaluation and sensitivity analysis of regeneration energy for acid gas removal plant using single and activated-methyl diethanolamine solvents. Chin. J. Chem. Eng. 2020, 28, 1684–1693. [Google Scholar] [CrossRef]
  13. Li, F.; Hemmati, A.; Rashidi, H. Industrial CO2 absorption into methyldiethanolamine/piperazine in place of monoethanolamine in the absorption column. Process Saf. Environ. Prot. 2020, 142, 83–91. [Google Scholar] [CrossRef]
  14. Hemmati, A.; Farahzad, R.; Surendar, A.; Aminahmadi, B. Validation of mass transfer and liquid holdup correlations for CO2 absorption process with methyldiethanolamine solvent and piperazine as an activator. Process Saf. Environ. Prot. 2019, 126, 214–222. [Google Scholar] [CrossRef]
  15. Esmaeili, A.; Tamuzi, A.; Borhani, T.N.; Xiang, Y.; Shao, L. Modeling of carbon dioxide absorption by solution of piperazine and methyldiethanolamine in a rotating packed bed. Chem. Eng. Sci. 2022, 248, 117118. [Google Scholar] [CrossRef]
  16. Barzagli, F.; Mani, F.; Peruzzini, M. Continuous cycles of CO2 absorption and amine regeneration with aqueous alkanolamines: A comparison of the efficiency between pure and blended DEA, MDEA and AMP solutions by 13C NMR spectroscopy. Energy Env. Ment. Sci. 2010, 3, 772–779. [Google Scholar] [CrossRef]
  17. Teng, Y.; Liu, Z.; Xu, G.; Zhang, K. Desorption kinetics and mechanisms of CO2 on amine-based mesoporous silica materials. Energies 2017, 10, 115. [Google Scholar] [CrossRef] [Green Version]
  18. Zhang, X.; Zhang, C.-F.; Qin, S.-J.; Zheng, Z.-S. A kinetics study on the absorption of carbon dioxide into a mixed aqueous solution of methyldiethanolamine and piperazine. Ind. Eng. Chem. Res. 2001, 40, 3785–3791. [Google Scholar] [CrossRef]
  19. Bishnoi, S.; Rochelle, G.T. Absorption of carbon dioxide into aqueous piperazine: Reaction kinetics, mass transfer and solubility. Chem. Eng. Sci. 2000, 55, 5531–5543. [Google Scholar] [CrossRef]
  20. Puxty, G.; Rowland, R. Modeling CO2 mass transfer in amine mixtures: PZ-AMP and PZ-MDEA. Environ. Sci. Technol. 2011, 45, 2398–2405. [Google Scholar] [CrossRef]
  21. Jansen, D.; Gazzani, M.; Manzolini, G.; van Dijk, E.; Carbo, M. Pre-combustion CO2 capture. Int. J. Greenh. Gas Control 2015, 40, 167–187. [Google Scholar] [CrossRef] [Green Version]
  22. Chen, C.; Zhang, S.; Row, K.H.; Ahn, W.-S. Amine–silica composites for CO2 capture: A short review. J. Energy Chem. 2017, 26, 868–880. [Google Scholar] [CrossRef] [Green Version]
  23. Sun, Z.; Fan, M.; Argyle, M. Desorption kinetics of the monoethanolamine/macroporous TiO2-based CO2 separation process. Energy Fuels 2011, 25, 2988–2996. [Google Scholar] [CrossRef]
  24. Saleh, T.A.; Elsharif, A.M.; Bin-Dahman, O.A. Synthesis of amine functionalization carbon nanotube-low symmetry porphyrin derivatives conjugates toward dye and metal ions removal. J. Mol. Liq. 2021, 340, 117024. [Google Scholar] [CrossRef]
  25. Zhang, J.; Qiao, Y.; Agar, D.W. Intensification of low temperature thermomorphic bipha- sic amine solvent regeneration for CO2 capture. Chem. Eng. Res. Des. 2012, 90, 743–749. [Google Scholar] [CrossRef]
  26. Khawam, A.; Flanagan, D.R. Solid-state kinetic models: Basics and mathematical fundamentals. J. Phys. Chem. B 2006, 110, 17315–17328. [Google Scholar] [CrossRef]
  27. Guo, B.; Wang, Y.; Shen, X.; Qiao, X.; Jia, L.; Xiang, J.; Jin, Y. Study on CO2 capture characteristics and kinetics of modified potassium-based adsorbents. Materials 2020, 13, 877. [Google Scholar] [CrossRef] [Green Version]
  28. Liu, Q.; Shi, J.; Zheng, S.; Tao, M.; He, Y.; Shi, Y. Kinetics studies of CO2 adsorption/desorption on amine-functionalized multiwalled carbon nanotubes. Ind. Eng. Chem. Res. 2014, 53, 11677–11683. [Google Scholar] [CrossRef]
  29. Serna-Guerrero, R.; Belmabkhout, Y.; Sayari, A. Modeling CO2 adsorption on amine-functionalized mesoporous silica: 1. A semi-empirical equilibrium model. Chem. Eng. J. 2010, 161, 173–181. [Google Scholar] [CrossRef]
  30. Shunji, K.; Xizhou, S.; Wenze, Y. Investigation of CO2 desorption kinetics in MDEA and MDEA+ DEA rich amine solutions with thermo-gravimetric analysis method. Int. J. Greenh. Gas Control 2020, 95, 102947. [Google Scholar] [CrossRef]
Figure 1. Topological formulas for MDEA (left) and PZ (right).
Sustainability 15 10334 g001
Figure 2. Experimental setup during the sorption (left) and desorption (right) cycles.
Sustainability 15 10334 g002
Figure 3. CO2 loading a (mol/kg) variations, from Equation (11), as a function of the sorption–desorption cycles (A); for the sake of simplicity, only experiments referring to the first 7 cycles out of 10 and related to A1, A3 and A6 of Table 1 are shown. The CO2 exchange capacity ω ¯ as a function of the desorption temperature (B).
Sustainability 15 10334 g003
Figure 4. Average CO2 sorption rate, calculated over experiments A1–A6 according to Equation (1) and related to the first cycle only, with standard deviation.
Sustainability 15 10334 g004
Figure 5. Average CO2 sorption rate (A) and CO2 desorption flow (L/min CO2; B), as a function of the sorption/desorption time respectively, with the standard deviations σ, for experiments A1 to A6.
Sustainability 15 10334 g005
Figure 6. Pressure effect on desorption kinetics, using Δμ as defined in the text from the experimental series A and B.
Sustainability 15 10334 g006
Figure 7. α as a function of t (s), in the thermal range from 308 to 363 K. The Avrami–Erofeyev model interpolation curves are shown (dashed lines) with observations (solid lines).
Sustainability 15 10334 g007
Figure 8. Arrhenius plots for the kinetic constants obtained by the Avrami-Erofeyev model of desorption.
Sustainability 15 10334 g008
Figure 9. Decrease in residual CO2 loading Res (mol kg−1) as a function of desorption time (s) with the corresponding duration required to achieve 1 mol kg−1.
Sustainability 15 10334 g009
Table 1. Summary of the experimental parameters.
SorptionDesorption
Experiments
Number
InitialMixing VelocityCyclesTimeTemp.CO2 FlowTimeTemp.Pressure
Mass (g)(rpm)(Count)(s)(K)(L/min)(s)(K)mbar
A1100120103603081600308150 ± 20
2100120103603081600323150 ± 20
3100120103603081600333150 ± 20
4100120103603081600343150 ± 20
5100120103603081600353150 ± 20
6100120103603081600363150 ± 20
B110012023603081600323atm
210012023603081600333atm
310012023603081600343atm
410012023603081600353atm
510012023603081600363atm
Table 2. CO2 sorbed and desorbed volumes, V ¯  CO2 sor(L/cycle) and V ¯  CO2 des(L/cycle); μ ¯ d e s (t ≤ 150 s) average µdes(t) at low desorption time; mass differentiation, m ¯  diff (wt.%), between vessels A and B.
ExperimentA1A2A3A4A5A6
V ¯ CO2 sor(L·cycle−1)0.981.862.312.773.083.28
V CO2 des(L·cycle−1)0.811.742.252.753.073.27
V ¯ CO2 sor/ V CO2 des 1.211.071.031.011.001.00
μ ¯ d e s (t ≤ 150)(L·min−1)0.120.260.330.390.540.82
m ¯ diff(wt.%)0000.350.847.4
Table 3. Order parameter m with the corresponding k and R2 values.
ExperimentsA1A2A3A4A5A6
m0.4690.5290.6550.6790.6860.781
k (min−1)5.01·10−54.02·10−41.75·10−32.62·10−33.32·10−35.97·10−3
R20.99970.99980.99970.99980.99980.9728
Disclaimer/Publisher’s Note: The statements, opinions and data contained in all publications are solely those of the individual author(s) and contributor(s) and not of MDPI and/or the editor(s). MDPI and/or the editor(s) disclaim responsibility for any injury to people or property resulting from any ideas, methods, instructions or products referred to in the content.

