
Assessment of Perceived Factors of Road Safety in Rural Left-Behind Children’s Independent Travel: A Case Study in Changsha, China


Abstract
:1. Introduction
- Which factors affect the safety of rural left-behind children traveling alone?
- Are there differences in safety perceptions among rural left-behind children of different ages and genders?
- Do rural left-behind children and their guardians have different perceptions of safety?
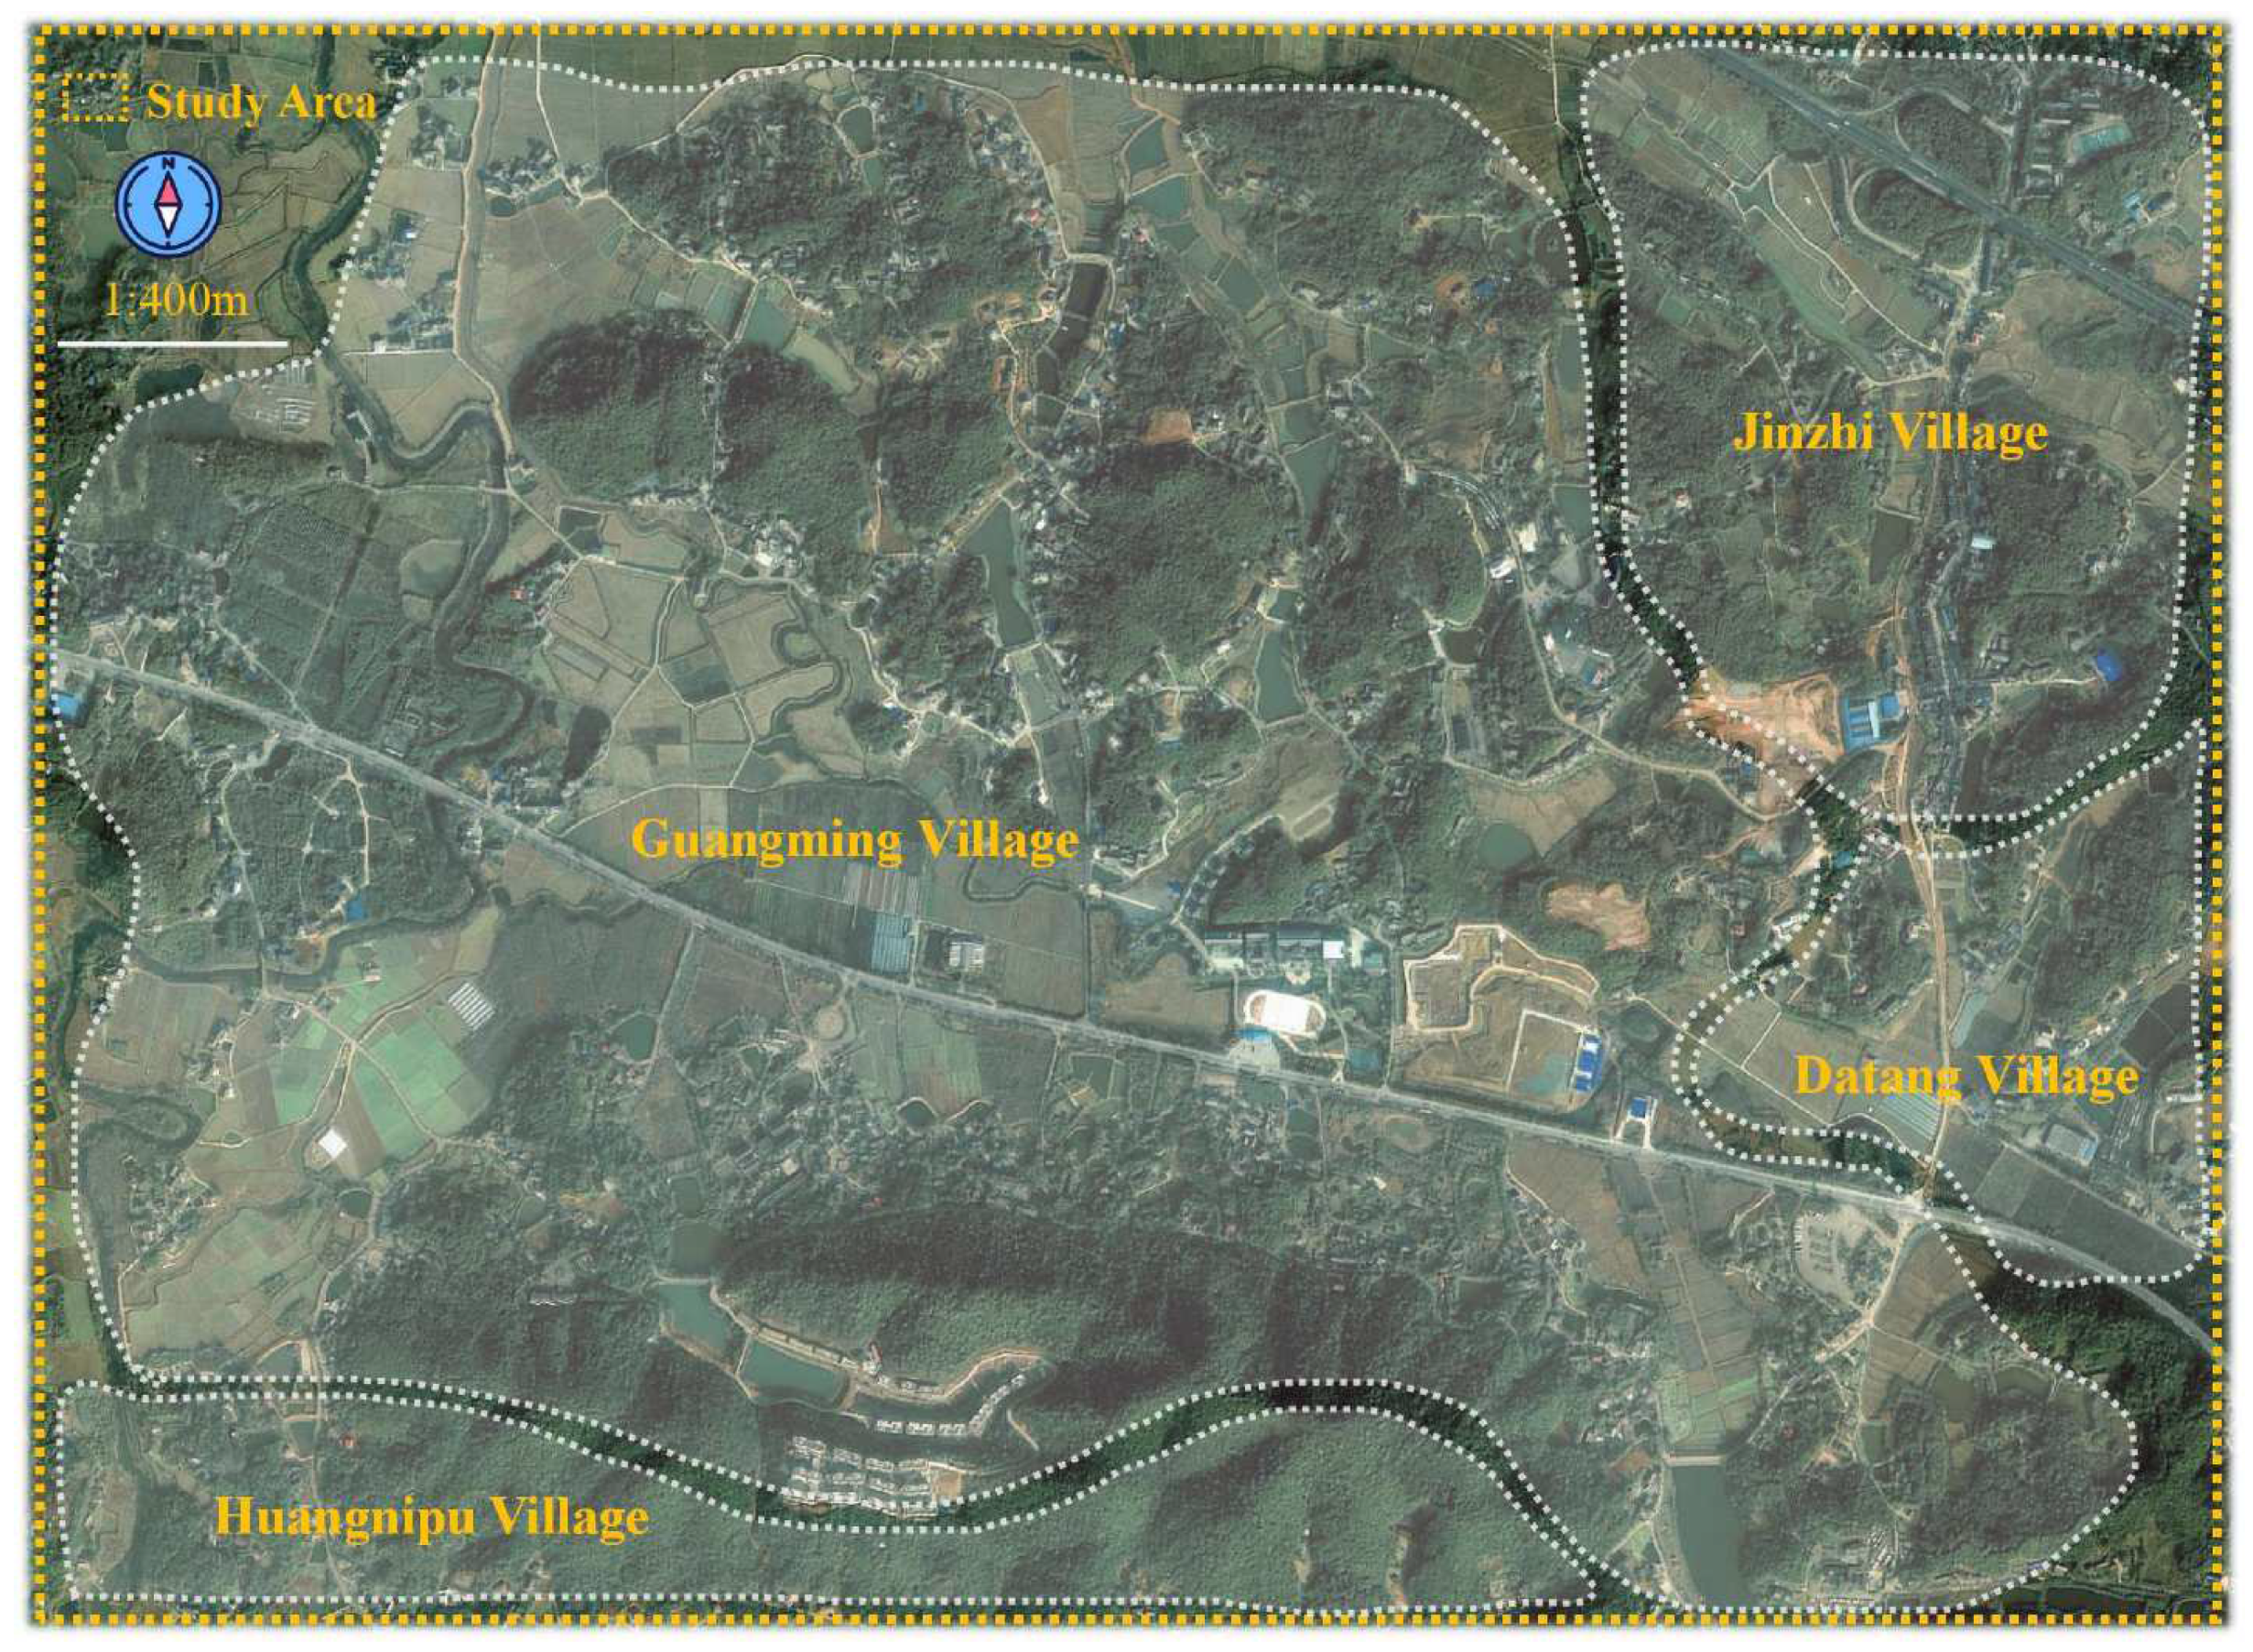
2. Materials and Methods
2.1. Study Methods
2.2. Study Samples
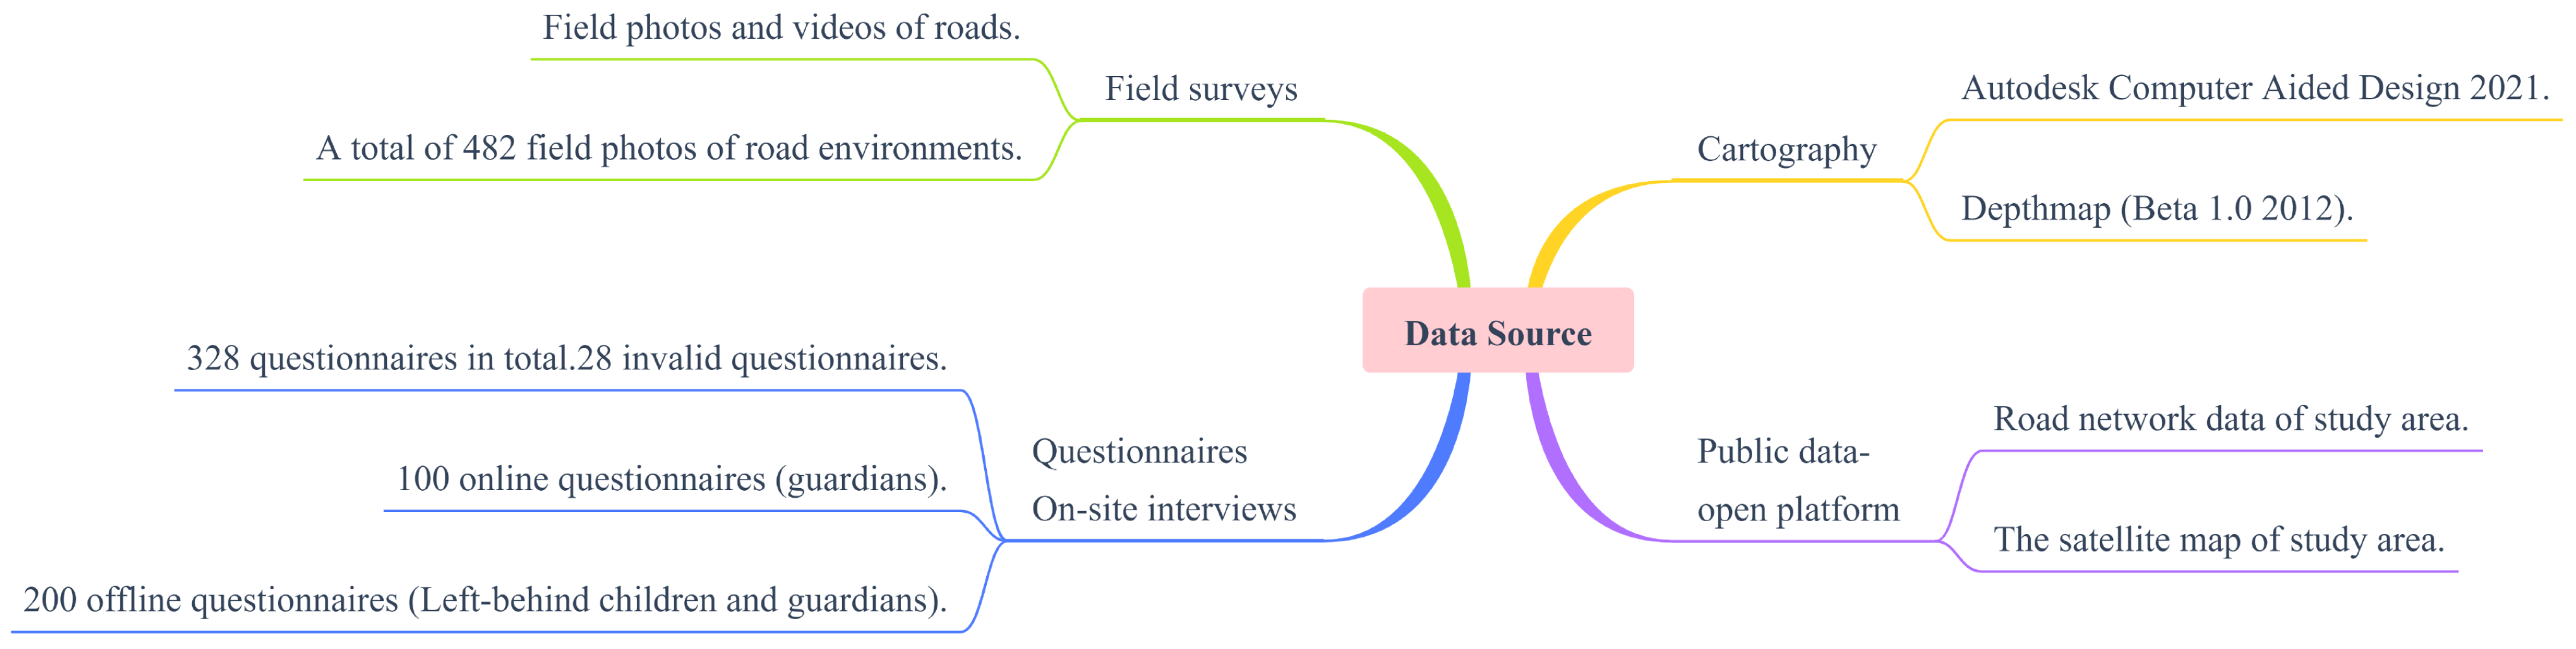
2.3. Data Source
2.4. Index System Construction
3. Results
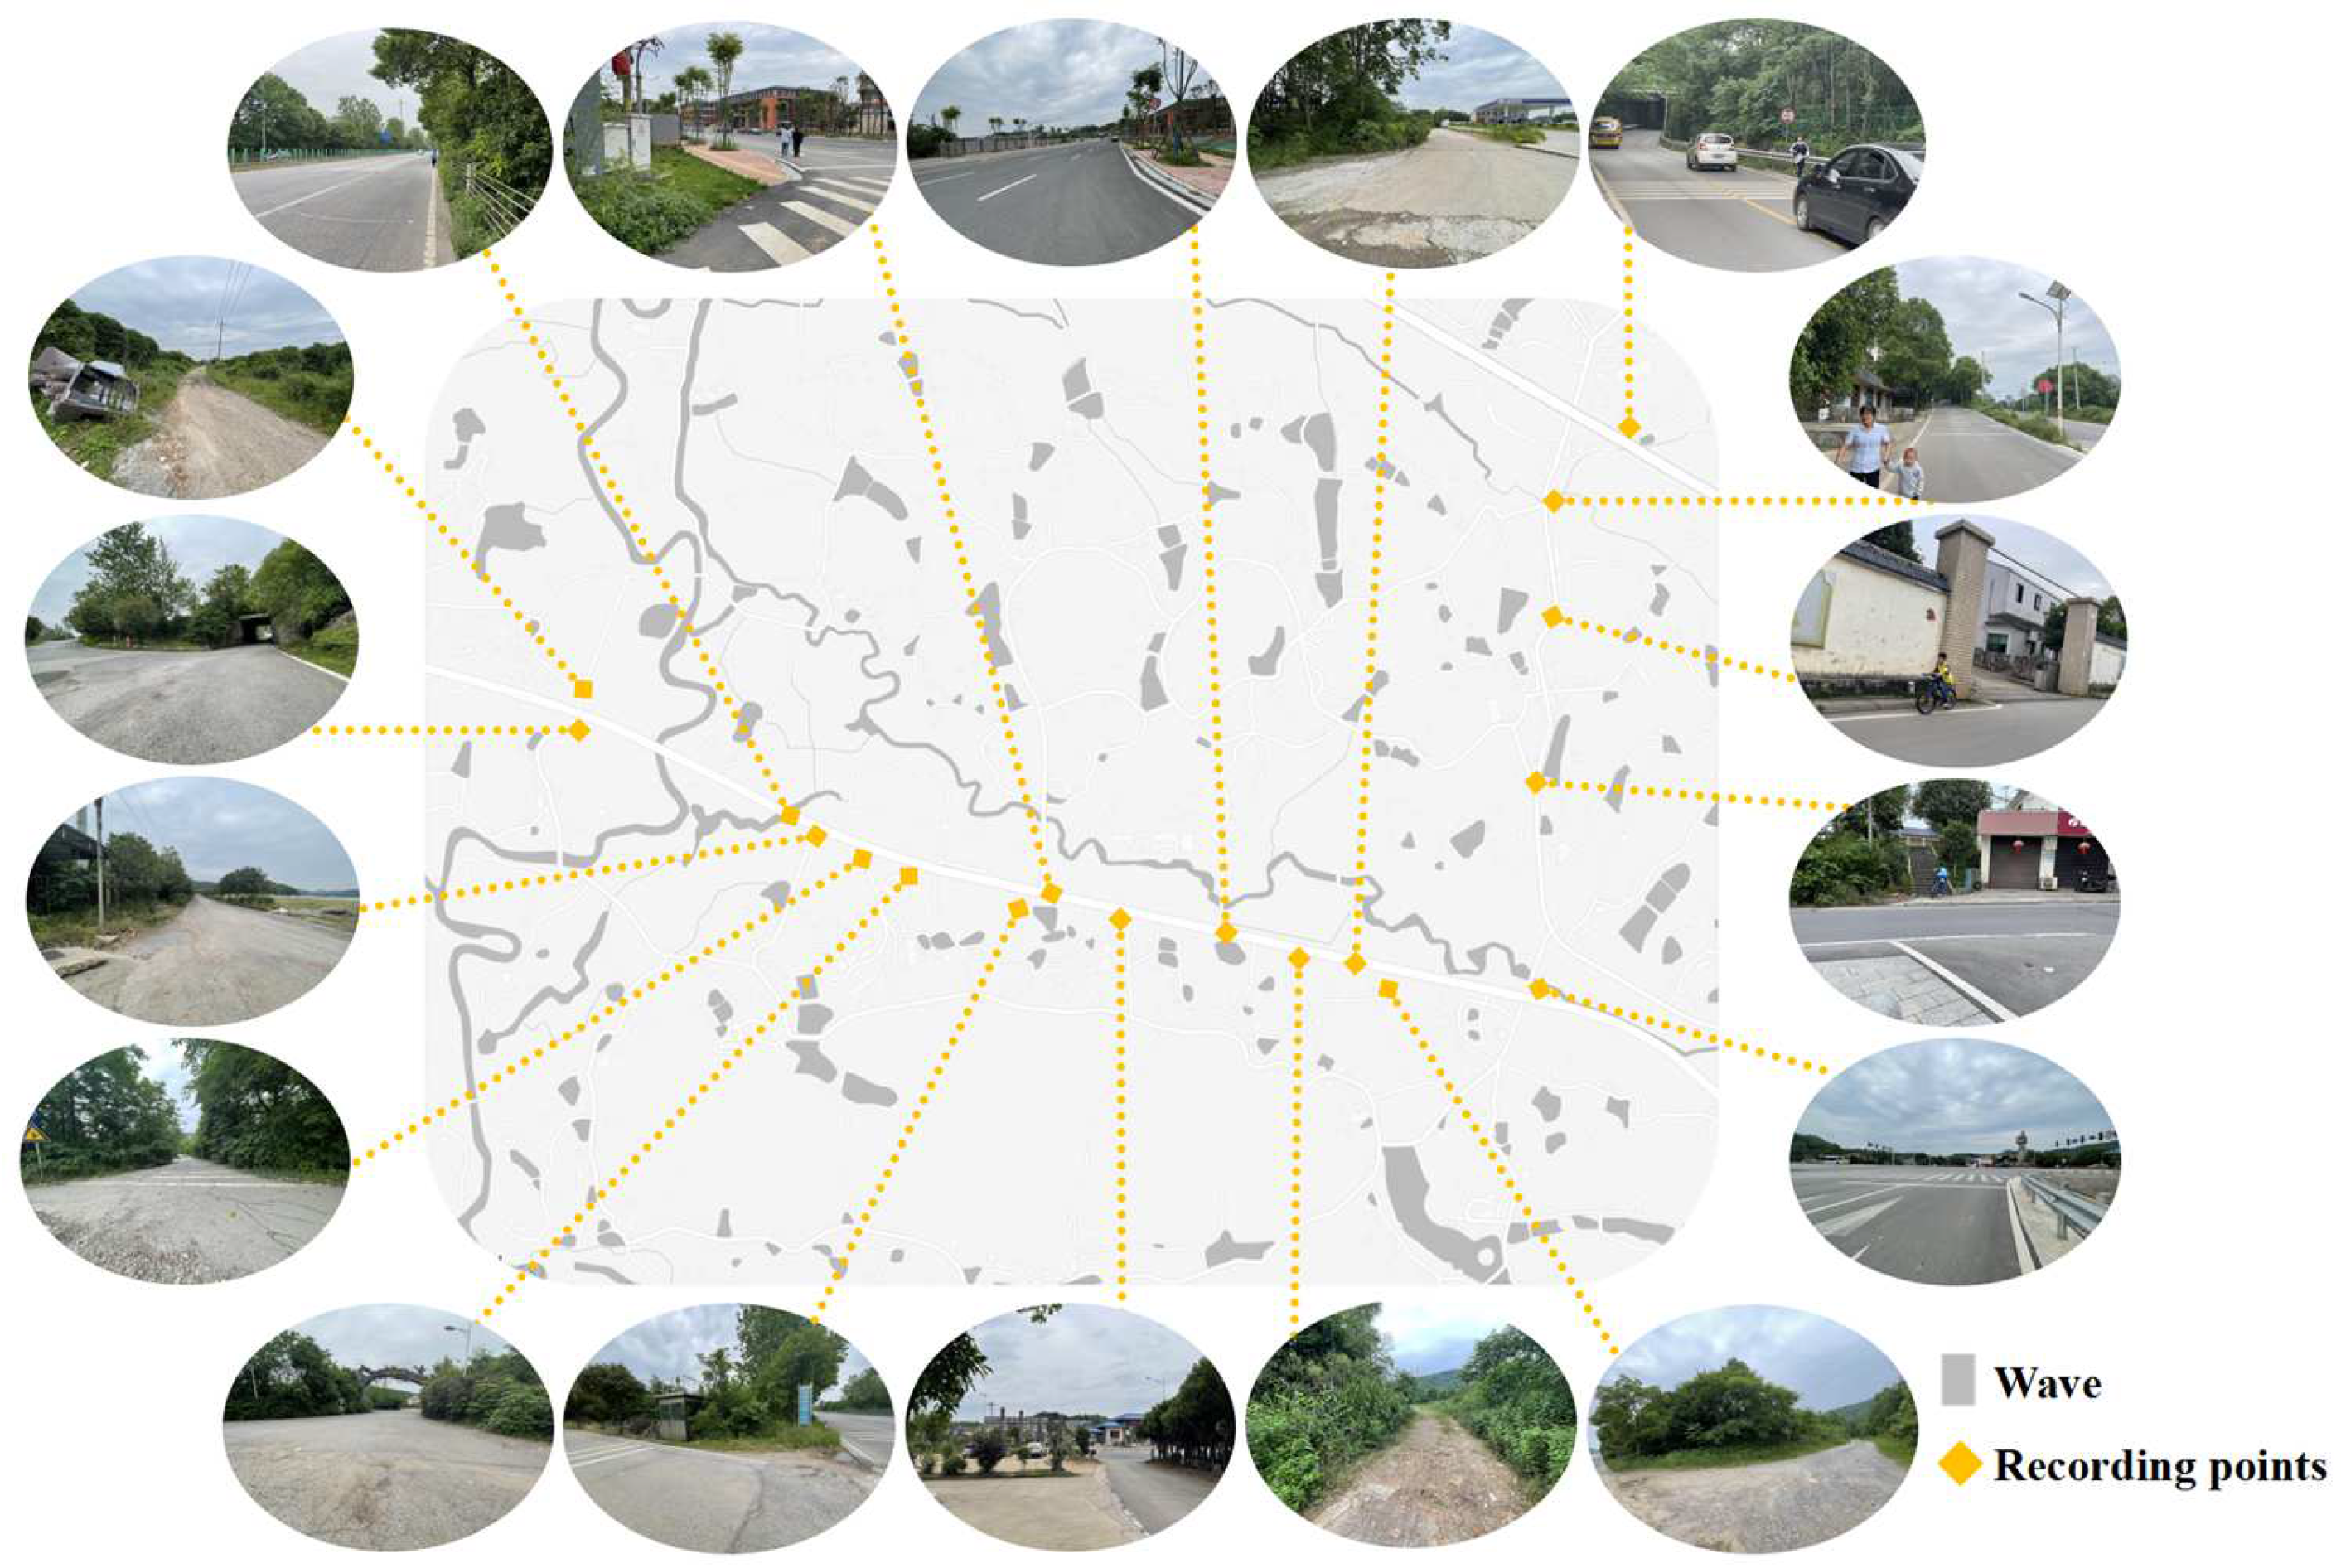
3.1. High-Frequency Selective Analysis of Independent Travel Road Scenes of Left-Behind Children
3.2. Analysis of Environmental Safety Perception Factors for Independent Travel Paths for Left-Behind Children
3.2.1. Reliability and Validity Test of Questionnaire
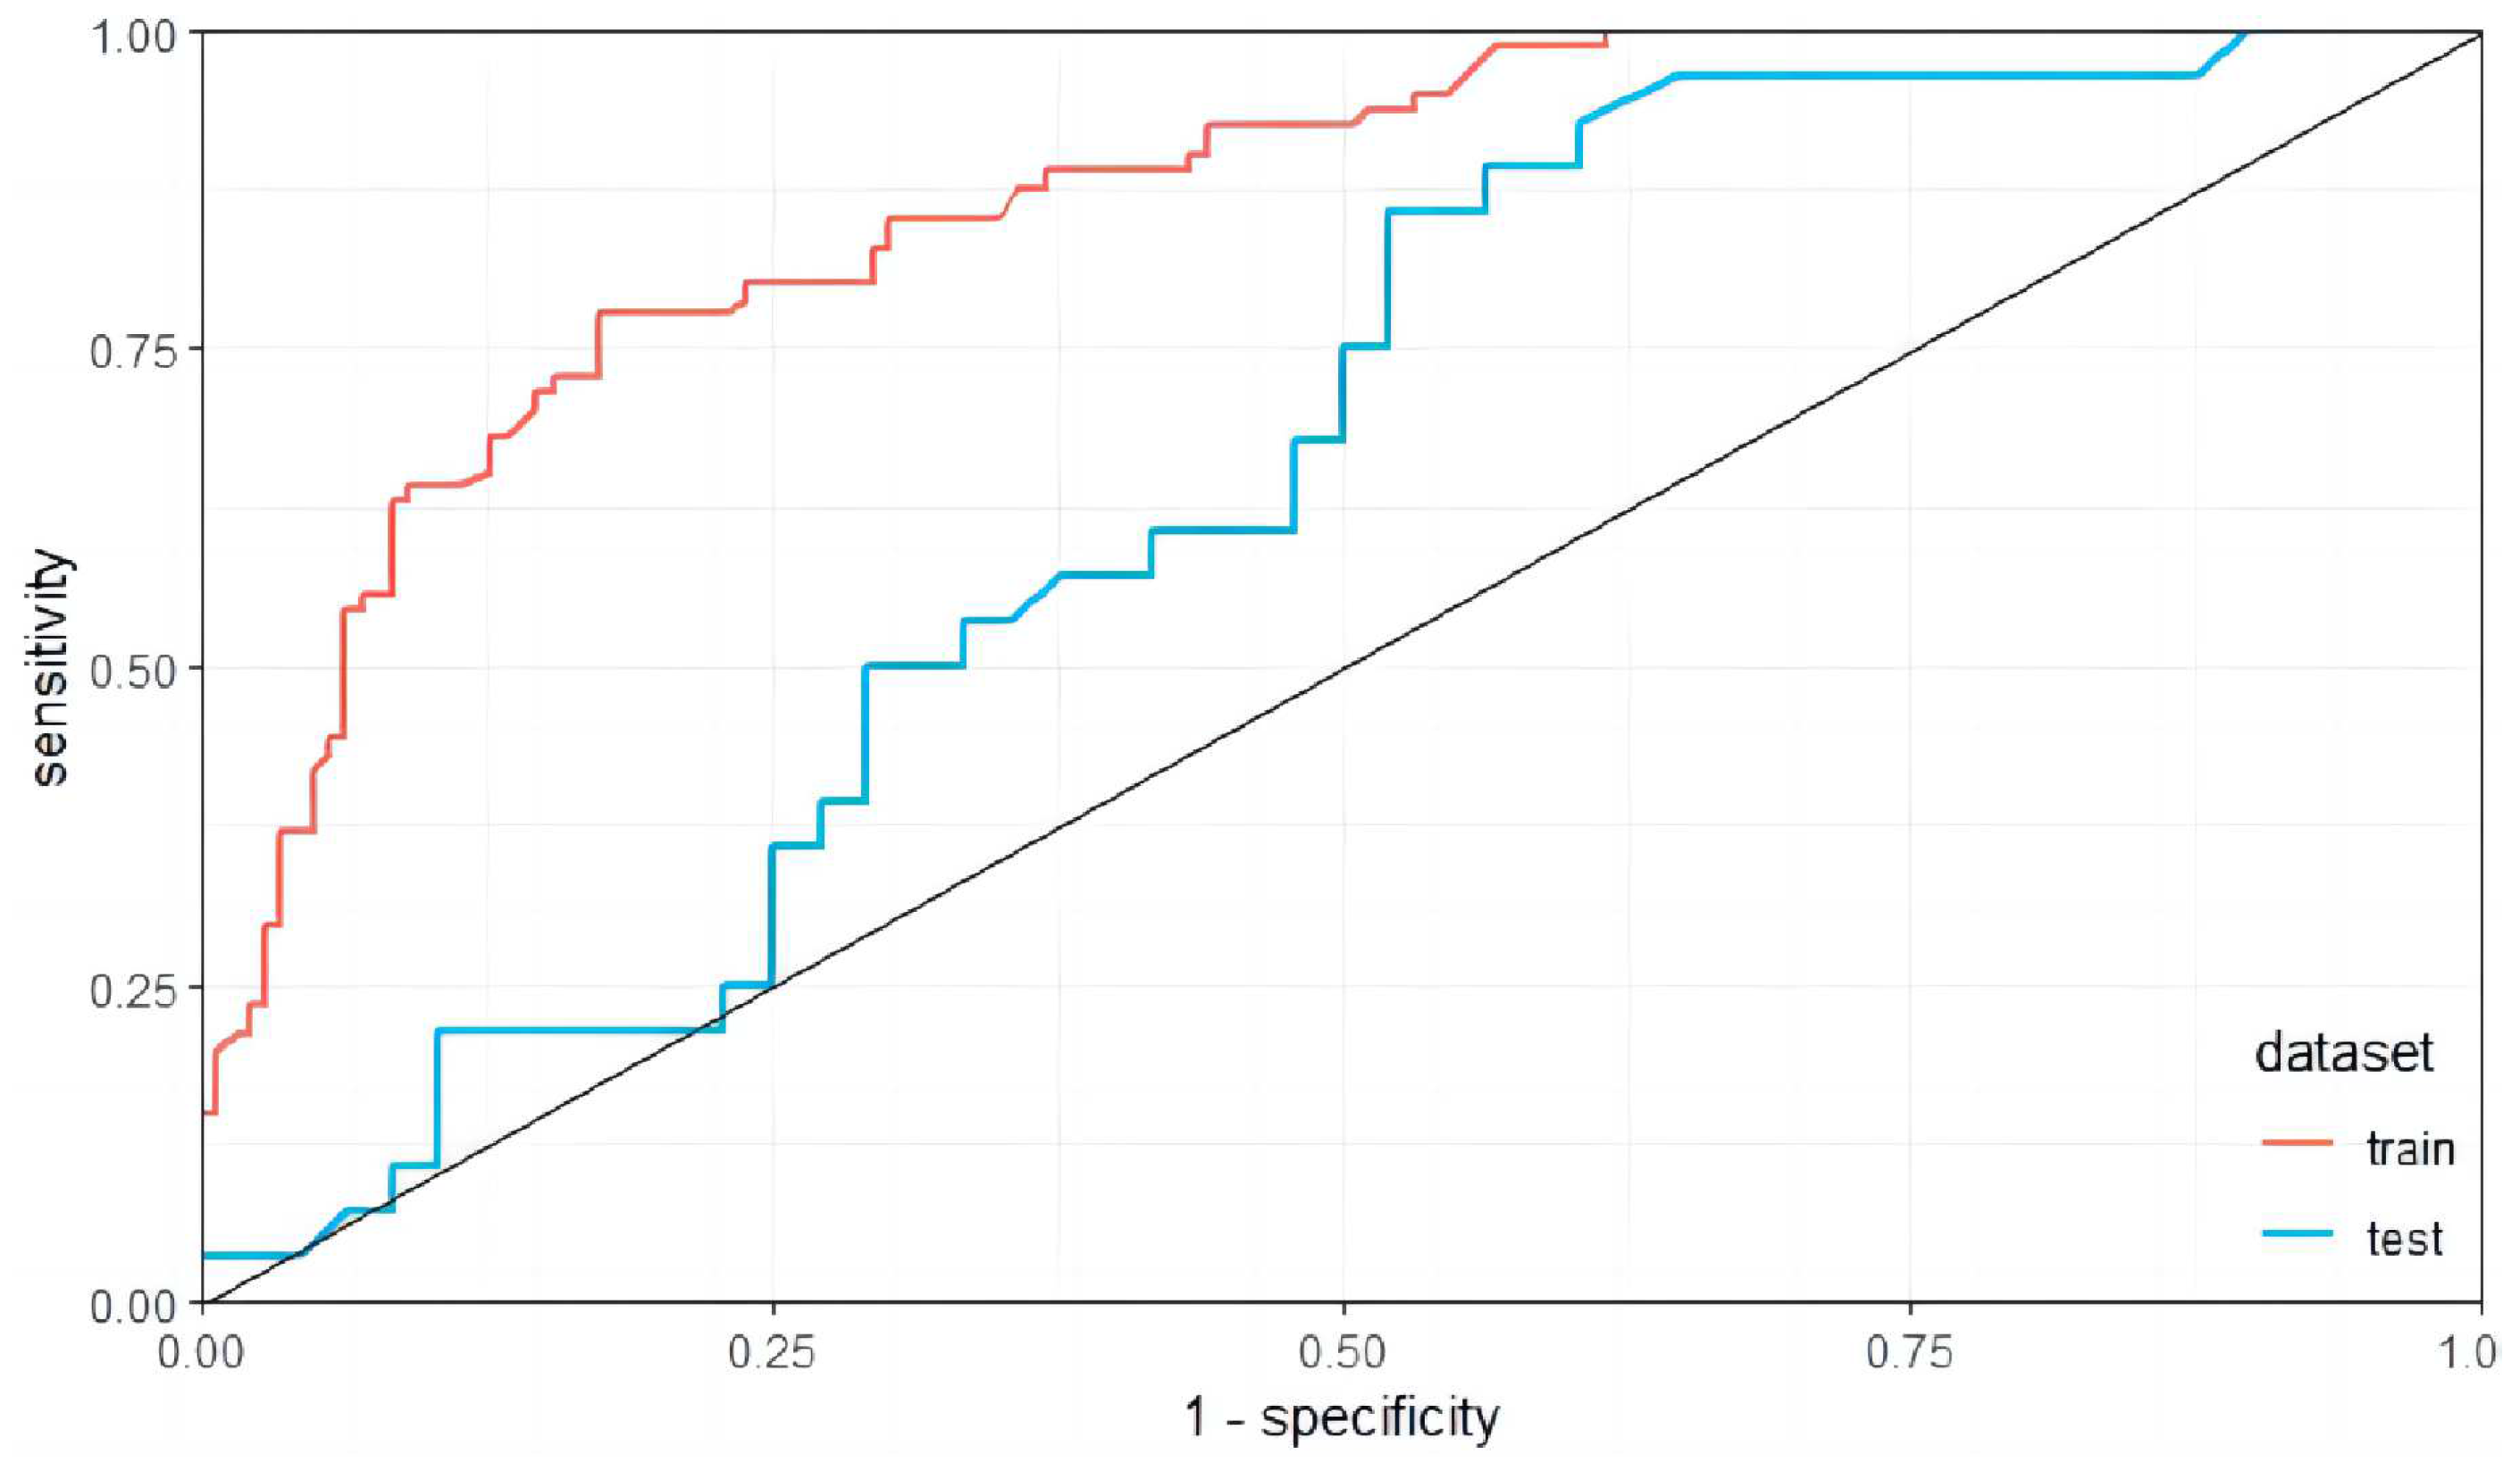
3.2.2. Screening Factors for Left-Behind Children’s Perception of Road Safety during Independent Travel
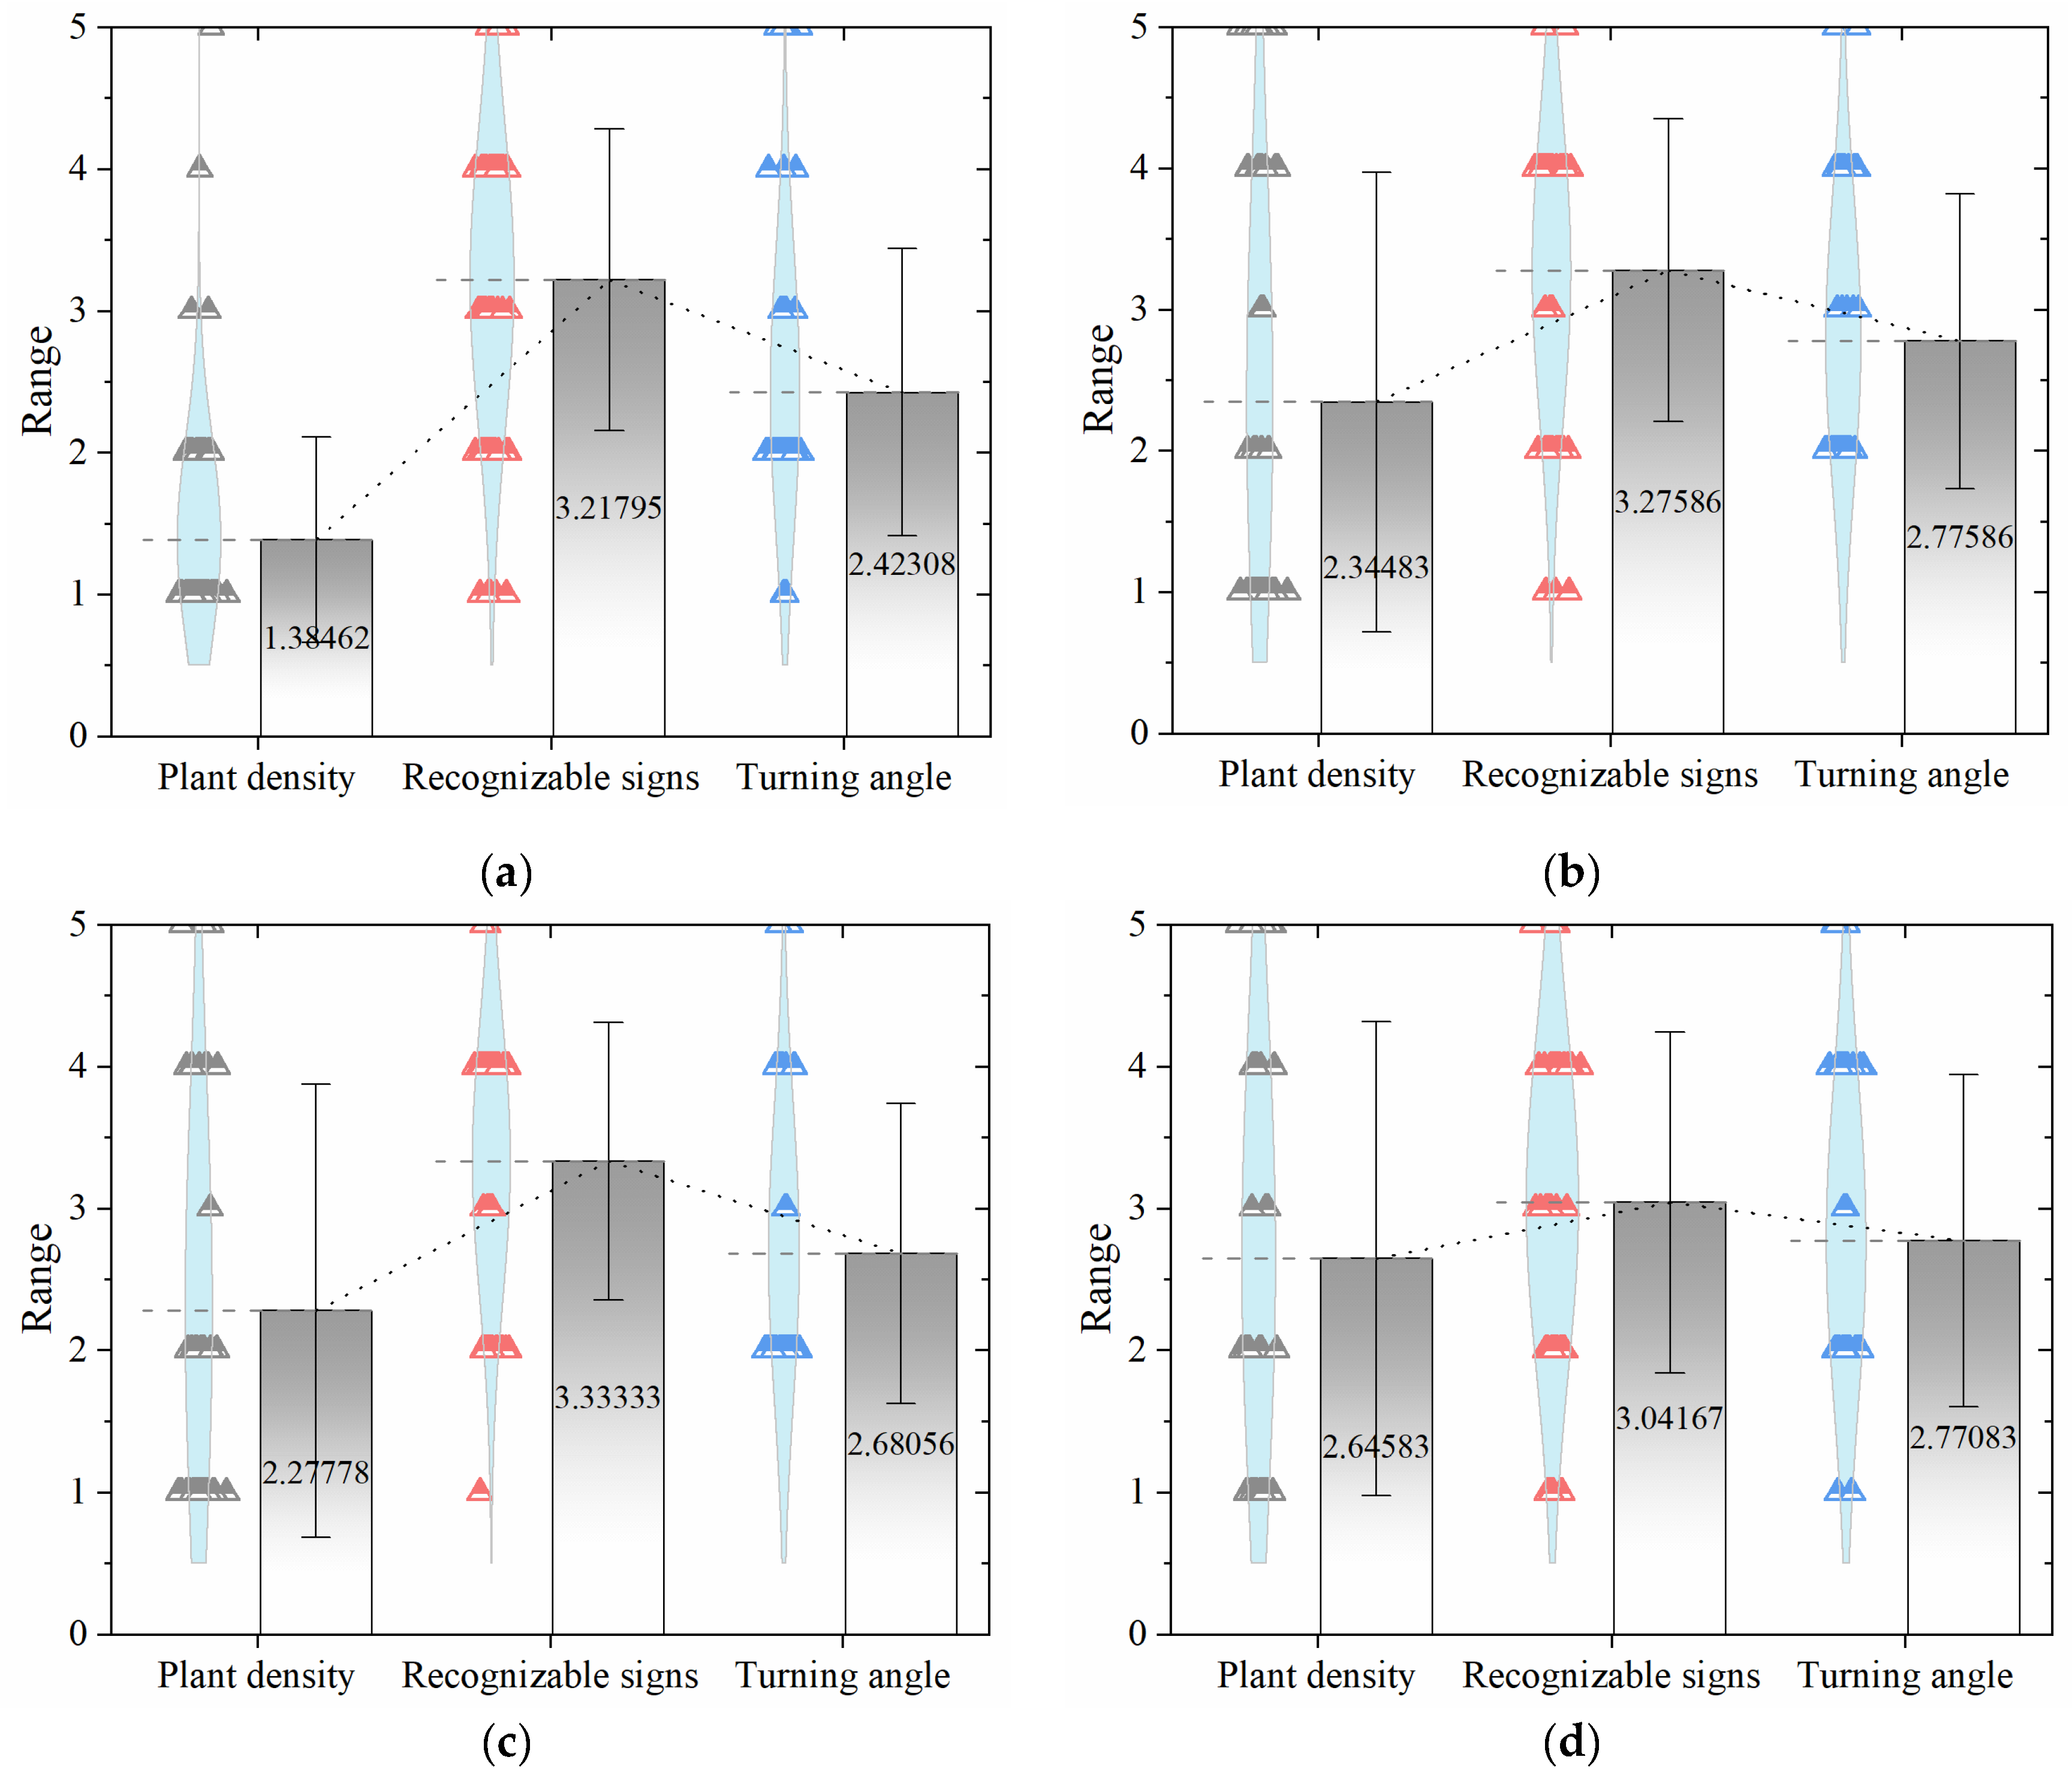
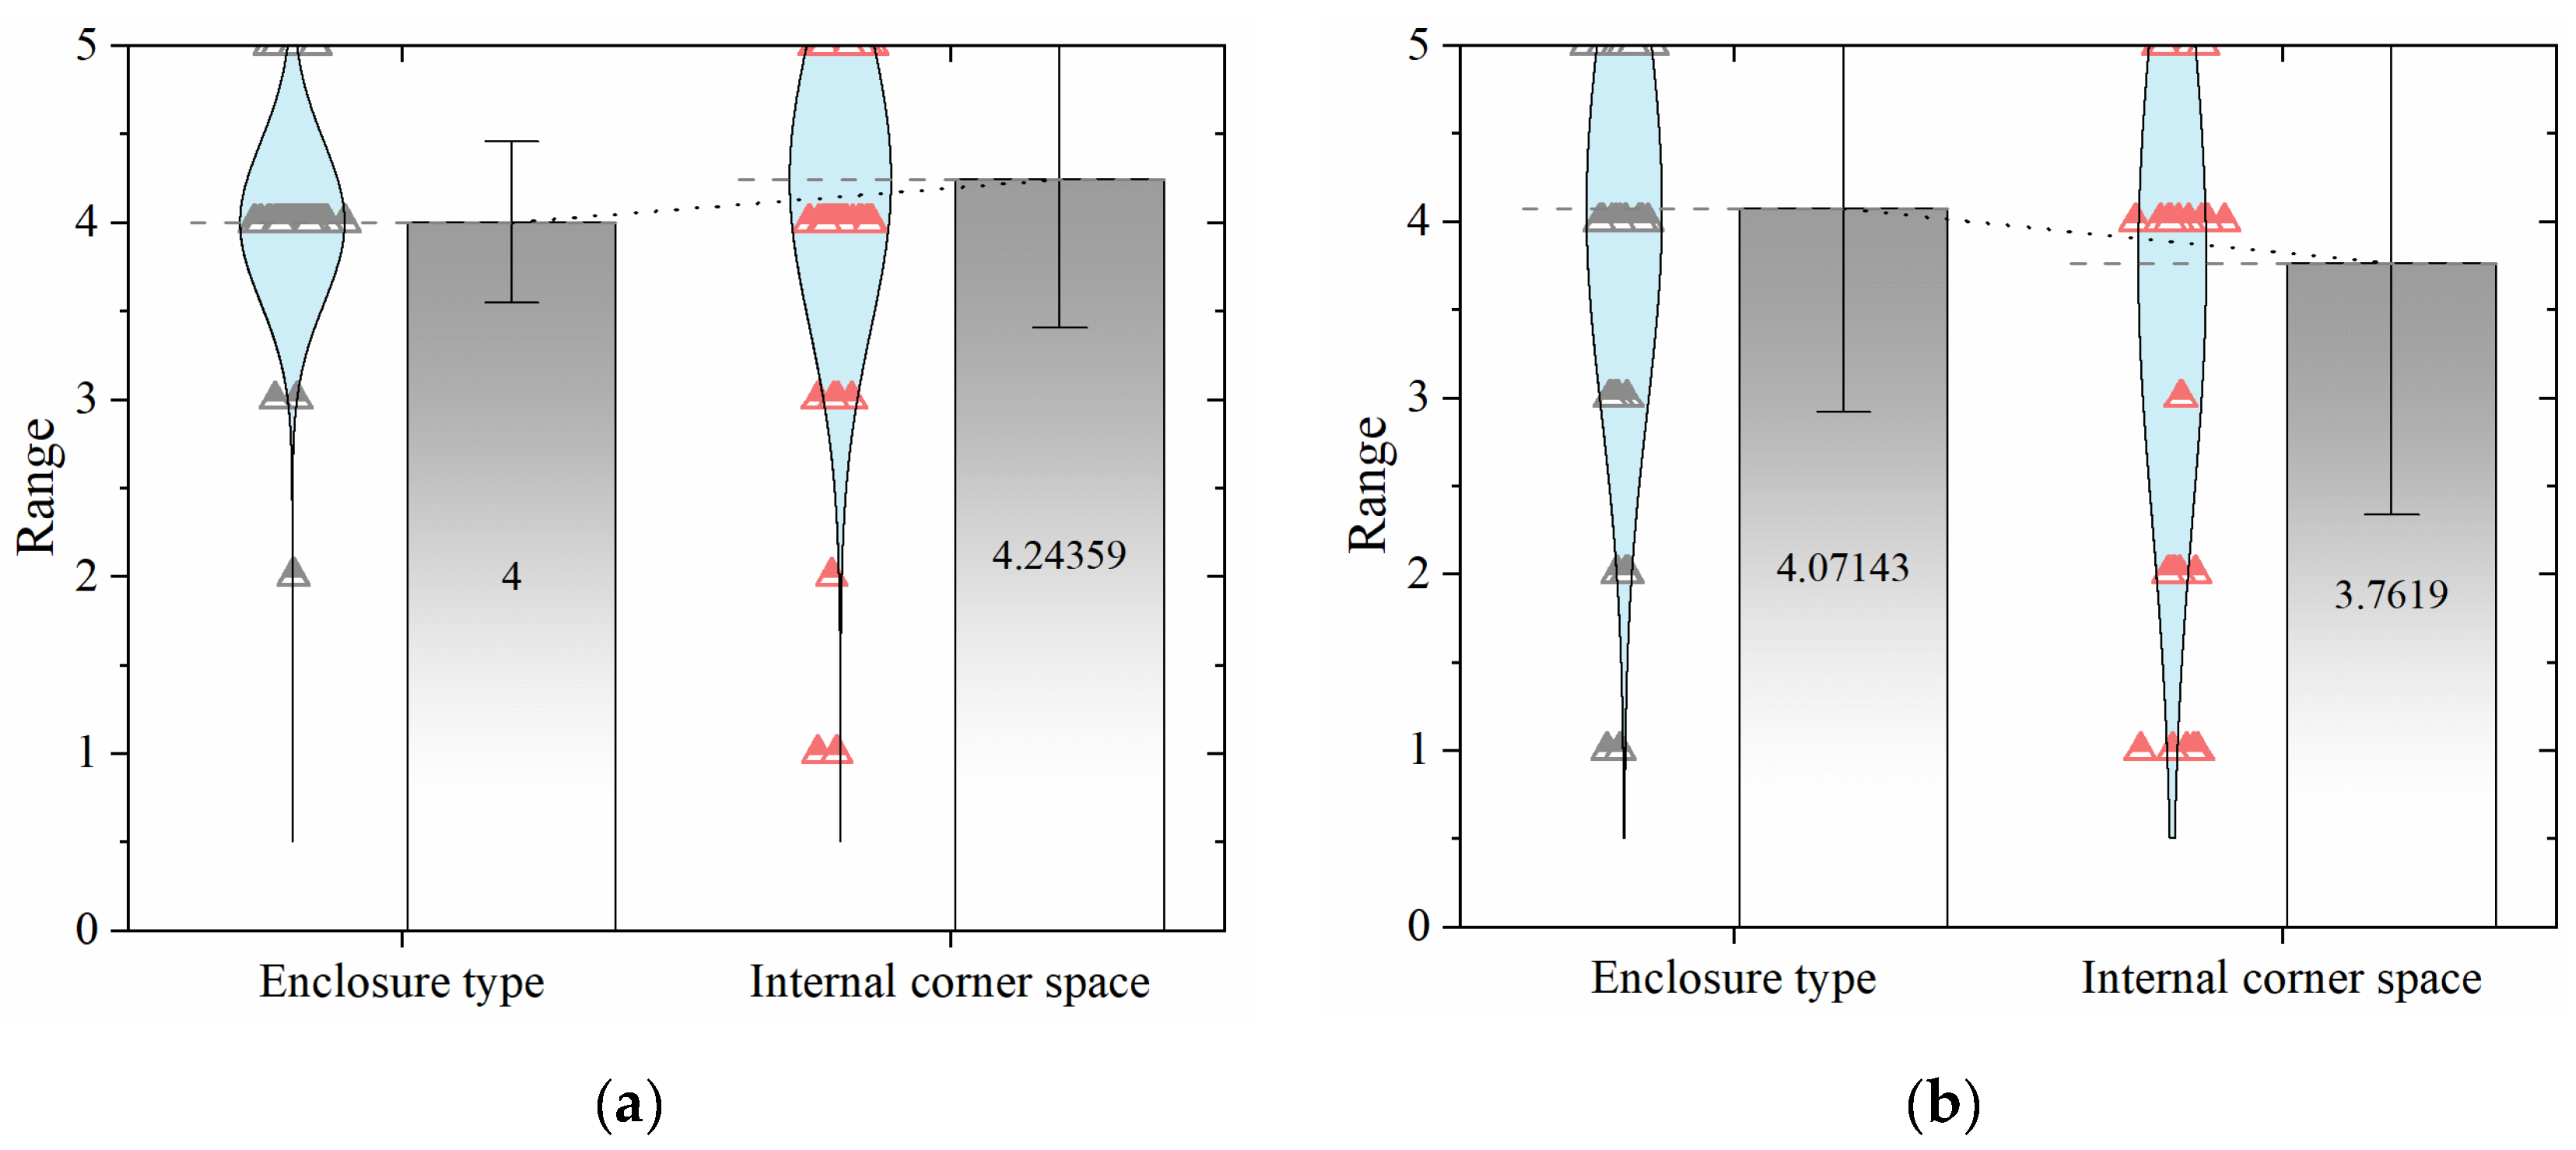
3.2.3. Analysis of Differences in Security Perception between the Left-Behind Child Group and the Guardian Group
4. Discussion
4.1. The Tendency of Left-Behind Children to Choose Independent Paths of Travel
4.2. Differences in Road Safety Perception between Left-Behind Children and Their Guardians
4.3. Limitations and Further Research
5. Conclusions
Author Contributions
Funding
Institutional Review Board Statement
Informed Consent Statement
Data Availability Statement
Acknowledgments
Conflicts of Interest
References
- Huang, Y.; Zhong, X.-N.; Li, Q.-Y.; Xu, D.; Zhang, X.-L.; Feng, C.; Yang, G.-X.; Bo, Y.-Y.; Deng, B. Health-Related Quality of Life of the Rural-China Left-behind Children or Adolescents and Influential Factors: A Cross-Sectional Study. Health Qual. Life Outcomes 2015, 13, 29. [Google Scholar] [CrossRef] [PubMed] [Green Version]
- Yang, G.; Bansak, C. Does Wealth Matter? An Assessment of China’s Rural-Urban Migration on the Education of Left-behind Children. China Econ. Rev. 2020, 59, 101365. [Google Scholar] [CrossRef]
- Ministry of Civil Affairs of the People’s Republic of China. Report on Left-Behind Children. 2016. Available online: http://www.gov.cn/zhengce/content/2016-02/14/content_5041066.htm (accessed on 2 November 2022).
- Barsoum, G. From Fisher Wives to Fish Vendors: Gendered Livelihood Transitions in a Fishing Village in Egypt. J. Rural Stud. 2021, 88, 117–125. [Google Scholar] [CrossRef]
- Liu, Z.; Zhao, P.; Liu, Q.; He, Z.; Kang, T. Uncovering Spatial and Social Gaps in Rural Mobility via Mobile Phone Big Data. Sci. Rep. 2023, 13, 6469. [Google Scholar] [CrossRef] [PubMed]
- Chang, F.; Shi, Y.; Shen, A.; Kohrman, A.; Li, K.; Wan, Q.; Kenny, K.; Rozelle, S. Understanding the Situation of China’s Left-behind Children: A Mixed-Methods Analysis. Dev. Econ. 2019, 57, 3–35. [Google Scholar] [CrossRef] [Green Version]
- Zhang, X.; Ray, S.A.; Hou, W.; Liu, X. Environmental Risk Factors and Their Different Effects in Depressive Symptoms of Left-behind Children in Rural China Compared with Non-Left-behind Children. Int. J. Environ. Res. Public Health 2021, 18, 10873. [Google Scholar] [CrossRef]
- Mo, X.; Shi, G.; Zhang, Y.; Xu, X.; Ji, C. How to Promote the Social–Emotional Competence of Rural Left-behind Children? An Empirical Study Based on Propensity Score Matching. Front. Psychol. 2023, 14, 1052693. [Google Scholar] [CrossRef]
- Fellmeth, G.; Rose-Clarke, K.; Zhao, C.; Busert, L.K.; Zheng, Y.; Massazza, A.; Sonmez, H.; Eder, B.; Blewitt, A.; Lertgrai, W.; et al. Health Impacts of Parental Migration on Left-behind Children and Adolescents: A Systematic Review and Meta-Analysis. Lancet 2018, 392, 2567–2582. [Google Scholar] [CrossRef] [Green Version]
- Data on Left-Behind Children in Rural China in 2018. Available online: https://xxgk.mca.gov.cn:8445/gdnps/pc/content.jsp?mtype=4&id=1662004999979993614 (accessed on 1 February 2023).
- China Rural Education Development Report 2020–2022. Available online: https://m.gmw.cn/baijia/2022-12/26/36256096.html (accessed on 3 November 2022).
- Guan, S.; Deng, G. Whole-Community Intervention for Left-behind Children in Rural China. Child. Youth Serv. Rev. 2019, 101, 1–11. [Google Scholar] [CrossRef]
- Chen, X.; Liang, N.; Ostertag, S.F. Victimization of Children Left behind in Rural China. J. Res. Crime Delinq. 2017, 54, 515–543. [Google Scholar] [CrossRef]
- Chen, Y.; Tan, Y.; Yan, S.; Li, L. Dog Bite and Injury Awareness and Prevention in Migrant and Left-behind Children in China. Sci. Rep. 2018, 8, 15959. [Google Scholar] [CrossRef] [Green Version]
- Ye, P.; Wang, Y.; Er, Y.; Deng, X.; Zhu, X.; Huang, X.; Zhao, C.-X.; Duan, L. Occurrence of Injuries among Left-behind Children from 27 Poor Rural Areas in 12 Provinces of China, 2016. Zhonghua Liu Xing Bing Xue Za Zhi 2019, 40, 1369–1375. [Google Scholar] [CrossRef]
- Hu, G.; Baker, S.P.; Baker, T.D. Urban-Rural Disparities in Injury Mortality in China, 2006. J. Rural Health 2010, 26, 73–77. [Google Scholar] [CrossRef]
- Shen, M.; Yang, S.; Han, J.; Shi, J.; Yang, R.; Du, Y.; Stallones, L. Non-Fatal Injury Rates among the “Left-behind Children” of Rural China. Inj. Prev. 2009, 15, 244–247. [Google Scholar] [CrossRef]
- Koh, S.; Kenji, D.; Franklin, R. The Impact of Rurality on Child Road Traffic Death in High-Income Countries. Aust. J. Rural Health 2023, 31, 408–416. [Google Scholar] [CrossRef]
- Lundqvist, P. Children in Relation to Agricultural Health and Safety in Sweden: A Perspective. Front. Public Health 2023, 10, 1070027. [Google Scholar] [CrossRef]
- Hu, H.; Gao, J.; Jiang, H.; Xing, P. A Comparative Study of Unintentional Injuries among Schooling Left-Behind, Migrant and Residential Children in China. Int. J. Equity Health 2018, 17, 47. [Google Scholar] [CrossRef] [Green Version]
- Ma, S.; Jiang, M.; Wang, F.; Lu, J.; Li, L.; Hesketh, T. Left-behind Children and Risk of Unintentional Injury in Rural China—A Cross-Sectional Survey. Int. J. Environ. Res. Public Health 2019, 16, 403. [Google Scholar] [CrossRef] [Green Version]
- Hung, J. Policy-Oriented Examination of Left-behind Children’s Health and Well-Being in China. Sustainability 2023, 15, 5977. [Google Scholar] [CrossRef]
- Crouch, E.; Hung, P.; Benavidez, G.; Giannouchos, T.V.; Brown, M.J. Rural-Urban Differences in Access to Care among Children and Adolescents in the United States. J. Rural Health 2023, 24, 1–8. [Google Scholar] [CrossRef]
- Wolfe, M.K.; McDonald, N.C. Association between Neighborhood Social Environment and Children’s Independent Mobility. J. Phys. Act. Health 2016, 13, 970–979. [Google Scholar] [CrossRef] [PubMed]
- Lin, E.-Y.; Witten, K.; Oliver, M.; Carroll, P.; Asiasiga, L.; Badland, H.; Parker, K. Social and Built-Environment Factors Related to Children’s Independent Mobility: The Importance of Neighbourhood Cohesion and Connectedness. Health Place 2017, 46, 107–113. [Google Scholar] [CrossRef] [PubMed]
- Marzi, I.; Demetriou, Y.; Reimers, A.K. Social and Physical Environmental Correlates of Independent Mobility in Children: A Systematic Review Taking Sex/Gender Differences into Account. Int. J. Health Geogr. 2018, 17, 24. [Google Scholar] [CrossRef] [PubMed] [Green Version]
- Nevelsteen, K.; Steenberghen, T.; Van Rompaey, A.; Uyttersprot, L. Controlling Factors of the Parental Safety Perception on Children’s Travel Mode Choice. Accid. Anal. Prev. 2012, 45, 39–49. [Google Scholar] [CrossRef]
- Kweon, B.-S.; Shin, W.-H.; Ellis, C.D. School Walk Zone: Identifying Environments That Foster Walking and Biking to School. Sustainability 2023, 15, 2912. [Google Scholar] [CrossRef]
- Zhao, J.; Su, W.; Luo, J.; Zuo, J. Evaluation and Optimization of Walkability of Children’s School Travel Road for Accessibility and Safety Improvement. Int. J. Environ. Res. Public Health 2021, 19, 71. [Google Scholar] [CrossRef]
- Qiu, L.; Zhu, X. Housing and Community Environments vs. Independent Mobility: Roles in Promoting Children’s Independent Travel and Unsupervised Outdoor Play. Int. J. Environ. Res. Public Health 2021, 18, 2132. [Google Scholar] [CrossRef]
- Mitra, R.; Faulkner, G.E.; Buliung, R.N.; Stone, M.R. Do Parental Perceptions of the Neighbourhood Environment Influence Children’s Independent Mobility? Evidence from Toronto, Canada. Urban Stud. 2014, 51, 3401–3419. [Google Scholar] [CrossRef]
- Hayba, N.; Shi, Y.; Allman-Farinelli, M. Enabling Better Physical Activity and Screen Time Behaviours for Adolescents from Middle Eastern Backgrounds: Semi-Structured Interviews with Parents. Int. J. Environ. Res. Public Health 2021, 18, 12787. [Google Scholar] [CrossRef]
- Crawford, S.B.; Bennetts, S.K.; Hackworth, N.J.; Green, J.; Graesser, H.; Cooklin, A.R.; Matthews, J.; Strazdins, L.; Zubrick, S.R.; D’Esposito, F.; et al. Worries, “Weirdos”, Neighborhoods and Knowing People: A Qualitative Study with Children and Parents Regarding Children’s Independent Mobility. Health Place 2017, 45, 131–139. [Google Scholar] [CrossRef]
- Wilson, K.; Coen, S.E.; Piaskoski, A.; Gilliland, J.A. Children’s Perspectives on Neighbourhood Barriers and Enablers to Active School Travel: A Participatory Mapping Study. Can. Geogr. Géogr. Can. 2018, 63, 112–128. [Google Scholar] [CrossRef] [Green Version]
- Trapp, G.S.A.; Giles-Corti, B.; Christian, H.E.; Bulsara, M.; Timperio, A.F.; McCormack, G.R.; Villaneuva, K.P. Increasing Children’s Physical Activity. Health Educ. Behav. 2011, 39, 172–182. [Google Scholar] [CrossRef]
- Alparone, F.R.; Pacilli, M.G. On Children’s Independent Mobility: The Interplay of Demographic, Environmental, and Psychosocial Factors. Child. Geogr. 2012, 10, 109–122. [Google Scholar] [CrossRef] [Green Version]
- Schoeppe, S.; Duncan, M.J.; Badland, H.M.; Rebar, A.L.; Vandelanotte, C. Too far from Home? Adult Attitudes on Children’s Independent Mobility Range. Child. Geogr. 2015, 14, 482–489. [Google Scholar] [CrossRef]
- Jebb, A.T.; Ng, V.; Tay, L. A Review of Key Likert Scale Development Advances: 1995–2019. Front. Psychol. 2021, 12, 637547. [Google Scholar] [CrossRef]
- Road Opening Map Data of Wangcheng DISTRICT, Changsha City, Hunan Province. Available online: https://hunan.tianditu.gov.cn/TDTHN/portal/index.html (accessed on 2 March 2023).
- Cerin, E.; Saelens, B.E.; Sallis, J.F.; Frank, L.D. Neighborhood Environment Walkability Scale. Med. Sci. Sport. Exerc. 2006, 38, 1682–1691. [Google Scholar] [CrossRef] [Green Version]
- Kim, Y.-J.; Lee, C. Built and Natural Environmental Correlates of Parental Safety Concerns for Children’s Active Travel to School. Int. J. Environ. Res. Public Health 2020, 17, 517. [Google Scholar] [CrossRef] [Green Version]
- Hillier, B. Centrality as a Process: Accounting for Attraction Inequalities in Deformed Grids. Urban Des. Int. 1999, 4, 107–127. [Google Scholar] [CrossRef]
- Chai, Y.; Qiao, W.; Hu, Y.; He, T.; Jia, K.; Feng, T.; Wang, Y. Land-Use Transition of Tourist Villages in the Metropolitan Suburbs and Its Driving Forces: A Case Study of She Village in Nanjing City, China. Land 2021, 10, 168. [Google Scholar] [CrossRef]
- Esposito, D.; Santoro, S.; Camarda, D. Agent-Based Analysis of Urban Spaces Using Space Syntax and Spatial Cognition Approaches: A Case Study in Bari, Italy. Sustainability 2020, 12, 4625. [Google Scholar] [CrossRef]
- Ding, J.; Gao, Z.; Ma, S. Understanding Social Spaces in Tourist Villages through Space Syntax Analysis: Cases of Villages in Huizhou, China. Sustainability 2022, 14, 12376. [Google Scholar] [CrossRef]
- Li, R.; Mao, L. Spatial Characteristics of Suburban Villages Based on Spatial Syntax. Sustainability 2022, 14, 14195. [Google Scholar] [CrossRef]
- Wang, X.; Zhu, R.; Che, B. Spatial Optimization of Tourist-Oriented Villages by Space Syntax Based on Population Analysis. Sustainability 2022, 14, 11260. [Google Scholar] [CrossRef]
- Dao-de, S. Selection of the Linear Regression Model according to the Parameter Estimation. Wuhan Univ. J. Nat. Sci. 2000, 5, 400–405. [Google Scholar] [CrossRef]
- Eisinga, R.; Grotenhuis, M.T.; Pelzer, B. The Reliability of a Two-Item Scale: Pearson, Cronbach, or Spearman-Brown? Int. J. Public Health 2012, 58, 637–642. [Google Scholar] [CrossRef]
- Chung, R.H.G.; Kim, B.S.K.; Abreu, J.M. Asian American Multidimensional Acculturation Scale: Development, Factor Analysis, Reliability, and Validity. Cult. Divers. Ethn. Minor. Psychol. 2004, 10, 66–80. [Google Scholar] [CrossRef] [Green Version]
- Hauke, J.; Kossowski, T. Comparison of Values of Pearson’s and Spearman’s Correlation Coefficients on the Same Sets of Data. Quaest. Geogr. 2011, 30, 87–93. [Google Scholar] [CrossRef] [Green Version]
- Arndt, S.; Turvey, C.; Andreasen, N.C. Correlating and Predicting Psychiatric Symptom Ratings: Spearmans R versus Kendalls Tau Correlation. J. Psychiatr. Res. 1999, 33, 97–104. [Google Scholar] [CrossRef]
- Barassi, M.R. Microeconometrics; Methods and Applications. Econ. J. 2006, 116, F161–F162. [Google Scholar] [CrossRef]
- Zhou, Y.; Wang, M.; Lin, S.; Qian, C. Relationship between Children’s Independent Activities and the Built Environment of Outdoor Activity Space in Residential Neighborhoods: A Case Study of Nanjing. Int. J. Environ. Res. Public Health 2022, 19, 9860. [Google Scholar] [CrossRef]
- Ren, K.; Xu, L. Dataset on Energy Efficiency Assessment and Measurement Method for Child-Friendly Space in Cold Residential Area. Data Brief 2017, 14, 148–155. [Google Scholar] [CrossRef]
- Ikeda, E.; Mavoa, S.; Cavadino, A.; Carroll, P.; Hinckson, E.; Witten, K.; Smith, M. Keeping Kids Safe for Active Travel to School: A Mixed Method Examination of School Policies and Practices and Children’s School Travel Behaviour. Travel Behav. Soc. 2020, 21, 57–68. [Google Scholar] [CrossRef]
- Larsen, K.; Gilliland, J.; Hess, P.; Tucker, P.; Irwin, J.; He, M. The Influence of the Physical Environment and Sociodemographic Characteristics on Children’s Mode of Travel to and from School. Am. J. Public Health 2009, 99, 520–526. [Google Scholar] [CrossRef]
- Lin, J.-J.; Chang, H.-T. Built Environment Effects on Children’s School Travel in Taipai: Independence and Travel Mode. Urban Stud. 2009, 47, 867–889. [Google Scholar] [CrossRef]
- Smith, M.; Amann, R.; Cavadino, A.; Raphael, D.; Kearns, R.; Mackett, R.; Mackay, L.; Carroll, P.; Forsyth, E.; Mavoa, S.; et al. Children’s Transport Built Environments: A Mixed Methods Study of Associations between Perceived and Objective Measures and Relationships with Parent Licence for Independent Mobility in Auckland, New Zealand. Int. J. Environ. Res. Public Health 2019, 16, 1361. [Google Scholar] [CrossRef] [Green Version]
- Landis, B.W.; Vattikuti, V.R.; Ottenberg, R.M.; McLeod, D.S.; Guttenplan, M. Modeling the Roadside Walking Environment: Pedestrian Level of Service. Transp. Res. Rec. J. Transp. Res. Board 2001, 1773, 82–88. [Google Scholar] [CrossRef]
- Vlaar, J.; Brussoni, M.; Janssen, I.; Mâsse, L.C. Roaming the Neighbourhood: Influences of Independent Mobility Parenting Practices and Parental Perceived Environment on Children’s Territorial Range. Int. J. Environ. Res. Public Health 2019, 16, 3129. [Google Scholar] [CrossRef] [Green Version]
- Desjardins, E.; Tavakoli, Z.; Páez, A.; Waygood, E.O.D. Children’s Access to Non-School Destinations by Active or Independent Travel: A Scoping Review. Int. J. Environ. Res. Public Health 2022, 19, 12345. [Google Scholar] [CrossRef]


| Category | Variable | Interpretation |
|---|---|---|
| Vision Permeability | Plant density | Plants shade the road and create visual blind spots. |
| Recognizable signs | Danger zone warning signs alert children to the dangers of the current environment. | |
| Turning angle | The size of the angle affects road visibility. | |
| Lighting system | The sufficiency of the illumination at night. | |
| Interface Dissociability | Boundary staggered layer | The ratio of the width of the road to the adjacent boundary. |
| Enclosure type | One-sided, two-sided, and three-sided enclosing patterns of roads. | |
| Guardrail ratio | Installed guardrails in dangerous areas such as water bodies and steep slopes. | |
| Internal corner space | The courtyard space between the building and the road. | |
| Travel Accessibility | Road scale | Road width and whether people and vehicles are separated. |
| Road slope | The angle between the lowest and highest point of a road. | |
| Hard pavement | Roads are paved with cement, asphalt, and other hard materials. | |
| Potential path | The closest and most frequented travel route. | |
| Neighborhood Shelter | Dangerous animals | Being attacked by stray dogs, geese, and other animals. |
| Strangers | Strangers are frequent on the roads. | |
| Street eye | Window-fronted residential buildings face the road. | |
| Abandoned space | Dilapidated buildings, construction sites, etc., where accidents can occur. | |
| Electronic tools | Wearing smart watches, mobile phones, and other communication tools. | |
| Acquaintances present | The road is beside a place where acquaintances often hang out. | |
| Social concerns | Bullies are frequent on the road. | |
| Monitoring facilities | Roads with real-time video surveillance. |
| Nonstandardized Coefficient | Standardization Coefficient | t | p | VIF | ||
|---|---|---|---|---|---|---|
| B | Standard Deviation | Beta | ||||
| Constant | 1.472 | 0.017 | - | 84.193 | 0.000 ** | - |
| Location integration | 0.000 | 0.000 | 0.982 | 32.229 | 0.000 ** | 1.000 |
| R2 | 0.965 | |||||
| Adjust R2 | 0.964 | |||||
| F | F (1,38) = 1038.704, p = 0.000 | |||||
| D-W value | 0.773 | |||||
| Item | Average Value | Standard Deviation | CV Coefficient | Weight |
|---|---|---|---|---|
| Location integration | 111,328.025 | 69,465.157 | 62.40% | 0.7998 |
| Choice | 1.952 | 0.305 | 15.62% | 0.2002 |
| Influencing Factor | p-Value | Correlation Coefficient |
|---|---|---|
| Plant density | 0.010 | −0.257 ** |
| Recognizable signs | 0.018 | −0.236 * |
| Turning angle | 0.045 | −0.201 * |
| Road slope | 0.017 | −0.239 * |
| Electronic tools | 0.001 | −0.321 ** |
| Social concerns | 0.009 | −0.260 ** |
| Monitoring facilities | 0.000 | −0.354 ** |
| Influencing Factor | p-Value | Correlation Coefficient |
|---|---|---|
| Plant density | 0.001 | 0.226 ** |
| Road scale | 0.017 | 0.169 * |
| Electronic tools | 0.045 | −0.142 * |
| Regression Coefficient | 95% CI | VIF | |
|---|---|---|---|
| Constant | 1.000 ** (2,201,030,961,016,510.750) | 1.000~1.000 | - |
| Dangerous animals | 0.000 ** (5.540) | 0.000~0.000 | 1.094 |
| Strangers | 0.000 ** (4.507) | 0.000~0.000 | 1.094 |
| Sample size | 71 | ||
| R2 | null | ||
| Adjust R2 | null | ||
| F value | F (2,68) = −34.000, p = null | ||
| Regression Coefficient | 95% CI | Collinear Diagnosis | ||
|---|---|---|---|---|
| VIF | Tolerance | |||
| Constant | 1.000 ** (1,352,507,433,325,933.750) | 1.000~1.000 | - | - |
| Internal corner space | −0.000 ** (−4.405) | −0.000~−0.000 | 1.051 | 0.951 |
| Sample size | 120 | |||
| R2 | null | |||
| Adjust R2 | null | |||
| F value | F (2,117) = −58.500, p = null | |||
| Regression Coefficient | 95% CI | Collinear Diagnosis | ||
|---|---|---|---|---|
| VIF | Tolerance | |||
| Constant | 2.000 ** (530,879,512,148,717.813) | 2.000~2.000 | - | - |
| Enclosure type | −0.000 * (−2.206) | −0.000~−0.000 | 1.028 | 0.972 |
| Sample size | 80 | |||
| R2 | null | |||
| Adjust R2 | null | |||
| F value | F (3,76) = −25.333, p = null | |||
| Influencing Factor | Mean Decrease Accuracy | Weight |
|---|---|---|
| Dangerous animals | 2.168102094 | 0.024532451 |
| Strangers | 2.286783068 | 0.025875346 |
| Monitoring facilities | 3.038366986 | 0.034379649 |
| Enclosure type | 3.836239636 | 0.043407716 |
| Internal corner space | 4.347221906 | 0.049189569 |
| Road slope | 6.468882858 | 0.07319653 |
| Recognizable signs | 7.348394323 | 0.083148354 |
| Road scale | 8.68025325 | 0.098218569 |
| Social concerns | 9.497003152 | 0.107460235 |
| Plant density | 12.41074979 | 0.140429783 |
| Turning angle | 12.44650032 | 0.140834306 |
| Electronic tools | 15.84840911 | 0.179327493 |
| Left-Behind Children and Guardians (Mean ± Standard Deviation) | t | p | ||
|---|---|---|---|---|
| 1 (n = 78) | 2 (n = 42) | |||
| Plant density | 1.385 ± 0.725 | 4.357 ± 0.906 | −19.599 | 0 *** |
| Recognizable signs | 3.218 ± 1.065 | 3.214 ± 1.116 | 0.018 | 0.986 |
| Turning angle | 2.423 ± 1.013 | 3.262 ± 1.061 | −4.256 | 0 *** |
| Enclosure type | 4 ± 0.456 | 4.071 ± 1.156 | −0.482 | 0.631 |
| Internal corner space | 4.244 ± 0.84 | 3.762 ± 1.428 | 2.327 | 0.022 * |
| Road scale | 2.423 ± 0.987 | 4.333 ± 0.816 | −10.716 | 0 *** |
| Road slope | 3.141 ± 1.181 | 3.381 ± 1.058 | −1.1 | 0.274 |
| Dangerous animals | 3.41 ± 0.946 | 3.738 ± 0.885 | −1.852 | 0.067 |
| Strangers | 3.987 ± 0.497 | 3.738 ± 0.828 | 2.06 | 0.042 * |
| Electronic tools | 3.974 ± 0.394 | 3.857 ± 0.718 | 1.157 | 0.25 |
| Social concerns | 4.013 ± 0.522 | 3.667 ± 0.874 | 2.716 | 0.008 ** |
| Monitoring facilities | 4.333 ± 0.832 | 3.738 ± 0.885 | 3.655 | 0 *** |
| Male Left-Behind Children and Female Left-Behind Children (Mean ± Standard Deviation) | t | p | ||
|---|---|---|---|---|
| 1 (n = 62) | 2 (n = 58) | |||
| Plant density | 2.5 ± 1.637 | 2.345 ± 1.628 | 0.52 | 0.604 |
| Recognizable signs | 3.161 ± 1.089 | 3.276 ± 1.073 | −0.58 | 0.563 |
| Turning angle | 2.661 ± 1.159 | 2.776 ± 1.044 | −0.568 | 0.571 |
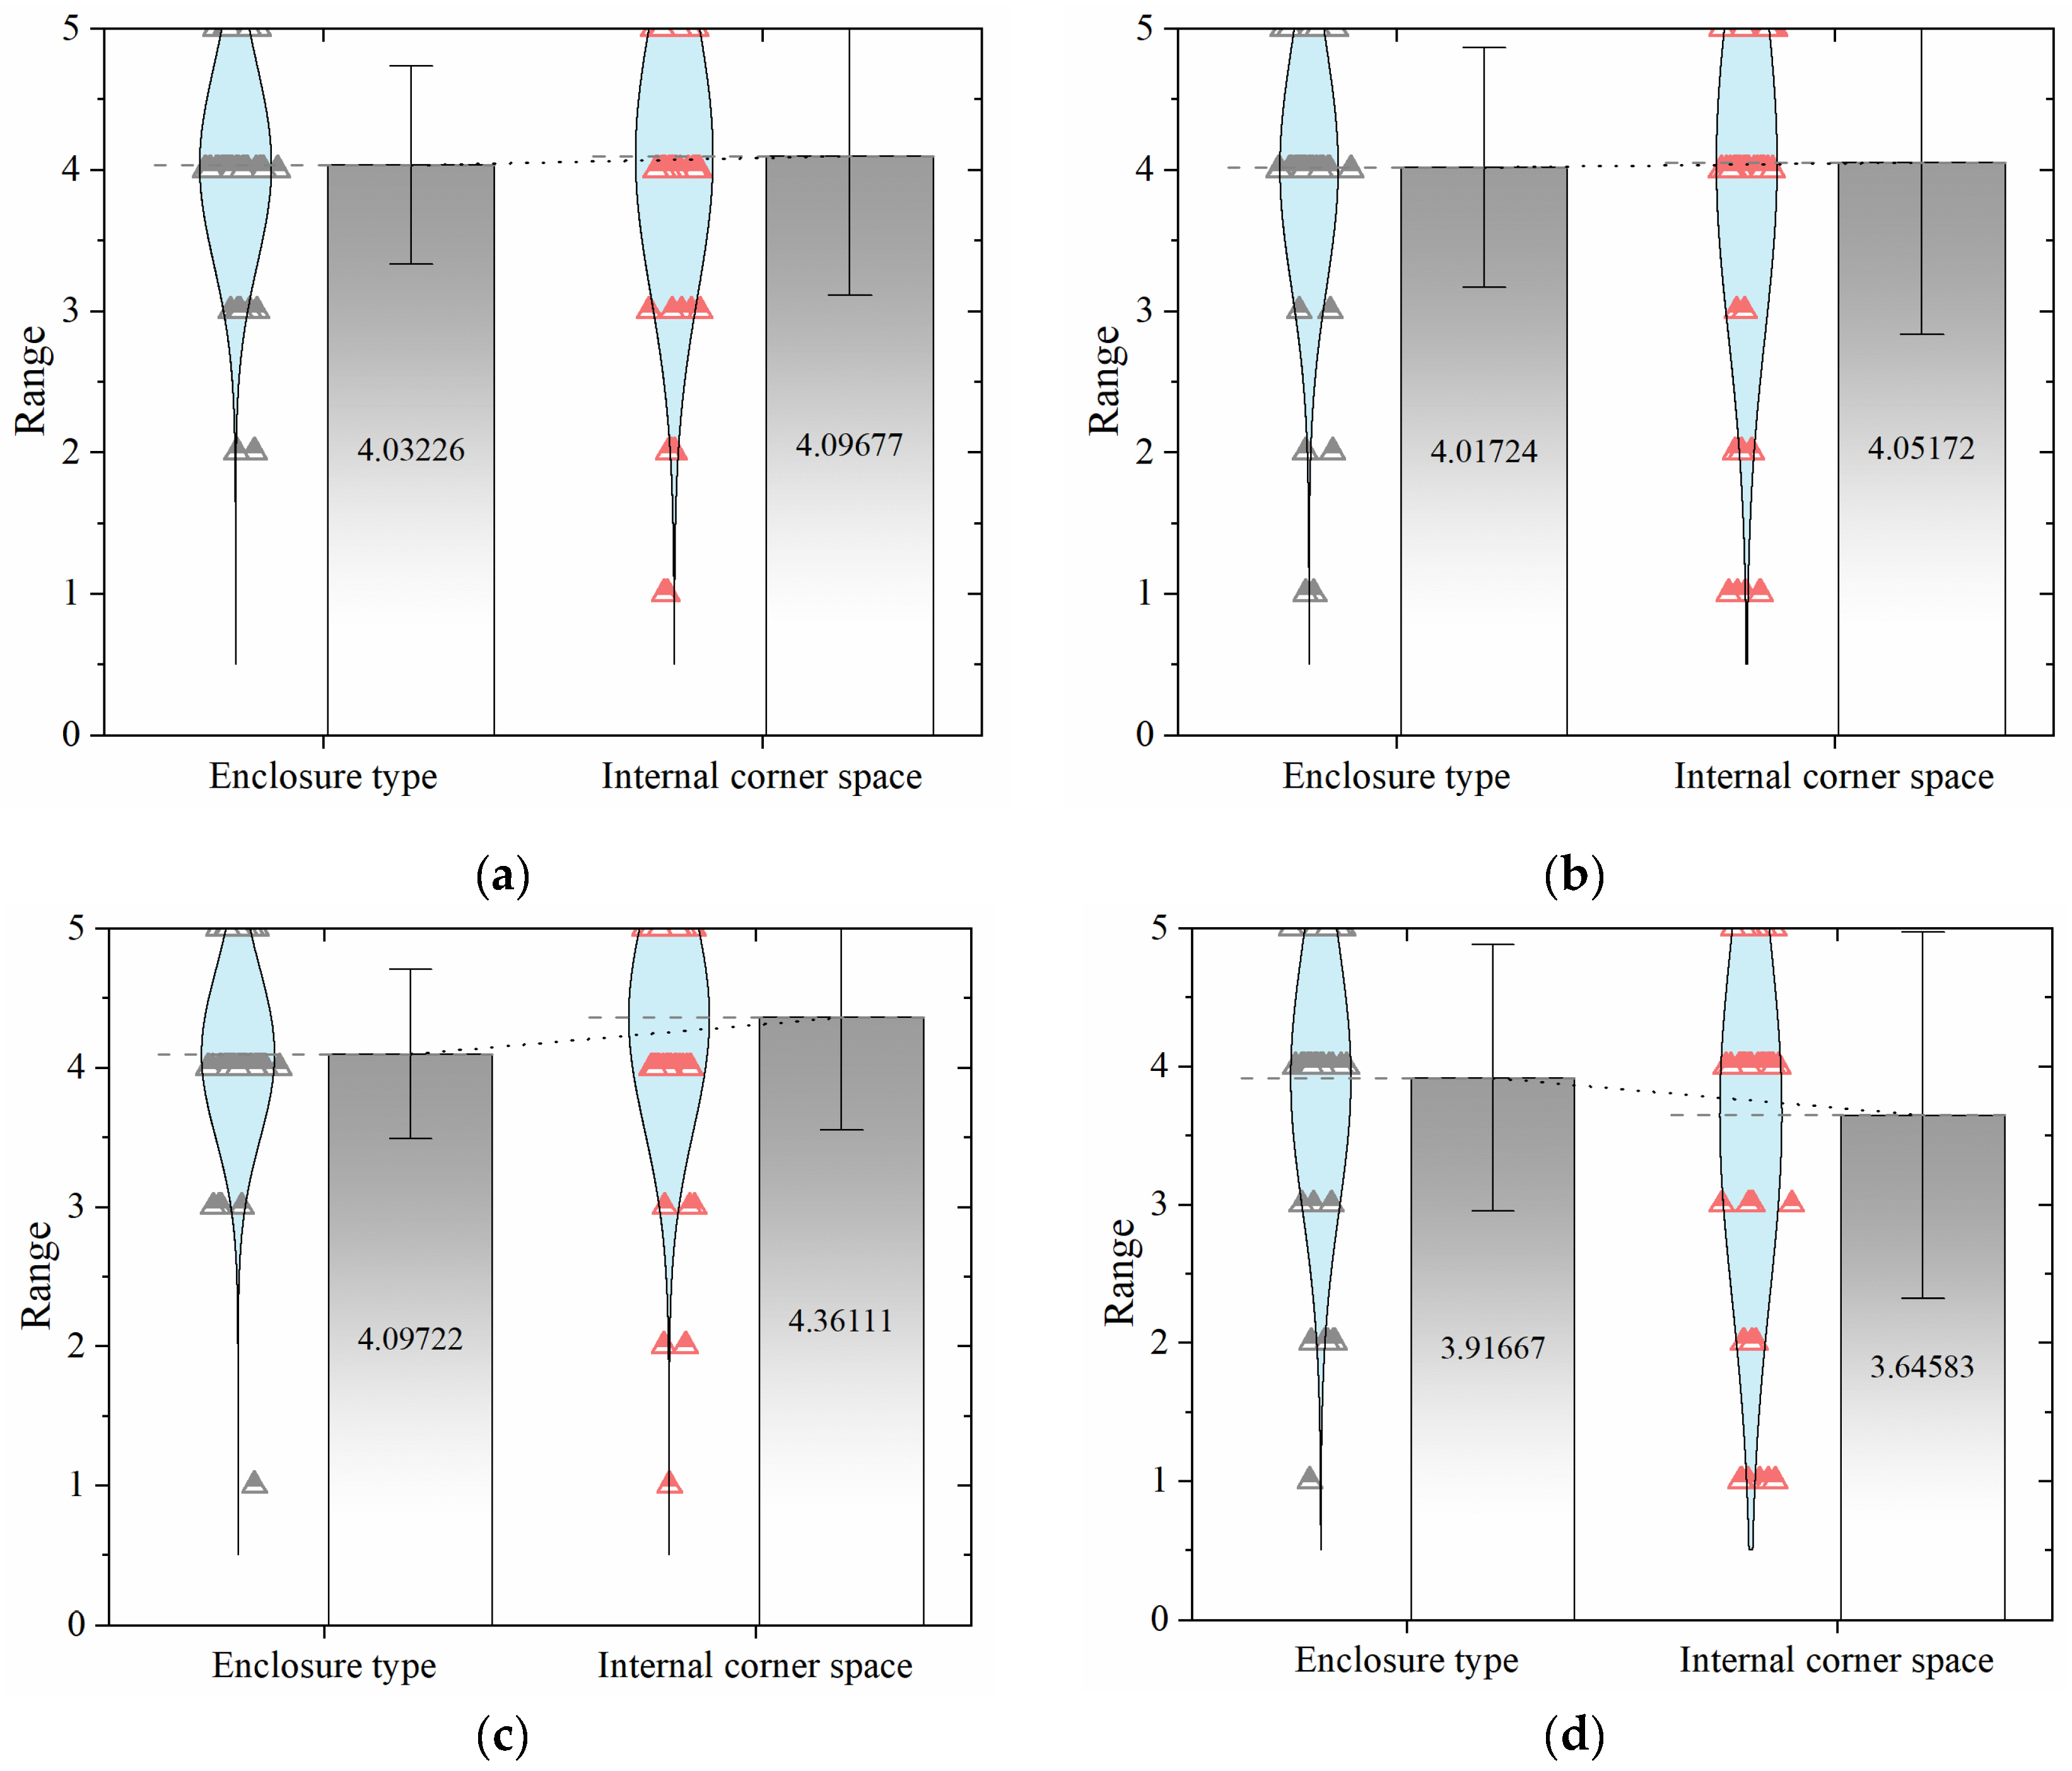
| Enclosure type | 4.032 ± 0.701 | 4.017 ± 0.848 | 0.106 | 0.916 |
| Internal corner space | 4.097 ± 0.987 | 4.052 ± 1.22 | 0.223 | 0.824 |
| Road scale | 3.161 ± 1.296 | 3.017 ± 1.318 | 0.604 | 0.547 |
| Road slope | 3.403 ± 1.137 | 3.034 ± 1.123 | 1.785 | 0.077 |
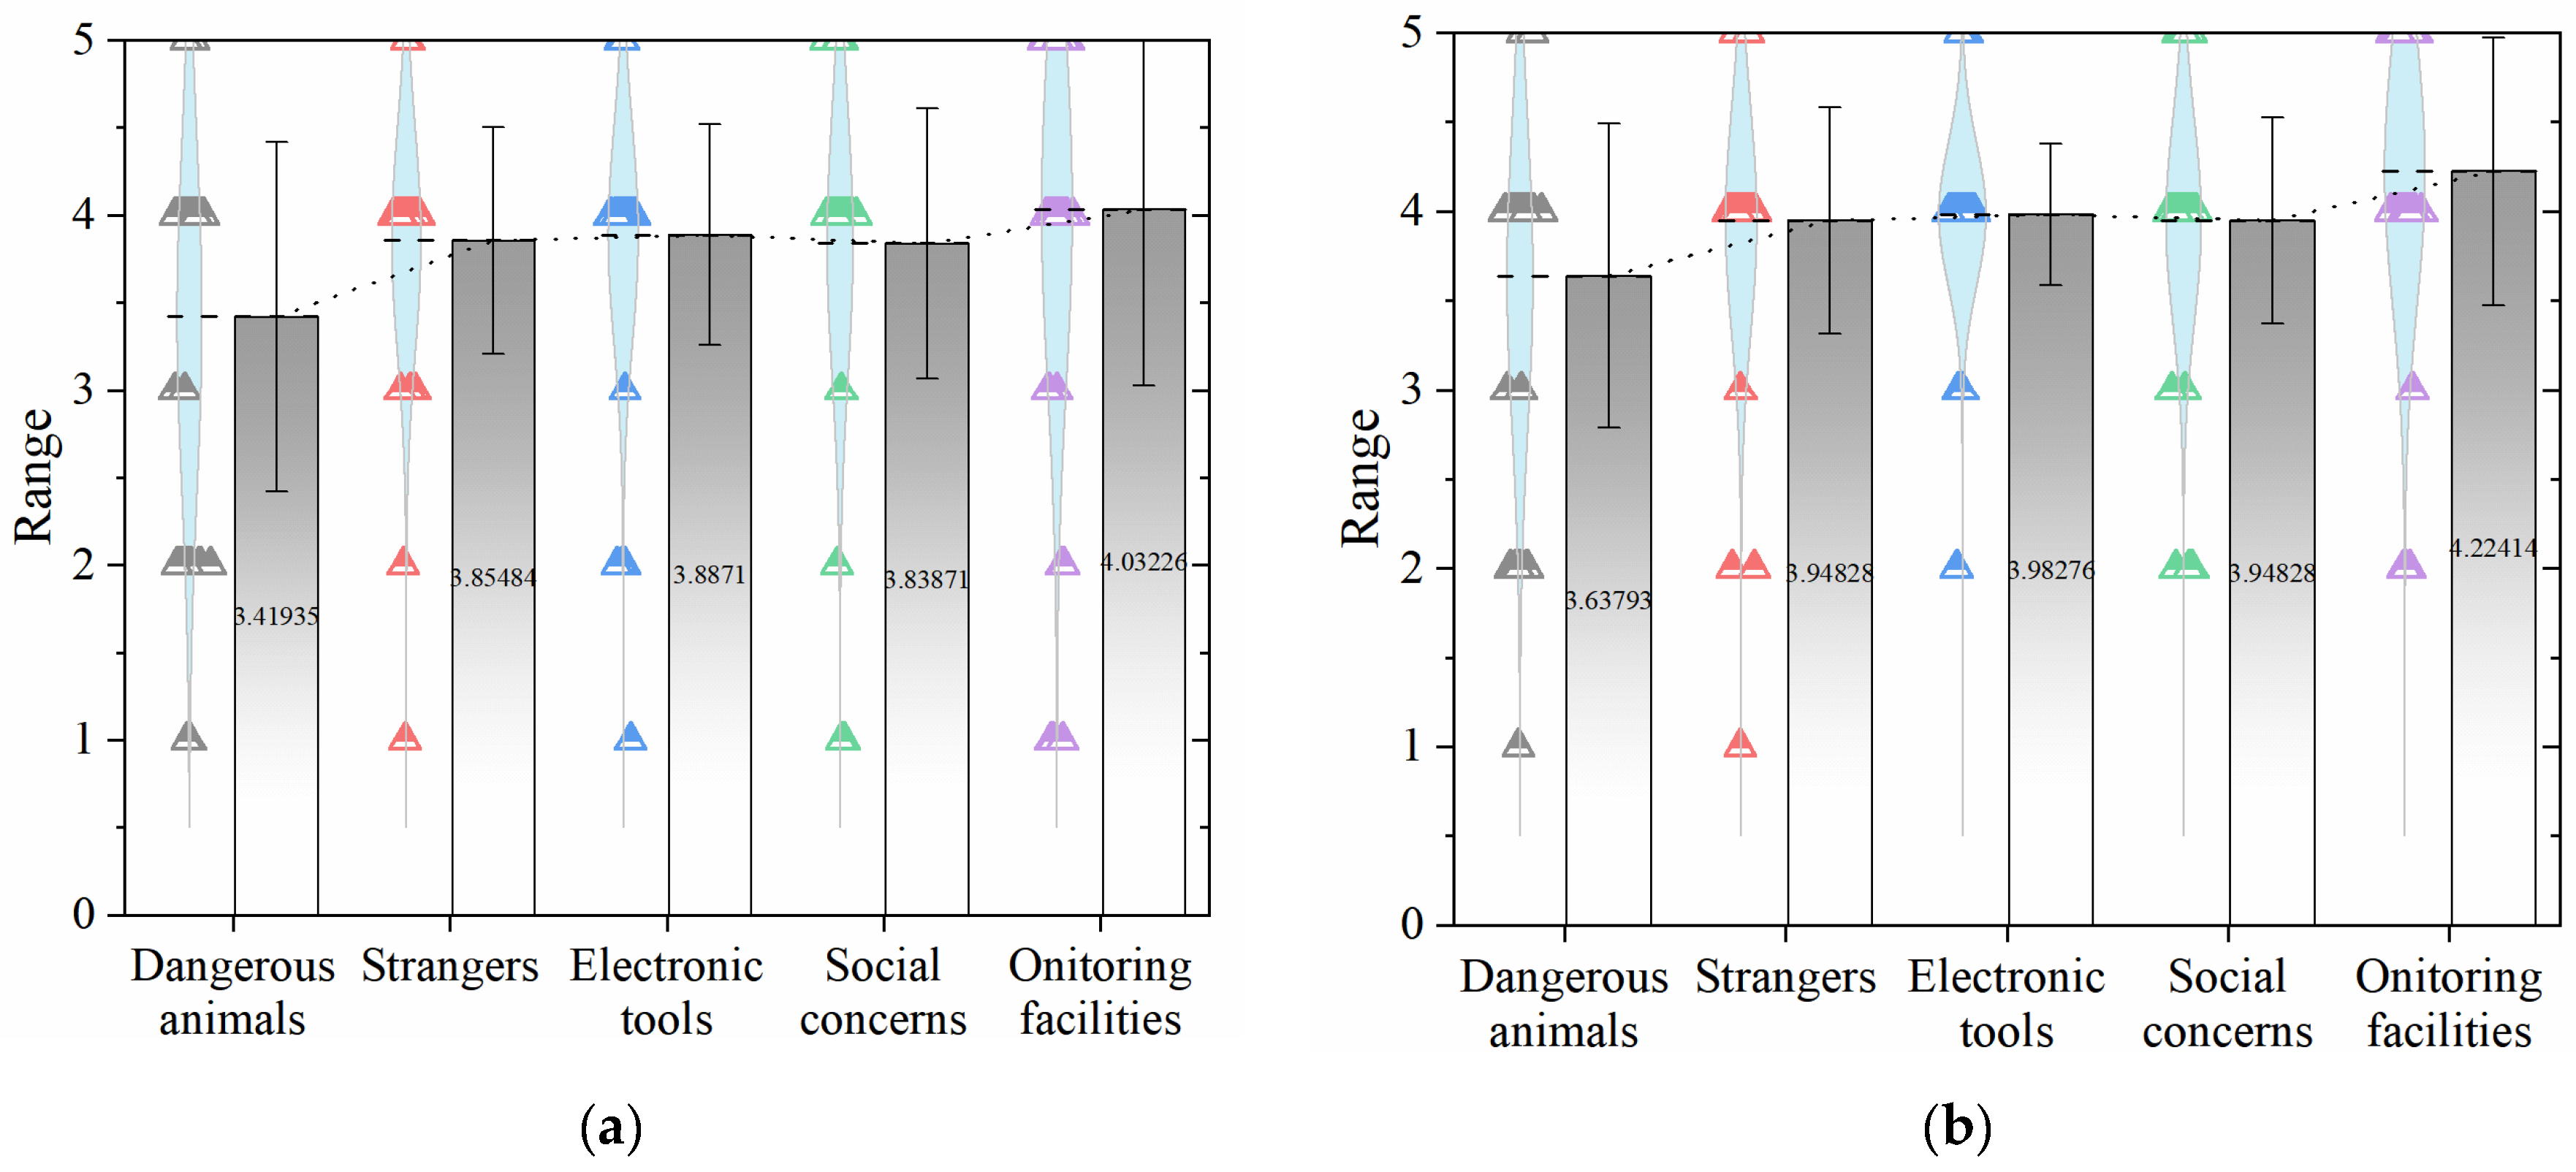
| Dangerous animals | 3.419 ± 1.001 | 3.638 ± 0.852 | −1.284 | 0.202 |
| Strangers | 3.855 ± 0.649 | 3.948 ± 0.633 | −0.798 | 0.427 |
| Electronic tools | 3.887 ± 0.63 | 3.983 ± 0.397 | −0.987 | 0.325 |
| Social concerns | 3.839 ± 0.772 | 3.948 ± 0.575 | −0.877 | 0.382 |
| Monitoring facilities | 4.032 ± 1.008 | 4.224 ± 0.75 | −1.177 | 0.242 |
| Left-Behind Children Aged 6–12 and 13–16 (Mean ± Standard Deviation) | t | p | ||
|---|---|---|---|---|
| 1 (n = 72) | 2 (n = 48) | |||
| Plant density | 2.278 ± 1.594 | 2.646 ± 1.669 | −1.216 | 0.226 |
| Recognizable signs | 3.333 ± 0.979 | 3.042 ± 1.202 | 1.458 | 0.147 |
| Turning angle | 2.681 ± 1.059 | 2.771 ± 1.171 | −0.438 | 0.662 |
| Enclosure type | 4.097 ± 0.609 | 3.917 ± 0.964 | 1.258 | 0.211 |
| Internal corner space | 4.361 ± 0.81 | 3.646 ± 1.329 | 3.663 | 0 *** |
| Road scale | 3.042 ± 1.358 | 3.167 ± 1.226 | −0.513 | 0.609 |
| Road slope | 3.181 ± 1.117 | 3.292 ± 1.184 | −0.521 | 0.603 |
| Dangerous animals | 3.597 ± 0.85 | 3.417 ± 1.048 | 1.037 | 0.302 |
| Strangers | 4.028 ± 0.443 | 3.708 ± 0.824 | 2.75 | 0.007 ** |
| Electronic tools | 4.014 ± 0.205 | 3.812 ± 0.79 | 2.066 | 0.041 * |
| Social concerns | 3.958 ± 0.426 | 3.792 ± 0.944 | 1.313 | 0.192 |
| Monitoring facilities | 4.208 ± 0.749 | 4 ± 1.072 | 1.253 | 0.213 |
Disclaimer/Publisher’s Note: The statements, opinions and data contained in all publications are solely those of the individual author(s) and contributor(s) and not of MDPI and/or the editor(s). MDPI and/or the editor(s) disclaim responsibility for any injury to people or property resulting from any ideas, methods, instructions or products referred to in the content. |
© 2023 by the authors. Licensee MDPI, Basel, Switzerland. This article is an open access article distributed under the terms and conditions of the Creative Commons Attribution (CC BY) license (https://creativecommons.org/licenses/by/4.0/).
Share and Cite
Tang, Y.; Zhu, L.; Li, J.; Zhang, N.; Sun, Y.; Wang, X.; Wu, H. Assessment of Perceived Factors of Road Safety in Rural Left-Behind Children’s Independent Travel: A Case Study in Changsha, China. Sustainability 2023, 15, 10355. https://doi.org/10.3390/su151310355
Tang Y, Zhu L, Li J, Zhang N, Sun Y, Wang X, Wu H. Assessment of Perceived Factors of Road Safety in Rural Left-Behind Children’s Independent Travel: A Case Study in Changsha, China. Sustainability. 2023; 15(13):10355. https://doi.org/10.3390/su151310355
Chicago/Turabian StyleTang, Yue, Li Zhu, Jiang Li, Ni Zhang, Yilin Sun, Xiaokang Wang, and Honglin Wu. 2023. "Assessment of Perceived Factors of Road Safety in Rural Left-Behind Children’s Independent Travel: A Case Study in Changsha, China" Sustainability 15, no. 13: 10355. https://doi.org/10.3390/su151310355