Abstract
Sea ice plays an important role in climate change research and maritime shipping safety, and SAR imaging technology provides important technical support for sea ice extraction. However, traditional methods have limitations such as low efficiency, model complexity, and excessive human interference. For that, a novel sea ice segmentation algorithm based on a spatially constrained Gamma mixture model (GaMM) is proposed in this paper. The advantage of the proposed algorithm is automatic, efficient, and accurate sea ice extraction. The algorithm first uses GaMM to build the probability distribution of sea ice in SAR images. Considering the similarity in the class attributions of local pixels, the smoothing coefficient is defined by the class attributes of neighboring pixels. Then, the prior distribution of the label is modeled by combining Gibbs distribution and the smoothing coefficient to improve the accuracy of sea ice extraction. The proposed algorithm utilizes the Expectation maximization method to estimate model parameters, and determines the optimal number of classes using Bayesian information criteria, aiming to achieve fast and automatic sea ice extraction. To test the effectiveness of the proposed algorithm, numerous experiments were conducted on simulated and real high-resolution SAR images. The results show that the proposed algorithm has high accuracy and efficiency. Moreover, the proposed algorithm can obtain the optimal number of classes and avoid over-segmentation or under-segmentation caused by manually setting the number of classes.
1. Introduction
Sea ice, as an important and widely covered natural land type, has a significant impact on global climate change, resource development, and maritime navigation. Therefore, it is a topic of wide concern. In global climate change research, sea ice is a major component of the global climate system [1,2]. The reflectivity and insulation of sea ice differ significantly from seawater, resulting in a certain insulation effect between the atmosphere and the ocean. This directly determines the process and rate of energy and material exchange between the ocean and the atmosphere and thus significantly affects climate change. In maritime navigation, the melting of sea ice may lead to a connection between oceans, which will bring incalculable economic benefits, highlight the military and strategic significance of the polar region [3,4], and accelerate the competition for resource development. In addition, the freezing of the sea surface will become a marine disaster, causing serious economic losses such as the collapse and shut down of production on the oil platform and the trapping of fishing boats [5,6,7]. Therefore, the accurate acquisition of sea ice information is not only a hot topic of concern for high-latitude countries but also a research focus for various countries around the world. In order to reduce the negative impact of sea ice, the accurate extraction of sea ice types is necessary for both scientific research and production.
Remote sensing technologies can obtain long-term, large-scale, and real-time images and have become the main means of sea ice monitoring. Among these technologies, microwaves emitted by synthetic aperture radar (SAR) technology can penetrate clouds and rain layers and are not limited by weather conditions. Hence, SAR can work in all weather and at all times, avoiding the disadvantages of optical remote sensing technology, which is easily affected by adverse weather conditions. Therefore, the use of SAR technology to obtain sea ice information has been widely studied with the aim of monitoring the occurrence and development of sea ice [8,9].
Sea ice segmentation is one of the key technologies for obtaining sea ice types and spatial distribution. Generally, segmentation methods are divided into supervised and unsupervised methods. The supervision method has the following characteristics: sensitivity to human interference, high segmentation accuracy, and limited sample selection. Common supervision methods include random forest (RF), support vector machine (SVM), and artificial neural network (ANN) [10,11,12]. Recently, the deep learning method has been widely applied in remote sensing segmentation. However, this method has significant difficulty acquiring the SAR datasets of various ground types and requires heavy labeling work. Moreover, unsupervised methods are less sensitive to human interference, not limited by sample selection, and have high implementation efficiency. Commonly used unsupervised methods include fuzzy clustering and statistical models [13,14,15,16]. Among them, statistical models are based on probability theory, which facilitates the use of spatial information. Hence, the statistical model is widely used in image segmentation for sea ice extraction.
The finite mixture model, based on image segmentation, is an effective statistical method for modeling the statistical characteristics of pixel intensity. Its advantage is that it is easy to use probability to model the intensity features and spatial information of images. Therefore, it can improve the robustness and accuracy of the algorithm. Due to the simple structure and easy implementation of Gaussian distributions, the Gaussian mixture model (GMM) is commonly used for statistical modeling in image segmentation [17]. For example, Bao et al. [18] proposed a water extraction algorithm in SAR images, and GMM was used for the statistical modeling of targets and backgrounds based on the initial extraction of homogeneous regions using the Otsu algorithm; Liu et al. [19] used Generalized GMM to achieve change detection based on the segmentation of different images; Barzycka et al. [20] tested and validated GMM-based methods for extracting glacier zones, and the result indicated that the GMM-EM (Expectation maximization) method was suitable for extracting glacier zones based on sigma0 and Pauli decomposition of SAR images. Moreover, GMM can also be applied to domain adaptation research in machine learning [21]. Kolouri et al. [22] used the sliced Wasserstein distance to estimate parameters of GMM, and the algorithm indicated that the energy landscape of the sliced Wasserstein distance was superior to the KL distance; Wang et al. [23] exploited a transfer-distributed GMM clustering algorithm combining the distributed GMM and the transfer learning technique, and the algorithm promoted the clustering performance and accelerated the clustering convergence. In addition to GMM, the Student’s-t mixture model (SMM) is also a widely used mixture model and can be used to model the statistical distribution of pixel intensity in SAR images [24]. However, the model parameters of Student’s-t distribution are more complicated than those of the Gaussian distribution due to the degree of freedom parameters existing in the form of a Gamma function, and the model parameters of the SMM are difficult to estimate.
The statistical characteristics of pixel intensity in SAR images are asymmetric and heavy-tailed. The components of GMM or SMM are not suitable for modeling the statistical characteristics of SAR intensity. Goodman [25] proposed that Gamma distribution can approximate the statistical characteristics of SAR images. Hence, Gamma distribution is widely used for SAR image segmentation [26]. Therefore, GaMM is commonly used to construct statistical models of SAR images. For example, Li et al. [27] used GaMM to model the pixel intensity in SAR images and introduced it as a non-similarity measure into Fuzzy C-means (FCM); Akyilmaz [28] combined the GaMM and multilogit spatial interactive models for SAR image segmentation, and its advantage was its robustness. To reduce the impact of speckle noise in SAR images, the weight of GaMM is viewed as a Markov random field (MRF) [29,30], and the spatial information of local pixels can be modeled in prior probability. However, the method may increase the complexity of the model while improving robustness. Furthermore, it reduces the efficiency of the algorithm. Therefore, it is important to reduce the impact of speckle noise without increasing model complexity.
Moreover, automatically determining the optimal number of classes has always been an important and difficult content in image segmentation research [31,32]. The number of classes in segmentation is generally determined by visual interpretation. Then, the accuracy of class numbers is influenced by significant human factors. An excessive number of classes can lead to over-segmentation (the same object being divided into multiple small regions), while a relatively small number of classes can lead to under-segmentation (multiple features being segmented together). Reversible jump Markov chain Monte Carlo (RJMCMC) is a commonly used method for determining the number of classes in finite mixture models [31,32]. Due to the large number of iterations required for the statistical simulation process of the method, its efficiency is relatively poor. This limits the application of this method in practical problems.
To achieve automatic, efficient, and accurate sea ice extraction, a new SAR image segmentation algorithm is proposed in this paper. The proposed algorithm combines GaMM and Gibbs distribution to utilize pixel intensity and spatial information for sea ice segmentation. It reduces the influence of speckle in SAR images. The proposed algorithm uses the EM method and Bayesian information criterion (BIC) to estimate model parameters and determine the optimal number of classes. It can avoid the over-segmentation or under-segmentation and reduce the complexity of estimating model parameters. The proposed algorithm is used for segmentation experiments on simulated and real SAR images. The results indicate that the proposed algorithm can obtain the highest accuracy, automatically determine the optimal number of classes, and achieve high efficiency.
2. Materials and Methods
2.1. The Flow Chart of Sea Ice Extraction
The proposed algorithm for sea ice extraction not only utilizes the intensity features of pixels but also takes into account the spatial information of pixels. The proposed algorithm uses GaMM to establish the probability distribution of pixel intensity and defines the smoothing factor to integrate the spatial information of local pixels into the prior probability distribution. Combining the EM method and BIC, the optimal model parameters are estimated on the basis of determining the optimal model parameters. Hence, the proposed algorithm can achieve fast and effective sea ice extraction from SAR images. Its flow chart is shown in Figure 1.
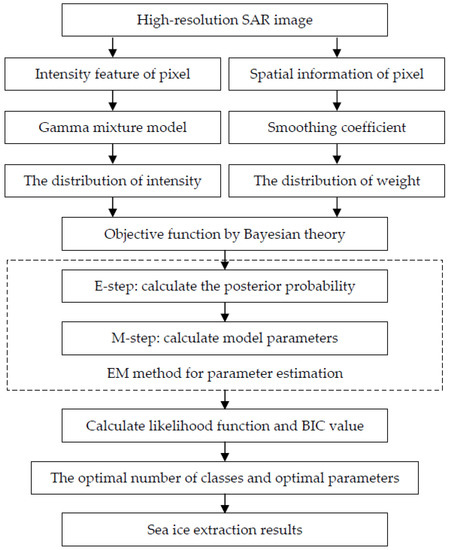
Figure 1.
The Flow Chart of Sea Ice Extraction.
2.2. Gamma Mixture Model
Given a high-resolution SAR image, z = {zn; n = 1, 2, …, N}, where n is the index of pixel, N is the number of pixels, and zn is the intensity of pixel n. Let the label of pixel n be ln. The pixel n is segmented into class k, which can be presented as ln = k. Then, the set of pixel label is the result of sea ice extraction.
Let intensities of pixels in class k follow Gamma distribution, the probability distribution of zn can be presented as:
where α is the shape parameter and is viewed as the number of looks in SAR images, βk is the scale parameter of class k, Γ(●) is the Gamma function.
The prior distribution of the pixel n segmented into class k is the marginal probability distribution of label, which can be presented as:
Then, the conditional probability distribution of zn can be modeled by GaMM. Let the set of model parameters be θ. Combining Equations (1) and (2), the conditional probability distribution can be presented as:
where wk is the component weight, Gamma distribution is the component of mixture model, K is the number of components, which is equal to the number of classes, the set of model parameter can be further presented as θ = {w, β}, w = {wk; k = 1, 2,…, K} is the set of weights, β = {βk; k = 1, 2,…, K} is the set of scale parameters.
2.3. The Proposed Algorithm
To incorporate the spatial information of pixels for reducing the impact of speckle noise, the spatially constrained GaMM is proposed in this section. The component weight in Equation (3) does not take into account the probability between pixels and classes. The proposed algorithm uses a new component weight wnk, which considers the class attributes between pixels and classes. Hence, it facilitates the use of spatial information to improve robustness. Let the current number of classes be K, the conditional probability distribution of zn is modeled by GaMM and can be expressed as:
where wnk is the component weight, presenting the prior probability that pixel n belongs to class k. Then, the joint probability distribution of z is expressed as:
Considering the strong similarity in the class attributes of local pixels, the distribution of wnk can be defined using class attributes of local pixels, aiming to incorporate the spatial information. The component weights can be viewed as MRF and be defined by Gibbs distribution. In order to reduce the complexity caused by the introduction of spatial information, the energy function is concisely defined by combining the smoothing coefficient and the logarithm of wnk. The smoothing coefficient is viewed as the result of the previous iteration and aims to facilitate parameter estimation of wnk. Then, the distribution of wnk is expressed as:
where A is the normalization term, T is the temperature coefficient, A and T are generally set to be 1, t is index of iteration, snk is the smoothing coefficient in (t − 1) iteration, and it is defined as the mean value of the class probability of local pixels, which is expressed as:
where η is the neighbor coefficient for controlling the smoothing strength, Cn is the set of local pixels of pixel n, # presents the number of elements in a set, m is the index of local pixels, umk is the posterior probability of neighboring pixel m, presenting the class attribution. Given the set of model parameters θ(t−1) = {w(t−1), β(t−1)}, unk can be expressed by Bayesian theory as:
According to Bayesian theorem, combining Equations (5) and (6), the posterior distribution of model parameters can be expressed as:
The proposed algorithm uses the EM method to estimate model parameters θ = {w, β}. The EM method is an iterative algorithm for maximum likelihood estimation and is generally used to estimate the model parameter of the mixture model. It includes E-step and M-step, which infer the hidden states, given the model parameters, and maximizes the conditional expectations.
E-step: the logarithm of Equation (9) is firstly calculated. Then, the probability of hidden states is equal to the posterior probability unk. According to the Jensen inequality, the conditional expectation can be inferred as:
M-step: the parameter βk can be estimated by maximizing Equation (10). Then, Equation (10) can be used to calculate the partial derivative of βk and make the reciprocal equal to 0. Then, the calculation of βk can be expressed as:
To satisfy the constraint of the component weight, wnk can be estimated by Lagrange multiplication. The objective function can be expressed as:
where ρn is Lagrange coefficient. Use Equation (12) to calculate the partial derivatives of wnk and ρn. Then, the calculation of wnk can be inferred as:
In iterations, E-step and M-step are executed alternately until the convergence criterion is satisfied. Then, the optimal model parameters are obtained. According to the maximum a posteriori probability criterion, the pixel label is obtained by maximizing the optimal posteriori probability and presented as:
To obtain optimal segmentation results and avoid over-segmentation or under-segmentation, the proposed algorithm utilizes BIC to select the optimal number of classes. BIC combines the fitting accuracy and the complexity of the model to define the calculation. The optimal number of classes is expressed as:
where PK is the number of parameters when the number of classes is K, PK = N × K + K, θ* is the optimal model parameters, Kmin and Kmax are the minimum and maximum number of classes. The first term is negative Log-likelihood function. The greater the number of classes, the better the model fitting, and the smaller negative Log-likelihood function value. However, the number of classes is so large that the image is over-segmented and the model is more complex. To avoid an excessive number of classes, the second term is defined as the penalty term. The number of model parameters is introduced into the equation. The larger the number of classes, the more the model parameter, and the greater the second term. The optimal number of classes is the number of classes corresponding to the minimum BIC value.
3. Results
To verify the effectiveness of the proposed algorithm, numerous experiments were implemented using K-means, FCM [13], Gamma [23], GMM [17], SMM [21], and the proposed algorithm on simulated and real high-resolution SAR sea ice images, under the experimental environment of Matlab R2016a software.
3.1. Experiment of Simulated Sea Ice SAR Image
Figure 2 shows a simulated SAR sea ice image and its segmentation results using the traditional and proposed algorithms. Figure 2a shows that there were four regions in which pixel intensity was randomly generated by various parameters of Gamma distribution, corresponding to different types of sea ice. Figure 2b shows the real segmentation for the quantitative evaluation of the results, where 1–4 are the labels of regions. Figure 2c–h show the segmentation results using K-means, FCM, Gamma, GMM, SMM, and the proposed algorithms. The K-means algorithm was greatly affected by speckle noise, and its result was poor; the FCM algorithm considered the spatial information, but there were many incorrectly segmented pixels in each region; the Gamma algorithm could not segment regions 3 and 4, and many pixels were incorrectly segmented; the GMM and SMM algorithm used the form of probability distribution to model the spatial information of local pixels, but many pixels were still wrongly segmented. The proposed algorithm could segment each region, and a few pixels were wrongly segmented on the boundary between regions 3 and 4. Visually, the proposed algorithm can achieve optimal segmentation results.
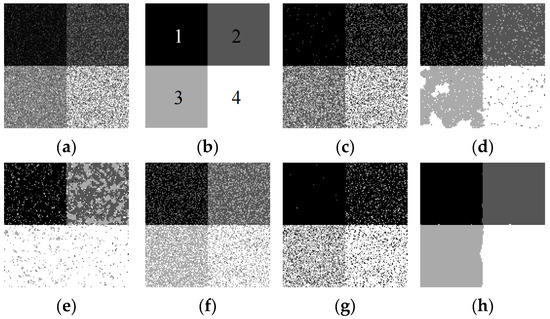
Figure 2.
Experiment of the simulated SAR sea ice image. (a) the simulated SAR image, (b) the standard image, (c) K-means algorithm, (d) FCM algorithm, (e) Gamma algorithm, (f) GMM algorithm, (g) SMM algorithm, (h) the proposed algorithm.
To quantitatively evaluate the segmentation performance of the proposed algorithm, Table 1 lists the segmentation accuracy of the results presented in Figure 2. Users’ accuracy (UA), overall accuracy (OA), and kappa coefficient (KC) were calculated with the confusion matrix. The minimum UAs of K-means, FCM, Gamma, GMM, SMM, and the proposed algorithms were 34.35%, 80.78%, 7.39%, 68.62%, 13.31%, and 99.21%, respectively. Although the FCM algorithm was better than other traditional algorithms, the proposed algorithm obtained the highest UA. Due to the wrong segmentation, the UAs of region 3 using the Gamma algorithm and region 2 using the SMM algorithm were poor. OA and KC, using the FCM algorithm, were 87.56% and 0.84, and other traditional algorithms were lower than 80% and 0.8, respectively. Meanwhile, the OA and KC of the proposed algorithm were 99.99% and 0.99, and were higher than others. Therefore, the proposed algorithm could obtain the highest segmentation accuracy.

Table 1.
Segmentation accuracy of the simulated SAR sea ice image.
To verify the performance of the proposed algorithm in determining the optimal number of classes, Figure 3 shows the BIC value with the different number of classes [2,7]. The horizontal and vertical axes were the number of classes and BIC value, respectively. The optimal number of classes corresponded to the minimum BIC value. Figure 3 shows that the optimal number of classes for the simulated image was 4, which was consistent with the real number of classes. Hence, the proposed algorithm could determine the optimal number of classes.
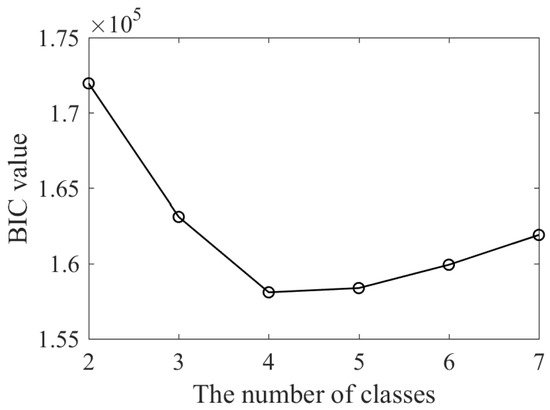
Figure 3.
BIC value with the different number of classes.
3.2. Experiment of Real High-Resolution SAR Sea Ice Image
To verify the performance of the proposed algorithm in segmenting real sea ice images, five sea ice images were taken from the Radarsat-I satellite with 30 m spatial resolution using VV polarization. The images containing sea ice were selected with strong pixel heterogeneity to verify the robustness of the proposed algorithm to heterogeneity and speckle noise. Moreover, the structure and area of sea ice regions in each image are different. In the above SAR images, the bright to dark regions represent the strong ice, ice with varying degrees of melting, and seawater. K-means, FCM, Gamma, GMM, SMM, and the proposed algorithms were carried out on SAR images in this section.
In the first segmentation experiment, Figure 4a was segmented by the traditional and the proposed algorithms, and their results were shown in Figure 4c–h. Figure 4b is the standard image, where 1–3 are the labels of regions. The traditional algorithms could segment seawater (region 1), but many pixels were wrongly segmented in other regions. For example, K-means algorithm incorrectly segmented dark and bright pixels into region 2; many pixels of regions 2 and 3 were wrongly segmented in Figure 4d; in Figure 4e,f many pixel blocks were incorrectly segmented due to the use of spatial information in the Gamma algorithm and GMM algorithm; the SMM algorithm wrongly segmented many pixels in regions 2 and 3. In Figure 4h, the proposed algorithm could better segment each region, and fewer pixels were wrongly segmented in regions 2 and 3.
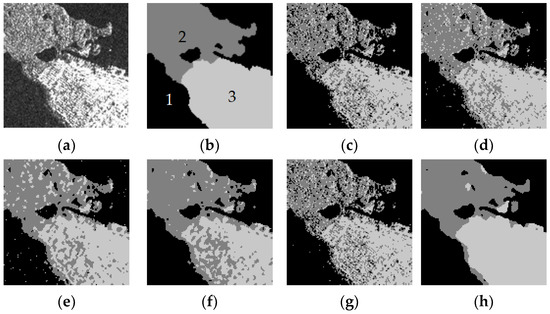
Figure 4.
First experiment of real high-resolution SAR image. (a) real SAR image 1, (b) the standard image, (c) K-means algorithm, (d) FCM algorithm, (e) Gamma algorithm, (f) GMM algorithm, (g) SMM algorithm, (h) the proposed algorithm.
In order to verify the role of spatial correlation in the proposed algorithm, experiments with different parameter settings were conducted on real SAR image 1, as shown in Figure 5. Figure 5a shows the segmentation result using the proposed algorithm without considering the spatial correlation of local pixels. A large number of pixels were incorrectly segmented in each region of Figure 5a, especially in region 2. Figure 5b–j show the the results considering the spatial correlation of local pixels with different neighbor coefficients η. The larger the neighbor coefficient value, the better the segmentation result. In Figure 5b–f, it can be seen that there were some wrongly segmented pixels in regions 2 and 3, when η was set to 0.2, 0.4, 0.6, 0.8, and 1.0. In Figure 5g–j, the number of incorrectly segmented pixels was significantly reduced. When the coefficient value was too large, the number of incorrectly segmented pixels increased, such as bright pixels in region 2 of Figure 5i,j. Figure 5g,h show better segmentation results compared to other results.
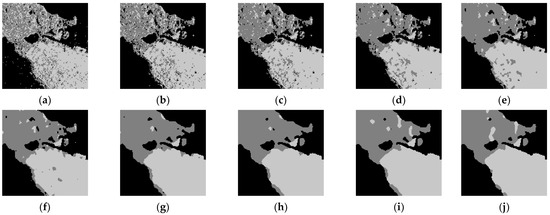
Figure 5.
Experiment of real high-resolution SAR image 1. (a) no spatial correlation, (b–j) η = 0.2, 0.4, 0.6, 0.8, 1.0, 1.2, 1.4, 1.6, 1.8.
Figure 6 shows the segmentation results of Figure 4a, with various numbers of classes, using the proposed algorithm. When K was 2, regions 2 and 3 were not segmented and the result was under-segmentation; when K was 3, the seawater and different melting sea ices were better segmented; when K was greater than 3, a large number of pixels were incorrectly segmented, especially in region 2. Hence, when the number of classes is too large, segmentation results were prone to over-segmentation. It is suggested that the proposed algorithm could achieve the optimal number of classes and optimal segmentation, avoiding over-segmentation or under-segmentation.
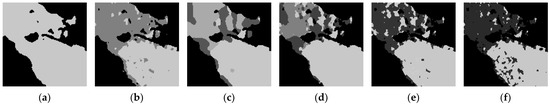
Figure 6.
Experiment of real high-resolution SAR image 1. (a–f) K = 2, 3, 4, 5, 6, 7.
Figure 7 shows the BIC value with various numbers of classes. When K was 2, the result was over-segmentation and the BIC value was larger. This was because the likelihood function could not accurately fit the histogram and the negative likelihood term in Equation (15) was relatively large. When K was 3, each region could be segmented and the result was optimal. The likelihood function could more accurately fit the histogram, and the negative likelihood term was relatively small. Moreover, the model was not complex and the penalty term in Equation (15) was also not large. Hence, the BIC value was minimum when K was 3. When K was greater than 3, over-segmentation became more obvious and the BIC value increased with the increasing number of classes. That was because the complexity of the model increased with the increase in the number of classes. The penalty term increased significantly, while the likelihood function changed little. Therefore, the number of classes corresponding to the minimum BIC value could obtain the optimal segmentation.
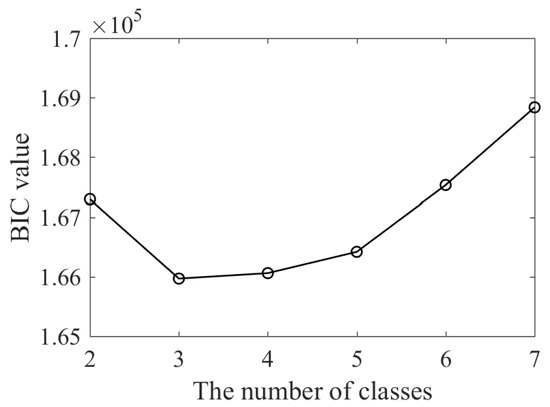
Figure 7.
BIC value of SAR image 1 with various number of classes.
Figure 8 shows four SAR sea ice images for testing the performance of the proposed algorithm. Figure 8a–d are high-resolution SAR images of seawater and sea ice with varying degrees of melting. Figure 8e–h are the standard images of the above SAR images for quantitatively evaluating the proposed algorithms, in which 1–3 are the labels of regions and homogeneous regions were drawn through visual interpretation.
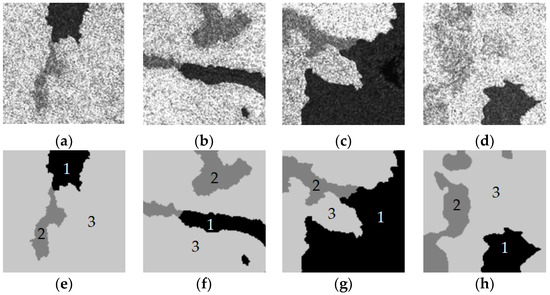
Figure 8.
High-resolution SAR images. (a–d) real SAR sea ice images 2–5, (e–h) standard segmented images.
K-means, FCM, Gamma, GMM, SMM, and the proposed algorithms were used to segment the above SAR images in Figure 8, and the segmentation results are shown in Figure 9. The K-means algorithm failed to segment various regions and a large number of pixels were wrongly segmented due to not considering spatial information of pixels. Although the FCM and Gamma algorithms had taken the spatial information of local pixels into account, many pixel blocks were incorrectly segmented in their results, and seawater and sea ice could not even be segmented, as shown in Figure 9h,i. GMM and SMM algorithms could not segment seawater and sea ice, as shown in Figure 9j,k, and the results of the GMM algorithm were not better than the SMM algorithm. Due to the strong similarity in the pixel intensities in regions 2 and 3 of Figure 8d, it was difficult for the compared algorithms to segment the two types of sea ice. Moreover, the boundary of region 2 was fuzzy in Figure 9s,u,v,w. The proposed algorithm not only segmented seawater and sea ice but also only segmented a few pixels incorrectly. The proposed algorithm could also obtain the optimal result for two types of sea ice with strong similarity in pixel intensities, as shown in Figure 9x. Therefore, the proposed algorithm could better segment sea ice in high-resolution SAR images.
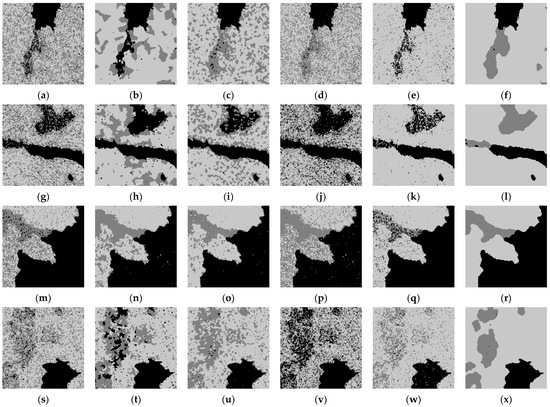
Figure 9.
Experiment of three high-resolution SAR images. (a,g,m,s) K-means algorithm, (b,h,n,t) FCM algorithm, (c,i,o,u) Gamma algorithm, (d,j,p,v) GMM algorithm, (e,k,q,w) SMM algorithm, (f,l,r,x) the proposed algorithm.
Figure 10 shows the BIC values of the segmentation results of four SAR images with a different number of classes. BIC values first decreased and then increased with the number of classes increasing. The numbers of classes corresponding to the minimum BIC value were 3, 3, 3, and 3, respectively. They were consistent with the numbers of classes obtained through visual interpretation. Hence, the proposed algorithm could obtain the optimal number of classes for real SAR image segmentation.
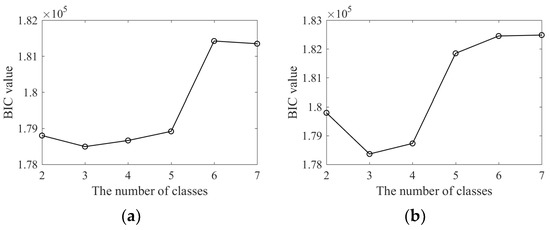
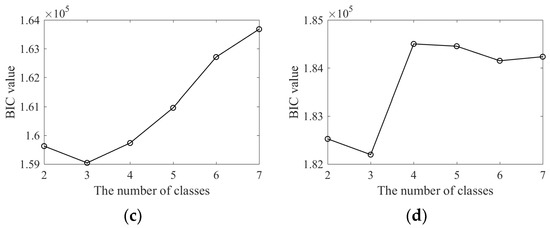
Figure 10.
BIC values of SAR images with different number of classes. (a–d) SAR images 2–5.
To verify the performance of the proposed algorithm from a statistical perspective, the algorithm was conducted 10 times on real SAR images, and the statistical results are shown in Table 2. The means of OAs for real SAR images were greater than 91%, and the standard deviations were in a range from 0.02 to 0.91. For the segmentation time of real SAR images, the means were lower than 8.70 s, and the standard deviations were in a range from 0.24 to 0.40. Therefore, the proposed algorithm could produce high-precision and efficient results for sea ice segmentation.
Table 2.
Statistical results (Means ± Standard deviations) of the proposed algorithm on real SAR images.
In order to quantitatively evaluate the segmentation results of high-resolution SAR images, the segmentation accuracy shown in Figure 11 was calculated based on the confusion matrix. The proposed algorithm could obtain the highest accuracies for four SAR images, and the means of accuracies were greater than 91%, as shown in Table 2. However, the accuracies of traditional algorithms were less than the proposed algorithm. For example, the accuracies of K-means, FCM, Gamma, and GMM algorithms were lower than 66% for SAR image 3; the accuracy of the SMM algorithm was 88.15% for SAR image 3, but it was still lower than the proposed algorithm by 10.56%; for SAR image 4, the accuracies of the traditional algorithms were greater than 82%, and the highest was 95.23%, obtained by the Gamma algorithm, which was still 3.63% lower than the proposed algorithm; for SAR image 5, the GMM algorithm obtained the lowest accuracy due to the wrongly segmented pixels in region 2, and the other compared algorithms were lower than 82%. Hence, the proposed algorithm could accurately segment seawater and sea ice in high-resolution SAR images.
Figure 11.
Segmentation accuracy of high-resolution SAR ice images.
To test the efficiency of the proposed algorithm, the time of segmenting high-resolution SAR images is shown in Figure 12. The time of the proposed algorithm was the average time as shown in Table 2. Compared to the segmentation time, the Gamma algorithm tool the most time, and its time was in a range from 737.81 to 780.89 s. As the K-means algorithm was an internal function of Matlab R2016a software, it took less time and its time was in a range from 5.63 to 10.40 s. The proposed algorithm took relatively little time, and its time was in a range from 6.72 to 8.64 s. The time of the FCM, GMM, and SMM algorithms were in the range of (32.49, 36.90), (33.78, 46.85), and (244.19, 276.51) seconds, respectively. Hence, the proposed algorithm had higher segmentation efficiency.
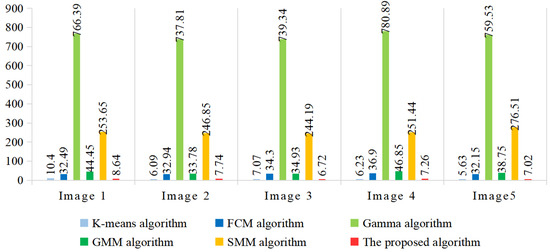
Figure 12.
Segmentation time of high-resolution SAR ice images.
4. Discussion
In the experiment on the simulated SAR sea ice images, the five traditional algorithms were not able to segment each region, and many pixels were wrongly segmented in their results. Among them, the K-means algorithm only used pixel intensity features as the basis for segmentation, without considering the spatial information of pixels. Therefore, a large number of pixels in its results were wrongly segmented using the K-means algorithm. The FCM algorithm takes the spatial information of local pixels into account, and its result is better than the K-means algorithm. However, there are still many incorrectly segmented pixels in its result. The Gamma algorithm builds the probability distribution of pixel intensity using a single Gamma distribution. Although local spatial information is considered, pixel blocks are wrongly segmented and two regions could not be segmented. GMM and SMM algorithms use the weight sum of several distributions to establish the probability distribution of pixel intensity. Their statistical characteristics are not suitable for the statistical modeling of SAR images, and their results are relatively poor. The proposed algorithm uses the weight sum of Gamma distributions to build the probability distribution of pixel intensity. Moreover, the smoothing coefficient incorporates the spatial information of local pixels. Hence, its result outperforms traditional algorithms. The accuracy quantitatively indicates that the proposed algorithm can obtain the highest segmentation accuracy and is better than traditional algorithms. The BIC result indicates that the proposed algorithm can automatically determine the optimal number of classes, avoiding over-segmentation or under-segmentation caused by incorrectly setting the number of classes.
In the experiment of high-resolution SAR images, the proposed algorithm could segment seawater and various melting sea ice, and its accuracy was higher than other algorithms. The K-means algorithm was sensitive to noise and had poor segmentation results. Although the FCM algorithm incorporates the spatial information of pixels, it is still sensitive to the speckle noise of SAR images. The Gamma algorithm is suitable for the statistical modeling of SAR images, but its robustness is poor, resulting in incorrect segmentation. GMM and SMM algorithms are not suitable for the statistical modeling of SAR images, so many pixels are wrongly segmented in their results. Moreover, the above traditional algorithm cannot segment seawater and sea ice for SAR image 3. The proposed algorithm uses GaMM to build the statistical model of SAR images, and uses class attributes of local pixels to build a prior probability distribution. It can effectively reduce the impact of speckle noise and obtain the optimal SAR sea ice segmentation. The accuracy indicates that the proposed algorithm has higher accuracy than other algorithms. Hence, the proposed algorithm can accurately segment SAR sea ice images.
In the ablative experiment of SAR image 1, the proposed algorithm is used to segment SAR image 1 with different neighbor coefficients. When the proposed algorithm is not considering the spatial correlation of local pixels, a large number of pixels are incorrectly segmented in each region. When the proposed algorithm considers the spatial correlation of local pixels, the larger the neighbor coefficient value, the better the segmentation result. If the coefficient is too small, it results in a large number of wrongly segmented pixels. If the coefficient is too large, it results in over-segmented pixel blocks, although the number of mis-segmented pixel points is reduced. The results indicate that the proposed algorithm with spatial correlation can obtain better segmentation results for high-resolution SAR images. Moreover, when the coefficient is in a range from 1.2 to 1.4, the optimal segmentation result can be obtained.
In addition, experimental results with a different number of classes indicate that the optimal number of classes can achieve the optimal results. Less or a greater number of classes can lead to under-segmentation or over-segmentation. Under-segmentation presents that different melted sea ice cannot be segmented; over-segmentation presents that the same class is divided into several classes. Setting the optimal number of classes is one of the important prerequisites for obtaining the optimal results. In the proposed algorithm, the number of classes can be determined by combining fitting accuracy and model complexity. With the increase in the number of classes, the negative likelihood function decreases and tends to be stable, while the penalty term increases. Therefore, the optimal number of classes can be determined at the lowest BIC value.
In the result of segmentation time, the proposed algorithm has relatively high efficiency. The proposed algorithm combines the EM method and BIC to estimate model parameters based on the optimal number of classes. It not only achieves accurate results but also has high efficiency. Comparing the segmentation time of various algorithms, it is suggested that the K-means algorithm has high segmentation efficiency and the Gamma algorithm has poor efficiency. The specific reasons are as follows: K-means and FCM algorithms can derive analytical expressions of parameters, and their implementation time is relatively short. Due to the lack of spatial information in the K-means algorithm, its implementation time is shorter than the FCM algorithm. The Gamma algorithm solves model parameters through statistical simulation, which requires many iterations and consumes a lot of time. The GMM algorithm incorporates the spatial information of pixels and uses the EM method to derive analytical expressions of parameters. So, its time is similar to that of FCM algorithm. The SMM algorithm utilizes the gradient descent method to optimize model parameters. The algorithm requires a lot of iterations and consumes more time than the GMM algorithm. The proposed algorithm solves with fewer parameters and requires less computation. It takes less time than traditional algorithms, except for the K-means algorithm, which has certain errors due to different programming abilities. Therefore, the proposed algorithm can achieve efficient sea ice extraction.
5. Conclusions
In order to achieve automatic, efficient, and accurate sea ice extraction, this paper proposes a new algorithm based on spatially constrained GaMM for sea ice segmentation. The proposed algorithm incorporates the intensity and spatial information of SAR images for image segmentation. Moreover, the proposed algorithm utilizes fitting accuracy and model complexity to determine the optimal number of classes. Numerous experiments were carried out on simulated and real SAR sea ice images. The results indicate that the proposed algorithm can accurately segment different melting sea ice and seawater and obtain higher accuracy than the traditional algorithms; the proposed algorithm incorporates spatial information by defining the smoothing coefficient, effectively reducing the impact of speckle noise on SAR images for sea ice extraction. The proposed algorithm can adaptively determine the optimal number of categories, avoiding over-segmentation or under-segmentation. This also avoids human interference for the segmentation. In addition, the proposed algorithm is easy to implement and has high implementation efficiency. Therefore, the proposed algorithm is suitable for sea ice segmentation.
Author Contributions
Conceptualization, X.S.; methodology, X.S.; software, X.S., Y.W. and H.Y.; validation, X.S., Y.W. and J.C.; formal analysis, X.S., Y.W., H.Y. and J.C; writing—review and editing, X.S.; funding acquisition, X.S. and Y.W. All authors have read and agreed to the published version of the manuscript.
Funding
This research was funded by Guangxi Natural Science Foundation of China, grant number 2022GXNSFBA035567 and 2020GXNSFBA297096.
Institutional Review Board Statement
Not applicable.
Informed Consent Statement
Not applicable.
Data Availability Statement
Not applicable.
Conflicts of Interest
The authors declare no conflict of interest.
References
- Yan, Y.; Huang, K.Y.; Shao, D.D.; Xu, Y.J.; Gu, W. Monitoring the characteristics of the Bohai sea ice using high-resolution geostationary ocean color imager (GOCI) data. Sustainability 2019, 11, 777. [Google Scholar] [CrossRef]
- Singh, S.; Kumar, S.; Kumar, N. Evolution of iceberg A68 since its inception from the collapse of Antarctica’s Larsen C Ice shelf using Sentinel-1 SAR data. Sustainability 2023, 15, 3757. [Google Scholar] [CrossRef]
- Sun, Z.; Zhang, R.; Zhu, T. Simulating the impact of the sustained melting Arctic on the global container sea–rail intermodal shipping. Sustainability 2022, 14, 12214. [Google Scholar] [CrossRef]
- Wang, C.; Ding, M.; Yang, Y.; Wei, T.; Dou, T. Risk assessment of ship navigation in the Northwest Passage: Historical and projection. Sustainability 2022, 14, 5591. [Google Scholar] [CrossRef]
- Zhao, L.; Dong, H.Q.; Wang, J.X.; Fu, X.Y. The influence of ocean currents and sea wind on the motion law of sea ice and the management of sea ice disaster on the platforms in Liaodong bay. In Proceedings of the International Conference on Management Science & Engineering 19th Annual Conference, Dallas, TX, USA, 20–22 September 2012. [Google Scholar]
- Qiu, H.; Gong, Z.; Mou, K.; Hu, J.; Ke, Y.; Zhou, D. Automatic and accurate extraction of sea ice in the turbid waters of the Yellow River Estuary based on image spectral and spatial Information. Remote Sens. 2022, 14, 927. [Google Scholar] [CrossRef]
- Jiang, M.; Clausi, D.A.; Xu, L. Sea-ice mapping of RADARSAT-2 imagery by integrating spatial contexture with textural features. IEEE J. Sel. Top. Appl. Earth Observ. Remote Sens. 2022, 15, 7964–7977. [Google Scholar] [CrossRef]
- Yan, Y.; Uotila, P.; Huang, K.Y.; Gu, W. Variability of sea ice area in the Bohai Sea from 1958 to 2015. Sci. Total Environ. 2020, 709, 136164. [Google Scholar] [CrossRef] [PubMed]
- Kim, M.; Kim, H.C.; Im, J.; Lee, S.Y.; Han, H. Object-based landfast sea ice detection over West Antarctica using time series ALOS PALSAR data. Remote Sens. Environ. 2020, 242, 111782. [Google Scholar] [CrossRef]
- Al-Naeem, M.; Hafizur Rahman, M.M.; Banerjee, A.; Sufian, A. Support vector machine-based energy efficient management of UAV locations for aerial monitoring of crops over large agriculture lands. Sustainability 2023, 15, 6421. [Google Scholar] [CrossRef]
- Lun, N.S.; Chaudhary, S.; Ninsawat, S. Assessment of machine learning methods for urban types classification using integrated SAR and optical images in Nonthaburi, Thailand. Sustainability 2023, 15, 1051. [Google Scholar] [CrossRef]
- Gonçalves, B.C.; Lynch, H.J. Fine-scale sea ice segmentation for high-resolution satellite imagery with weakly-supervised CNNs. Remote Sens. 2021, 13, 3562. [Google Scholar] [CrossRef]
- Chatzis, S.P. A fuzzy clustering approach toward hidden Markov random field models for enhanced spatially constrained image segmentation. IEEE Trans. Fuzzy Syst. 2008, 16, 1351–1361. [Google Scholar] [CrossRef]
- Shang, R.H.; Chen, C.; Wang, G.G.; Jiao, L.C.; Okoth, M.A.; Stolkin, R. A thumbnail-based hierarchical fuzzy clustering algorithm for SAR image segmentation. Signal Process. 2020, 171, 107518. [Google Scholar] [CrossRef]
- Deng, H.W.; Clausi, D.A. Unsupervised segmentation of synthetic aperture Radar sea ice imagery using a novel Markov random field model. IEEE Trans. Geosci. Remote Sens. 2005, 43, 528–538. [Google Scholar] [CrossRef]
- Nogueira, F.E.A.; Marques, R.C.P.; Medeiros, F.N.S. SAR image segmentation based on unsupervised classification of log-cumulants estimates. IEEE Geosci. Remote Sens. Lett. 2020, 17, 1287–1289. [Google Scholar] [CrossRef]
- Nguyen, T.M.; Wu, Q.M.J. Fast and robust spatially constrained Gaussian mixture model for image segmentation. IEEE Trans. Circuits Syst. Video Technol. 2013, 23, 621–635. [Google Scholar] [CrossRef]
- Bao, L.; Lv, X.; Yao, J. Water extraction in SAR images using features analysis and dual-threshold Graph Cut model. Remote Sens. 2021, 13, 3465. [Google Scholar] [CrossRef]
- Liu, W.S.; Yang, J.; Zhao, J.Q.; Shi, H.T.; Yang, L. An unsupervised change detection method using time-series of PolSAR images from Radarsat-2 and GaoFen-3. Sensor 2018, 18, 559. [Google Scholar] [CrossRef]
- Barzycka, B.; Grabiec, M.; Jania, J.; Błaszczyk, M.; Pálsson, F.; Laska, M.; Ignatiuk, D.; Aðalgeirsdóttir, G. Comparison of three methods for distinguishing glacier zones using satellite SAR data. Remote Sens. 2023, 15, 690. [Google Scholar] [CrossRef]
- Hoffman, J.; Kulis, B.; Darrell, T.; Saenko, K. Discovering latent domains for multisource domain adaptation. In Proceedings of the European Conference on Computer Vision, Florence, Italy, 7–13 October 2012. [Google Scholar]
- Kolouri, S.; Rohde, G.K.; Hoffmann, H. Sliced Wasserstein distance for learning Gaussian mixture models. In Proceedings of the IEEE/CVF Conference on Computer Vision and Pattern Recognition, Salt Lake City, UT, USA, 18–23 June 2018. [Google Scholar]
- Wang, R.; Han, S.; Zhou, J.; Chen, Y.; Wang, L.; Du, K.; Ji, K.; Zhao, Y.; Zhang, K. Transfer-learning-based Gaussian mixture model for distributed clustering. IEEE Trans. Cybern. 2022, in press. [Google Scholar] [CrossRef]
- Nguyen, T.M.; Wu, Q.M.J. Robust Student’s-t mixture model with spatial constraints and its application in medical image segmentation. IEEE Trans. Med. Imag. 2012, 31, 103–116. [Google Scholar] [CrossRef]
- Goodman, N.R. Statistical analysis based on a certain multivariate complex Gaussian distribution (An introduction). Ann. Math. Stat. 1963, 34, 152–177. [Google Scholar] [CrossRef]
- Wang, Y.; Li, Y.; Zhao, Q.H. Segmentation of high-resolution SAR image with unknown number of classes based on regular tessellation and RJMCMC algorithm. Int. J. Remote Sens. 2015, 36, 1290–1306. [Google Scholar] [CrossRef]
- Li, X.L.; Zhao, Q.H.; Li, Y. Multilook SAR intensity image segmentation based on Voronoi tessellation and a Gamma mixture model. Remote Sens. Lett. 2019, 10, 254–263. [Google Scholar] [CrossRef]
- Akyilmaz, E. Multilogit prior-based Gamma mixture model for segmentation of SAR images. IEEE Geosci. Remote Sens. Lett. 2019, 16, 741–745. [Google Scholar] [CrossRef]
- Shang, R.H.; Liu, M.M.; Lin, J.K.; Feng, J.; Li, Y.Y.; Stolkin, R.; Jiao, L.C. SAR image segmentation based on constrained smoothing and hierarchical label correction. IEEE Trans. Geosci. Remote Sens. 2022, 60, 1–16. [Google Scholar] [CrossRef]
- Zhao, Q.H.; Li, X.L.; Li, Y. Multilook SAR image segmentation with an unknown number of clusters using a Gamma mixture model and hierarchical clustering. Sensors 2017, 17, 1114. [Google Scholar] [CrossRef] [PubMed]
- Gallet, Y.; Fournier, A.; Livermore, P.W. Tracing the geomagnetic field intensity variations in Upper Mesopotamia during the Pottery Neolithic to improve ceramic-based chronologies. J. Archaeol. Sci. 2021, 132, 105430. [Google Scholar] [CrossRef]
- Chavis, J.T.; Cochran, A.L.; Earls, C.J. CU-MSDSp: A flexible parallelized Reversible jump Markov chain Monte Carlo method. SoftwareX 2021, 14, 100664. [Google Scholar] [CrossRef]


Disclaimer/Publisher’s Note: The statements, opinions and data contained in all publications are solely those of the individual author(s) and contributor(s) and not of MDPI and/or the editor(s). MDPI and/or the editor(s) disclaim responsibility for any injury to people or property resulting from any ideas, methods, instructions or products referred to in the content. |
© 2023 by the authors. Licensee MDPI, Basel, Switzerland. This article is an open access article distributed under the terms and conditions of the Creative Commons Attribution (CC BY) license (https://creativecommons.org/licenses/by/4.0/).