Article

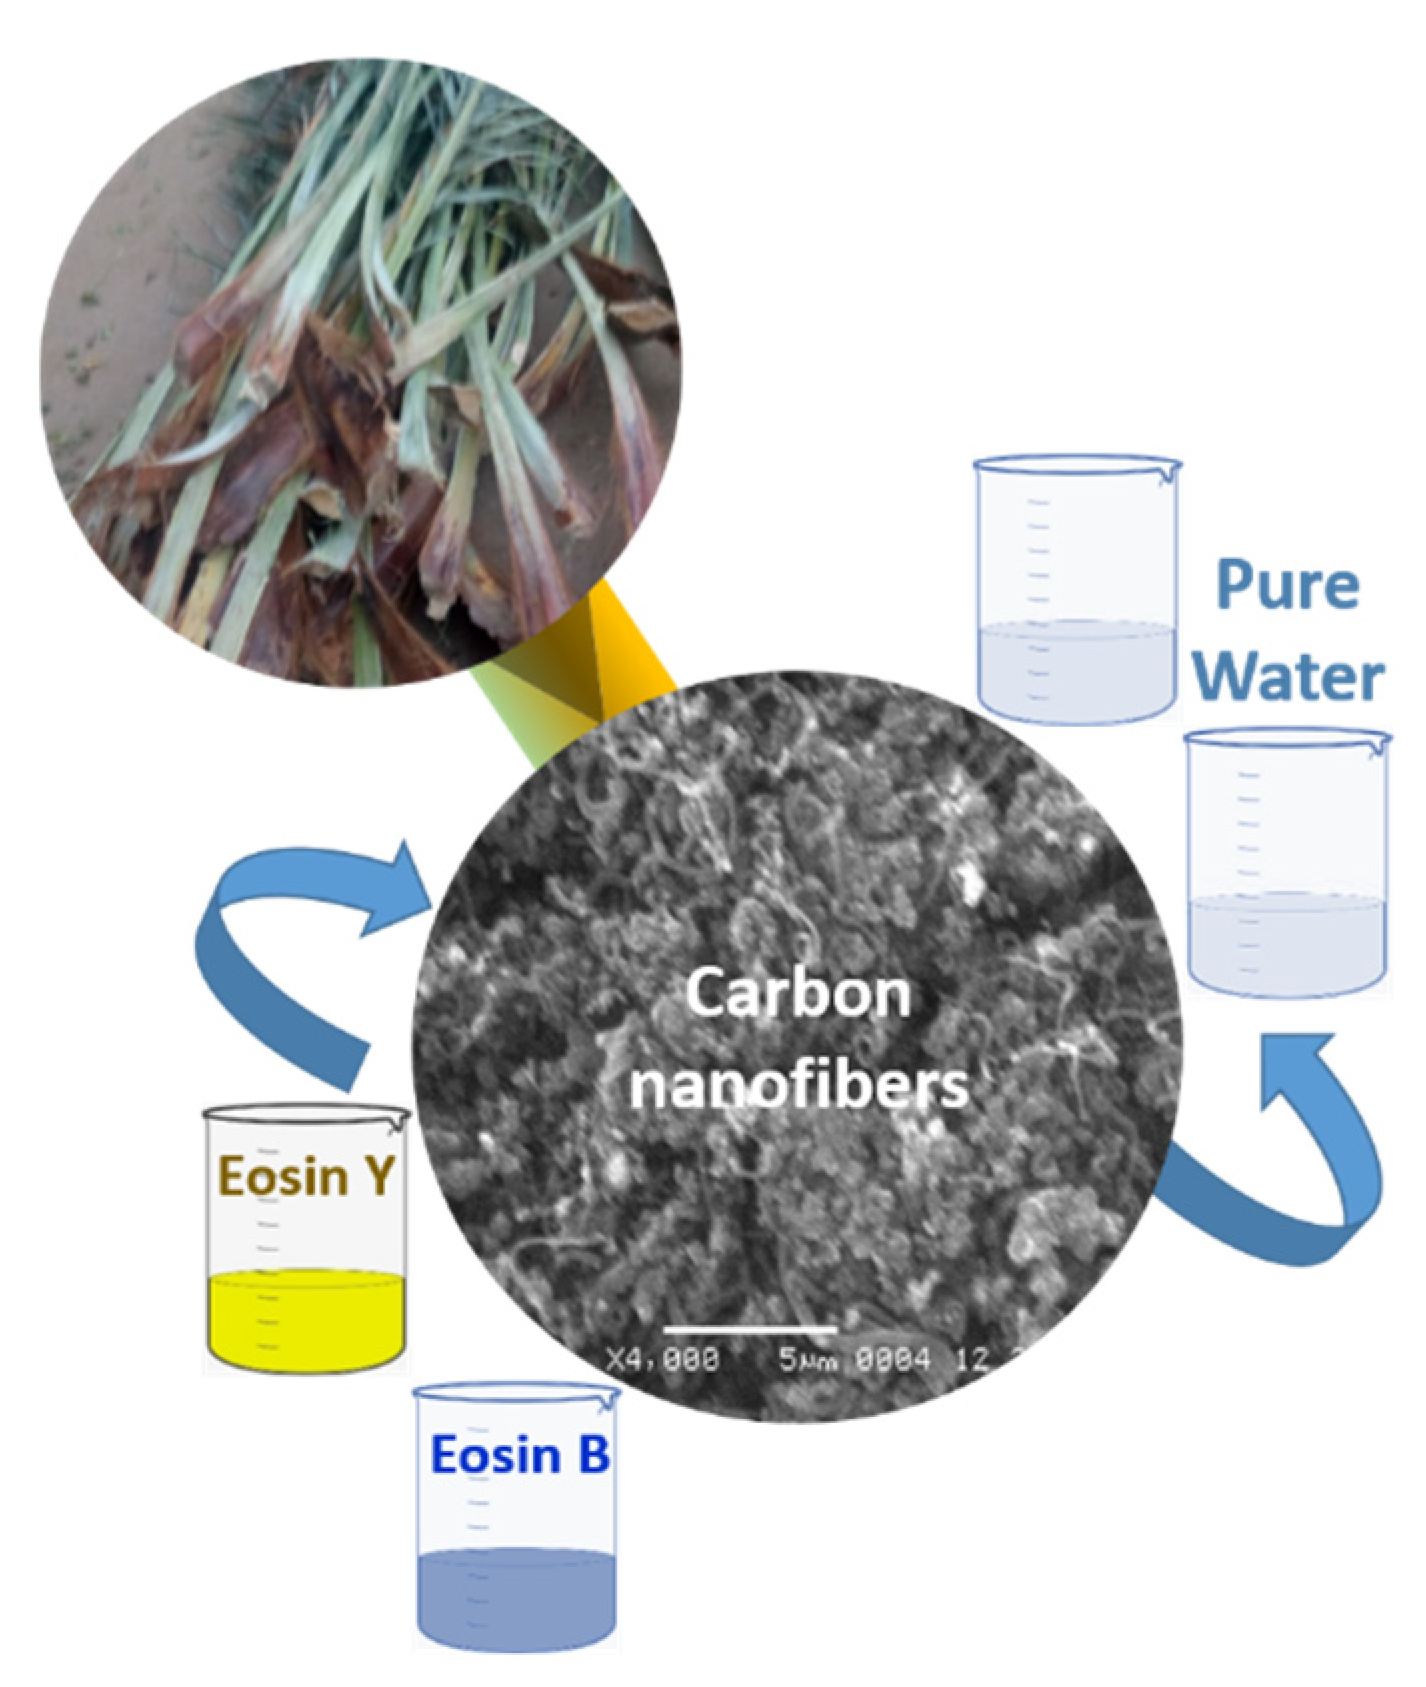
Sustainable and Green Synthesis of Carbon Nanofibers from Date Palm Residues and Their Adsorption Efficiency for Eosin Dye

by
Fahad M. Alminderej
1,*,
Abuzar E. A. E. Albadri
1,
Yassine El-Ghoul
1,2,
Wael A. El-Sayed
1,3,
Alaa M. Younis
1,4 and
Sayed M. Saleh
1,5,*
1
Department of Chemistry, College of Science, Qassim University, Buraidah 51452, Saudi Arabia
2
Textile Engineering Laboratory, University of Monastir, Monastir 5019, Tunisia
3
Photochemistry Department, National Research Centre, Giza 12622, Egypt
4
Aquatic Environment Department, Faculty of Fish Resources, Suez University, Suez 43518, Egypt
5
Chemistry Branch, Department of Science and Mathematics, Faculty of Petroleum and Mining Engineering, Suez University, Suez 43721, Egypt
*
Authors to whom correspondence should be addressed.
Sustainability 2023, 15(13), 10451; https://doi.org/10.3390/su151310451
Submission received: 6 May 2023 / Revised: 30 May 2023 / Accepted: 31 May 2023 / Published: 3 July 2023

Abstract

:
This work investigates the prospective usage of dried date palm residues for eosin Y and eosin B (ES-Y and ES-B) dye removal from an aqueous solution. A green synthesis route is utilized to prepare carbon nanofibers (CNFs) from date palm residues. We study the characteristics of carbon nanomaterials based on their composition and morphology. The characterization includes different types of instruments such as a Fourier-Transform Infrared Spectroscopy (FTIR), Brunauer Emmett Teller (BET), and Scanning Electron Microscopy (SEM). Batch mode experimentations are conducted and studied utilizing various significant factors such as the dose of the adsorbent, solution pH, contact time, and the initial quantity of eosin molecules as a pollutant. The dye adsorption capability improves with an increasing adsorbent dose of up to 40 mg of CNFs. The adsorption of dyes onto CNFs achieves equilibrium in around 60 h, whereas the optimal starting dye concentration in this study is 50 ppm. Further, to study the under-investigated toxic molecules’ adsorption process mechanism on the nanomaterials’ active sites, we introduce kinetic models involving pseudo-first-order, pseudo-second-order, and models based on intra-particle diffusion. Langmuir and Freundlich’s isotherms are considered to study the equilibrium isotherms, and the Langmuir isotherm model deals considerably with the attained experimentation results.

1. Introduction

The Qassim area of Saudi Arabia contributes almost 25 percent of the kingdom’s overall output of dates. With more than 7 million palm trees [1], Khalas, Sukkari, Anbara, Ajwa, Ruthana, Barhi, Segae, and Ruzeiz are the most noteworthy [2]. This region has seen a substantial rise in data losses. As a result, it is a national priority to develop the procedures for the exploitation of dates and palm trash for their further valorization into innovative and sustainable goods. Lost dates with flaws, excessive hardness, poor texture, or microbial and fungal contamination are unfit for human eating [3,4]. These discarded dates are abundant in biodegradable sugars [5], which could be used to make ethanol biofuels [6]. They are mainly used to manufacture fragrances, cosmetics [7], cleansers [8], pharmaceuticals [7], paints [8], and vinegar [9]. Sugars, starches, and lignocelluloses are the three main types of feedstocks for ethanol synthesis [10]. Researchers look at date fruits as raw materials for making ethanol [11,12]. On the other hand, according to the literature, ethanol is a potential reagent for the synthesis of carbon nanotubes (CNTs) [13,14], which are produced by the pyrolysis of alcohol vapor since alcohol is a cheap, harmless, abundant reagent and can also be applied as a fuel in fuel cell [15].
Water resource contamination by various contaminants is now one of the most significant worldwide environmental challenges [16,17]. The leftover dyes from many resources, such as fabrics, polymeric materials, paper, foodstuff, leather, and pharmaceuticals, are believed to be an unhealthy danger and pollution to water supplies. The textile sector is the second-largest polluter of the world’s water supplies, next to agriculture [18]. Removing dyes from textile effluent presently is a significant problem [19]. Over the years [20,21], various separation methods have been used to study dye removal from wastewater, including dripping filters, functioning slurry, agglomeration, optical degradation, adsorption via different substances, and membrane filtering. Over time, however, adsorption has been regarded as a better separation technique [22,23]. The ability to reuse and recycle the adsorbent and the low creation of residues are the primary advantages of this technology [24]. Furthermore, coagulation and adsorption procedures are effective [25,26]. Therefore, researchers are always searching for novel low-cost sorbent materials that might provide more valuable outcomes [27]. Several adsorbents exist to remove the dye from aqueous solutions, including zeolite, modified sawdusts, and different types of modified and unmodified chitosan [28,29].
Eosin Y, ES-Y (anionic dye, C20H6Br4Na2O5) with an IUPAC designation 2-(2,4,5,6-Tetrabromo-6-oxido-3-oxido-3H xanthenes-9-yl) benzoate disodium salt, is enormously dissolved in aqueous solution and is a luminescent dye. It has an excellent capacity for powerful adsorption through red blood cells, and its red hue enables its use in gram stains to distinguish between species of bacteria [30]. Due to how dangerous it is, the U.S. government has banned the use of dyes in food [31]. The ES-Y indicates neurotoxic dangers as well, including significant skin disorders with burning and discomfort [32], and consumption has detrimental consequences, especially on essential organs such as the liver, kidney, etc. [33,34] and severe corneal damage through the destruction of retinal ganglion cells [34]. It also destroys DNA inside live organisms’ digestive systems, causing several illnesses [35,36]. Following breakdown by heat, oxidizing chemicals, and light, the metabolites of dyes are also extraordinarily poisonous and carcinogenic [37]. Considering the toxicity of ES-Y, it has been deemed necessary to create a cost-effective and rapid technique for removing it from wastewater. Various wastewater treatment technologies, including chemical methods [38], oxidizing agents [39], ozonolysis [40], photochemistry process [41], and foaming extraction [42], have emerged over many years. Adsorption, with its well-known benefits over the techniques mentioned above [43], may effectively remove hazardous compounds without generating byproducts that degrade water quality. Utilizing inexpensive, eco-friendly, and highly active surface porous materials to enhance the economic and expenditure of the procedure [44,45] has been the focus and subject of numerous efforts to date. In this context, concurrent analysis and optimization parameters are a demanding need for achieving a cost-effective and widespread treatment for wastewater.
Eosin B, ES-B (anionic dye, C20H8Br2N2O9), 2-(4,5-dibromo-2,7-dinitro-6-oxido-3-oxo-3H-xanthen-9-yl) benzoate disodium salt, is a widely used and indispensable organic dye in the fabric and sanitary sectors that is tremendously poisonous because of its aromaticity [46]. Biological processes, coagulation, adsorption, etc., are employed to remove organic and pigmented pollutants [47,48]. Nevertheless, a few adsorbents, mainly several modified and unmodified activated carbon, were utilized over decades to remove ES-B (Acid Red 91) from aqueous systems [49,50]. ES-B has a somewhat bluish hue [51]. Graphene oxide in aqueous solutions eliminates a variety of dyes. Various studies demonstrate that graphene oxide is an efficient adsorbent for removing these pigments from aqueous environments [52,53]. In aqueous solutions, graphene oxide can remove ionic dyes. Nevertheless, it is hindered by regional issues [54].
Adsorption is one of the efficient chemical, physical, and biological strategies for removing pigments from wastewater. Adsorption is a superior technology with tremendous significance owing to the simplicity of procedures and comparably inexpensive deployment costs [55]. This presents an appealing option for treating polluted water, mainly if the sorbent is affordable and its deployment does not need extra preparation [56]. Activated carbon is a regularly used adsorbent with suitable dyes and chemical removal capability [57,58]. Its downsides, however, are the high cost of treatment and the difficulty of replenishing the adsorbent, which raises the expense of wastewater treatment. For the adsorption process to be economically feasible, there is a need for more adsorbents composed of affordable and locally accessible materials. Researchers have investigated the viability of low-cost adsorbents, including several natural compounds. Health, productivity, and expense are addressed while deciding between several strategies for treating wastewater polluted with dye. Previous work briefly outlines the different advantages and disadvantages of the various methods [59]. The eosin class dyes also irritate the eyes and skin, inhibit protein-protein interaction, and cause human genotoxicity. Consequently, these dyes containing effluent must be thoroughly treated before discharge. Adsorption, utilizing carbon or graphene materials, is a standard physicochemical method for treating wastewater containing stains due to its ease of use and operational efficiency. Recently, researchers discussed the benefits of using different materials for wastewater treatment [60,61]. Furthermore, commercial activated carbon and graphene are expensive. As a result of this obstacle, researchers have investigated feasible and less costly adsorbents to replace these materials, designing various eco-friendly materials for ecological treatments, including removing dyes [62,63]. Herein we introduce an efficient route for the adsorption of vital dyes from an aqueous solution using the synthesized CNFs from palm residues Scheme 1. We have designed and produced novel materials of dispersed CNFs using a green synthesis technique. This technique introduces new nanomaterials and studies the material adsorption characteristics. The prepared nanomaterials offer a high adsorption ability. Therefore, this research investigates the potential of CNFs for water treatment from dangerous pollutants involving toxic eosin dye removal. The influence of diverse factors, such as adsorbent concentration, dye molecules content, and contact time, on adsorption efficiency were investigated. Lastly, the proper conditions of the experiment series, kinetics, and the isotherm (Langmuir and Freundlich) equations are investigated.

2. Materials and Methods

2.1. Materials

All the reagents are of analytical grades; hydrochloric acid (HCl. 37%) was purchased from Sharlau, Spain. S. bayamus yeast strains were obtained from Laboratoire Oenotechnique, Clermont-L’Herault, France, and used for submerged fermentation. The discarded dates (date samples), which are mushy and have a terrible texture, are unsuitable for human consumption, were employed as samples for this research. These dates combined all date cultivars cultivated in Saudi Arabia (Al-Qassim area).

2.2. Preparation of Alcohol

In a particular machine, date samples were cleaned and combined with deionized water. This machine cooked the date–water combination at 80 °C for 30 min and then mechanically separated the seeds. The blended seedless date solution was transferred to a 20-L-capacity tank for mixing and allowing it to stand at room temperature in the tank. The extracted date was then decanted, refined, and microfiltered. Seventeen liters of clarified and microfiltered date juice was poured into a fermenter, 5 g of S. ba’atnus was added, and the mixture was agitated vigorously for 48 h at 30 °C. The fermented date juice was distilled at 78.5 °C [64].

2.3. Preparation of CNFs

The CNFs were produced by precipitating date ethanol vapor in a tube furnace’s interior stainless-steel layer at 680 °C. The black soot was collected. Then, 10 g of the contents was purified using 100 mL of concentrated HCl and boiled for one h. The products were filtered, washed until neutral, and dried in an oven at 40 °C for 12 h.

2.4. Batch Biosorption Experiments

Using batch-mode procedures, the adsorption effectiveness of ES-Y and ES-B onto CNFs was influenced by many variables, including adsorbent dosage, contact duration, solution pH, and starting concentration. Experiments on the adsorption of ES-Y and ES-B by CNFs were conducted using 50-mL conical stoppered flasks using a batch technique. 50 mg of CNFs were soaked in 50 mL of an aqueous solution comprising varying concentrations of ES-Y and ES-B, and the resulting mixes were mechanically stirred at room temperature. Investigations on the adsorption of ES-Y and ES-B by CNFs have been conducted at twenty, forty, sixty, eighty, hundred, and one hundred twenty intervals. At the same time, sorbent dose, pH, and starting ES-Y and ES-B concentrations were held constant. The impact of the adsorbent dose was studied by shaking for 60 h a known quantity of CNFs ranging from 0.01 to 0.1 g with a solution in water that has a 0.01 g/l ES-Y and ES-B. To explore the influence of the starting content of ES-Y and ES-B, batch sorption experiments were conducted at varying concentrations of ES-Y and ES-B (10, 50, 100, 150, 200, 250, and 300 mg/L). At the same time, additional variables involving sorbent dose and contact duration remained unchanged.
The proportions are collected from the main stock at predetermined times and filtered utilizing a 0.45 m filter paper (GF/C Whatman, Maidstone, UK) prior to colorimetric measurement of the residual concentrations of ES-Y and ES-B using a VIS/UV Spectrophotometer-19 (SCO-Tech, Dingelstädt, Germany). To minimize the errors, tests were done thrice for 60 h at 298 °K, and the results were utilized for supplementary computations. Assurance controls were concurrently conducted to measure ES-Y and ES-B ion elimination throughout adsorption in the absence of adsorbent. A quantity that adsorbed ES-Y and ES-B at equilibrium, qe (mg/g), into CNFs was determined by subtracting the initial and equilibrium concentrations using the formula below [65].
q t = C o C t   V m s
while
qe = adsorbed dye at equilibrium (mg·g−1),
C0 = initial concentrations (mg·L−1)
Ct = contaminant concentrations (mg·L−1) in the liquid phase at equilibrium and time t
V = the total volume, and ms is the mass of CNFs.
Based on the given formula, the percent of adsorption (E%) in CNFs was calculated as:
E % = C o C e C o × 100  
where:
Co = Concentration of ES-Y and ES-B at the investigation start (mg/L) and
Ce = Concentration of ES-Y and ES-B at equilibrium (mg/L).

2.5. Adsorption Capacity Analysis

The adsorption capacities of CNFs were calculated using the following equation
q t = C o C t   V m s
where:
qt = amount of ES-Y and ES-B adsorbed by the silica nanoparticles (mg/g),
Co = initial ES-Y and ES-B concentrations (mg/L),
Ct = equilibrium ES-Y and ES-B concentrations (mg/L) of ES-Y and ES-B solutions,
V = volume of ES-Y and ES-B in litre, and
ms = CNFs mass in gram.

2.6. Equilibrium Biosorption Isotherm Models

To analyze the equilibrium interactions among contaminants with adsorbent materials, Freundlich and Langmuir isotherm models have been employed to characterize how ES-Y and ES-B interact with CNFs and their equilibrium concentrations in solution at a constant temperature. These formulas provide the linear version of the Langmuir and Freundlich isotherms:
Langmuir   formula :   C e Q e = 1 Q max K L + C e Q max  
Freundlich   formula :   Log   Q e = log   K f + 1 n   Log   C e
where Qe is the equilibrium adsorption mass of ES-Y and ES-B per unit mass of adsorbent (mg/g) and the concentration of ES-Y and ES-B at equilibration is denoted by Ce (mg/L). Qmax is the maximum absorption specificity at saturation of the monolayer (mg/g). KL is the Langmuir constant, while Kf is the Freundlich constant. n is an empirical variable that varies based on the heterogeneity of the adsorbent’s surface.

3. Results

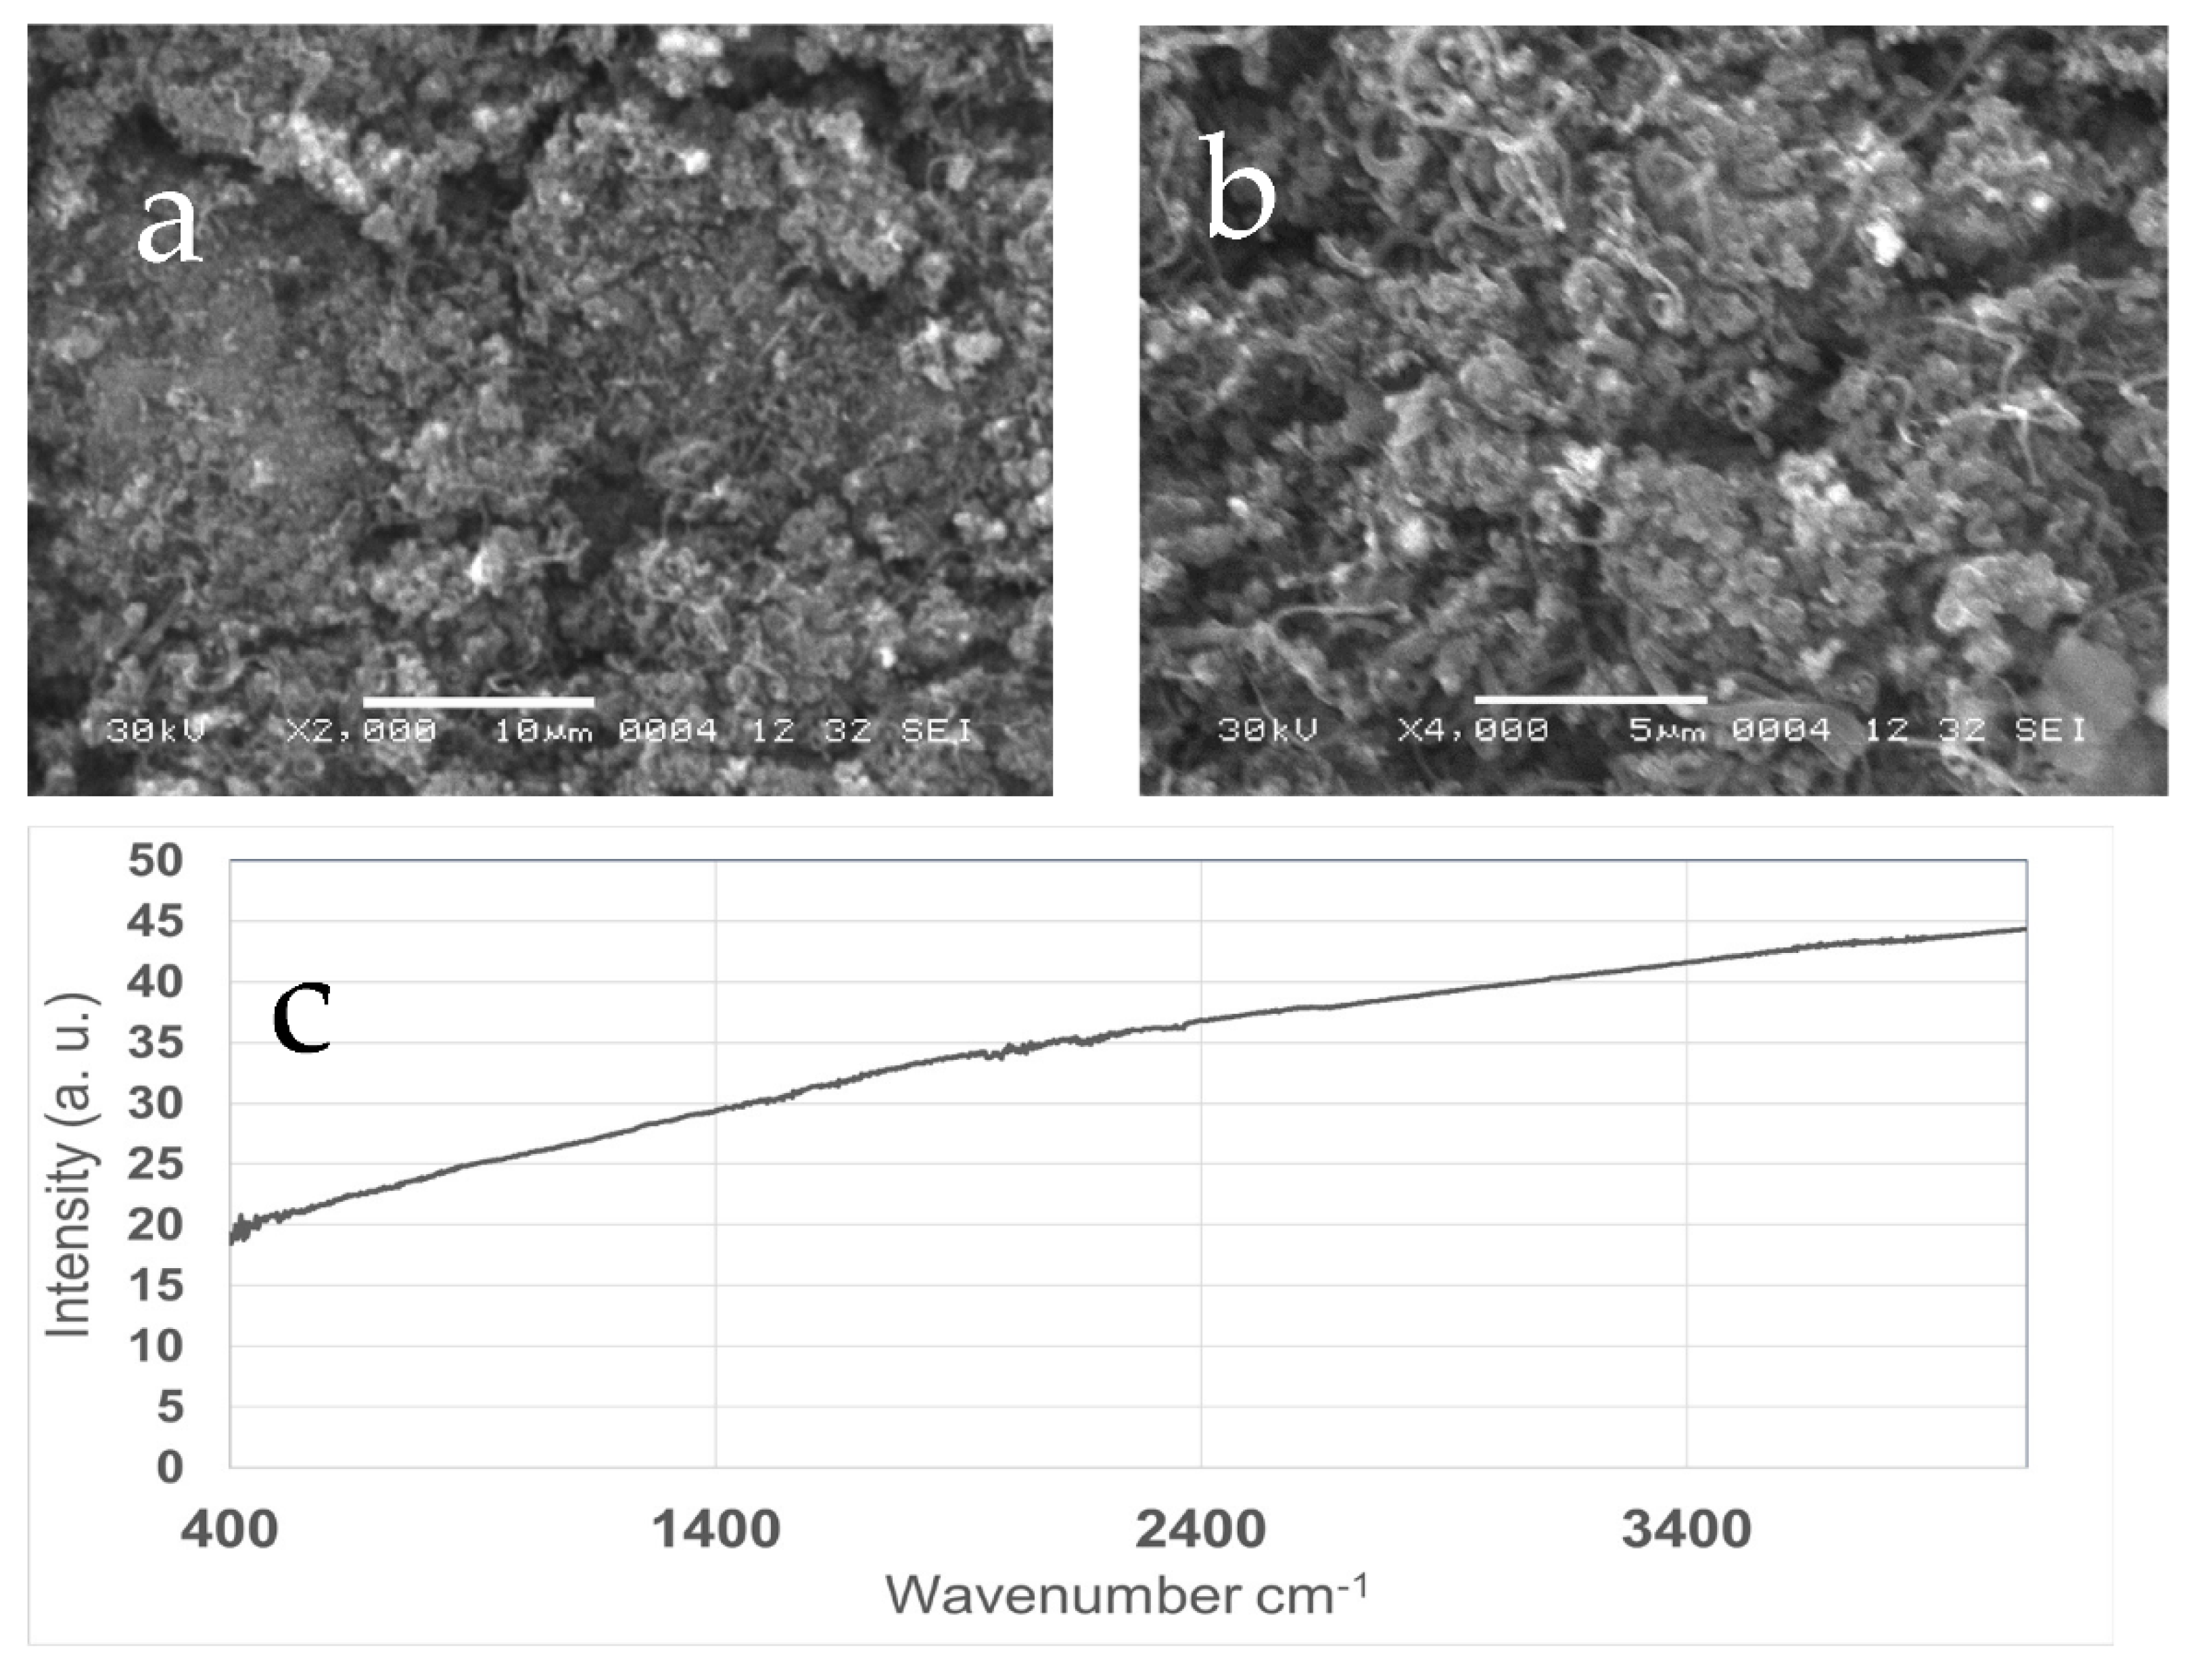
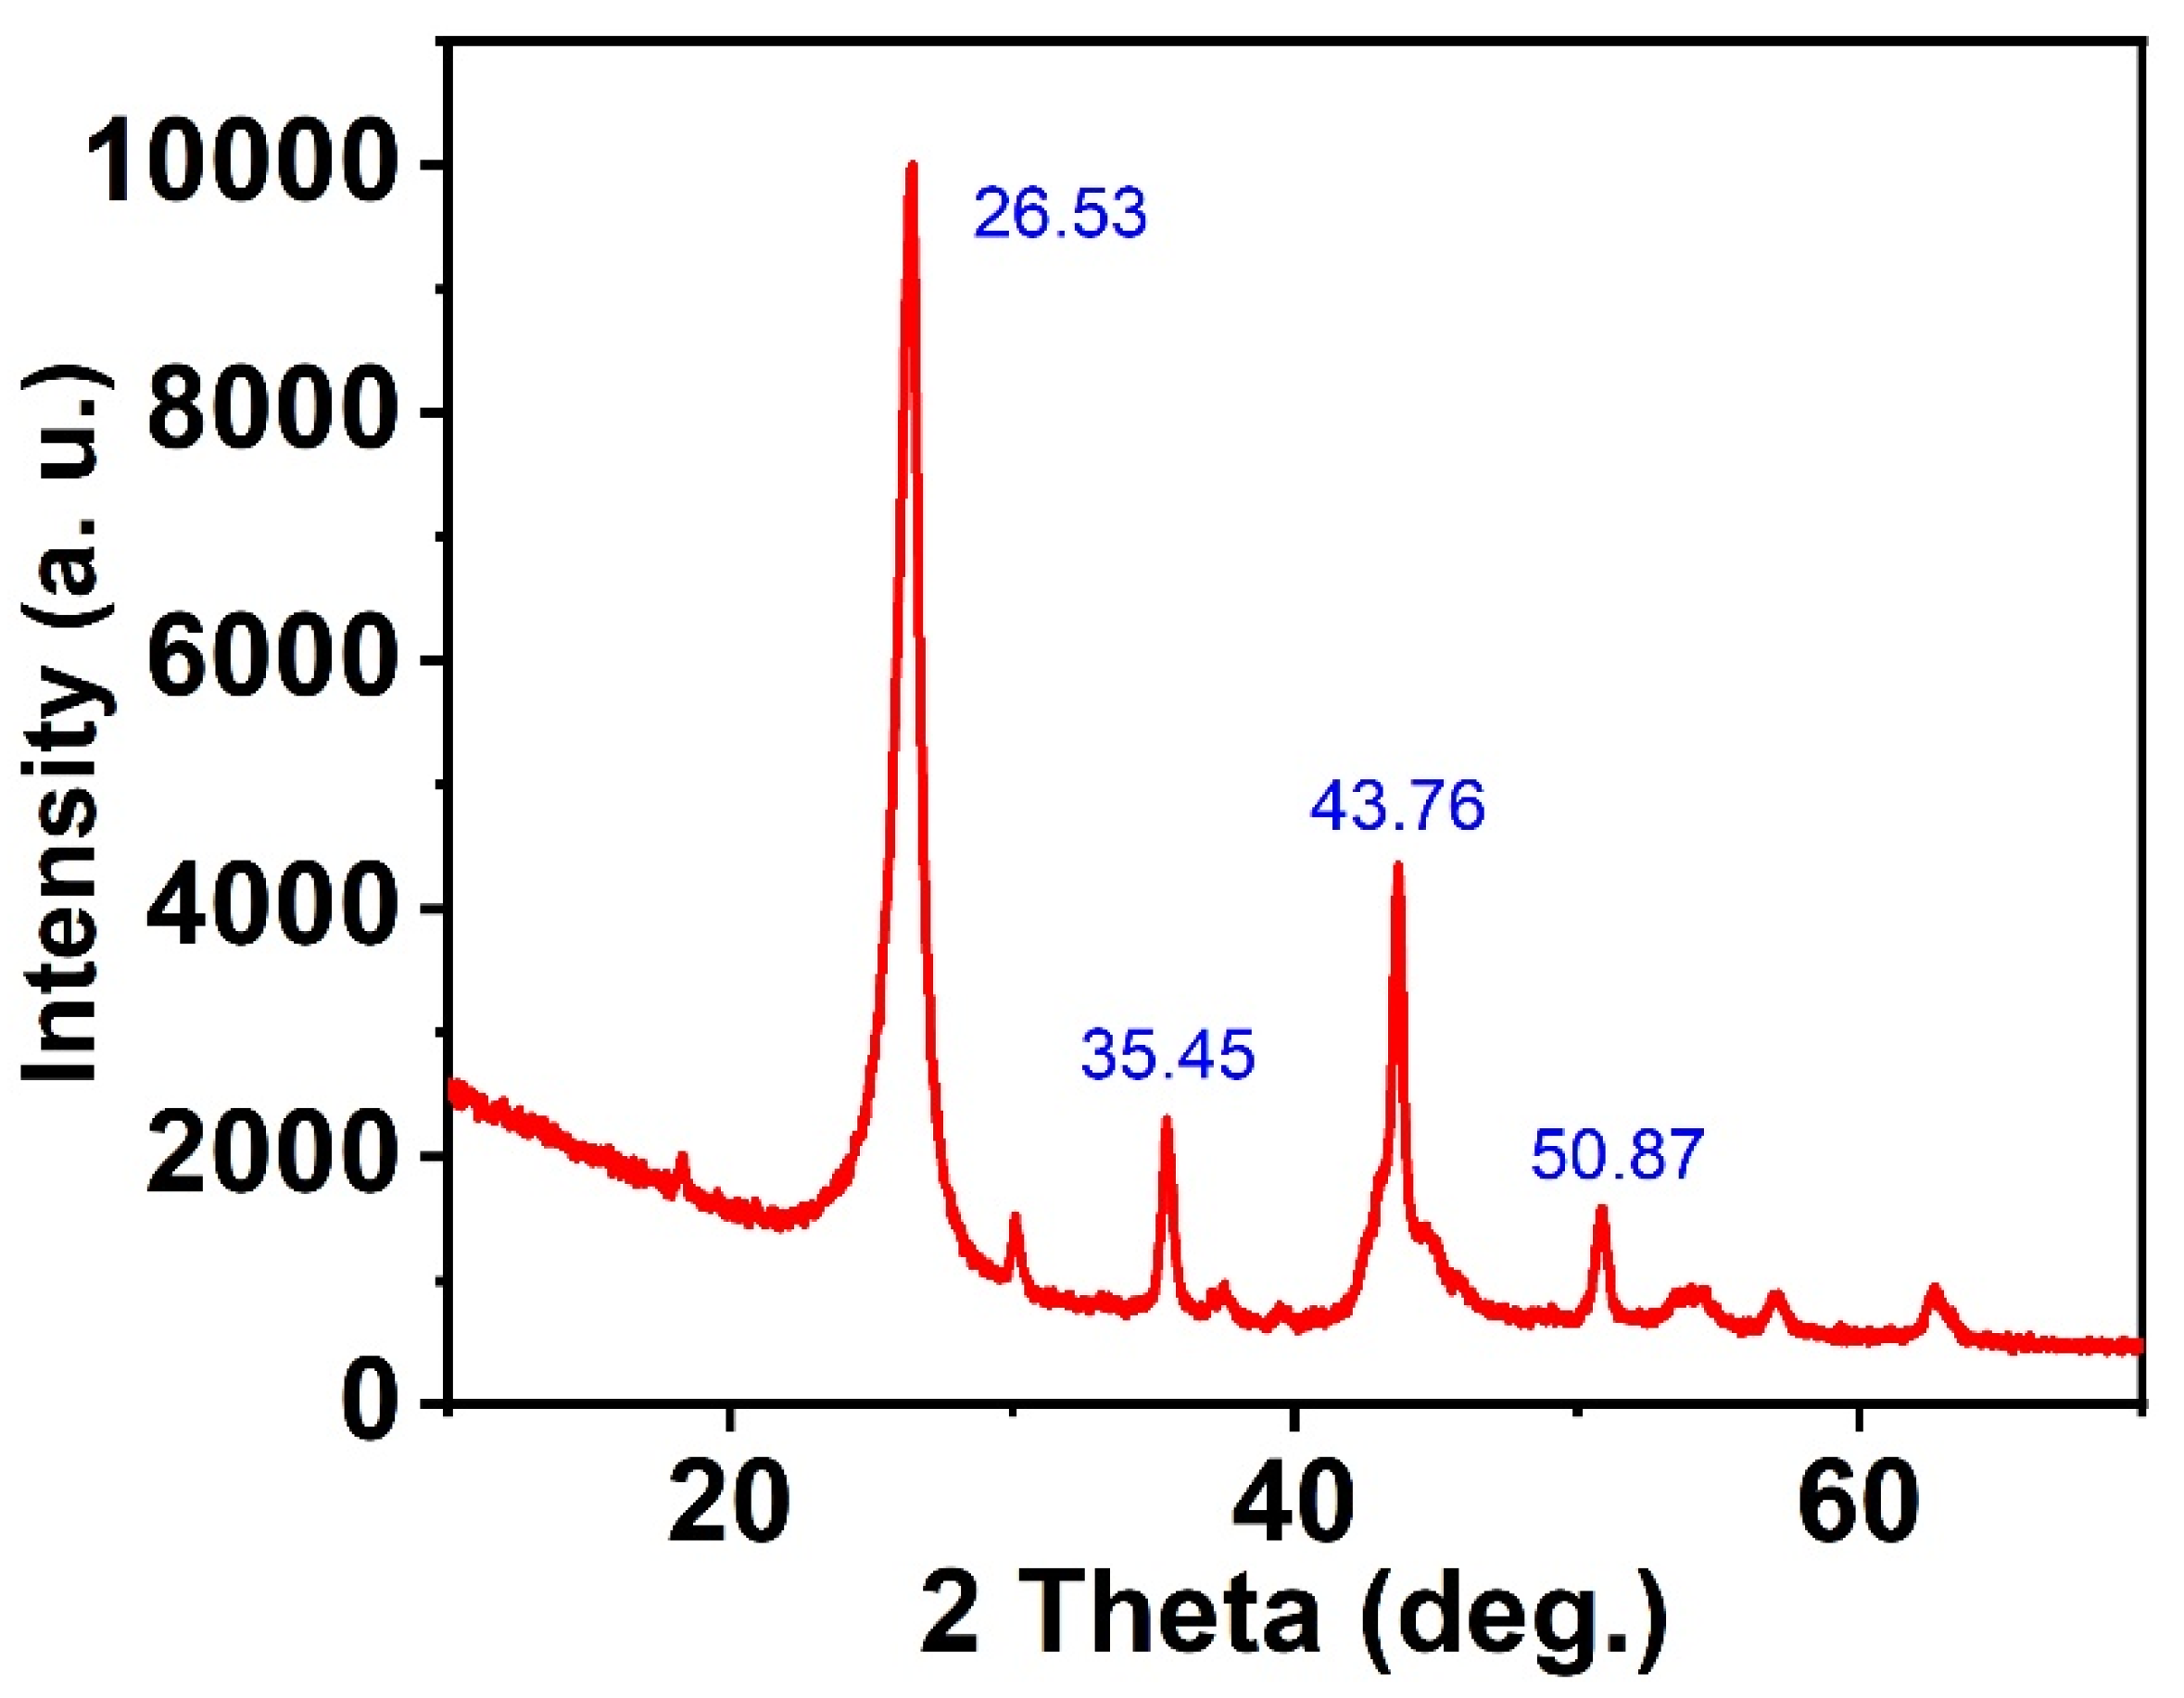
3.1. Characterization of Sorbents

The SEM images of CNFs are shown in Figure 1a,b, respectively. The SEM micrographs were obtained using a JEOL JSM-5400 LV SEM (JEOL Ltd., Akishima, Japan). An acceleration voltage of 5 kV was conducted for the measurements. The magnifications ranged from 100 to 2000×. Images depict a thick proliferation of homogeneous cylinders CNFs of various sizes. These data demonstrate that the inner surface of a commercial stainless-steel tube may facilitate the formation of CNFs at a temperature of 680 °C without the need for additional catalysis. As moderate oxidation settings were maintained to prevent damage to the CNFs, amorphous carbon residues resistant to oxidation remained attached to the CNFs’ surfaces. Moreover, FTIR analysis was carried out for the synthesized CNFs, as shown in Figure 1b.
In addition, CNFs were characterized through XRD (Figure 2). The patterns show a distinct, sharp, and high-intensity peak around 2-theta 26.53, 35.45, 43.76, and 50.87, thereby confirming the presence of highly crystalline graphitic CNFs. These results agree with the recent works [66,67]. Further, the BET value was measured for CNFs and found to be 335 m2/g. This indicates the extreme surface area of the synthesized CNFs.

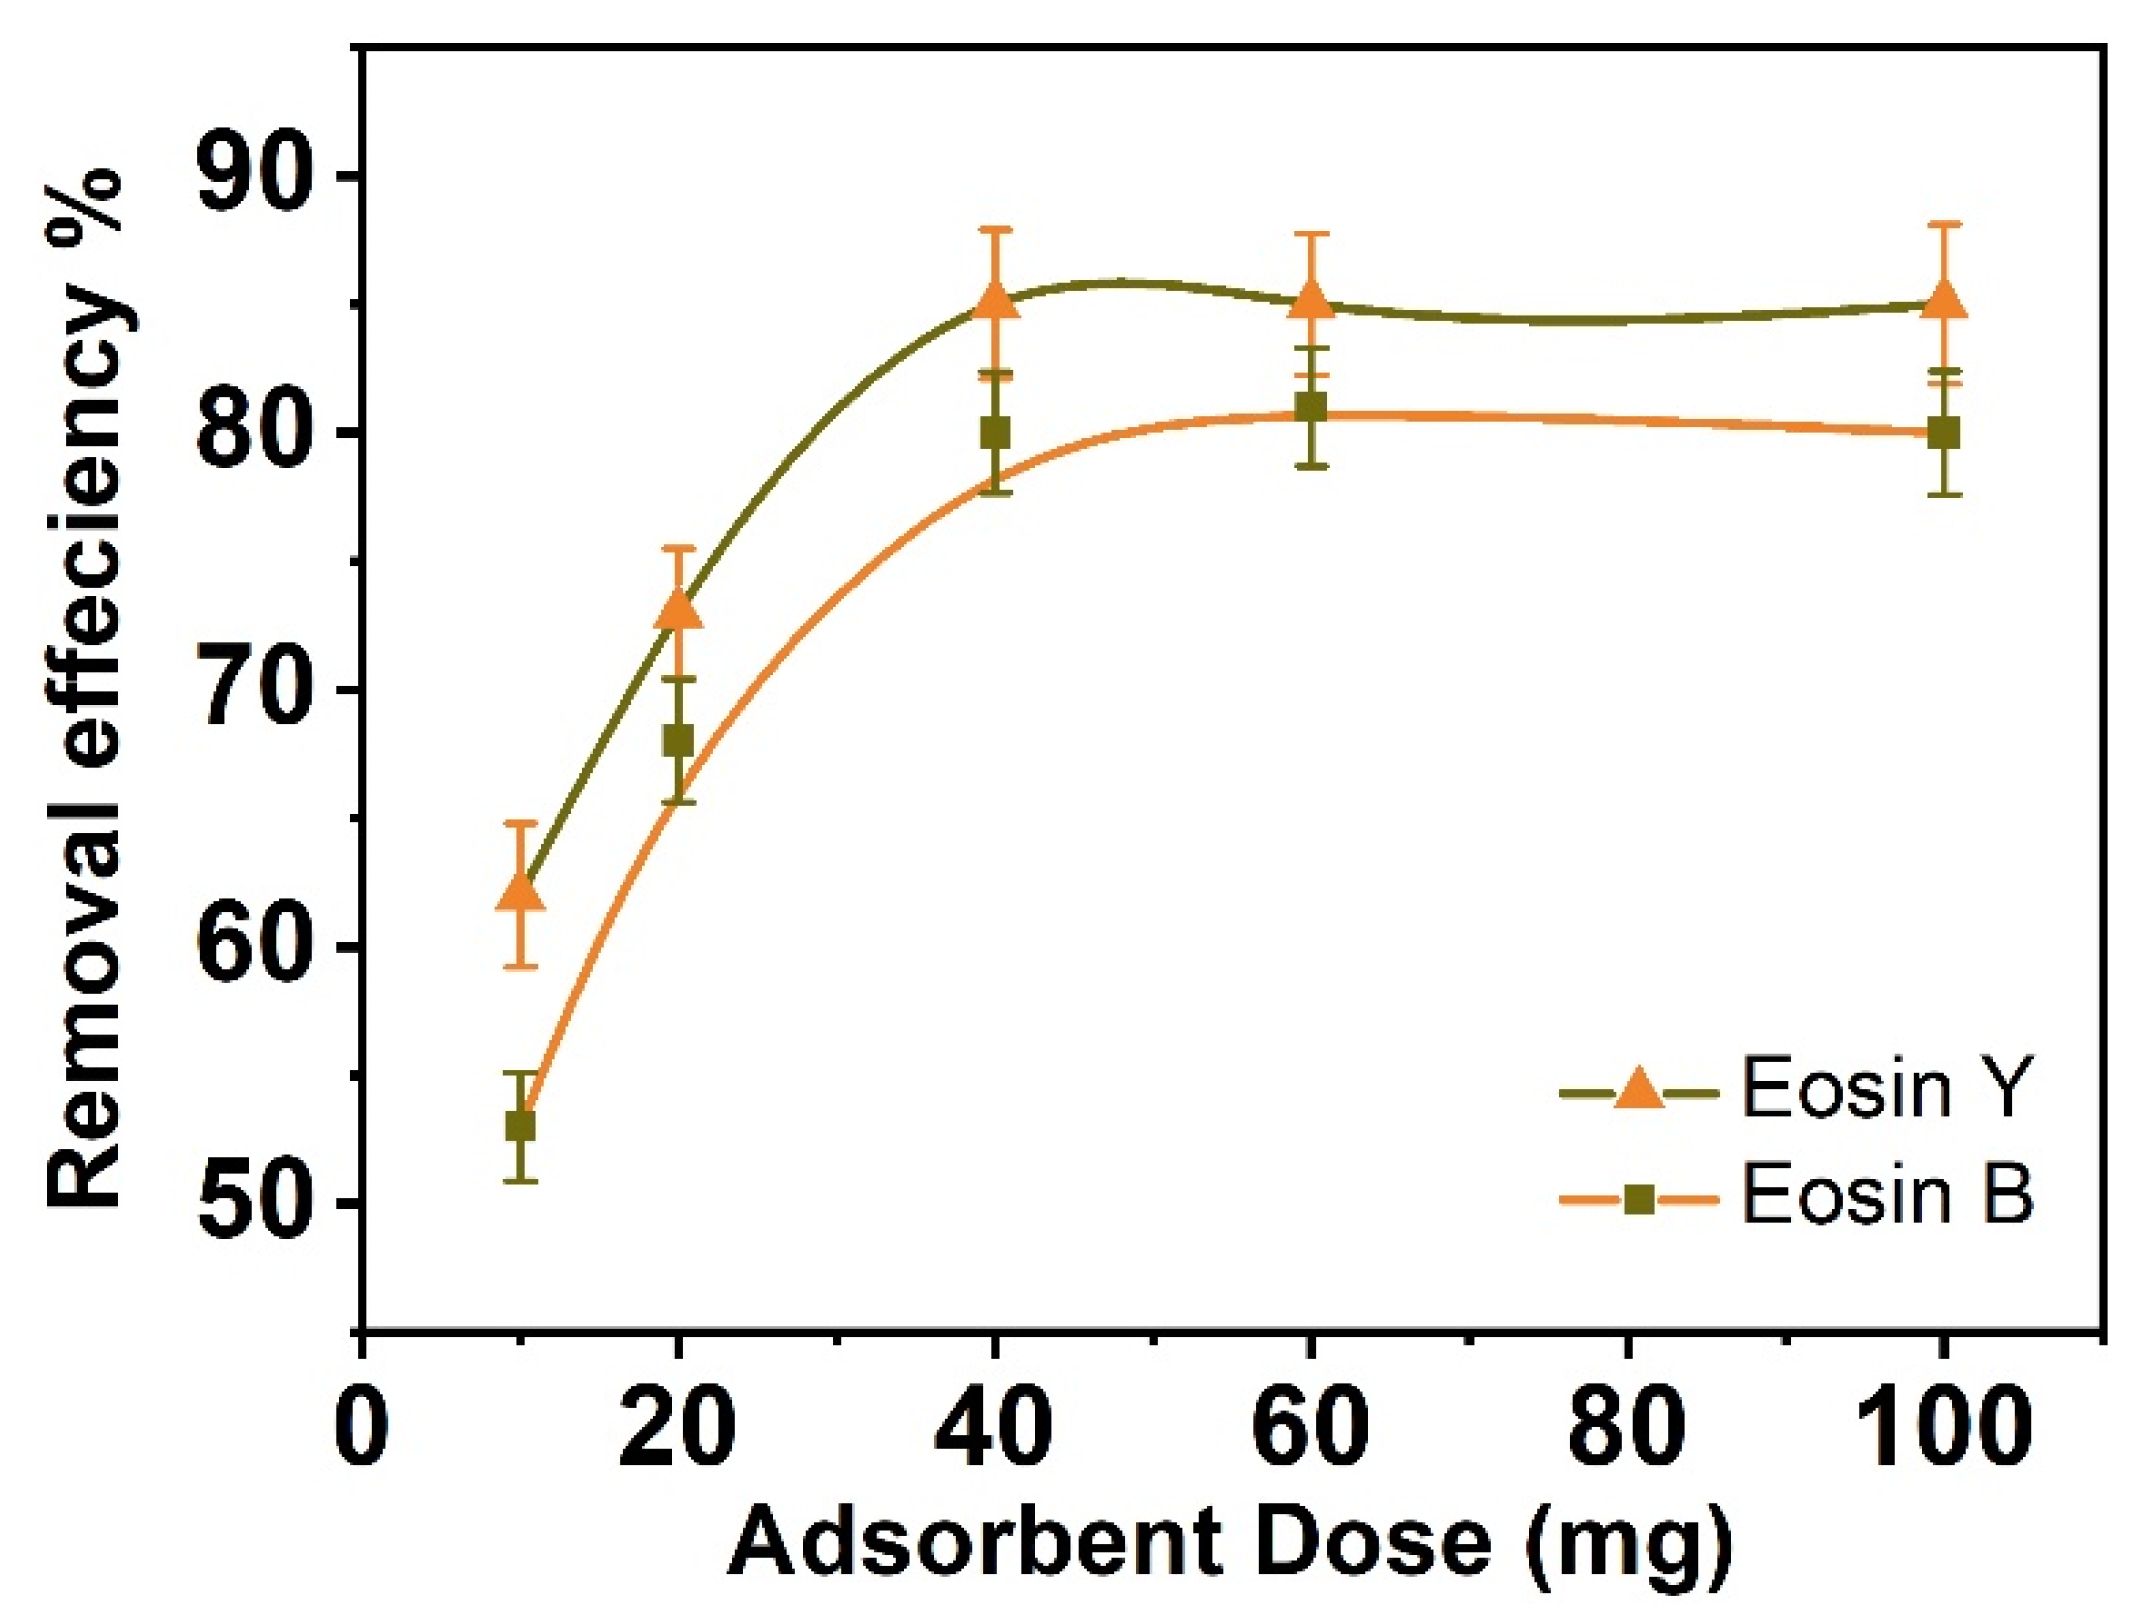
3.2. Effect of Adsorbent Dosage
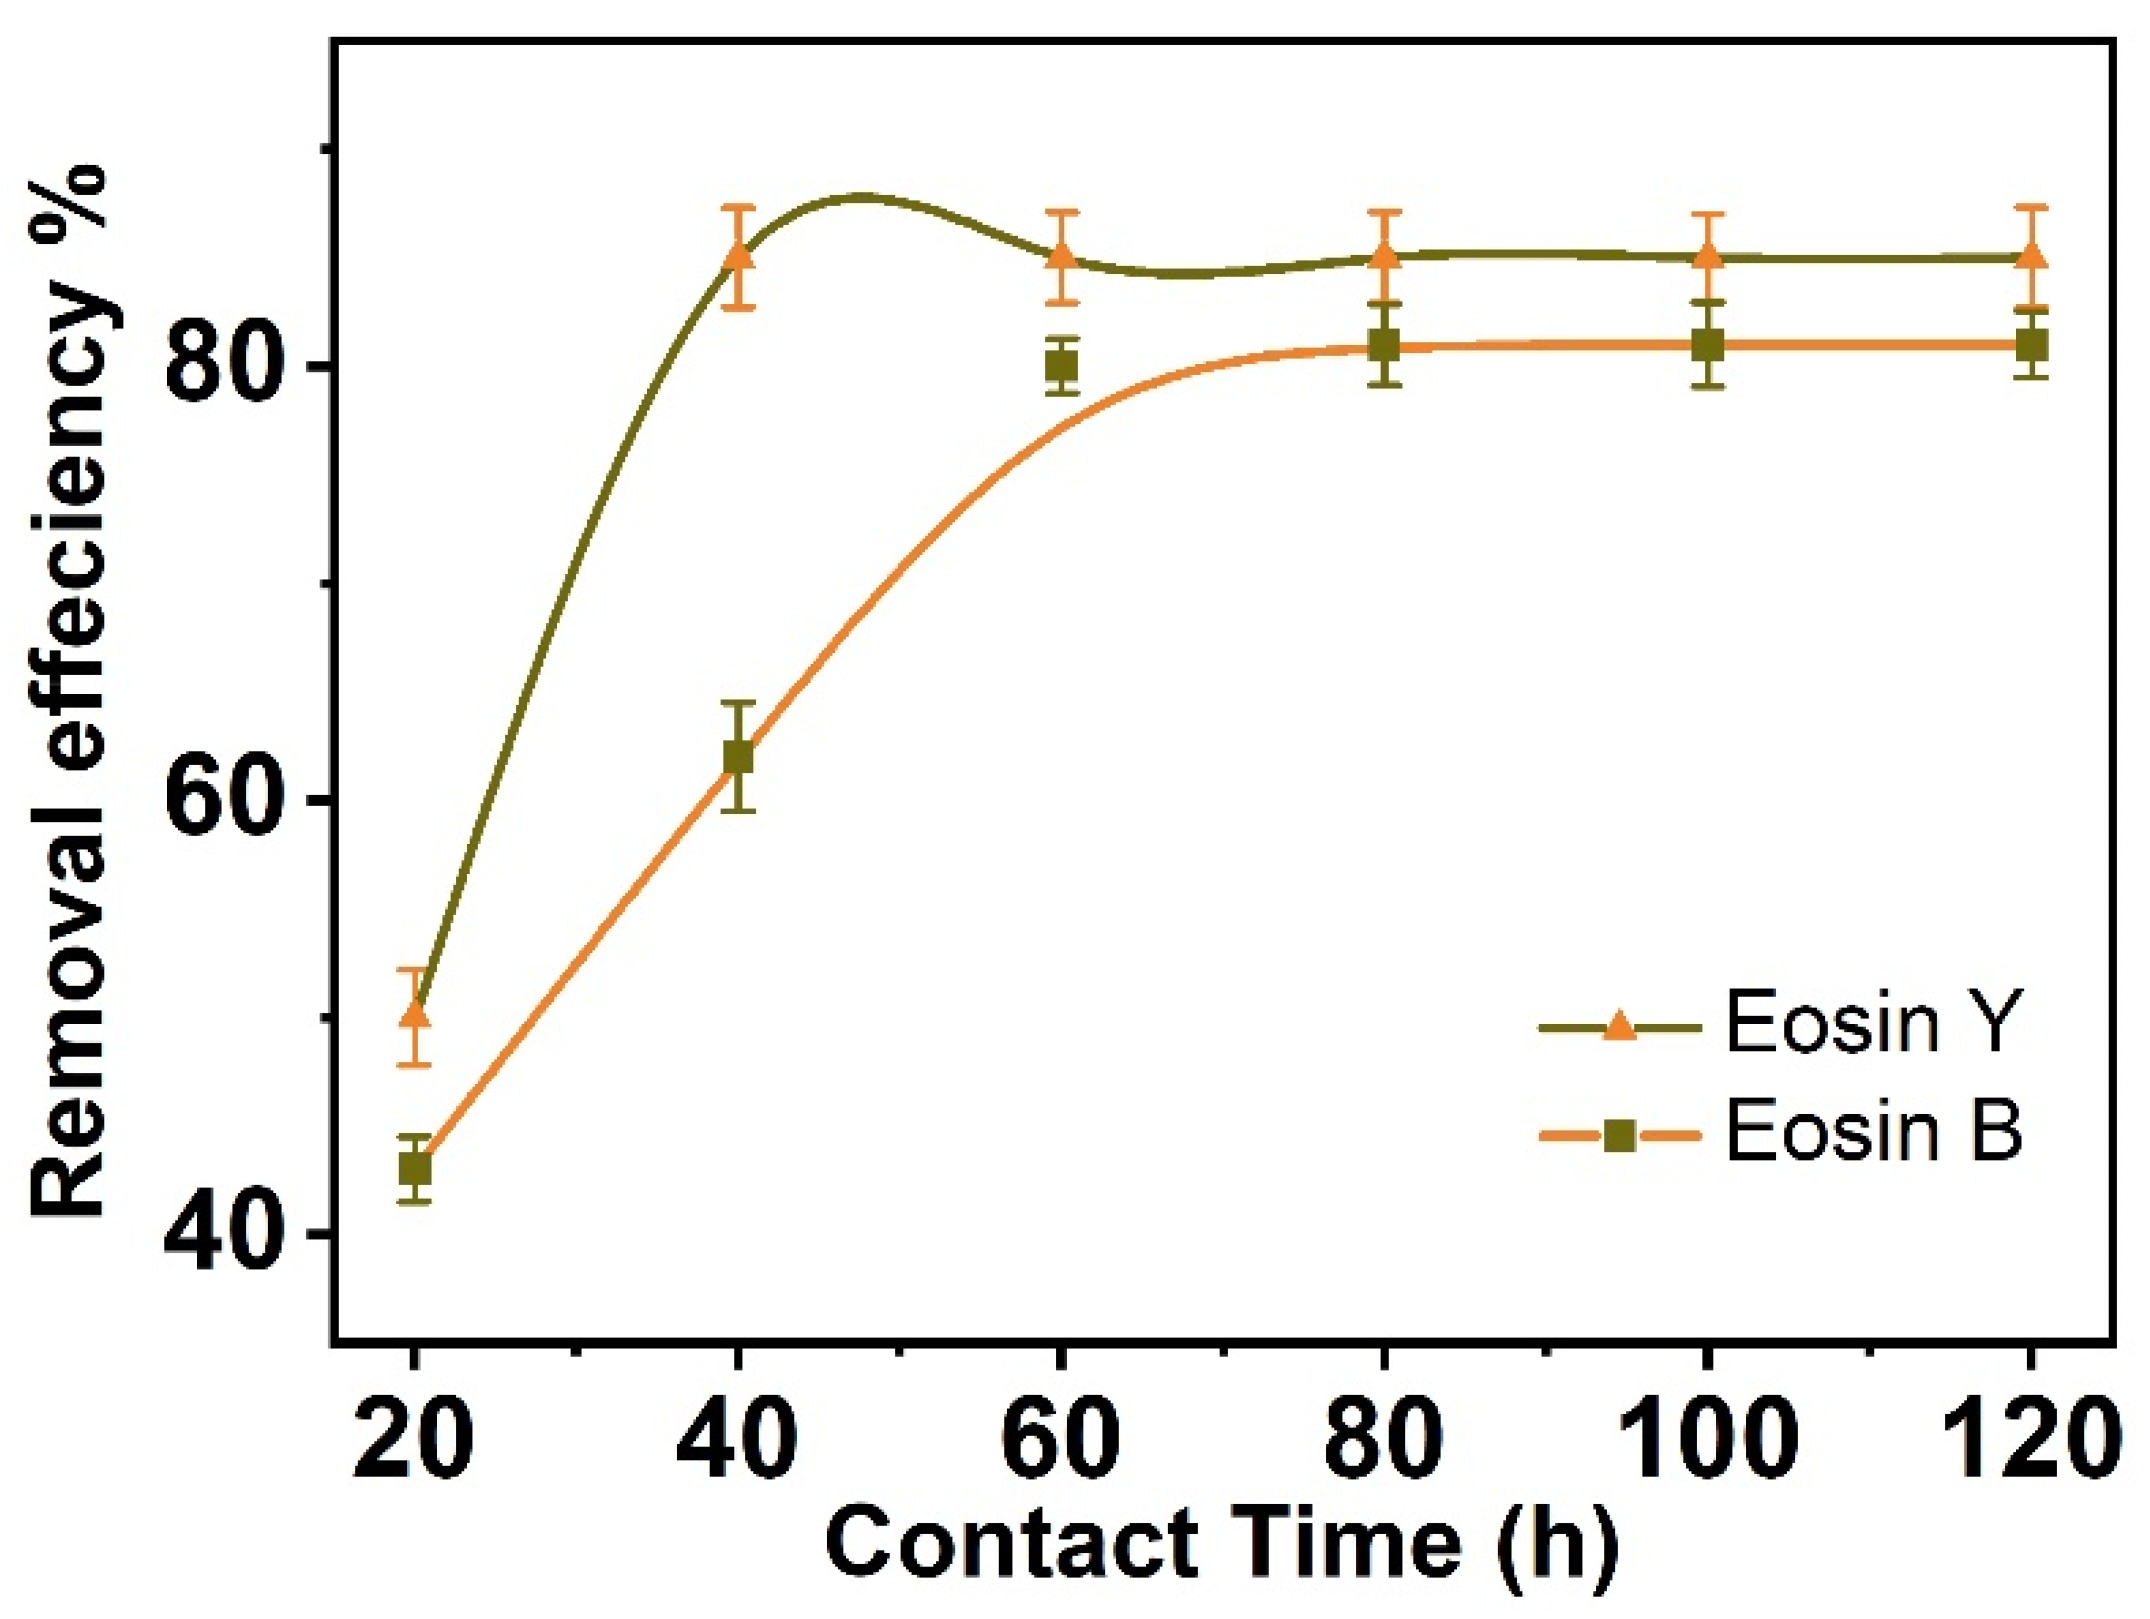
The influence of the adsorbent dosage, which establishes the adsorbent’s capability for a specific ES-Y and ES-B concentration, is one of the critical parameters in ES-Y and ES-B removal investigations. Figure 3 illustrates how such an adsorbent dosage affects how effectively ES-Y and ES-B are removed through an aqueous medium. Different adsorbent concentrations of the CNFs dose ranged from 10 to 100 mg for the 50 mL, 50 ppm ES-Y and ES-B solutions. In the initial phases, the data demonstrate that the percent of ES-Y and ES-B clearance increases with the increase in adsorbent dosage; however, no substantial improvement was seen afterward. The removal efficiency, which seems dependent on CNFs, is 62.0% to 86.0% for ES-Y and 53.5% to 83.0% for ES-B, correspondingly. This means that there is 40 mg of CNFs uptake 43.0 ppm for ES-Y and 41.5 ppm for ES-B from an aqueous solution containing 50 ppm of phenol concentration. The adsorption efficiency of ES-Y and ES-B ions is enhanced based on the adsorbent dosage of 0.040 g. After this dose, the adsorption is peripheral and steady [68,69]. Therefore, it is concluded that 0.8 g/L of CNFs is the ideal concentration for this experiment. Our findings concur with those findings [70].

3.3. Contact Time

After the adsorbent dose, the influence of shaking duration is the second-most-critical factor in determining the biosorption equilibrium time in batch biosorption studies [71]. The shaking time required to establish an optimum outcome was influenced by the surface properties of CNFs and their accessible adsorption sites. Figure 4 depicts the influence of contact time on the removal efficiency of ES-Y and ES-B from aqueous solutions. The effect of shaking time on the biosorption of ES-Y and ES-B onto CNFs was investigated as a function of contact time ranging from 20 to 120 h at neutral medium, 278 ± 1 °K, and 150.0 round per minute. The graph displays ES-Y and ES-B removal efficiencies for CNFs varying from 50% to 84.0 for ES-Y and 43% to 80% for ES-B, respectively. During the earliest phases, the adsorption effectiveness of ES-Y and ES-B on CNFs increases dramatically, suggesting an abundance of active binding sites that are easily accessible. The curve eventually reaches a plateau, indicating that the absorbent is saturated at this level. According to the graph, the ES-Y and ES-B removal efficiencies for both CNFs achieve equilibrium after 60 h. With the steady occupation of active binding sites, a prolonged interaction period does not significantly improve. After equilibrium, ES-Y and ES-B adsorption uptake does not vary substantially with time [72]. This demonstrates that the optimal shaking duration is 60 h, which is adequate to achieve equilibrium for the most significant removal efficiency of ES-Y and ES-B ions from aqueous solutions by CNFs.

3.4. Effect of Initial Dye Concentration
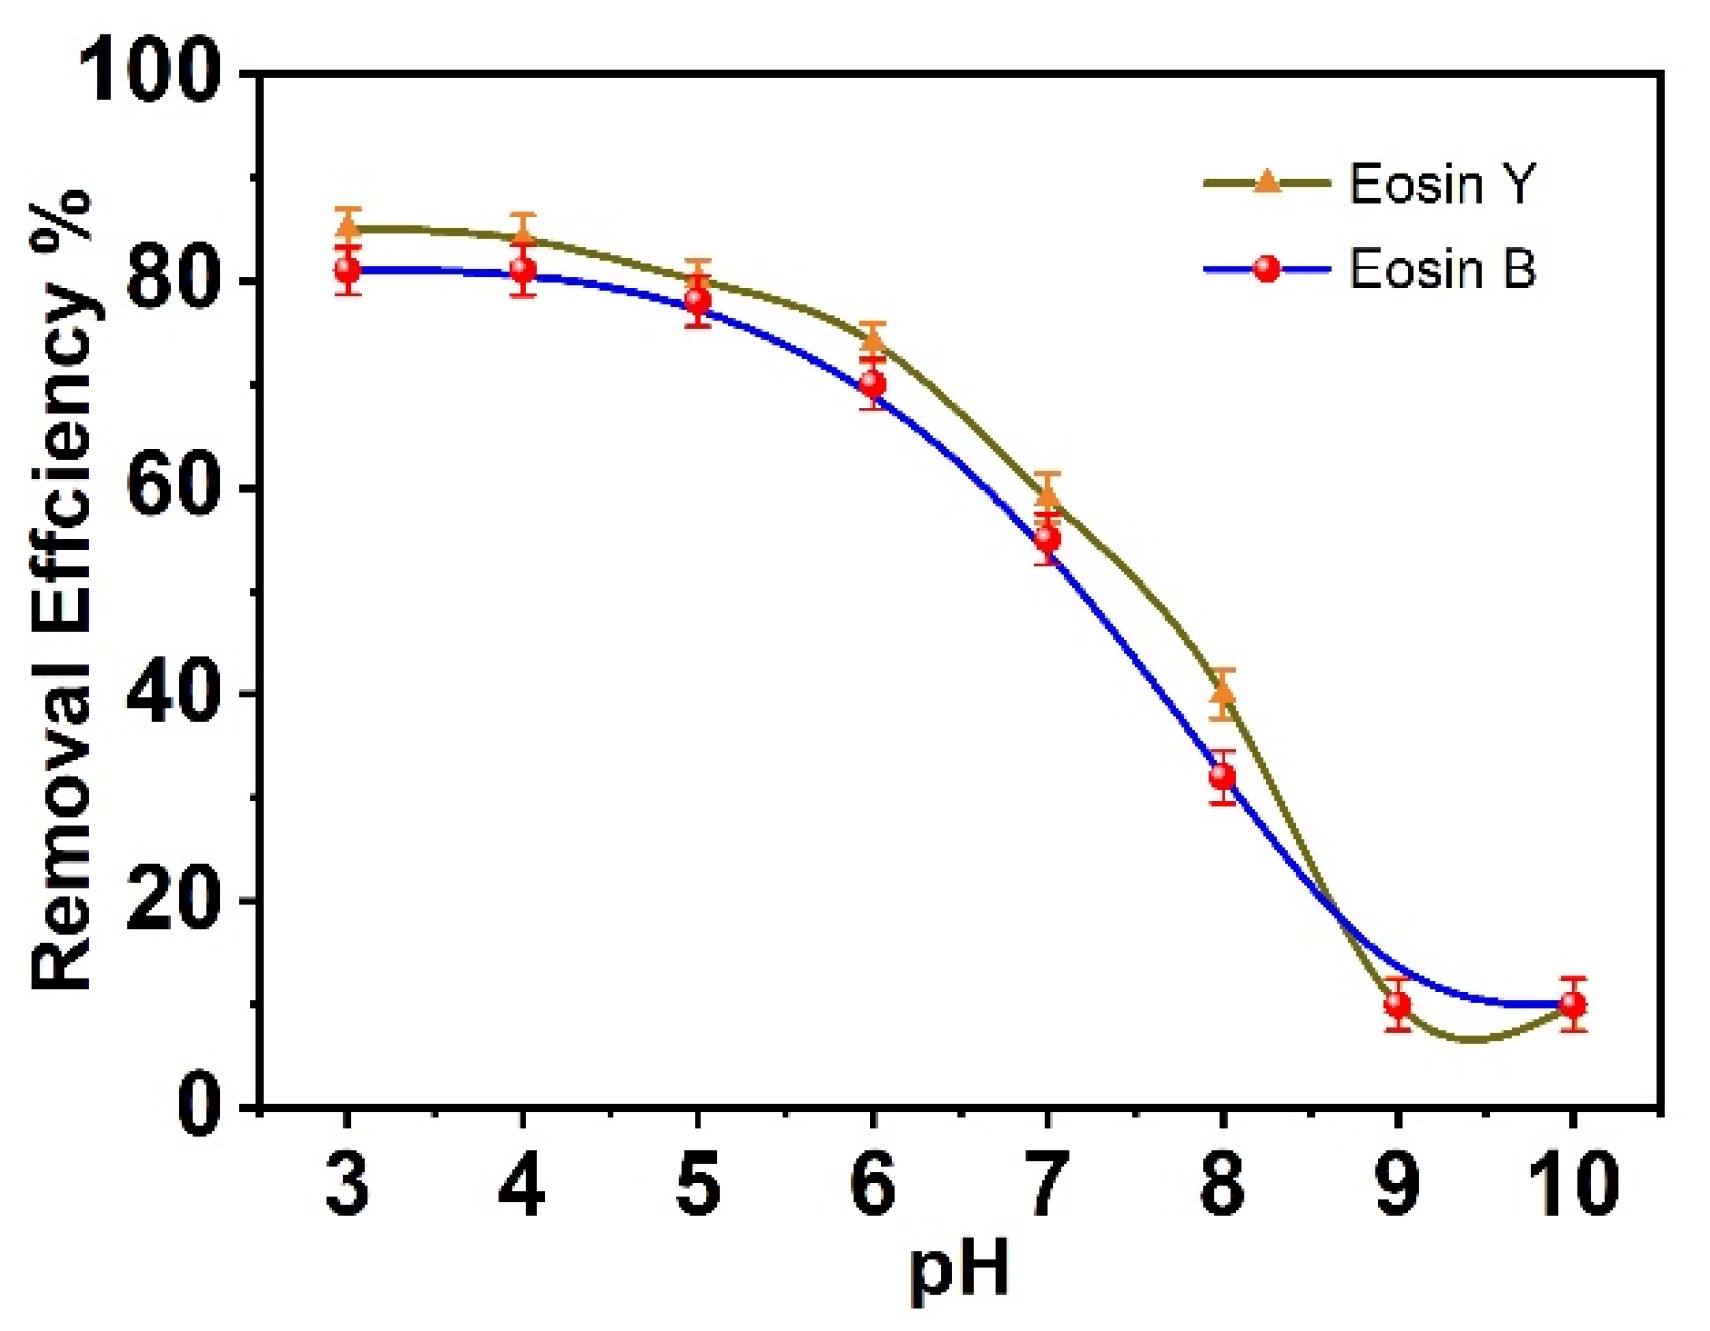
The impact of starting concentration (50–250 mg/L) on the removal efficiency of ES-Y and ES-B from aqueous solution by CNFs at neutral medium, 278 ± 1 °K, 50 mg biosorption dosage, 60 h, and 150 round per minute of shaking speed is depicted in Figure 5. When the adsorption of ES-Y and ES-B ions on CNFs diminishes as ES-Y and ES-B concentrations increase. The ES-Y and ES-B removal efficiencies for CNFs range from 83 to 49% for ES-Y and 79 to 41%, for ES-B. The CNFs may have more active adsorption sites than ES-Y and ES-B ions in the solution at lower initial ES-Y and ES-B concentrations, which could lead to the increased absorption. At the same time, the lower uptake at higher initial ES-Y and ES-B concentrations indicates the formation of monolayer coverage of the ions. The ES-Y and ES-B removal efficiency decreases on the outer surface of the CNFs because the time required to reach the adsorption equilibrium point on CNFs was expected to be longer at a higher initial ES-Y and ES-B concentration than at a lower initial concentration [73]. Consequently, it is deduced that this study’s optimal beginning ES-Y and ES-B concentration is 50 mg/L.

3.5. Effect of pH

ES-Y and ES-B adsorption on CNFs is pH dependent, as established in (Figure 6). The pH of a solution is a critical factor governing the adsorption capacity of ionic organics onto an adsorbent [74]. Ji et al. anticipate that an increase in the pH of the adsorbate might split hydrophobic neutral adsorbate molecules into hydrophilic, negatively charged species, hence diminishing the hydrophobic interaction [75]. Wang et al. also postulate that an increase in electrostatic repulsion as the pH of the adsorbate increases would decrease the electrostatic interaction between oppositely charged adsorbate and adsorbent [76]. A change in pH may also benefit the adsorbate’s ability to transfer electrons, boosting the interaction between electron donors and acceptors [77]. The impact of pH was evaluated by evaluating the dye absorption of 0.04 g adsorbent at pH values ranging from 2 to 10, using hydrochloric acid or sodium hydroxide to alter the pH and 50 ppm concentration of eosin dyes. The reaction was left overnight at room temperature. As seen in Figure 6, the removal efficacy of CNFs decreases considerably at pH values over six. It is usual for anionic dyes such as ES-Y and ES-B to be negatively charged in an acidic medium. Consequently, it encourages an electrostatic interaction between the positively charged adsorbents and the anionic groups of the dye. At higher pH levels, the anionic bromide groups of eosin dyes compete with the system’s excess OH ions for adsorption sites on adsorbents, lowering the adsorbent’s removal efficiency.
Little removal in the pH zone above 7 indicates that electrostatic attraction is not the predominant adsorption mechanism. Other processes, such as hydrophobic interactions between the dye and the adsorbent, interactions involving hydrogen bonding and Van der Waals force, and pore trapping, are also at work during adsorption at this pH [78].
Ethanol was used as the desorption solvent for the reusability of the CNFs. The polar nature of ethanol helps to release dyes from adsorption onto CNFs [79]. The removal efficiency of dyes from CNFs surface barely decreases for consecutive cycles to reach about 81–77% for ES-Y and ES-B, respectively, after five cycles.

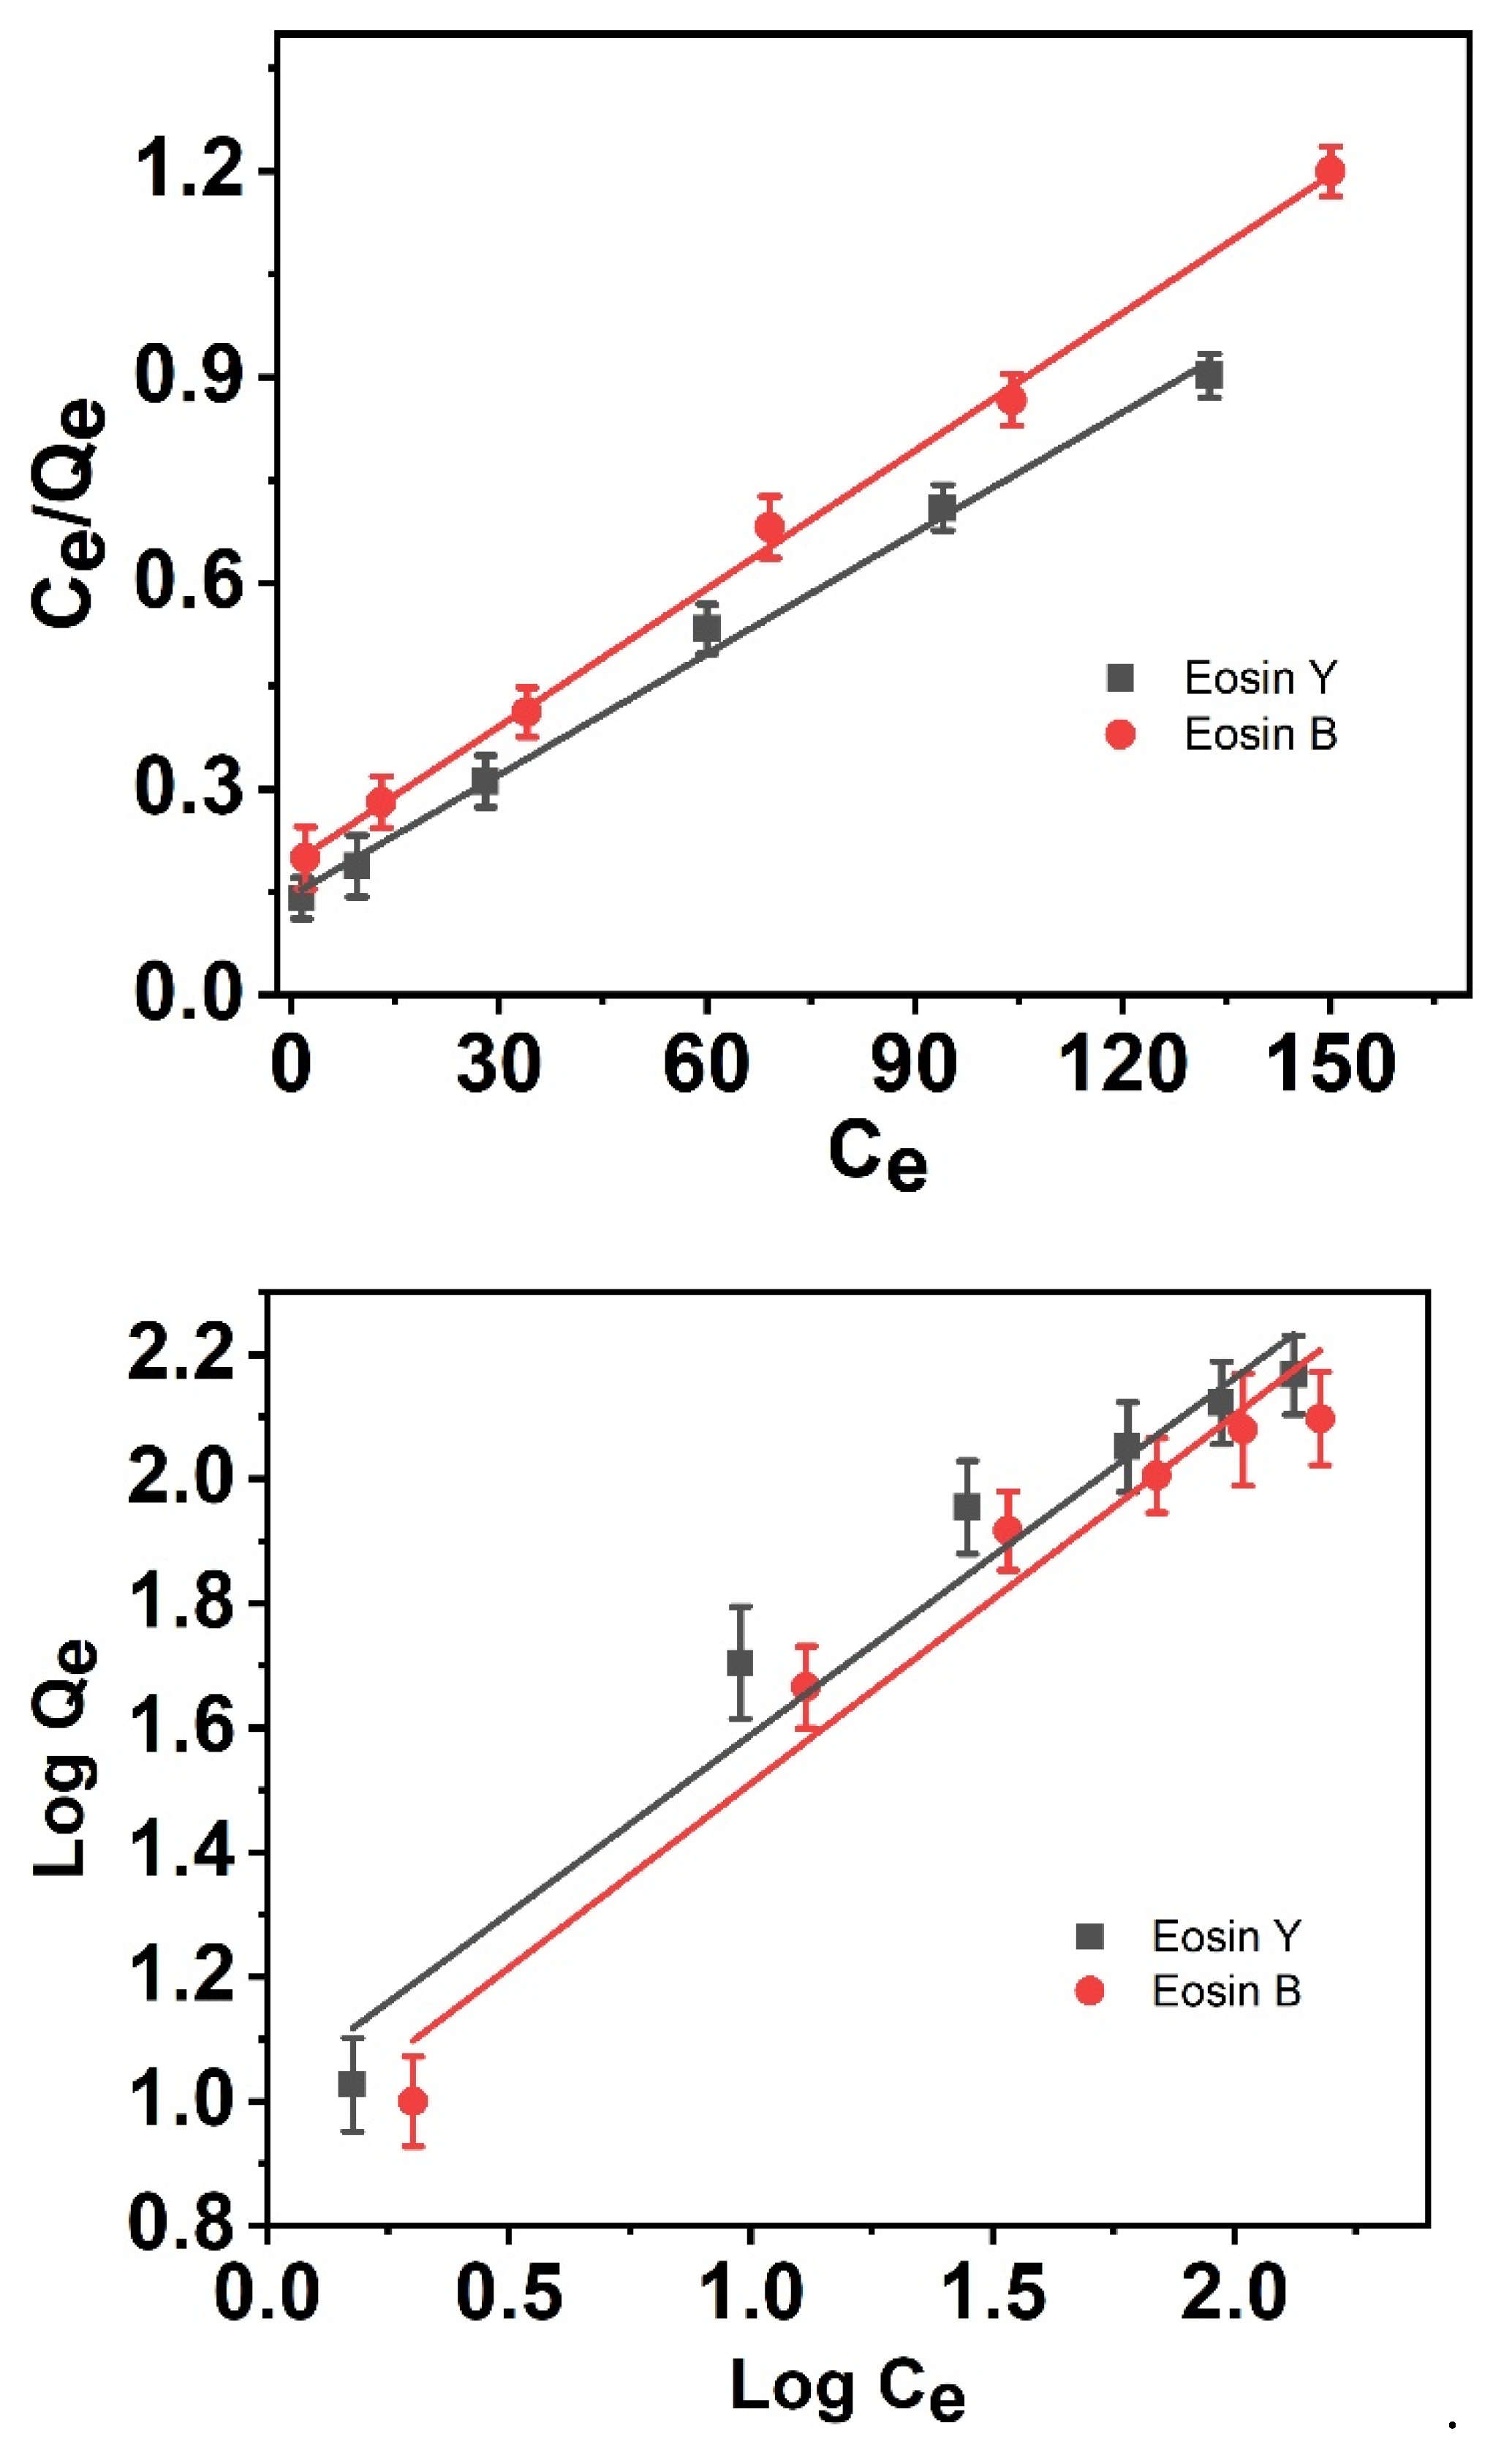
3.6. Adsorption Isotherms

The adsorption isotherm describes the equilibrium concentration of the adsorbate in the solid phase, which is statically bonded to the surface of the adsorbent, and in the liquid phase as a soluble component. The research was conducted at a constant temperature throughout the adsorption process. [80]. The findings of these models reveal the adsorbate molecules’ maximal adsorption capability. Following the sorption phenomena of ES-Y and ES-B molecules on CNFs surfaces, two major isotherm models incorporating Langmuir and Freundlich isotherms are presented here. Figure 7 depicts the adsorption characteristics of isotherm models for the ES-Y and ES-B molecule adsorption processes. The monolayer adsorption process is described by the Langmuir model [81]. The adsorption process achieves equilibrium and ceases when the active surface sites of adsorbent molecules are saturated with adsorbate molecules. The Langmuir isotherm data validate the experiment results with regression coefficients of 0.995 and 0.998 for ES-Y and ES-B, respectively.
In addition, the Qmax value is slightly greater for ES-Y than ES-B, indicating that the number of CNFs active sites accessible for the adsorption process remains consistent. Freundlich’s experimental model is supplied and used on a heterogeneous adsorbent surface for the multilayer adsorption isotherm. The values of Kf and n indicate a greater affinity for adsorption, suggesting that the adsorption capacity and intensity are better. KF and n values computed from the intercept and slope of the plot are shown in Table 1. (Figure 7). Based on CNFs, the R2 values for ES-Y and ES-B are 0.951 and 0.941, respectively. The R2 of the Langmuir isotherm is determined to have the lowest values. The greater the value of n than one, the greater the affinity between the adsorbate molecules and active sites of adsorbent molecules based on chemisorption.
In addition, the Langmuir isotherm regression coefficients R2 are closer to one than those derived for the Freundlich isotherm. Therefore, the Langmuir isotherm model is more consistent with the experimental findings of ES-Y and ES-B adsorption on the surface of CNFs. According to the Langmuir equation, the maximum adsorption capacities of ES-Y and ES-B molecules by CNF surfaces at 298 °K are 168.634 and 165.017 mg/g. These findings indicate that CNFs effectively adsorb Es-Y and Es-B ions from an aqueous solution.

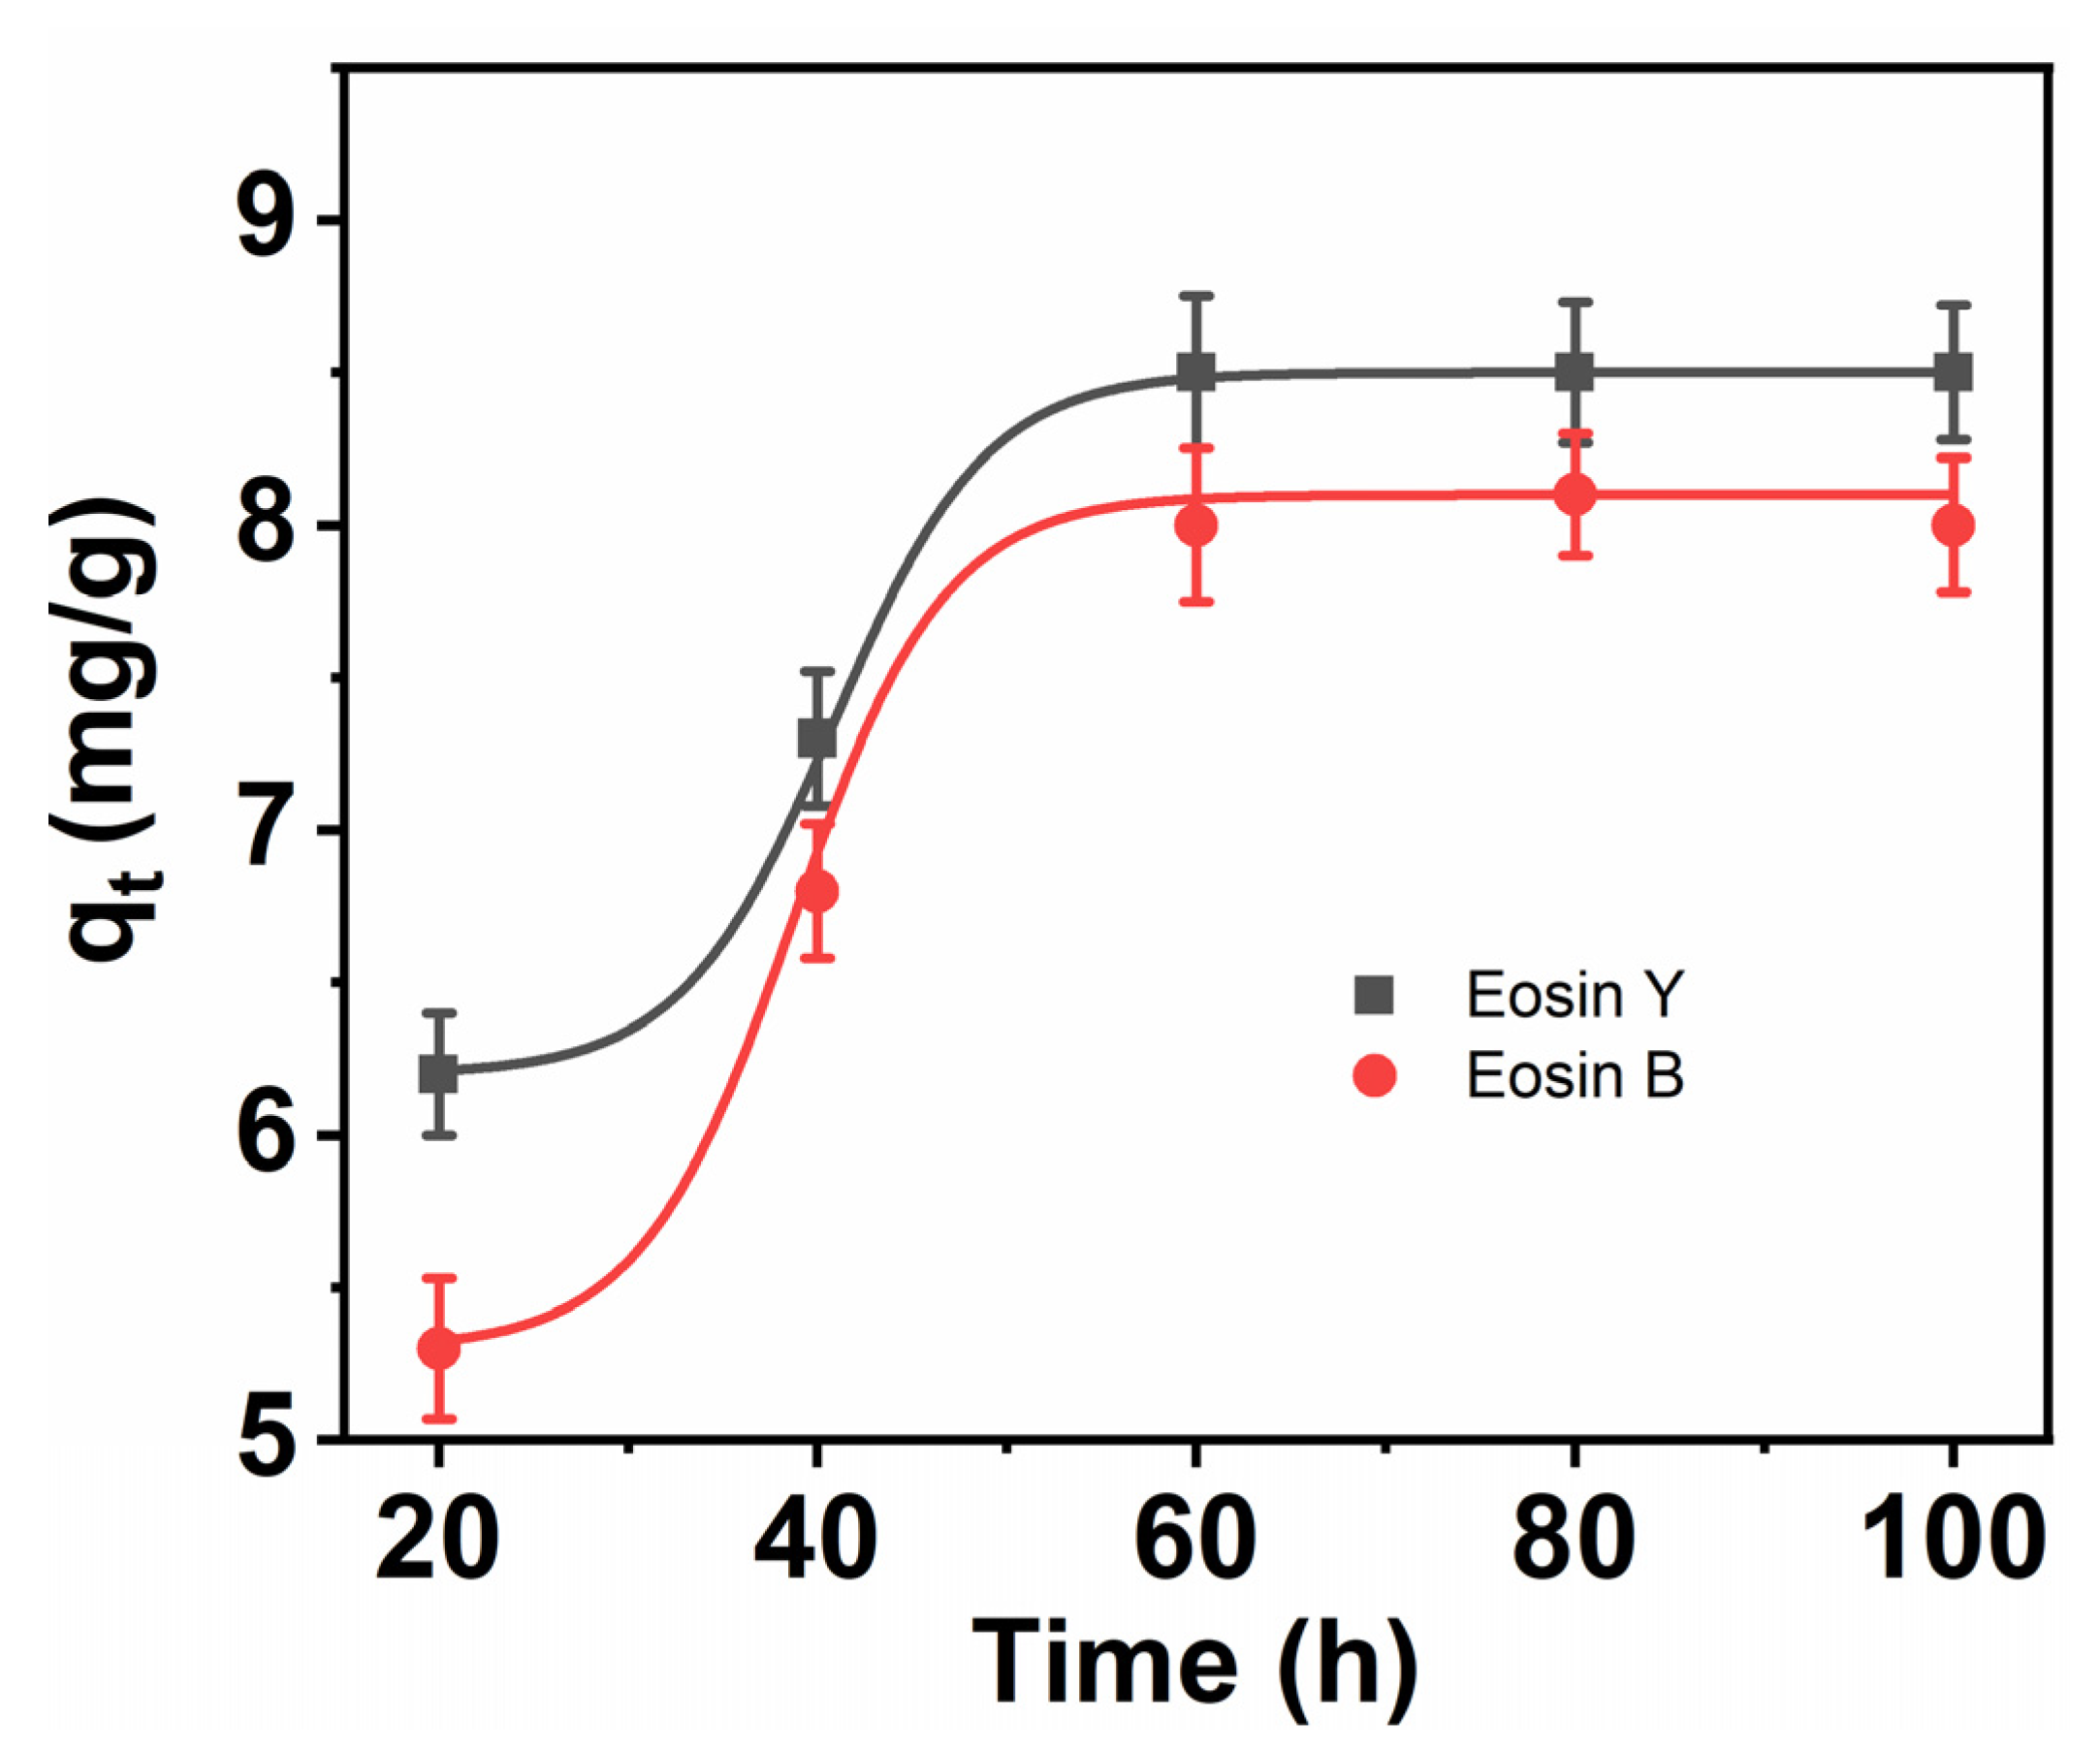
3.7. Kinetics of the Adsorption of ES-Y and ES-B onto CNFs

To identify the optimal mechanism and rate-determining step of ES-Y and ES-B molecule adsorption on CNFs surfaces, the influence of shaking duration on the adsorption process is examined (see Figure 8). In addition, the absorption of ES-Y and ES-B molecules on active sites of CNFs is commonly enhanced. After roughly twenty-four hours, the balance is reached. Figure 8 shows the interpretation of kinetic data using three distinct adsorption kinetic models, including pseudo-first order, pseudo-second order, and intra-particle diffusion based on the isotherm model, the rate of the adsorption process, which comprises the adsorption of ES-Y and ES-B molecules to the surface of the nanomaterials, was determined. Also explored are the performance and probable mechanism between ES-Y and ES-B molecules and CNFs adsorbent.

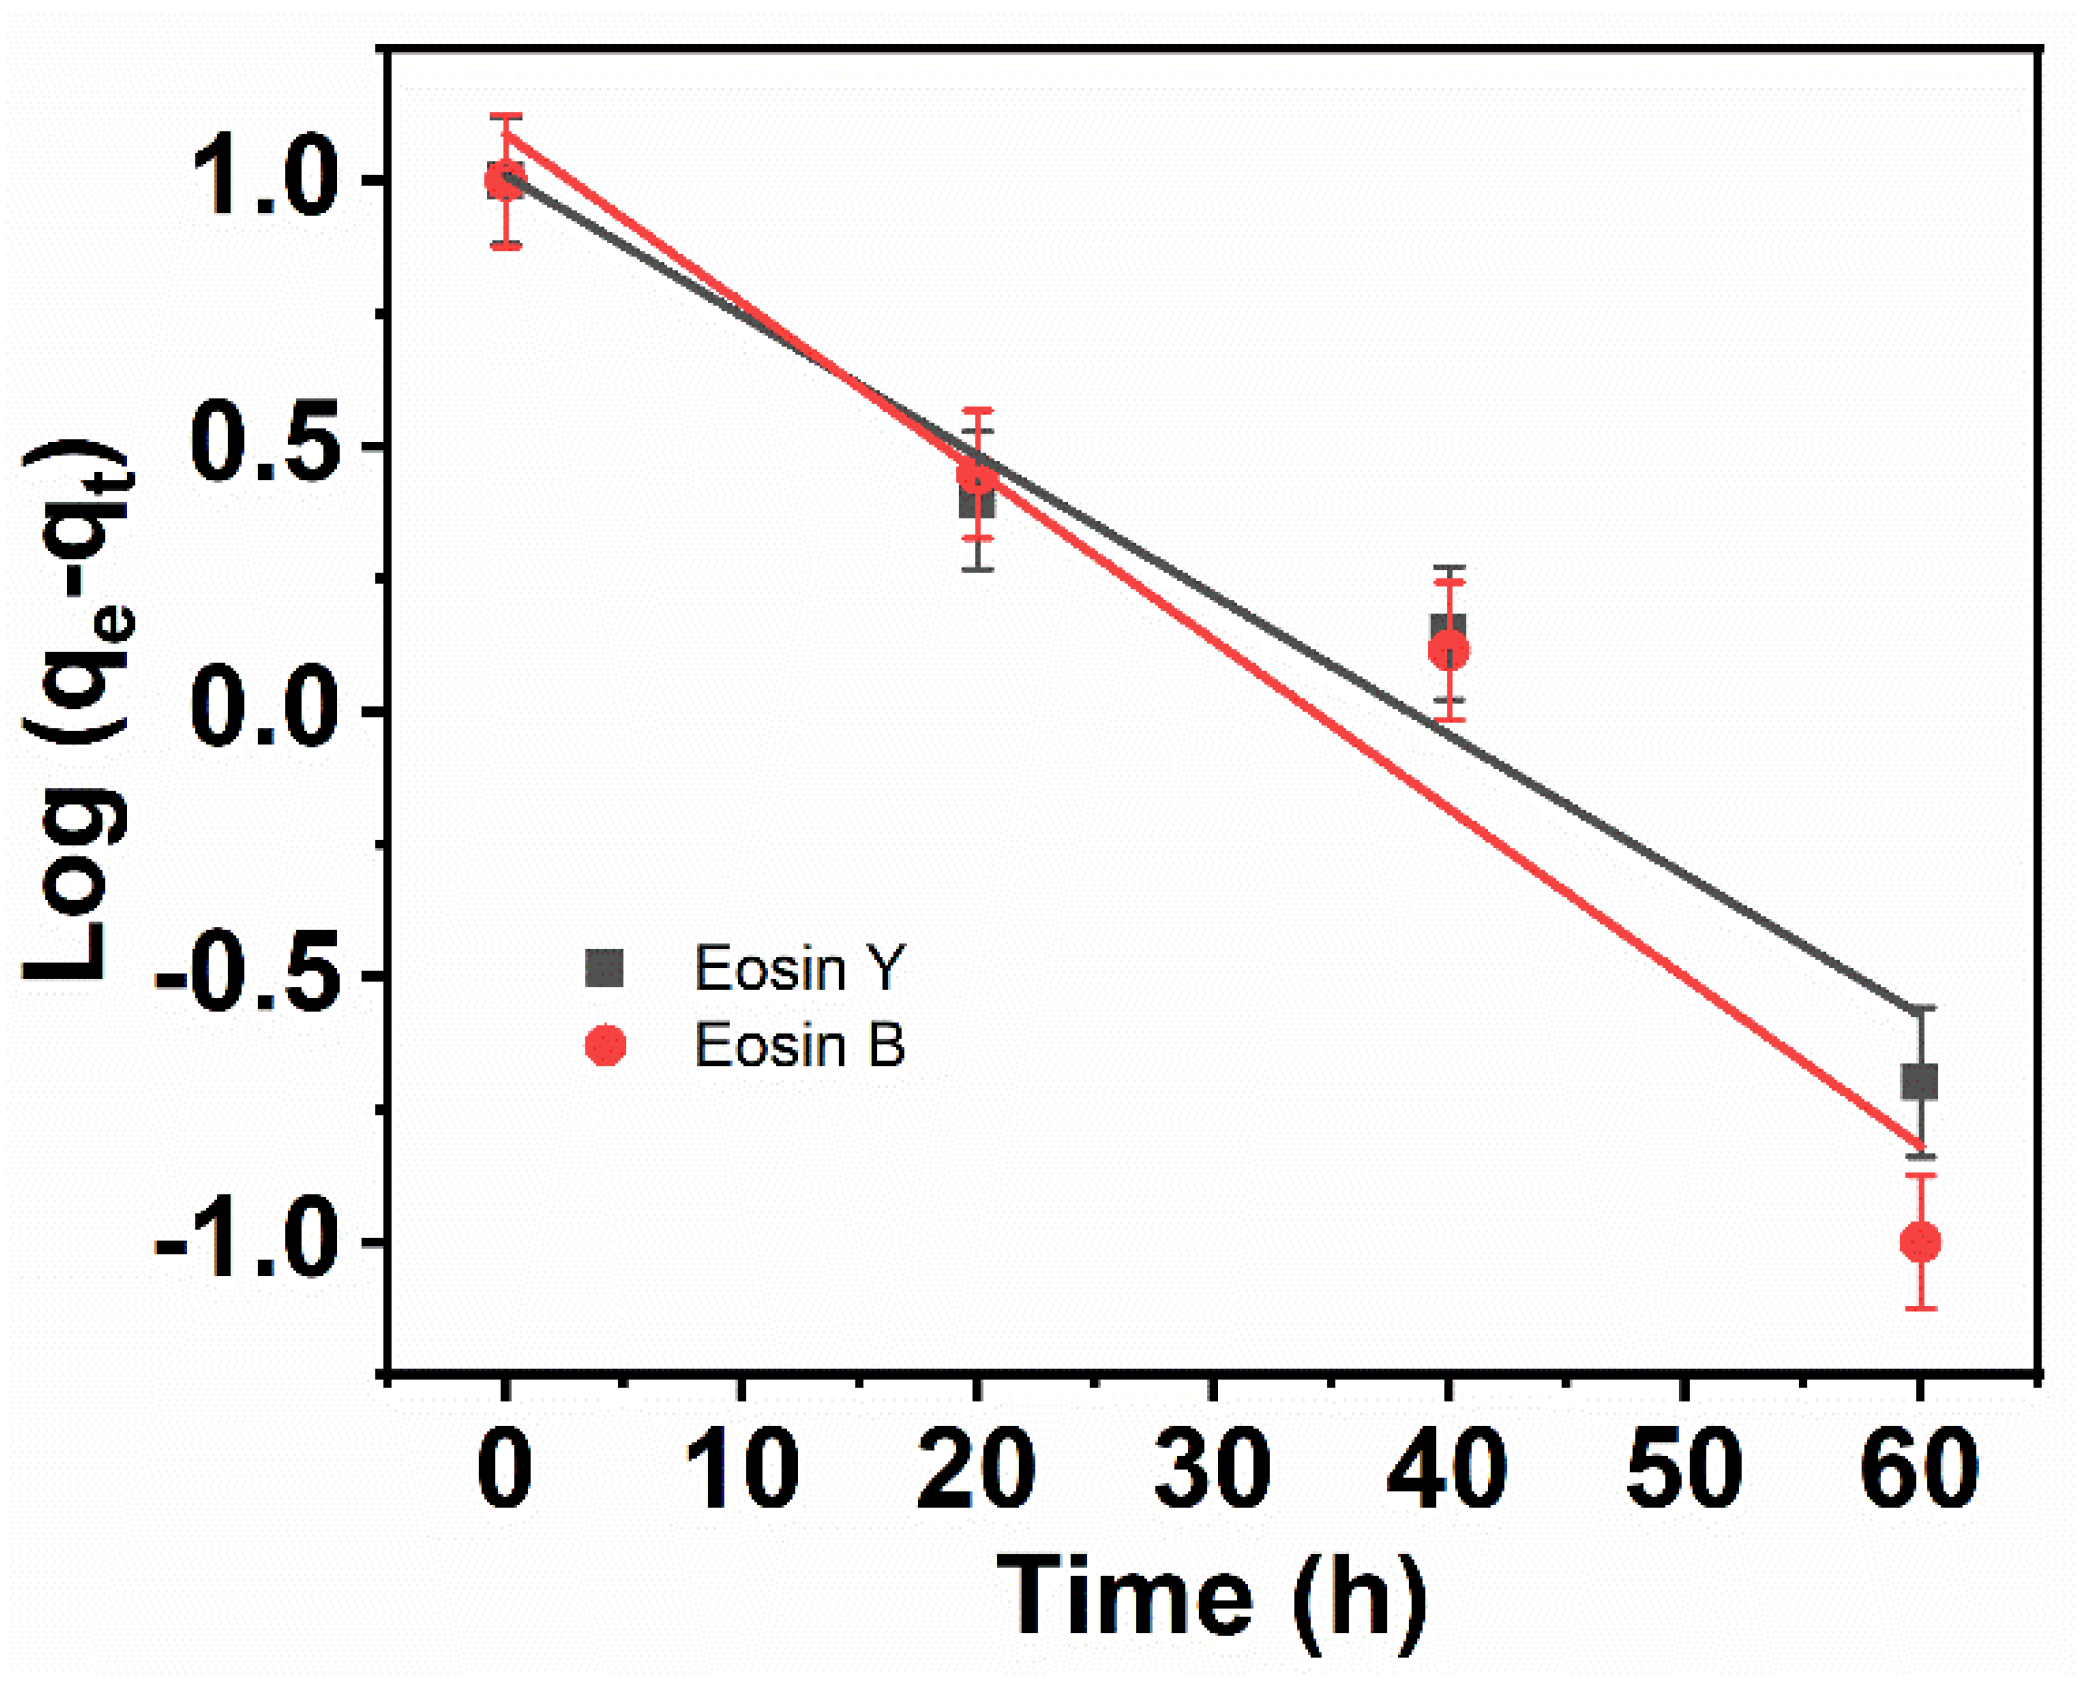
3.8. Pseudo-First Order

Equation (6) shows the pseudo-first-order [82]:
Log(qe − qt) = logqe − k1t
where
qe (mg g−1) = amount of ES-Y and ES-B adsorbed/wt of the CNFs at equilibrium and
qt (mg g−1) = adsorption capacity of ES-Y and ES-B at time t (min).
The rate constant of the pseudo-first-order was introduced as k1 (min−1). Figure 9 shows the linear plots of log (qe − qt) versus the time of the adsorption process (t).
Table 2 lists the values of the rate constants (K1) and the theoretical adsorption capacities (qe).

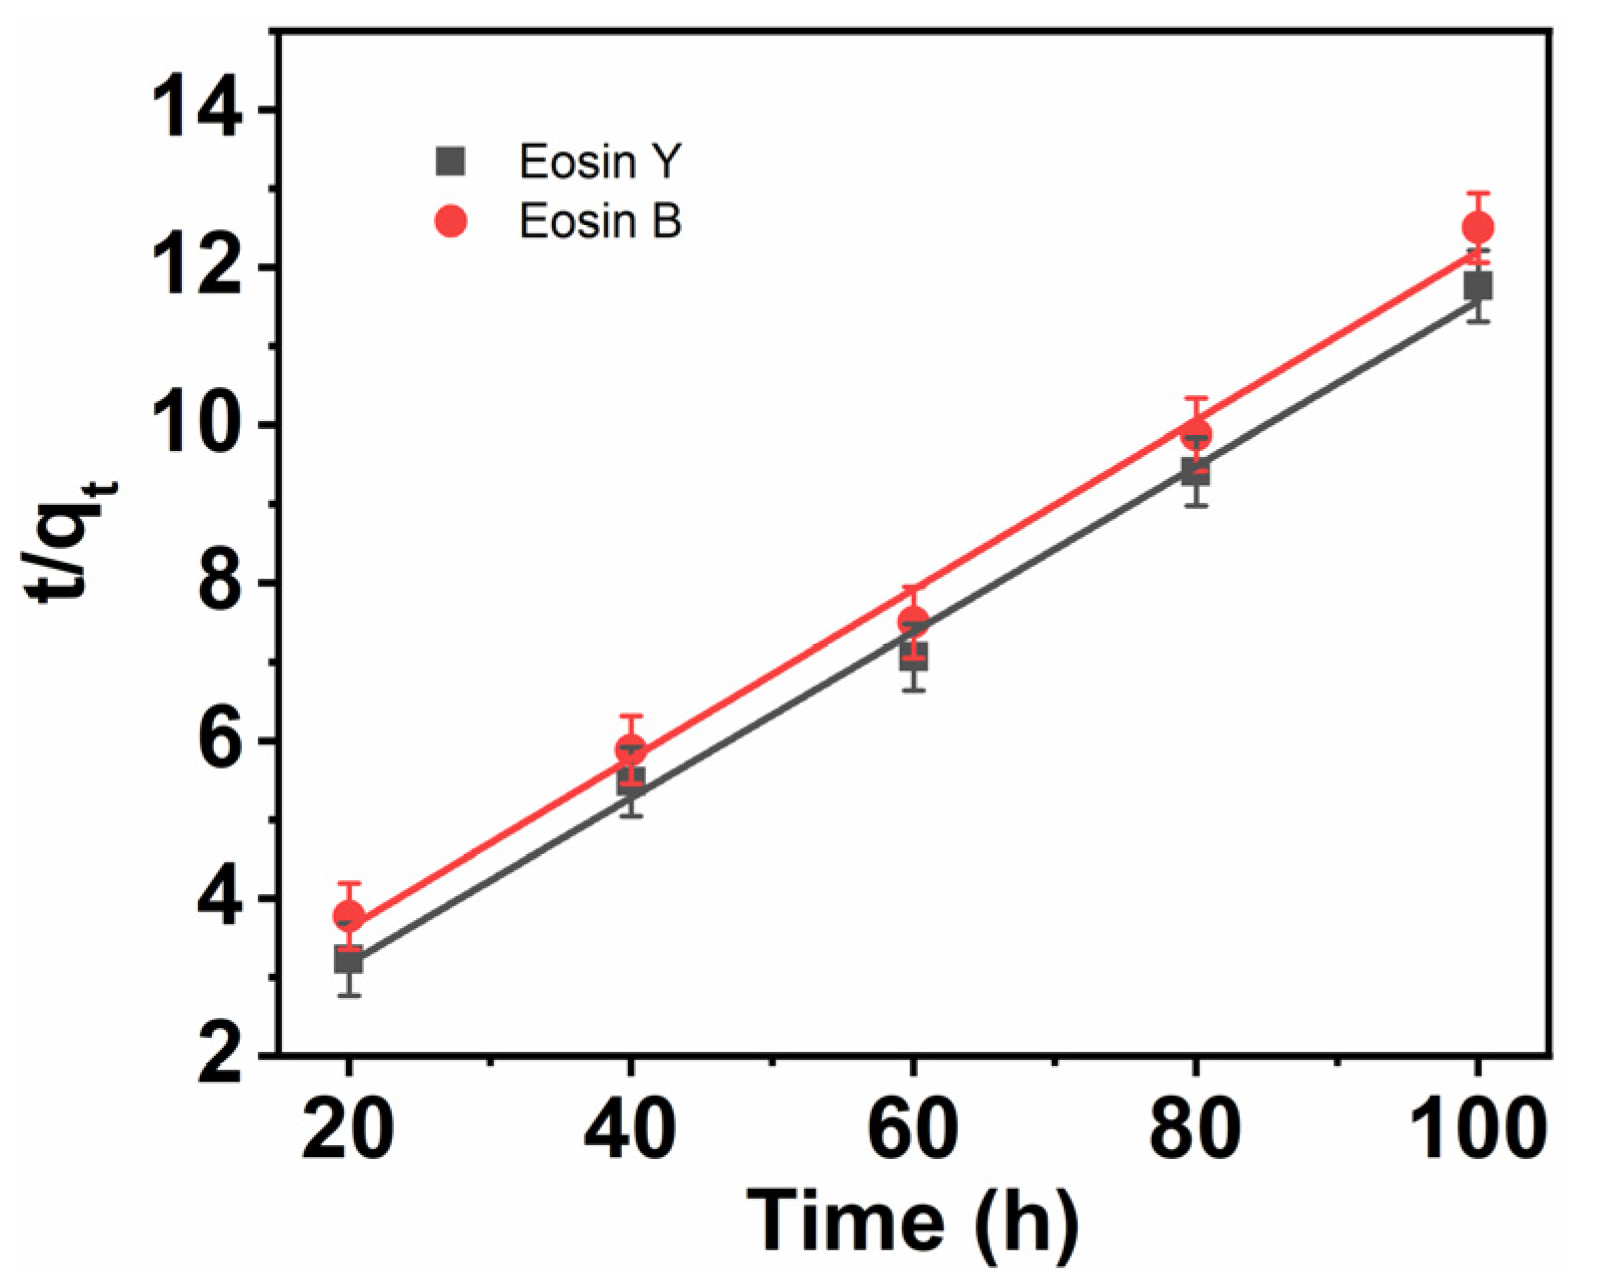
3.9. Pseudo-Second-Order Rate Model

Pseudo-second-order rate model is expressed as follows in Equation (7):
t/qt = 1/k2qe2 + t/qe
The pseudo-second-order rate constant k2 can be determined from the plot of t/q vs. time t for adsorption (g mg−1min−1). The plots of t/qt vs. time (t) produce straight lines whose slopes and intercepts are proportional to the pseudo-second-order rate constants (k2) and the maximal adsorption capacities (qe) and (qtheo), respectively. The data from Figure 9 and Figure 10 are mentioned in Table 2.
Table 2 lists the correlation coefficients (R2) for the adsorption capacities (qe) and theoretical capacities (qtheo) of the pseudo-first-order and pseudo-second-order models. The pseudo-second-order R2 is greater than the pseudo-first-order R2. In addition, the qe and qtheo values pertain to the outcomes of the adsorption trials. The second-order kinetics model represents the adsorption of ES-Y and ES-B molecules onto CNFs surfaces.

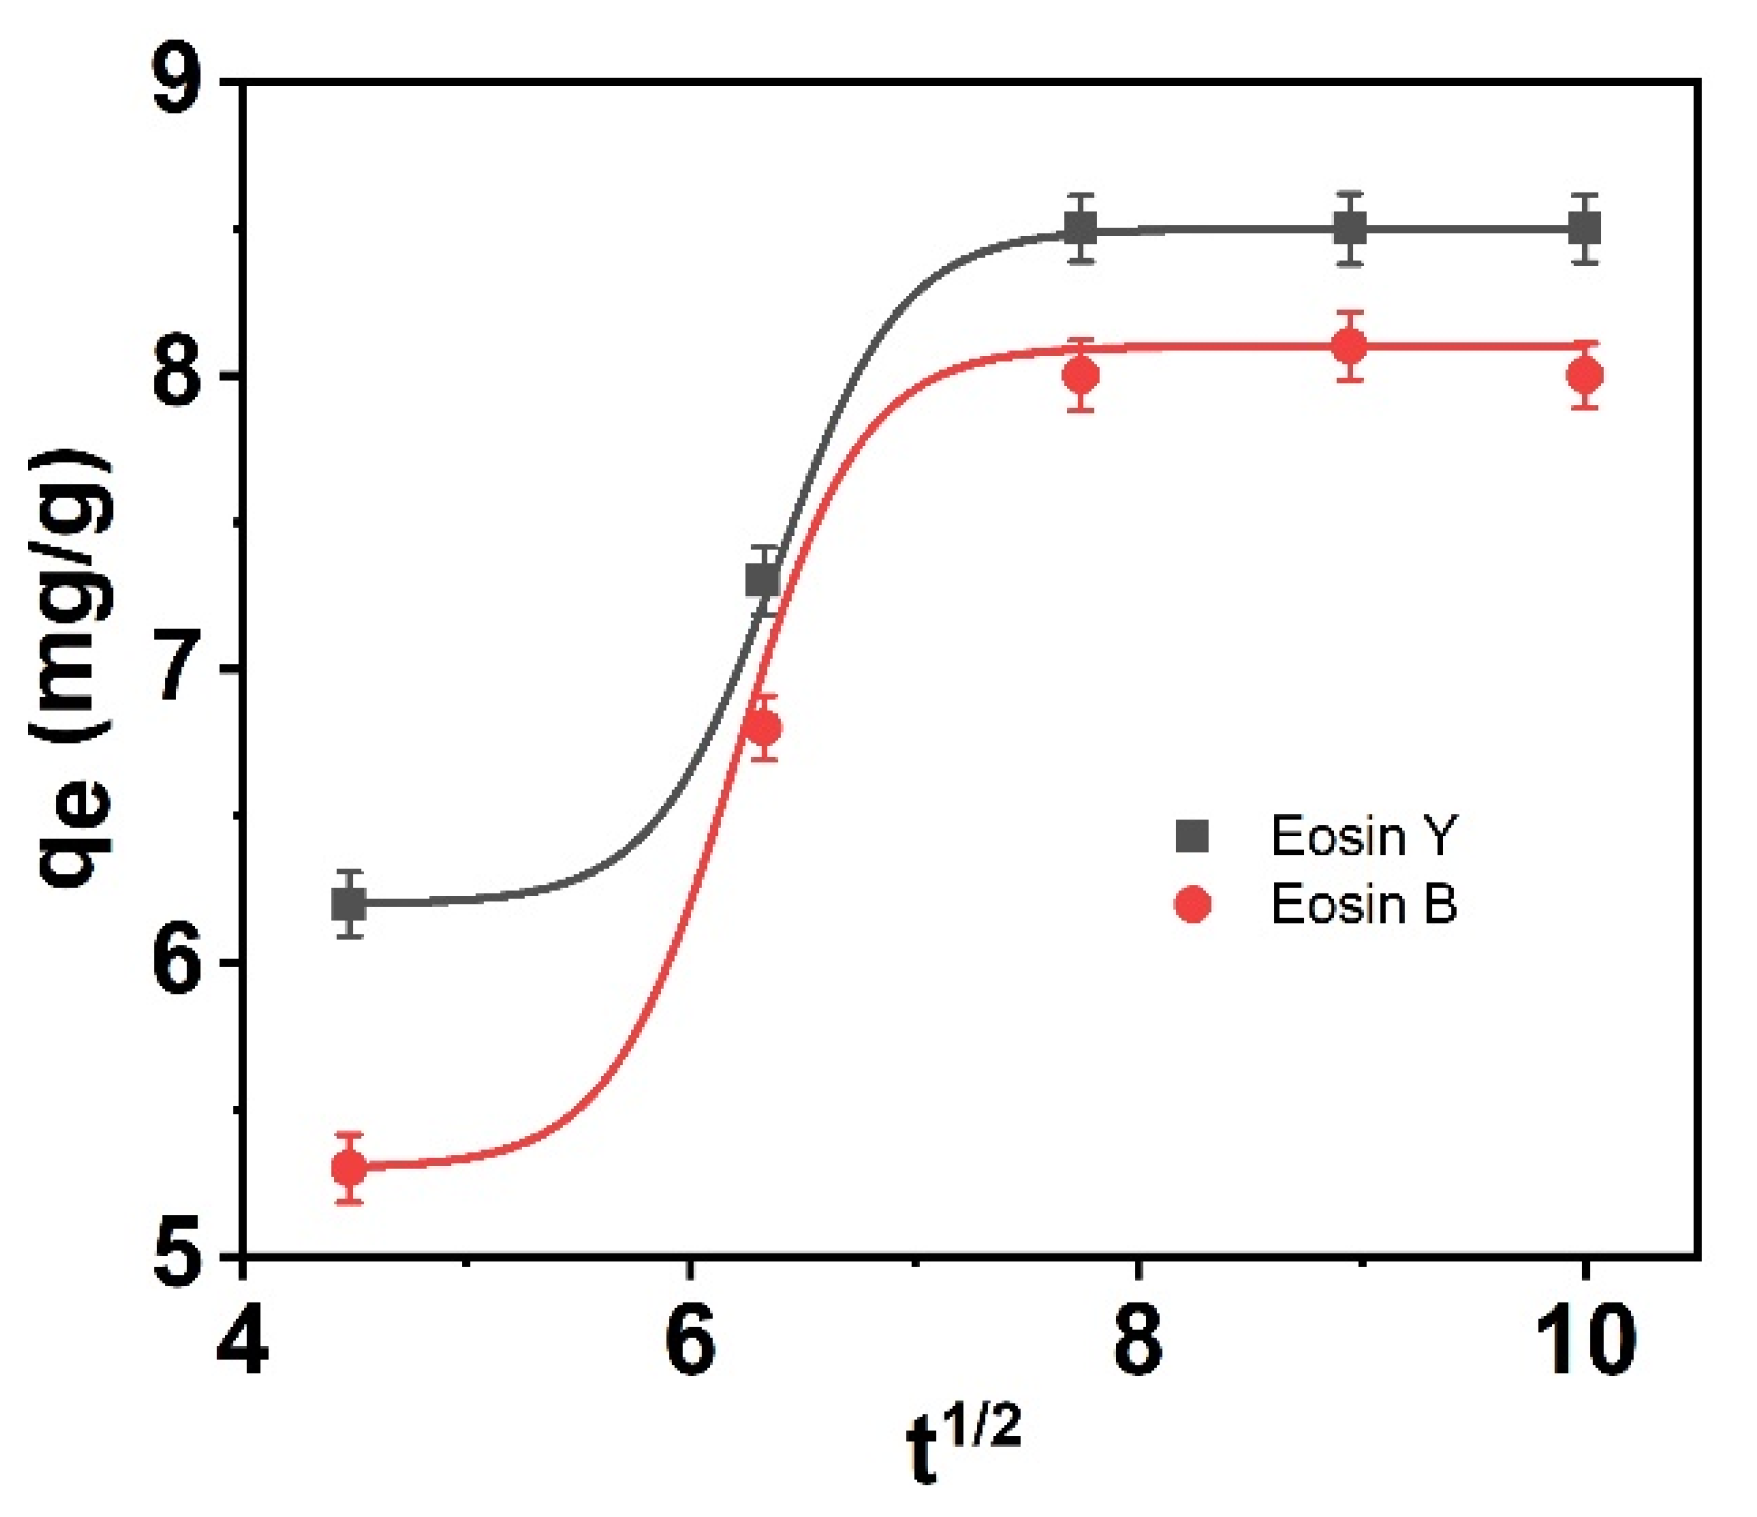
3.10. The Waber-Morris Model

This intra-particle diffusion model is used to investigate the adsorption mechanism of the ES-Y and ES-B molecules (adsorbate) to the surface of the CNFs. It detects the lowest step or the rate-determining step in the adsorption process. The intra-particle diffusion is shown as follows in Equation (8) [83]:
qe = kidt1/2 + C
where:
qe is the adsorption capacity (mg g−1), t is the time (min) of the adsorption process, kid (mg g−1 min−1/2) is the rate constant of the intra-particle diffusion (slope), and C is the thickness of the surface (intercept) respectively. As illustrated in Figure 11, the nonlinear plots of qe versus t1/2 are comprised of two stages. Firstly, the ES-Y and ES-B molecules take part in the adsorption process on the surface of the adsorbent molecules. The next stage involves diffusion within the pore of adsorbent molecules. The plots show that the intra-particle distribution is not the principal rate-controlling step, and the adsorption of ES-Y and ES-B onto CNFs is not easy to express using available isotherm models.

4. Conclusions

The conclusion of this project has revealed the synthesis of CNFs from palm wastes. In an aqueous solution, the CNFs display intriguing adsorption behaviors for ES-Y and ES-B. The adsorption of ES-Y and ES-B by CNFs is similarly dependent on the adsorbent dose, contact duration, and starting dye concentration. The results of this work have proven that CNFs may be produced from palm wastes. Langmuir’s isotherms and Freundlich’s isotherms were used to find where the eosin colors stick to the CNFs. The Langmuir isotherm model is mostly about how things work in the real world. The results of adsorption dynamics can be explained by three different models: pseudo-first-order, pseudo-second-order, and intra-particle diffusion. The results show the pseudo-second-order kinetic model for how adsorption happens on the surface of CNFs. Finally, we introduced CNFs with great potential for dye removal. They are versatile for promising industrial applications due to their high surface area-to-volume ratio, nanoscale diameter, and surface properties.

Author Contributions

Conceptualization, F.M.A., W.A.E.-S., A.M.Y. and S.M.S.; methodology, S.M.S., A.E.A.E.A. and A.M.Y.; software, Y.E.-G. and S.M.S.; validation, S.M.S., W.A.E.-S., F.M.A., A.E.A.E.A. and S.M.S.; formal analysis, Y.E.-G., A.M.Y. and F.M.A.; investigation, A.E.A.E.A., S.M.S. and W.A.E.-S.; resources, F.M.A., W.A.E.-S., Y.E.-G. and S.M.S.; data curation, Y.E.-G. and F.M.A.; writing-original draft preparation, S.M.S. and A.E.A.E.A.; writing-review and editing, S.M.S. and W.A.E.-S.; visualization, A.E.A.E.A., A.M.Y. and W.A.E.-S.; supervision, S.M.S. and F.M.A.; project administration, F.M.A. and S.M.S.; funding acquisition, F.M.A., W.A.E.-S. and S.M.S. All authors have read and agreed to the published version of the manuscript.

Funding

This research was funded by the Deputyship for Research & Innovation, Ministry of Education, and Saudi Arabia for funding this research work through the project number (QU-IF-1-1-4). The authors also thank the technical support of Qassim University.

Institutional Review Board Statement

Not applicable.

Informed Consent Statement

Not applicable.

Data Availability Statement

Not applicable.

Acknowledgments

The authors extend their appreciation to the Deputyship for Research & Innovation, Ministry of Education, and Saudi Arabia for funding this research work through the project number (QU-IF-1-1-4). The authors also thank the technical support of Qassim University.

Conflicts of Interest

The authors declare no conflict of interest.

References

  1. Husain, M.; Khan, R.A. Date Palm Crop Yield Estimation a Framework. Int. J. Innov. Res. Comput. Sci. Technol. 2019, 7, 2347–5552. [Google Scholar] [CrossRef]
  2. Khatib, M.; Al-Tamimi, A.; Cecchi, L.; Adessi, A.; Innocenti, M.; Balli, D.; Mulinacci, N. Phenolic compounds and polysaccharides in the date fruit (Phoenix dactylifera L.): Comparative study on five widely consumed Arabian varieties. Food Chem. 2022, 395, 133591. [Google Scholar] [CrossRef]
  3. Elsharawy, N.T.; AL-Mutarrafi, M.; Al-Ayafi, A. Different types of dates in Saudi Arabia and its most fungal spoilage and its most preservation methods. Int. J. Recent Sci. Res. 2019, 10, 35787–35799. [Google Scholar]
  4. Sukirno, S.; Husain, M.; Siswantoro, M.; Rasool, K.G.; Shaheen, F.A.; Salman, S.; Aldawood, A.S. Study on the Loss of Value of Khodari Date Fruit Infested by Almond Moth (Lepidoptera: Pyralidae). Fla. Èntomol. 2021, 103, 425–430. [Google Scholar] [CrossRef]
  5. Sen, K.Y.; Baidurah, S. Renewable biomass feedstocks for production of sustainable biodegradable polymer. Curr. Opin. Green Sustain. Chem. 2021, 27, 100412. [Google Scholar] [CrossRef]
  6. Ragab, T.I.M.; Alminderej, F.M.; El-Sayed, W.A.; Saleh, S.M.; Shalaby, A.S.G. Enhanced Optimization of Bioethanol Production from Palm Waste Using the Taguchi Method. Sustainability 2021, 13, 13660. [Google Scholar] [CrossRef]
  7. Rodriguez, L.E.; Bail, A.; Castillo, R.O.; Arízaga, G.G. Removal and Extraction of Carboxylic Acids and Non-ionic Compounds with Simple Hydroxides and Layered Double Hydroxides. Curr. Pharm. Des. 2020, 26, 650–663. [Google Scholar] [CrossRef] [PubMed]
  8. Antony, A.P.; Kunhiraman, S.; Abdulhameed, S. Bioprocessing with cashew apple and its by-products. In Valorisation of Agro-industrial Residues—Volume II: Non-Biological Approaches; Springer: Cham, Switzerland, 2020; pp. 83–106. [Google Scholar]
  9. Alminderej, F.M.; Hamden, Z.; El-Ghoul, Y.; Hammami, B.; Saleh, S.M.; Majdoub, H. Impact of Calcium and Nitrogen Addition on Bioethanol Production by S. cerevisiae Fermentation from Date By-Products: Physicochemical Characterization and Technical Design. Fermentation 2022, 8, 583. [Google Scholar] [CrossRef]
  10. Hoang, T.-D.; Nghiem, N. Recent Developments and Current Status of Commercial Production of Fuel Ethanol. Fermentation 2021, 7, 314. [Google Scholar] [CrossRef]
  11. Hamden, Z.; El-Ghoul, Y.; Alminderej, F.M.; Saleh, S.M.; Majdoub, H. High-Quality Bioethanol and Vinegar Production from Saudi Arabia Dates: Characterization and Evaluation of Their Value and Antioxidant Efficiency. Antioxidants 2022, 11, 1155. [Google Scholar] [CrossRef]
  12. Sharma, D.; Saini, A. Lignocellulosic Ethanol Production from a Biorefinery Perspective; Springer: Singapore, 2020. [Google Scholar] [CrossRef]
  13. Liu, J.; Shao, M.; Chen, X.; Yu, W.; Liu, X.; Qian, Y. Large-Scale Synthesis of Carbon Nanotubes by an Ethanol Thermal Reduction Process. J. Am. Chem. Soc. 2003, 125, 8088–8089. [Google Scholar] [CrossRef]
  14. Cai, Z.-X.; Liu, C.-C.; Wu, G.-H.; Chen, X.-M.; Chen, X. Palladium nanoparticles deposit on multi-walled carbon nanotubes and their catalytic applications for electrooxidation of ethanol and glucose. Electrochim. Acta 2013, 112, 756–762. [Google Scholar] [CrossRef]
  15. Shang, Z.; Hossain, M.; Wycisk, R.; Pintauro, P.N. Poly(phenylene sulfonic acid)-expanded polytetrafluoroethylene composite membrane for low relative humidity operation in hydrogen fuel cells. J. Power Sources 2022, 535, 231375. [Google Scholar] [CrossRef]
  16. Ayad, M.M.; El-Nasr, A.A. Adsorption of cationic dye (methylene blue) from water using polyaniline nanotubes base. J. Phys. Chem. C 2010, 114, 14377–14383. [Google Scholar] [CrossRef]
  17. Gilani, H.G.; Gilani, A.G.; Sangashekan, M. Tie-line data for the aqueous solutions of phenol with organic solvents at T=298.2K. J. Chem. Thermodyn. 2013, 58, 142–148. [Google Scholar] [CrossRef]
  18. Chavan, R.B. Health and environmental hazards of synthetic dyes. Textile Review Magazine, 15 May 2013. pp. 12–17.
  19. Rangabhashiyam, S.; Anu, N.; Selvaraju, N. Sequestration of dye from textile industry wastewater using agricultural waste products as adsorbents. J. Environ. Chem. Eng. 2013, 1, 629–641. [Google Scholar] [CrossRef]
  20. Tang, X.; Wu, Q.-Y.; Huang, H.; Hu, H.-Y.; Li, Q. Removal potential of anti-estrogenic activity in secondary effluents by coagulation. Chemosphere 2013, 93, 2562–2567. [Google Scholar] [CrossRef]
  21. Chen, J.; Hao, Y.; Liu, Y.; Gou, J. Magnetic graphene oxides as highly effective adsorbents for rapid removal of a cationic dye rhodamine B from aqueous solutions. RSC Adv. 2013, 3, 7254–7258. [Google Scholar] [CrossRef]
  22. Dong, S.; Wang, Y. Removal of acid red 88 by a magnetic graphene oxide/cationic hydrogel nanocomposite from aqueous solutions: Adsorption behavior and mechanism. RSC Adv. 2016, 6, 63922–63932. [Google Scholar] [CrossRef]
  23. Fakhri, A. Adsorption characteristics of graphene oxide as a solid adsorbent for aniline removal from aqueous solutions: Kinetics, thermodynamics and mechanism studies. J. Saudi Chem. Soc. 2017, 21, S52–S57. [Google Scholar] [CrossRef] [Green Version]
  24. Menk, J.D.J.; Nascimento, A.I.S.D.; Leite, F.G.; de Oliveira, R.A.; Jozala, A.F.; de Oliveira Junior, J.M.; Chaud, M.V.; Grotto, D. Biosorption of pharmaceutical products by mushroom stem waste. Chemosphere 2019, 237, 124515. [Google Scholar] [CrossRef]
  25. Sangashekan, M.; Asan, S.; Gilani, H.G. Investigation of Eosin B Removal from Aqueous Solution Employing Combined Graphene Oxide Adsorption and Zinc Oxide Coagulation Processes. Fibers Polym. 2019, 20, 1411–1417. [Google Scholar] [CrossRef]
  26. El-Nagar, D.A.; Massoud, S.A.; Ismail, S.H. Removal of some heavy metals and fungicides from aqueous solutions using nano-hydroxyapatite, nano-bentonite and nanocomposite. Arab. J. Chem. 2020, 13, 7695–7706. [Google Scholar] [CrossRef]
  27. Molla, A.; Li, Y.; Mandal, B.; Kang, S.G.; Hur, S.H.; Chung, J.S. Selective adsorption of organic dyes on graphene oxide: Theoretical and experimental analysis. Appl. Surf. Sci. 2019, 464, 170–177. [Google Scholar] [CrossRef]
  28. Crini, G.; Lichtfouse, E.; Wilson, L.D.; Morin-Crini, N. Conventional and non-conventional adsorbents for wastewater treatment. Environ. Chem. Lett. 2019, 17, 195–213. [Google Scholar] [CrossRef]
  29. Wang, X.; Jiang, C.; Hou, B.; Wang, Y.; Hao, C.; Wu, J. Carbon composite lignin-based adsorbents for the adsorption of dyes. Chemosphere 2018, 206, 587–596. [Google Scholar] [CrossRef]
  30. Liu, Y.; Chen, Y.; Shi, Y.; Wan, D.; Chen, J.; Xiao, S. Adsorption of toxic dye Eosin Y from aqueous solution by clay/carbon composite derived from spent bleaching earth. Water Environ. Res. 2021, 93, 159–169. [Google Scholar] [CrossRef]
  31. Jackson, L.S. Chemical Food Safety Issues in the United States: Past, Present, and Future. J. Agric. Food Chem. 2009, 57, 8161–8170. [Google Scholar] [CrossRef]
  32. Liang, J.; Deng, X.; Tan, K. An eosin Y-based “turn-on” fluorescent sensor for detection of perfluorooctane sulfonate. Spectrochim. Acta Part A Mol. Biomol. Spectrosc. 2015, 150, 772–777. [Google Scholar] [CrossRef]
  33. Wallig, M.A.; Bolon, B.; Haschek, W.M.; Rousseaux, C.G. (Eds.) Fundamentals of Toxicologic Pathology; Academic Press: Cambridge, MA, USA, 2017. [Google Scholar]
  34. Pavlidis, M.; Stupp, T.; Naskar, R.; Cengiz, C.; Thanos, S. Retinal Ganglion Cells Resistant to Advanced Glaucoma: A Postmortem Study of Human Retinas with the Carbocyanine Dye DiI. Investig. Opthalmol. Vis. Sci. 2003, 44, 5196–5205. [Google Scholar] [CrossRef] [Green Version]
  35. Sasaki, Y.F.; Kawaguchi, S.; Kamaya, A.; Ohshita, M.; Kabasawa, K.; Iwama, K.; Taniguchi, K.; Tsuda, S. The comet assay with 8 mouse organs: Results with 39 currently used food additives. Mutat. Res. Toxicol. Environ. Mutagen. 2002, 519, 103–119. [Google Scholar] [CrossRef]
  36. Sun, J.D.; Henderson, R.F.; Marshall, T.C.; Cheng, Y.S.; Dutcher, J.S.; Pickrell, J.A.; Mauderly, J.L.; Hahn, F.F.; Banas, D.A.; Seiler, F.A.; et al. The inhalation toxicity of two commercial dyes: Solvent yellow 33 and solvent green 3. Fundam. Appl. Toxicol. 1987, 8, 358–371. [Google Scholar] [CrossRef]
  37. Hernández, A.F.; Tsatsakis, A.M. Human exposure to chemical mixtures: Challenges for the integration of toxicology with epidemiology data in risk assessment. Food Chem. Toxicol. 2017, 103, 188–193. [Google Scholar] [CrossRef]
  38. Mittal, A.; Jhare, D.; Mittal, J. Adsorption of hazardous dye Eosin Yellow from aqueous solution onto waste material De-oiled Soya: Isotherm, kinetics and bulk removal. J. Mol. Liq. 2013, 179, 133–140. [Google Scholar] [CrossRef]
  39. Özcan, A.; Oturan, M.A.; Oturan, N.; Şahin, Y. Removal of Acid Orange 7 from water by electrochemically generated Fenton’s reagent. J. Hazard. Mater. 2009, 163, 1213–1220. [Google Scholar] [CrossRef] [PubMed]
  40. Albadri, A.E.; Aissa, M.A.B.; Modwi, A.; Saleh, S.M. Synthesis of Mesoporous Ru-ZnO@ g-C3N4 Nanoparticles and Their Photocatalytic Activity for Methylene Blue Degradation. Water 2023, 15, 481. [Google Scholar] [CrossRef]
  41. Saleh, S.M.; Albadri, A.E.; Aissa, M.A.B.; Modwi, A. Fabrication of Mesoporous V2O5@ g-C3N4 Nanocomposite as Photocatalyst for Dye Degradation. Crystals 2022, 12, 1766. [Google Scholar] [CrossRef]
  42. Ighalo, J.O.; Adeniyi, A.G. A comprehensive review of water quality monitoring and assessment in Nigeria. Chemosphere 2020, 260, 127569. [Google Scholar] [CrossRef]
  43. Hubbard, A.T. Encyclopedia of Surface and Colloid Science; CRC Press: Boca Raton, FL, USA, 2002; Volume 1. [Google Scholar]
  44. Uluozlu, O.D.; Sari, A.; Tuzen, M.; Soylak, M. Biosorption of Pb(II) and Cr(III) from aqueous solution by lichen (Parmelina tiliaceae) biomass. Bioresour. Technol. 2008, 99, 2972–2980. [Google Scholar] [CrossRef]
  45. Wang, Y.; Lin, C.; Wang, Z.; Chen, Z.; Chen, J.; Chen, Y.; Liu, S.; Fu, J. Magnetic hollow poly (cyclotriphosphazene-co-4, 4′-sulfonyldiphenol)-Fe3O4 hybrid nanocapsules for adsorbing Safranine T and catalytic oxidation of 3, 3′, 5, 5′-tetramethylbenzidine. J. Colloid Interface Sci. 2019, 556, 278–291. [Google Scholar] [CrossRef]
  46. Mahdavi, R.; Talesh, S.S.A. Enhancement of ultrasound-assisted degradation of Eosin B in the presence of nanoparticles of ZnO as sonocatalyst. Ultrason. Sonochem. 2019, 51, 230–240. [Google Scholar] [CrossRef]
  47. Mohamed, R.M.; McKinney, D.L.; Sigmund, W.M. Enhanced nanocatalysts. Mater. Sci. Eng. R Rep. 2012, 73, 1–13. [Google Scholar] [CrossRef]
  48. Mokhlesi, B.; Leikin, J.B.; Murray, P.; Corbridge, T.C. Adult toxicology in critical carea: Part II: Specific poisonings. Chest 2003, 123, 897–922. [Google Scholar] [CrossRef] [PubMed] [Green Version]
  49. Jamshidi, M.; Ghaedi, M.; Dashtian, K.; Ghaedi, A.; Hajati, S.; Goudarzi, A.; Alipanahpour, E. Highly efficient simultaneous ultrasonic assisted adsorption of brilliant green and eosin B onto ZnS nanoparticles loaded activated carbon: Artificial neural network modeling and central composite design optimization. Spectrochim. Acta Part A Mol. Biomol. Spectrosc. 2016, 153, 257–267. [Google Scholar] [CrossRef]
  50. Ghaedi, M.; Ansari, A.; Nejad, P.A.; Ghaedi, A.; Vafaei, A.; Habibi, M.H. Artificial neural network and Bees Algorithm for removal of Eosin B using Cobalt Oxide Nanoparticle-activated carbon: Isotherm and Kinetics study. Environ. Prog. Sustain. Energy 2015, 34, 155–168. [Google Scholar] [CrossRef]
  51. Yu, H.; Fugetsu, B. A novel adsorbent obtained by inserting carbon nanotubes into cavities of diatomite and applications for organic dye elimination from contaminated water. J. Hazard. Mater. 2010, 177, 138–145. [Google Scholar] [CrossRef] [PubMed] [Green Version]
  52. Liu, F.; Chung, S.; Oh, G.; Seo, T.S. Three-Dimensional Graphene Oxide Nanostructure for Fast and Efficient Water-Soluble Dye Removal. ACS Appl. Mater. Interfaces 2012, 4, 922–927. [Google Scholar] [CrossRef]
  53. Robati, D.; Rajabi, M.; Moradi, O.; Najafi, F.; Tyagi, I.; Agarwal, S.; Gupta, V.K. Kinetics and thermodynamics of malachite green dye adsorption from aqueous solutions on graphene oxide and reduced graphene oxide. J. Mol. Liq. 2016, 214, 259–263. [Google Scholar] [CrossRef]
  54. Deng, J.-H.; Zhang, X.-R.; Zeng, G.-M.; Gong, J.-L.; Niu, Q.-Y.; Liang, J. Simultaneous removal of Cd(II) and ionic dyes from aqueous solution using magnetic graphene oxide nanocomposite as an adsorbent. Chem. Eng. J. 2013, 226, 189–200. [Google Scholar] [CrossRef]
  55. Eren, E.; Afsin, B. Investigation of a basic dye adsorption from aqueous solution onto raw and pre-treated bentonite surfaces. Dye. Pigment. 2008, 76, 220–225. [Google Scholar] [CrossRef]
  56. Janoš, P.; Buchtova, H.; Rýznarová, M. Sorption of dyes from aqueous solutions onto fly ash. Water Res. 2003, 37, 4938–4944. [Google Scholar] [CrossRef]
  57. Alminderej, F.M.; Younis, A.M.; Albadri, A.E.; El-Sayed, W.A.; El-Ghoul, Y.; Ali, R.; Mohamed, A.M.; Saleh, S.M. The superior adsorption capacity of phenol from aqueous solution using Modified Date Palm Nanomaterials: A performance and kinetic study. Arab. J. Chem. 2022, 15, 104120. [Google Scholar] [CrossRef]
  58. Sharma, Y.C. Uma Optimization of Parameters for Adsorption of Methylene Blue on a Low-Cost Activated Carbon. J. Chem. Eng. Data 2010, 55, 435–439. [Google Scholar] [CrossRef]
  59. Mittal, J.; Jhare, D.; Vardhan, H.; Mittal, A. Utilisation of bottom ash as a low-cost sorbent for the removal and recovery of a toxic halogen containing dye eosin yellow. Desalination Water Treat. 2014, 52, 4508–4519. [Google Scholar] [CrossRef]
  60. Başar, C.A. Applicability of the various adsorption models of three dyes adsorption onto activated carbon prepared waste apricot. J. Hazard. Mater. 2006, 135, 232–241. [Google Scholar] [CrossRef]
  61. Crini, G. Non-conventional low-cost adsorbents for dye removal: A review. Bioresour. Technol. 2006, 97, 1061–1085. [Google Scholar] [CrossRef]
  62. Sun, Q.; Yang, L. The adsorption of basic dyes from aqueous solution on modified peat–resin particle. Water Res. 2003, 37, 1535–1544. [Google Scholar] [CrossRef]
  63. Kumar, K.V.; Porkodi, K. Batch adsorber design for different solution volume/adsorbent mass ratios using the experimental equilibrium data with fixed solution volume/adsorbent mass ratio of malachite green onto orange peel. Dye. Pigment. 2007, 74, 590–594. [Google Scholar] [CrossRef]
  64. De Queiroz, G.A.; Rabelo, A.G.S.; de Melo Santos, S.K. Characterization and optimization of production process of alcoholic fermentation of pineapple. Rev. Eletrôn. Gest. Educ. Tecnol. Ambient. 2019, 23, e30. [Google Scholar] [CrossRef]
  65. Ismail, M.; Albadri, A.; Ben Aissa, M.A.; Modwi, A.; Saleh, S.M. High Poisonous Cd Ions Removal by Ru-ZnO-g-C3N4 Nanocomposite: Description and Adsorption Mechanism. Inorganics 2023, 11, 176. [Google Scholar] [CrossRef]
  66. Kashi, M.B.; Aghababazadeh, R.; Arabi, H.; Mirhabibi, A. In situ fabrication of carbon nanotube–MgAl2O4 nanocomposite powders through hydrogen-free CCVD. Adv. Powder Technol. 2014, 25, 250–254. [Google Scholar] [CrossRef]
  67. He, Y.; Nurul, S.; Schmitt, H.; Sutton, N.B.; Murk, T.A.; Blokland, M.H.; Rijnaarts, H.H.; Langenhoff, A.A. Evaluation of attenuation of pharmaceuticals, toxic potency, and antibiotic resistance genes in constructed wetlands treating wastewater effluents. Sci. Total. Environ. 2018, 631–632, 1572–1581. [Google Scholar] [CrossRef]
  68. Kumar, N.; Min, K. Removal of phenolic compounds from aqueous solutions by iosorption onto Acacia leucocephala bark powder: Equilibrium and kinetic studies. J. Chil. Chem. Soc. 2011, 56, 539–545. [Google Scholar] [CrossRef] [Green Version]
  69. Younis, A.M.; Nafea, E.M.A.; Mosleh, Y.Y.I.; Hefnawy, M.S. Low-cost biosorbent (Lemnagibba L.) for the removal of phenol from aqueous media. J. Mediterr. Ecol. 2016, 14, 55–62. [Google Scholar]
  70. Yapar, S.; Ozbudak, V.; Dias, A.; Lopes, A. Effect of adsorbent concentration to the adsorption of phenol on hexadecyl trimethyl ammonium-bentonite. J. Hazard. Mater. 2005, 121, 135–139. [Google Scholar] [CrossRef]
  71. Moyo, M.; Mutare, E.; Chigondo, F.; Nyamunda, B.C. Removal of phenol from aqueous solution by adsorption on yeast, saccharomyces cerevisiae. Int. J. Recent Res. Appl. Stud. 2012, 11, 486–494. [Google Scholar]
  72. Younis, A.M.; Nafea, E.M.A. Heavy metals and nutritional composition of some naturally growing aquatic macrophytes of Northern Egyptian Lakes. J. Biodivers. Environ. Sci. 2015, 6, 16–23. [Google Scholar]
  73. Saleh, S.; Younis, A.; Ali, R.; Elkady, E. Phenol removal from aqueous solution using amino modified silica nanoparticles. Korean J. Chem. Eng. 2019, 36, 529–539. [Google Scholar] [CrossRef]
  74. Vasudevan, D.; Bruland, G.L.; Torrance, B.S.; Upchurch, V.G.; MacKay, A.A. pH-dependent ciprofloxacin sorption to soils: Interaction mechanisms and soil factors influencing sorption. Geoderma 2009, 151, 68–76. [Google Scholar] [CrossRef]
  75. Ji, L.; Chen, W.; Zheng, S.; Xu, Z.; Zhu, D. Adsorption of Sulfonamide Antibiotics to Multiwalled Carbon Nanotubes. Langmuir 2009, 25, 11608–11613. [Google Scholar] [CrossRef]
  76. Wang, Z.; Yu, X.; Pan, B.; Xing, B. Norfloxacin Sorption and Its Thermodynamics on Surface-Modified Carbon Nanotubes. Environ. Sci. Technol. 2009, 44, 978–984. [Google Scholar] [CrossRef] [PubMed]
  77. Chen, W.; Duan, L.; Wang, L.; Zhu, D. Adsorption of Hydroxyl- and Amino-Substituted Aromatics to Carbon Nanotubes. Environ. Sci. Technol. 2008, 42, 6862–6868. [Google Scholar] [CrossRef] [PubMed]
  78. Zhang, D.; Pan, B.; Wu, M.; Wang, B.; Zhang, H.; Peng, H.; Wu, D.; Ning, P. Adsorption of sulfamethoxazole on functionalized carbon nanotubes as affected by cations and anions. Environ. Pollut. 2011, 159, 2616–2621. [Google Scholar] [CrossRef] [PubMed]
  79. Wang, S.; Li, Y.; Fan, X.; Zhang, F.; Zhang, G. β-cyclodextrin functionalized graphene oxide: An efficient and recyclable adsorbent for the removal of dye pollutants. Front. Chem. Sci. Eng. 2015, 9, 77–83. [Google Scholar] [CrossRef]
  80. Younis, A.M.; Elkady, E.M.; Saleh, S.M. Novel eco-friendly amino-modified nanoparticles for phenol removal from aqueous solution. Environ. Sci. Pollut. Res. 2020, 27, 30694–30705. [Google Scholar] [CrossRef]
  81. Ben Aissa, M.A.; Modwi, A.; Albadri, A.E.; Saleh, S.M. Dependency of Crystal Violet Dye Removal Behaviors onto Mesoporous V2O5-g-C3N4 Constructed by Simplistic Ultrasonic Method. Inorganics 2023, 11, 146. [Google Scholar] [CrossRef]
  82. Smiciklas, I.; Onjia, A.; Raičević, S.; Janaćković, Đ.; Mitrić, M. Factors influencing the removal of divalent cations by hydroxyapatite. J. Hazard. Mater. 2008, 152, 876–884. [Google Scholar] [CrossRef]
  83. Singh, S.K.; Townsend, T.G.; Mazyck, D.; Boyer, T.H. Equilibrium and intra-particle diffusion of stabilized landfill leachate onto micro- and meso-porous activated carbon. Water Res. 2012, 46, 491–499. [Google Scholar] [CrossRef]
Scheme 1. Synthesis of CNFs for dyes removal.
Sustainability 15 10451 sch001
Figure 1. (a,b) SEM images of CNFs with different scale 10 and 5 μm; and (c) Fourier transform infrared spectra of CNFs.
Sustainability 15 10451 g001
Figure 2. XRD patterns of the CNFs.
Sustainability 15 10451 g002
Figure 3. Effect of CNFs dose on the percentage removal of ES-Y and ES-B from solution.
Sustainability 15 10451 g003
Figure 4. Effect of contact time on the removal efficiency of ES-Y and ES-B by CNFs.
Sustainability 15 10451 g004
Figure 5. Effect of the initial ES-Y and ES-B concentrations onto CNFs adsorption efficiency.
Sustainability 15 10451 g005
Figure 6. Effect of initial pH on the ES-Y and ES-B removal efficiency from aqueous solution.
Sustainability 15 10451 g006
Figure 7. Langmuir and Freundlich isotherm models of the adsorption processes of ES-Y and ES-B dyes onto CNFs.
Sustainability 15 10451 g007
Figure 8. Shaking time effect of the ES-Y and ES-B adsorption process on the surface of CNFs.
Sustainability 15 10451 g008
Figure 9. The pseudo-first order results for the adsorption process of ES-Y and ES-B molecules on CNFs surface were obtained at a time (T).
Sustainability 15 10451 g009
Figure 10. The pseudo-second-order kinetic model was used for the adsorption process of ES-Y and ES-B molecules on the surface of CNFs at a time (T).
Sustainability 15 10451 g010
Figure 11. The Waber-Morris model for the adsorption process of ES-Y and ES-B molecules on the surface of CNFs at a time (T1/2).
Sustainability 15 10451 g011
Table 1. Parameters of Langmuir and Freundlich adsorption isotherm models.
Adsorbent.LangmuirFreundlich
Qmax (mg/g)KL (L/mg)R2nKFR2
ES-Y168.6340.03230.9951.744910.37670.951
ES-B165.0170.02090.9981.68998.300010.941
Table 2. Pseudo-first-order and pseudo-second-order models using CNFs.
CNFsExperimental
Value
qe (mg g−1)
First-OrderSecond-Order
K1qeR2K2qeR2
ES-Y9.20.026410.2420.9700.01029.52470.994
ES-B9.10.031812.2420.9580.00779.33270.991
Disclaimer/Publisher’s Note: The statements, opinions and data contained in all publications are solely those of the individual author(s) and contributor(s) and not of MDPI and/or the editor(s). MDPI and/or the editor(s) disclaim responsibility for any injury to people or property resulting from any ideas, methods, instructions or products referred to in the content.

