
Improving Wheat Yield and Water-Use Efficiency by Optimizing Irrigations in Northern China
Abstract
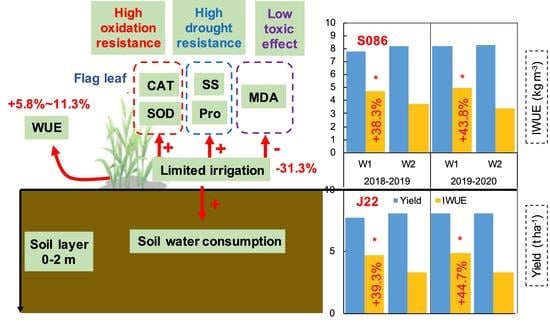
:
1. Introduction
2. Materials and Methods
2.1. Experiment Area
2.2. Experimental Design
2.3. Data Collection and Calculation
2.3.1. Crop Yield
2.3.2. Soil-Water-Holding Consumption and Water-Use Efficiency
2.3.3. Plant Nitrogen Uptake and Utilization
2.3.4. Physiological Factors of the Flag Leaf
2.4. Statistical Analysis
3. Results
3.1. Crop Water Consumption
3.2. Soil-Water-Holding Consumption
3.3. Dynamics of the Physiological Factors of Flag Leaves
3.4. Crop Yield
3.5. Crop-Water-Use Efficiency
3.6. Combined Effects of Irrigation and Water Consumption on Grain Yield and Water Productivity
4. Discussion
4.1. Grain Yield and Water-Use Efficiency under Irrigation
4.2. Influence of Irrigation on Soil-Water-Holding Consumption
5. Conclusions
Supplementary Materials
Author Contributions
Funding
Institutional Review Board Statement
Informed Consent Statement
Data Availability Statement
Acknowledgments
Conflicts of Interest
References
- He, G.; Cui, Z.; Ying, H.; Zheng, H.; Wang, Z.; Zhang, F. Managing the trade-offs among yield increase, water resources inputs and greenhouse gas emissions in irrigated wheat production systems. J. Clean. Prod. 2017, 164, 567–574. [Google Scholar] [CrossRef]
- Zhang, M.; Gao, Y.; Zhang, Z.; Liu, Y.; Han, M.; Hu, N.; Wang, Z.; Sun, Z.; Zhang, Y. Limited irrigation influence on rotation yield, water use, and wheat traits. Agron. J. 2020, 112, 241–256. [Google Scholar] [CrossRef]
- Fang, Q.; Ma, L.; Yu, Q.; Ahuja, L.R.; Malone, R.W.; Hoogenboom, G. Irrigation strategies to improve the water use efficiency of wheat–maize double cropping systems in North China Plain. Agric. Water Manag. 2010, 97, 1165–1174. [Google Scholar] [CrossRef]
- Sun, Z.; Zhang, Y.; Zhang, Z.; Gao, Y.; Yang, Y.; Han, M.; Wang, Z. Significance of disposable presowing irrigation in wheat in increasing water use efficiency and maintaining high yield under winter wheat-summer maize rotation in the North China Plain. Agric. Water Manag. 2019, 225, 105766. [Google Scholar] [CrossRef]
- Deng, X.; Shan, L.; Zhang, H.; Turner, N.C. Improving agricultural water use efficiency in arid and semiarid areas of China. Agric. Water Manag. 2006, 80, 23–40. [Google Scholar] [CrossRef]
- Rathore, V.S.; Nathawat, N.S.; Bhardwaj, S.; Sasidharan, R.P.; Yadav, B.M.; Kumar, M.; Santra, P.; Yadava, N.D.; Yadav, O.P. Yield, water and nitrogen use efficiencies of sprinkler irrigated wheat grown under different irrigation and nitrogen levels in an arid region. Agric. Water Manag. 2017, 187, 232–245. [Google Scholar] [CrossRef]
- Zhao, Z.; Qin, X.; Wang, E.; Carberry, P.; Zhang, Y.; Zhou, S.; Zhang, X.; Hu, C.; Wang, Z. Modelling to increase the eco-efficiency of a wheat–maize double cropping system. Agric. Ecosyst. Environ. 2015, 210, 36–46. [Google Scholar] [CrossRef]
- Li, J.; Xu, X.; Lin, G.; Wang, Y.; Liu, Y.; Zhang, M.; Zhou, J.; Wang, Z.; Zhang, Y. Micro-irrigation improves grain yield and resource use efficiency by co-locating the roots and N-fertilizer distribution of winter wheat in the North China Plain. Sci. Total Environ. 2018, 643, 367–377. [Google Scholar] [CrossRef]
- Oort, P.; Wang, G.; Vos, J.; Meinke, H.; Baoguo, L.; Huang, J.K.; Werf, W. Towards groundwater neutral cropping systems in the Alluvial Fans of the North China Plain. Agric. Water Manag. 2016, 165, 131–140. [Google Scholar] [CrossRef]
- Zhang, X.; Bol, R.; Rahn, C.; Xiao, G.; Meng, F.; Wu, W. Agricultural sustainable intensification improved nitrogen use efficiency and maintained high crop yield during 1980-2014 in Northern China. Sci. Total Environ. 2017, 596–597, 61–68. [Google Scholar] [CrossRef]
- Sun, Q.; Wang, Y.; Chen, G.; Yang, H.; Du, T. Water use efficiency was improved at leaf and yield levels of tomato plants by continuous irrigation using semipermeable membrane. Agric. Water Manag. 2018, 203, 430–437. [Google Scholar] [CrossRef]
- Davarpanah, R.; Ahmadi, S.H. Modeling the effects of irrigation management scenarios on winter wheat yield and water use indicators in response to climate variations and water delivery systems. J. Hydrol. 2021, 598, 126269. [Google Scholar] [CrossRef]
- Pardo, J.J.; Martínez-Romero, A.; Léllis, B.C.; Tarjuelo, J.M.; Domínguez, A. Effect of the optimized regulated deficit irrigation methodology on water use in barley under semiarid conditions. Agric. Water Manag. 2020, 228, 105925. [Google Scholar] [CrossRef]
- Ali, S.; Xu, Y.; Ma, X.; Ahmad, I.; Manzoor; Jia, Q.; Akmal, M.; Hussain, Z.; Arif, M.; Cai, T.; et al. Deficit irrigation strategies to improve winter wheat productivity and regulating root growth under different planting patterns. Agric. Water Manag. 2019, 219, 1–11. [Google Scholar] [CrossRef]
- Yu, L.; Zhao, X.; Gao, X.; Siddique, K.H.M. Improving/maintaining water-use efficiency and yield of wheat by deficit irrigation: A global meta-analysis. Agric. Water Manag. 2020, 228, 105906. [Google Scholar] [CrossRef]
- Lima, F.A.; Córcoles, J.I.; Tarjuelo, J.M.; Martínez-Romero, A. Model for management of an on-demand irrigation network based on irrigation scheduling of crops to minimize energy use (Part II): Financial impact of regulated deficit irrigation. Agric. Water Manag. 2019, 215, 44–54. [Google Scholar] [CrossRef]
- Jha, P.K.; Kumar, S.N.; Ines, A.V.M. Responses of soybean to water stress and supplemental irrigation in upper Indo-Gangetic plain: Field experiment and modeling approach. Field Crops Res. 2018, 219, 76–86. [Google Scholar] [CrossRef]
- Zhang, H.; Liang, Q.; Peng, Z.; Zhao, Y.; Tan, Y.; Zhang, X.; Bol, R. Response of greenhouse gases emissions and yields to irrigation and straw practices in wheat-maize cropping system. Agric. Water Manag. 2023, 282, 108281. [Google Scholar] [CrossRef]
- Li, J.; Wang, Y.; Zhang, M.; Liu, Y.; Xu, X.; Lin, G.; Wang, Z.; Yang, Y.; Zhang, Y. Optimized micro-sprinkling irrigation scheduling improves grain yield by increasing the uptake and utilization of water and nitrogen during grain filling in winter wheat. Agric. Water Manag. 2019, 211, 59–69. [Google Scholar] [CrossRef]
- Wang, D.; Yu, Z.; White, P.J. The effect of supplemental irrigation after jointing on leaf senescence and grain filling in wheat. Field Crops Res. 2013, 151, 35–44. [Google Scholar] [CrossRef]
- Jha, S.K.; Ramatshaba, T.S.; Wang, G.; Liang, Y.; Liu, H.; Gao, Y.; Duan, A. Response of growth, yield and water use efficiency of winter wheat to different irrigation methods and scheduling in North China Plain. Agric. Water Manag. 2019, 217, 292–302. [Google Scholar]
- Troll, W.; Lindsley, J. A photometric method for the determination of proline. J. Fish Biol. 1955, 215, 655–660. [Google Scholar] [CrossRef]
- Zhang, J.; Kirkham, M.B. Drought-stress-induced changes in activities of superoxide dismutase, catalase, and peroxidase in wheat species. Plant Cell Physiol. 1993, 35, 785–791. [Google Scholar] [CrossRef]
- Ierna, A.; Mauromicale, G. Tuber yield and irrigation water productivity in early potatoes as affected by irrigation regime. Agric. Water Manag. 2012, 115, 276–284. [Google Scholar] [CrossRef]
- Li, J.; Dong, W.; Oenema, O.; Chen, T.; Hu, C.; Yuan, H.; Zhao, L. Irrigation reduces the negative effect of global warming on winter wheat yield and greenhouse gas intensity. Sci. Total Environ. 2019, 646, 290–299. [Google Scholar] [CrossRef] [PubMed]
- Wang, D. Water use efficiency and optimal supplemental irrigation in a high yield wheat field. Field Crops Res. 2017, 213, 213–220. [Google Scholar] [CrossRef]
- Sun, H.; Shen, Y.; Yu, Q.; Flerchinger, G.N.; Zhang, Y.; Liu, C.; Zhang, X. Effect of precipitation change on water balance and WUE of the winter wheat–summer maize rotation in the North China Plain. Agric. Water Manag. 2010, 97, 1139–1145. [Google Scholar] [CrossRef]
- Serrago, R.A.; Alzueta, I.; Savin, R.; Slafer, G.A. Understanding grain yield responses to source–sink ratios during grain filling in wheat and barley under contrasting environments. Field Crops Res. 2013, 150, 42–51. [Google Scholar] [CrossRef] [Green Version]
- Slafer, G.A.; Savin, R.; Sadras, V.O. Coarse and fine regulation of wheat yield components in response to genotype and environment. Field Crops Res. 2014, 157, 71–83. [Google Scholar] [CrossRef]
- Bustos, D.V.; Hasan, A.K.; Reynolds, M.P.; Calderini, D.F. Combining high grain number and weight through a DH-population to improve grain yield potential of wheat in high-yielding environments. Field Crops Res. 2013, 145, 106–115. [Google Scholar] [CrossRef]
- Xu, X.; Zhang, M.; Li, J.; Liu, Z.; Zhao, Z.; Zhang, Y.; Zhou, S.; Wang, Z. Improving water use efficiency and grain yield of winter wheat by optimizing irrigations in the North China Plain. Field Crops Res. 2018, 221, 219–227. [Google Scholar] [CrossRef]
- Fan, Y.; Liu, J.; Zhao, J.; Ma, Y.; Li, Q. Effects of delayed irrigation during the jointing stage on the photosynthetic characteristics and yield of winter wheat under different planting patterns. Agric. Water Manag. 2019, 221, 371–376. [Google Scholar] [CrossRef]
- Tari, A.F. The effects of different deficit irrigation strategies on yield, quality, and water-use efficiencies of wheat under semi-arid conditions. Agric. Water Manag. 2016, 167, 1–10. [Google Scholar] [CrossRef]
- Mu, Q.; Cai, H.; Sun, S.; Wen, S.; Saddique, Q. The physiological response of winter wheat under short-term drought conditions and the sensitivity of different indices to soil water changes. Agric. Water Manag. 2021, 243, 106475. [Google Scholar] [CrossRef]
- Hui, H.; Lin, Q.; Liu, Y.; Liu, J.; Zhang, H.; Zhai, Y. Effect of irrigation on sugar content in flag leaf and grain, and yield of super-high-yield wheat at grain-filling stage. J. Triticeae Crops 2011, 31, 887–893. (In Chinese) [Google Scholar]
- Song, H.; Li, Y.; Zhou, L.; Xu, Z.; Zhou, G. Maize leaf functional responses to drought episode and rewatering. Agric. For. Meteorol. 2018, 249, 57–70. [Google Scholar] [CrossRef]
- Si, Z.; Zain, M.; Mehmood, F.; Wang, G.; Gao, Y.; Duan, A. Effects of nitrogen application rate and irrigation regime on growth, yield, and water-nitrogen use efficiency of drip-irrigated winter wheat in the North China Plain. Agric. Water Manag. 2020, 231, 106002. [Google Scholar] [CrossRef]
- Gupta, A.K.; Kaur, K.; Kaur, N. Stem reserve mobilization and sink activity in wheat under drought conditions. Am. J. Plant Sci. 2011, 2, 70–77. [Google Scholar] [CrossRef] [Green Version]
- Kaur, K.; Kaur, N.; Gupta, A.K.; Singh, I. Exploration of the antioxidative defense system to characterize chickpea genotypes showing differential response towards water deficit conditions. Plant Growth Regul. 2013, 70, 49–60. [Google Scholar] [CrossRef]
- Shahzad, A.; Xu, Y.; Jia, Q.; Irshad, A.; Ma, X.; Malak, H.; Ren, X.; Peng, Z.; Cai, T.; Zhang, J. Ridge-furrow mulched with plastic film improves the anti-oxidative defence system and photosynthesis in leaves of winter wheat under deficit irrigation. PLoS ONE 2018, 13, e0200277. [Google Scholar]
- Ashraf, M. Inducing drought tolerance in plants: Recent advances. Biotechnol. Adv. 2010, 28, 169–183. [Google Scholar] [CrossRef]
- Liu, Y.; Zhang, X.; Xi, L.; Liao, Y.; Han, J. Ridge-furrow planting promotes wheat grain yield and water productivity in the irrigated sub-humid region of China. Agric. Water Manag. 2020, 231, 105935. [Google Scholar] [CrossRef]
- Liu, X.; Qi, Y.; Li, F.; Yang, Q.; Yu, L. Impacts of regulated deficit irrigation on yield, quality and water use efficiency of Arabica coffee under different shading levels in dry and hot regions of southwest China. Agric. Water Manag. 2018, 204, 292–300. [Google Scholar] [CrossRef]
- Li, J.; Zhang, Z.; Liu, Y.; Yao, C.; Song, W.; Xu, X.; Zhang, M.; Zhou, X.; Gao, Y.; Wang, Z.; et al. Effects of micro-sprinkling with different irrigation amount on grain yield and water use efficiency of winter wheat in the North China Plain. Agric. Water Manag. 2019, 224, 105736. [Google Scholar] [CrossRef]
- Jha, S.K.; Gao, Y.; Liu, H.; Huang, Z.; Wang, G.; Liang, Y.; Duan, A. Root development and water uptake in winter wheat under different irrigation methods and scheduling for North China. Agric. Water Manag. 2017, 182, 139–150. [Google Scholar] [CrossRef]
- Liu, X.; Shao, L.; Sun, H.; Chen, S.; Zhang, X. Responses of yield and water use efficiency to irrigation amount decided by pan evaporation for winter wheat. Agric. Water Manag. 2013, 129, 173–180. [Google Scholar] [CrossRef]
- Payero, J.O.; Tarkalson, D.D.; Irmak, S.; Davison, D.; Petersen, J.L. Effect of irrigation amounts applied with subsurface drip irrigation on corn evapotranspiration, yield, water use efficiency, and dry matter production in a semiarid climate. Agric. Water Manag. 2008, 95, 895–908. [Google Scholar] [CrossRef] [Green Version]
- Zhao, J.; Han, T.; Wang, C.; Jia, H.; Worqlul, A.W.; Norelli, N.; Zeng, Z.; Chu, Q. Optimizing irrigation strategies to synchronously improve the yield and water productivity of winter wheat under interannual precipitation variability in the North China Plain. Agric. Water Manag. 2020, 240, 106298. [Google Scholar] [CrossRef]
- Xu, J.; Cai, H.; Wang, X.; Ma, C.; Lu, Y.; Ding, Y.; Wang, X.; Chen, H.; Wang, Y.; Saddique, Q. Exploring optimal irrigation and nitrogen fertilization in a winter wheat-summer maize rotation system for improving crop yield and reducing water and nitrogen leaching. Agric. Water Manag. 2020, 228, 105904. [Google Scholar] [CrossRef]
- Sandhu, O.S.; Gupta, R.K.; Thind, H.S.; Jat, M.L.; Sidhu, H.S.; Yadvinder, S. Drip irrigation and nitrogen management for improving crop yields, nitrogen use efficiency and water productivity of maize-wheat system on permanent beds in north-west India. Agric. Water Manag. 2019, 219, 19–26. [Google Scholar] [CrossRef]


| Year | Bulk Density (g cm−3) | SOM (g kg−1) | TN (g kg−1) | Av-N (mg kg−1) | Av-P (mg kg−1) | Av-K (mg kg−1) |
|---|---|---|---|---|---|---|
| 2018–2019 | 1.48 | 14.12 | 1.21 | 110.41 | 16.41 | 150.15 |
| 2019–2020 | 1.46 | 15.35 | 1.44 | 100.56 | 11.62 | 137.62 |
| Year | Varieties | Treatment | Overwinter 18 December | Jointing 20 March | Flowering 15 May | Total |
|---|---|---|---|---|---|---|
| 2018–2019/ 2019–2020 | S086 | W0 | 90 | 0 | 0 | 90 |
| W1 | 90 | 75 | 0 | 165 | ||
| W2 | 90 | 75 | 75 | 240 | ||
| J22 | W0 | 90 | 0 | 0 | 90 | |
| W1 | 90 | 75 | 0 | 165 | ||
| W2 | 90 | 75 | 75 | 240 |
| Year | Varieties | Treatment | Seeding to Jointing | Jointing to Flowering | Flowering to Filling | Filling to Mature | ||||||||
|---|---|---|---|---|---|---|---|---|---|---|---|---|---|---|
| CD | CP | TWCl | CD | CP | TWC | CD | CP | TWC | CD | CP | TWC | |||
| mm d−1 | % | mm | mm d−1 | % | mm | mm d−1 | % | mm | mm d−1 | % | mm | |||
| 2018–2019 | S086 | W0 | 0.43 a | 26.26 a | 70.92 a | 2.93 b | 41.16 a | 111.17 b | 3.00 b | 10.01 b | 27.04 b | 3.15 b | 31.46 b | 84.97 c |
| W1 | 0.40 a | 20.14 b | 66.43 a | 3.61 a | 41.63 a | 137.32 a | 4.68 a | 12.76 a | 42.08 a | 3.83 b | 31.39 b | 103.53 b | ||
| W2 | 0.42 a | 18.04 b | 69.42 a | 3.90 a | 38.55 a | 148.36 a | 5.51 a | 12.90 a | 49.63 a | 5.04 a | 35.34 a | 136.00 a | ||
| J22 | W0 | 0.45 a | 27.43 a | 72.34 a | 3.16 b | 44.33 a | 116.92 b | 2.92 b | 8.86 b | 23.38 b | 2.83 b | 29.02 b | 76.53 b | |
| W1 | 0.46 a | 23.32 b | 74.92 a | 3.84 a | 44.18 a | 136.93 a | 7.12 a | 17.73 a | 56.98 a | 2.98 b | 25.06 b | 80.51 b | ||
| W2 | 0.47 a | 20.08 b | 76.92 a | 3.97 a | 38.35 a | 146.94 a | 7.31 a | 15.27 a | 58.50 a | 5.36 a | 37.79 a | 144.76 a | ||
| 2019–2020 | S086 | W0 | 0.54 a | 22.84 a | 88.98 a | 0.89 b | 8.65 b | 33.69 b | 7.32 c | 16.92 b | 65.90 c | 3.28 b | 22.71 b | 88.48 c |
| W1 | 0.51 a | 18.94 b | 84.99 a | 1.77 a | 15.01 a | 67.32 a | 16.96 b | 34.03 a | 152.65 b | 4.30 b | 25.85 b | 115.99 b | ||
| W2 | 0.56 a | 19.28 b | 93.02 a | 1.83 a | 14.40 a | 69.48 a | 22.24 a | 41.50 a | 200.19 a | 5.39 a | 30.15 a | 145.43 a | ||
| J22 | W0 | 0.43 a | 17.89 a | 68.94 a | 0.95 b | 9.08 b | 34.98 b | 8.36 c | 17.37 b | 66.91 c | 2.69 b | 18.83 b | 72.55 b | |
| W1 | 0.35 a | 13.89 b | 57.45 a | 1.48 a | 13.26 a | 54.84 a | 18.60 b | 35.98 a | 148.80 b | 3.17 b | 19.42 b | 80.29 b | ||
| W2 | 0.35 a | 12.34 b | 56.21 a | 1.52 a | 12.37 a | 56.35 a | 25.88 a | 45.45 a | 207.03 a | 6.14 a | 36.42 a | 165.91 a | ||
| Year | Varieties | Irrigation | TWC | SWC | SOD | POD | CAT | MDA | Sugar | Pro |
|---|---|---|---|---|---|---|---|---|---|---|
| 2018–2019 | S086 | W0 | 270.1 ± 88.2 | 67.5 ± 18.3 | 461.0 ± 1.6 | 188.4 ± 8.1 | 141.4 ± 6.1 | 20.9 ± 2.5 | 30.3 ± 2.3 | 289.5 ± 12.0 |
| W1 | 329.8 ± 76.5 | 52.2 ± 9.9 | 514.9 ± 12.6 | 202.0 ± 11.3 | 160.8 ± 10.1 | 16.1 ± 2.7 | 25.0 ± 0.5 | 259.8 ± 16.2 | ||
| W2 | 384.9 ± 45.2 | 32.3 ± 7.8 | 540.7 ± 15.3 | 225.3 ± 10.3 | 178.5 ± 2.3 | 14.7 ± 2.2 | 23.0 ± 0.5 | 238.3 ± 15.4 | ||
| J22 | W0 | 263.7 ± 21.2 | 61.1 ± 1.2 | 473.9 ± 24.3 | 168.7 ± 5.5 | 150.0 ± 8.4 | 17.1 ± 2.1 | 34.9 ± 1.0 | 309.6 ± 10.6 | |
| W1 | 321.3 ± 40.6 | 43.7 ± 3.9 | 553.0 ± 22.8 | 195.7 ± 16.9 | 176.3 ± 8.1 | 14.9 ± 1.4 | 31.3 ± 0.5 | 261.3 ± 8.4 | ||
| W2 | 383.1 ± 77.5 | 30.5 ± 11.5 | 573.5 ± 28.9 | 218.6 ± 12.4 | 183.7 ± 5.9 | 12.9 ± 1.6 | 28.3 ± 0.0 | 231.5 ± 4.2 | ||
| 2019–2020 | S086 | W0 | 389.6 ± 32.5 | 165.9 ± 6.1 | 485.6 ± 6.9 | 184.3 ± 8.1 | 125.3 ± 6.9 | 19.4 ± 1.0 | 32.0 ± 0.3 | 229.5 ± 10.6 |
| W1 | 448.6 ± 67.9 | 149.9 ± 13.1 | 540.3 ± 9.6 | 216.1 ± 11.3 | 144.0 ± 9.6 | 18.1 ± 0.1 | 26.5 ± 0.1 | 199.8 ± 11.3 | ||
| W2 | 482.4 ± 78.6 | 108.7 ± 10.8 | 563.1 ± 1.0 | 230.7 ± 10.3 | 150.0 ± 1.0 | 14.1 ± 1.2 | 24.3 ± 0.2 | 183.3 ± 15.5 | ||
| J22 | W0 | 385.3 ± 22.5 | 161.6 ± 3.2 | 457.4 ± 8.8 | 188.1 ± 5.5 | 118.0 ± 8.8 | 15.0 ± 0.2 | 32.6 ± 0.2 | 229.6 ± 10.2 | |
| W1 | 413.5 ± 55.2 | 114.8 ± 4.4 | 557.6 ± 7.9 | 206.8 ± 16.9 | 134.7 ± 7.9 | 16.8 ± 0.2 | 28.8 ± 0.3 | 193.3 ± 11.0 | ||
| W2 | 455.5 ± 49.3 | 81.8 ± 7.8 | 580.0 ± 9.5 | 228.1 ± 12.4 | 148.7 ± 9.5 | 22.5 ± 0.0 | 24.3 ± 0.3 | 171.5 ± 12.0 | ||
| ANOVA p value | ||||||||||
| Year (Y) | *** | *** | NS | * | NS | NS | NS | * | ||
| Variety (V) | NS | *** | NS | NS | NS | NS | NS | NS | ||
| Irrigation (I) | *** | *** | NS | * | NS | NS | NS | NS | ||
| Y × V | NS | ** | NS | NS | NS | NS | NS | NS | ||
| Y × I | NS | *** | NS | NS | NS | NS | NS | NS | ||
| V × I | NS | NS | NS | NS | NS | NS | NS | NS | ||
| Y × V × I | NS | NS | NS | NS | NS | NS | NS | NS | ||
| Year | Varieties | Irrigation | Spike (×104 ha−1) | Grains per Spike | Weight (1000-Grain) /g | Yield /kg ha−1 |
|---|---|---|---|---|---|---|
| 2018–2019 | S086 | W0 | 331.95 b | 26.33 b | 36.68 b | 3106.9 ± 212.7 d |
| W1 | 632.41 a | 33.00 a | 40.79 a | 7803.3 ± 413.3 a | ||
| W2 | 552.75 a | 33.67 a | 39.57 a | 8198.6 ± 178.3 a | ||
| J22 | W0 | 391.35 b | 27.67 b | 34.85 a | 3512.9 ± 228.7 d | |
| W1 | 687.31 a | 33.67 a | 35.70 a | 7773.7 ± 801.7 ab | ||
| W2 | 719.70 a | 32.00 a | 34.69 a | 8110.6 ± 85.0 a | ||
| 2019–2020 | S086 | W0 | 527.67 a | 30.61 b | 49.28 a | 6536.4 ± 206.7 bc |
| W1 | 612.03 a | 32.17 a | 50.33 a | 8182.3 ± 311.3 a | ||
| W2 | 646.03 a | 32.43 a | 50.51 a | 8286.0 ± 403.5 a | ||
| J22 | W0 | 567.01 a | 29.81 b | 48.50 a | 6502.0 ± 359.2 c | |
| W1 | 598.36 a | 34.47 a | 49.08 a | 8062.5 ± 211.8 a | ||
| W2 | 601.03 a | 35.37 a | 48.97 a | 8122.3 ± 204.5 a | ||
| ANOVA p value | ||||||
| Year (Y) | ** | ** | *** | *** | ||
| Variety (V) | ** | NS | *** | NS | ||
| Irrigation (I) | *** | *** | NS | *** | ||
| Y × V | *** | NS | * | NS | ||
| Y × I | *** | * | NS | *** | ||
| V × I | NS | NS | NS | NS | ||
| Y × V × I | NS | * | NS | NS | ||
| Year | Varieties | Treatments | WUE (kg m3) | IWUE (kg m3) |
|---|---|---|---|---|
| 2018–2019 | S086 | W0 | 1.53 ± 0.10 e | 3.45 ± 0.24 d |
| W1 | 2.81 ± 0.15 a | 4.73 ± 0.25 bc | ||
| W2 | 2.33 ± 0.05 bc | 3.42 ± 0.07 d | ||
| J22 | W0 | 1.73 ± 0.11 de | 3.90 ± 0.25 cd | |
| W1 | 2.80 ± 0.29 a | 4.71 ± 0.49 bc | ||
| W2 | 2.30 ± 0.02 bc | 3.38 ± 0.04 a | ||
| 2019–2020 | S086 | W0 | 2.92 ± 0.09 a | 7.26 ± 0.23 b |
| W1 | 2.74 ± 0.10 ab | 4.96 ± 0.19 d | ||
| W2 | 2.22 ± 0.11 c | 3.45 ± 0.17 d | ||
| J22 | W0 | 2.91 ± 0.16 a | 7.22 ± 0.40 a | |
| W1 | 2.70 ± 0.07 ab | 4.89 ± 0.13 b | ||
| W2 | 2.17 ± 0.05 cd | 3.38 ± 0.09 d | ||
| ANOVA p value | ||||
| Year (Y) | *** | *** | ||
| Variety (V) | NS | NS | ||
| Irrigation (I) | *** | *** | ||
| Y × V | NS | NS | ||
| Y × I | *** | *** | ||
| V × I | NS | NS | ||
| Y × V × I | NS | NS | ||
Disclaimer/Publisher’s Note: The statements, opinions and data contained in all publications are solely those of the individual author(s) and contributor(s) and not of MDPI and/or the editor(s). MDPI and/or the editor(s) disclaim responsibility for any injury to people or property resulting from any ideas, methods, instructions or products referred to in the content. |
© 2023 by the authors. Licensee MDPI, Basel, Switzerland. This article is an open access article distributed under the terms and conditions of the Creative Commons Attribution (CC BY) license (https://creativecommons.org/licenses/by/4.0/).
Share and Cite
Zhang, X.; Zhang, J.; Xue, J.; Wang, G. Improving Wheat Yield and Water-Use Efficiency by Optimizing Irrigations in Northern China. Sustainability 2023, 15, 10503. https://doi.org/10.3390/su151310503
Zhang X, Zhang J, Xue J, Wang G. Improving Wheat Yield and Water-Use Efficiency by Optimizing Irrigations in Northern China. Sustainability. 2023; 15(13):10503. https://doi.org/10.3390/su151310503
Chicago/Turabian StyleZhang, Xin, Jianheng Zhang, Jiaxin Xue, and Guiyan Wang. 2023. "Improving Wheat Yield and Water-Use Efficiency by Optimizing Irrigations in Northern China" Sustainability 15, no. 13: 10503. https://doi.org/10.3390/su151310503