Article

Effects of SeNPs Fertilizer on Se and Microelement Contents, Eating and Cooking Qualities, and Volatile Organic Compounds in Rice Grains

1
National R&D Center for Se-Rich Agricultural Products Processing, School of Modern Industry for Selenium Science and Engineering, Wuhan Polytechnic University, Wuhan 430023, China
2
Enshi Se-Run Health Tech Development Co., Ltd., Enshi 445000, China
3
Hubei Key Laboratory of Food Crop Germplasm and Genetic Improvement, Key Laboratory of Crop Molecular Breeding, Ministry of Agriculture and Rural Affairs, Institute of Food Crops, Hubei Academy of Agricultural Sciences, Wuhan 430064, China
*
Authors to whom correspondence should be addressed.
Sustainability 2023, 15(13), 10553; https://doi.org/10.3390/su151310553
Submission received: 6 June 2023 / Revised: 27 June 2023 / Accepted: 2 July 2023 / Published: 4 July 2023

Abstract

:
Foliar application of selenium (Se) fertilizer has been widely used in the production of Se-rich rice. However, the effect of Se-nanoparticles (SeNPs) fertilizer on rice quality remains largely unknown. Two bioSeNPs fertilizers were applied at different Se concentrations to explore the effect of the foliar application of SeNPs fertilizer on various rice grain qualities. The results showed that Se treatments resulted in 1.93–9.09 and 1.89–7.73 folds of total Se contents in brown and polished rice relative to the CK, respectively. Moreover, the Se treatments led to 1.04–2.33 folds increases in Cd contents, 14.6–26.4% decreases in As contents, a 13.9–16.7% reduction in Cr contents and no changes in Pb contents to that of the CK in rice grains. In addition, SeNPs exhibited no obvious impact on rice eating and cooking quality, and only the XY1 treatment could slightly improve the fatty acid content. Interestingly, Se treatments enhanced the contents of more than half of volatile organic compounds in brown rice. In general, SeNPs fertilizer XY at 6.4 g/ha was identified as the optimum choice for improvement in grain Se contents and grain qualities.

Graphical Abstract

1. Introduction

Selenium (Se) is an essential trace element for human heath, and its deficiency is associated with various health problems, such as a poor immune system, cognitive decline, and various cancers [1]. About 15% of the world’s population suffer from health problems caused by Se deficiency [2,3]. In China, the Se-deficient area is extending from the northeast to the southwest [4]. Due to the importance of Se to human health and the low level of Se in natural soils, Se supplementation has become an inevitable practice in agricultural production. Rice is a main crop accounting for up to 80% of the daily caloric intake of more than half of the world’s population, and China is the largest rice producer and consumer [5]. However, approximately 75% of rice grains can only provide less than 70% of the recommended daily intake of Se [6]. Therefore, it is critical to increase the Se content in rice by biofortification to satisfy people’s daily demand for dietary Se.
It has been demonstrated that the Se species, fertilizer dose, fertilization time, and soil properties all can largely determine Se uptake efficiency and crop quality [7,8,9]. Foliar application and soil fertilization are the two main strategies for Se biofortification in crops, with the former being much more practicable, effective, and environmentally friendly than the latter [10,11]. The bioavailability of Se is closely related to its oxidation state, with valence varying from minus two to plus six, including selenite, selenate, elemental Se, and selenide [12]. Se nanoparticles (SeNPs) are a kind of slow-release Se with lower Se-enrichment efficiency than selenite, selenite, or selenomethionine (SeMet), and can act over the whole growth period of a crop, and are widely used to increase the Se content in food due to its high biological activity, bioavailability and low toxicity [13,14]. Although Se is not an essential element for higher plants, many reports have confirmed the beneficial effect of Se on plant growth [15,16]. In addition, several studies have demonstrated that Se biofortification can alter some grain-quality traits of crops [11,17,18]. Se biofortification through foliar fertilization with sodium selenite and selenite can increase the total contents of lipids, sugars, and proteins in rice [19]. In addition, exogenous Se application can sharply decrease the contents of microelements such as cadmium (Cd) and arsenic (As) in plants [20,21]. Many studies have proved that rice has a strong ability to enrich Se; however, as Se is a non-renewable resource, the long-term application or excessive biofortification will not only cause environmental pollution but also lead to potential harmful impact on rice growth and grain qualities.
Rice grain quality consists of several indices, such as milling quality, appearance quality, flavor, eating and cooking quality, nutrients, and texture. Aroma is one of the key features of high-quality rice in great demand in the market. Rice aroma is a fairly complex trait because it is a result of interaction among numerous volatile compounds and many factors such as planting and processing conditions [22]. It has been reported that both sodium selenite and chelating Se can significantly increase 2-acetyl-1-pyrroline (2-AP), a key aromatic compound in rice grains [23]. The aroma of rice is composed of more than 200 volatile compounds such as hydrocarbons, alcohols, aldehydes, ketones, acids, esters, phenols, pyridines, and pyrazines [24]. It remains to be determined whether the exogenous application of Se on rice has certain impacts on the complex volatile organic compounds (VOCs).
In recent years, selenite and selenate are the most two commonly used Se fertilizers for revealing the effect of Se biofortification on crop yield and quality. Numerous studies have revealed the relationship of different Se fertilizers with biofortification efficiency and crop quality [11,18]. However, there has been little research on the impact of SeNPs fertilizer on rice quality, particularly on VOCs in rice grains. This study investigated the influence of foliar application of SeNPs fertilizer on rice aroma and grain quality. The findings will provide a theoretical basis for the production of Se-rich rice.

2. Materials and Methods

2.1. Field Experiment Design

The field experiment was conducted at the experimental farm of Hubei Academy of Agricultural Sciences in Hanchuan, Hubei province (China) from May to October 2021. The rice variety EZhong 6, an aromatic rice bred by Hubei Academy of Agricultural Sciences, was used for Se application. The physical and chemical properties of the soil (0–20 cm) were pH (H2O), 8.05; electrical conductivity, 2.03 × 10⁻² s/m; organic matter, 11.1 g/kg; available N, 66.2 mg/kg; available P, 10.5 mg/kg; available K, 120.3 mg/kg; total Se, 0.23 mg/kg; total Cd, 0.48 mg/kg; total As, 11.08 mg/kg; total lead (Pb), 35.75 mg/kg; total chromium (Cr), 88.98 mg/kg; total Zinc (Zn), 96.67 mg/kg.
Two bioSeNPs fertilizers were sprayed on the leaves of rice at the heading stage. Fertilizer XF (produced by Se Huinong Biotechnology (Shenzhen) Co., Ltd. (Shenzhen, China) with the size of nanoparticles less than 100 nm) and fertilizer XY (produced by Hubei Academy of Agricultural Sciences with the size of nanoparticles ranging from 100–200 nm) were applied at different Se concentrations. In this study, five treatments with three replicates were conducted in a completely randomized block design. These treatments were CK (control, water without Se); XF1 (3.2 g Se/ha, fertilizer XF); XF2 (19.3 g Se/ha, fertilizer XF); XY1 (6.4 g Se/ha, fertilizer XY); and XY2 (38.6 g Se/ha, fertilizer XY). The seeds from different treatments were harvested at maturity and used for the evaluation of grain qualities.

2.2. Determination of Se and Microelement Contents

The levels of Se and its potential associated metals, including Cd, Cr, As, Pb, and Zn, in brown and polished rice were analyzed through inductively coupled plasma mass spectrometry (ICP-MS) (7800 ICP-MS, Agilent, Santa Clara, CA, USA). Sample pretreatment for detection was carried out as follows. About 0.2 g of rice powder was added into 8 mL of HNO3 and digested with a microwave digestion oven (WX-8000, PreeKem, Shanghai, China). The digested solution was then transferred to a graphite heater (G-400, PreeKem, Shanghai, China) and heated until it turned colorless, accompanied by white smoke, and only about 1 mL of the mixed solution remained. After cooling to room temperature, the solution was volumed to 10 mL with 2% HNO3. The standard solution was used to adjust the parameters of the ICP-MS, and the detection signal was 80Se, 111Cd, 52Cr, 66Zn, 208Pb, and 75As. A reagent blank test was performed.

2.3. Analysis of Inorganic Se Content

About 1.5 g of 100-mesh-filtered polished rice powder was placed into a 25-mL test tube, and then 20 mL of 5% HCl (HCl:H2O = 1:19) solution was added to suspend the sample. The solution was incubated in a 70 °C water bath for 1 h, and then filtered through 0.22 μm filter. Then, 10 mL of the filtered solution was transferred into the digestion tank and incubated at 130 °C in the electric heating plate (G-400, PreeKem, Shanghai, China) until about 1–3 mL residual solution was left, followed by the addition of 8 mL HNO3 for digestion by a microwave digestion oven (WX-8000, PreeKem, Shanghai, China). Moreover, 0.2 g of 100-mesh-filtered polished rice powder was digested by 8 mL HNO3 for the analysis of the total Se content. The digested solution was then transferred to a full-automatic graphite digester, and incubated at 180 °C until 1 mL of the digested solution was left. After cooling to room temperature, 5 mL of HCl (HCl:H2O = 1:1) was added and incubated at 180 °C again until about 1 mL digested solution was left, which was then volumed to 10 mL with 10% HCl. The total Se content and inorganic Se content were determined using an atomic fluorescence spectrophotometer (AFS-8530, HaiGuang, Beijing, China). The organic Se content was calculated with the following equation: organic Se content = total Se content − inorganic Se content.

2.4. Determination of Fatty Acids

The identification and quantification of fatty-acid methyl esters in brown rice samples were performed with gas chromatography–mass spectrometry (GC-MS) (Agilent 7890A-5957C). About 0.1 g of brown rice was placed into a 10 mL glass tube, followed by the addition of 4.5 mL sulfuric acid: methanol (volume 1:19) and 624 μg of margaric acid (C17:0) dissolved in chloroform. The mixed solution was kept in a water bath for 3 h at 88 °C; after cooling to room temperature, 2 mL of n-hexane was added and centrifuged at 3500 rpm for 10 min, and finally 1 mL of the supernatant was analyzed by GC-MS.

2.5. Evaluation of the Chemical Properties of Rice Grains

The grains from each Se-dose enriched rice sample were dehulled into brown rice, and then ground into flour and passed through a 100-mesh sieve. The rice powder was prepared for the evaluation of its chemical properties. The content of amylose was analyzed with the method of NY/T 2639-2014 [25]. The alkali digestion value and gel consistency of the polished rice were evaluated in accordance with NY/T 83-2017 [26].

2.6. HS-GC-IMS Assay

The VOCs of all rice samples were analyzed and identified using a headspace-gas chromatography-ion mobility spectrometry (HS-GC-IMS) flavor analyzer (FlavorSpec®, G.A.S., Dortmund, Germany). Before HS-GC-IMS analysis, each rice sample (5 g brown rice) was transferred into a headspace sampling vial (20 mL) and incubated at 80 °C for 15 min of equilibration. Then, 500 μL of headspace gas was extracted with a heated (85 °C) syringe and automatically injected by the autosampler (in a splitless mode). For GC analysis, the VOCs were separated by a FS-SE-54-CB-1 capillary column (15 m × 0.53 mm, 1 μm film thickness) at 45 °C with nitrogen (>99.999% purity) as the carrier gas under a programmed procedure: 2 mL/min for 2 min, linearly increased to 10 mL/min over 2–10 min, to 100 mL/min over 10–20 min, and then to 150 mL/min over 20–30 min. The ionization source of the IMS was tritium 3H which could provide a radiation energy of 6.5 KeV. The resulting ions were driven into a 98 mm long drift tube operated at a constant temperature and a voltage at 45 °C and 500 V/cm, respectively. The flow rate of the drift gas (N2, 99.999%) was set at 150 mL/min.
The analysis software LAV (Laboratory Analytical Viewer)-Gallery Plot (version 2.2.1, G.A.S., Germany) was used to analyze the VOCs in the samples from different perspectives. The NIST (National Institute of Standards and Technology, Gaithersburg, MD, USA) and IMS databases were used to qualitatively analyze the VOCs. The Reporter plug-in was used to compare the spectral differences between samples and draw the difference map. The Gallery Plot plug-in was employed to compare the differences in VOCs in rice samples and draw the fingerprints.

2.7. Statistical Analysis

All data were analyzed by the R package (version 4.2.1). Data were presented as means ± SE (n = 3). A significant level of p < 0.05 was set as the threshold for one-way ANOVA with multiple comparisons to compare the different Se-treatment groups. The dynamic principal component analysis (PCA) was conducted by Metaboanalyst 5.0. The clustering analysis was performed by R studio. Each sample included three replicates.

3. Results and Discussion

3.1. Contents of Se and Microelements

A previous study demonstrated that Se-rich agro-foods usually have the potential risk of accumulating associated metals [27]. To determine the relationship between Se and other metal contents in rice grains under the foliar application of SeNPs fertilizers, we measured the concentrations of Se and some metals such as Cd, Pb, As, Cr, and Zn. All Se treatments increased the total Se content in both brown and polished rice compared with CK. Specifically, the total Se contents of XF1, XF2, XY1, and XY2 were 1.93-, 2.83-, 6.22-, and 9.09-fold that of the CK in brown rice, and 1.89-, 2.28-, 5.35-, and 7.73-fold that of the CK in polished rice, respectively. XY2 resulted in the highest Se level among all Se treatment groups in both brown rice and polished rice (Figure 1A). Interestingly, XY1 (6.4 g/ha) had a higher total Se content than XF2 (19.3 g/ha). These results indicated that both SeNPs fertilizer XF and SeNPs fertilizer XY can sharply increase the Se content in rice grains, particularly the latter. Generally, all Se treatment groups had a significantly higher Cd accumulation in both brown and polished rice than the CK. The total Cd contents of XF1, XF2, XY1, and XY2 were 1.10-, 1.21-, 2.33-, and 1.42-fold that of the CK in brown rice, and 1.04-, 1.21-, 2.21-, and 1.42-fold that of the CK in polished rice, respectively. Interestingly, XY1 resulted in the highest Cd level among all Se treatments (Figure 1B). These results suggest that both SeNPs fertilizers may increase the risk of Cd accumulation in rice grains, and the Cd level is closely associated with the Se concentration for the treatment; moreover, the application of SeNPs fertilizer XY tends to increase the Cd accumulation. Furthermore, we also tested the contents of other microelements in all Se-treatment groups. The results showed that the Pb content had no dramatic change under Se fertilizer application (Figure 1C); the As contents in XF1, XF2, XY1, and XY2 decreased by 14.6%, 17.1%, 21.5% and 26.4% compared to that of the CK in brown rice, and 19.4%, 19.3%, 16.7% and 26.0% than that of the CK in polished rice, respectively (Figure 1D). All of the Se treatments significantly reduced the As content in both brown rice and polished rice. Except for XF1, the Cr contents of the other treatments showed no significant differences in brown rice than that of the CK, while in polished rice, the Cr contents significantly decreased by 15.5%, 13.9% and 16.7% in XF2, XY1 and XY2 than that of the CK, respectively (Figure 1E). As for the content of Zn, Only XY1 slightly increased in polished rice compared with the CK (Figure 1F). China National standard GB/T 22499-2008 [28] stipulates that the Se content in Se-rich rice should range from 0.04 to 0.3 mg/kg. In the present study, under the foliar application of two SeNPs fertilizers at five Se concentrations, the concentration of Se in all samples ranged from 0.035 to 0.272 mg/kg in polished rice, which is within the scope of national standard; moreover, although both SeNPs fertilizers increased the content of Cd, the Cd concentration was not beyond the national standard (GB 2762-2017) [29]. Surprisingly, the level of Cr in all groups (including CK) exceeded the limit of 1.0 mg/kg, and Se treatments significantly reduced the Cr level in polished rice compared with the CK. Other microelements such as Pb, Cd, and As were all within the scope of national standards. Therefore, both SeNPs fertilizers and all Se concentrations for treatment are appropriate to be applied in rice production.
Many studies have assessed the relationship between Se and microelements in rice grown in seleniferous areas, and revealed that in brown rice, Se is positively correlated with Cd, Cr, As, and Zn [27]. However, some studies have demonstrated that the root application of Se can reduce the heavy metal contents in rice grains. For example, it has been reported that the biofortification of Se in the form of Na2SeO3 through root application in rice can not only increase the Se concentration but also reduce the Cd accumulation while having no influence on the Pb level in brown rice [30]. Another study reported that the root application of selenite and selenate can reduce the accumulation of As, Cd, and Zn in rice grains [31]. Contrary to previous studies, the present study conducted Se biofortification through the foliar application of SeNPs fertilizers. Although Se treatments elevated the Cd concentration, they decreased the As accumulation in both brown rice and polished rice, as well as reducing the Cr content in polished rice compared with the CK. No remarkable difference in the content of Pb was detected between Se treatment groups and CK in both brown and polished rice, and this was a similar case for the content of Zn in brown rice. These discrepancies from previous findings might be due to the various forms, concentrations, and application methods of Se and soil conditions.
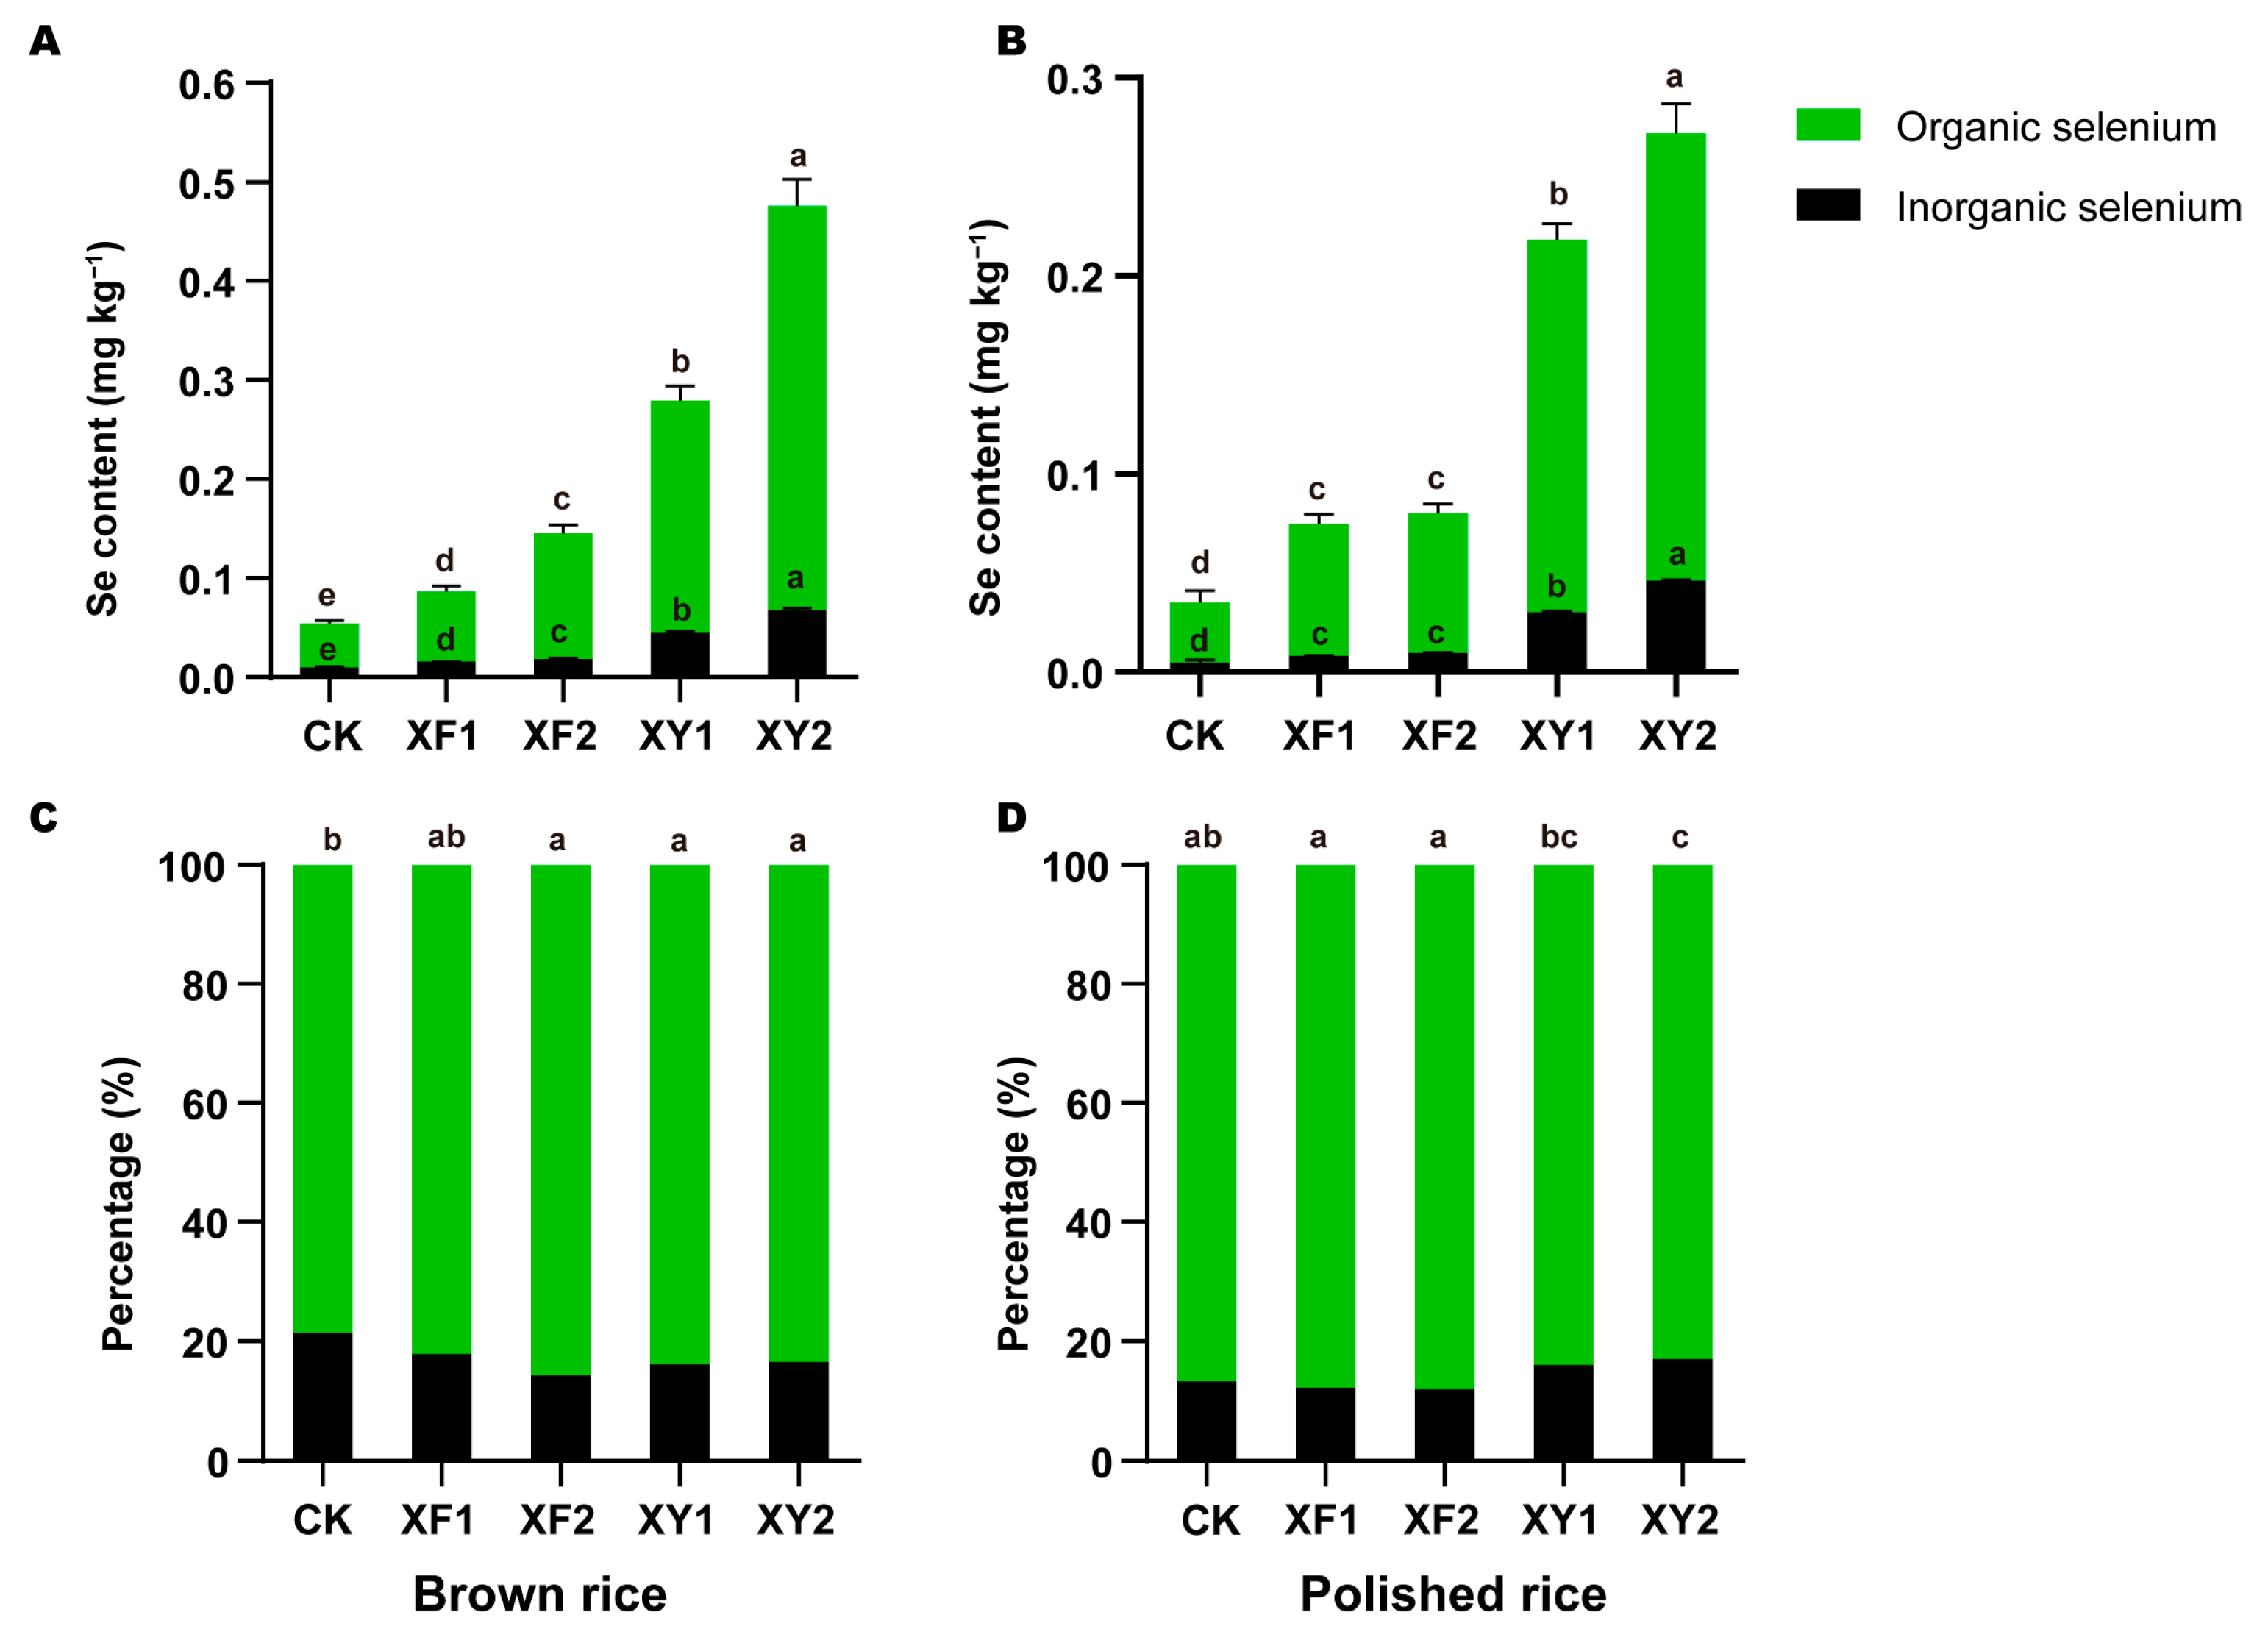
It has been reported that organic Se confers additional health benefits relative to inorganic Se [32]. Moreover, we also tested the inorganic, organic Se contents and the percentage of organic Se in different Se treatment groups. The organic Se in XF1, XF2, XY1, and XY2 was 2.02-, 3.08-, 6.62-, and 9.64-fold that of the CK in brown rice, and 1.92-, 2.32-, 5.18-, and 7.40-fold that of the CK in polished rice, respectively. All Se treatments increased the contents of both organic and inorganic Se in brown rice and polished rice compared with the CK (Figure 2A,B). In addition, the percentage of organic Se showed a different changing trend with the SeNPs fertilizer application in brown and polished rice. The ratio of organic and total Se ranged from 78.7% to 85.7% in brown rice and from 83.0% to 88.0% in polished rice. The percentage of organic Se in XF2, XY1, and XY2 sharply increased compared with the CK in brown rice (Figure 2C). Nevertheless, in polished rice, the percentage of organic Se showed a different pattern: there was no significant change in XF1, XF2 and XY1 relative to the CK; however, XY2 resulted in a significantly lower percentage of organic Se than the CK (Figure 2D).
Previous studies have demonstrated that foliar biofortification with sodium selenite can decrease the ratio of organic and total Se in both brown and polished rice, especially in brown rice [33]. In this study, all Se treatments significantly increased the organic Se ratio in brown rice compared with the CK, but in brown rice, the percentage of organic Se significantly decreased in XY2 compared to in CK. Organic Se accounted for more than 80% of total Se in both brown and polished rice after biofortification with SeNPs fertilizers. These discrepancies from previous findings are probably due to the different rice cultivars, Se forms, and fertilization methods. Our results indicated that SeNPs fertilizer is much more effective in organic Se transformation in brown rice.

3.2. Fatty acid Profiling and Eating and Cooking Quality Evaluation under Different Se Treatments

The overall rice grain quality is generally assessed by milling, eating and cooking, appearance, odor, and nutrient qualities. Starch and lipids are the main factors influencing rice eating and cooking quality. Compared with starch, lipids are minor components in rice grains; however, they play important roles in determining rice-seed storage longevity and palatability [34]. To determine whether SeNPs biofortification has any effect on rice quality, we tested the fatty acid profile and the basic chemical properties of rice grains in the CK and Se treatment groups. The total fatty acid contents in the CK, XF1, XF2, XY1, and XY2 were 26.8, 28.8, 29.9, 33.1, and 27.8 mg/g, respectively. Among all Se treatment groups, XY1 resulted in significantly higher palmitic acid, oleic acid, and linoleic acid contents than the CK (Figure 3). XY1 also led to a higher total fatty acid content compared with the CK; however, SeNPs application resulted in no obvious change in the proportion of different kinds of fatty acids.
The basic chemical properties of rice grains such as gel consistency, alkali digestion value, and amylose content can affect rice eating and cooking quality to a great extent. As shown in Supplementary Table S1, the alkali digestion value in the CK, XF1, XF2, XY1, and XY2 was 5. The gel consistency and amylose content were 81.7–84.7 mm and 13.7–15.5% in all Se treatment groups and CK, respectively. In addition, there was no obvious difference in gel consistency, alkali digestion value, and amylose content between all Se treatment groups and the CK (Supplementary Table S1). These results indicated that SeNPs may have no obvious effect on rice eating and cooking quality, but can slightly improve the fatty acid content at appropriate concentrations. It has been reported that both selenite and selenate application can improve the palmitic acid, stearic acid, oleic acid, linoleic acid, and linolenic acid contents [19]. In this study, XY1 resulted in significantly higher palmitic acid, oleic acid, and linoleic acid contents relative to the CK. This result is consistent with the previous study and indicates that Se at low concentrations can enhance the palmitic acid, oleic acid, and linoleic acid contents in rice grains. In our study, Se treatments resulted in no significant difference in alkali digestion value, gel consistency, and amylose content compared with the CK (Supplementary Table S1). This result is in agreement with the finding that Se application has no remarkable influence on rice-grain amylose content [23]. XY1 exhibited a relatively higher fatty acid level without compromising the eating and cooking quality. Therefore, it can be concluded that SeNPs fertilizer XY at 6.4 g/ha can effectively improve the fatty acid content in rice grains.

3.3. Impacts of SeNPs on Volatile Organic Compounds in Brown Rice

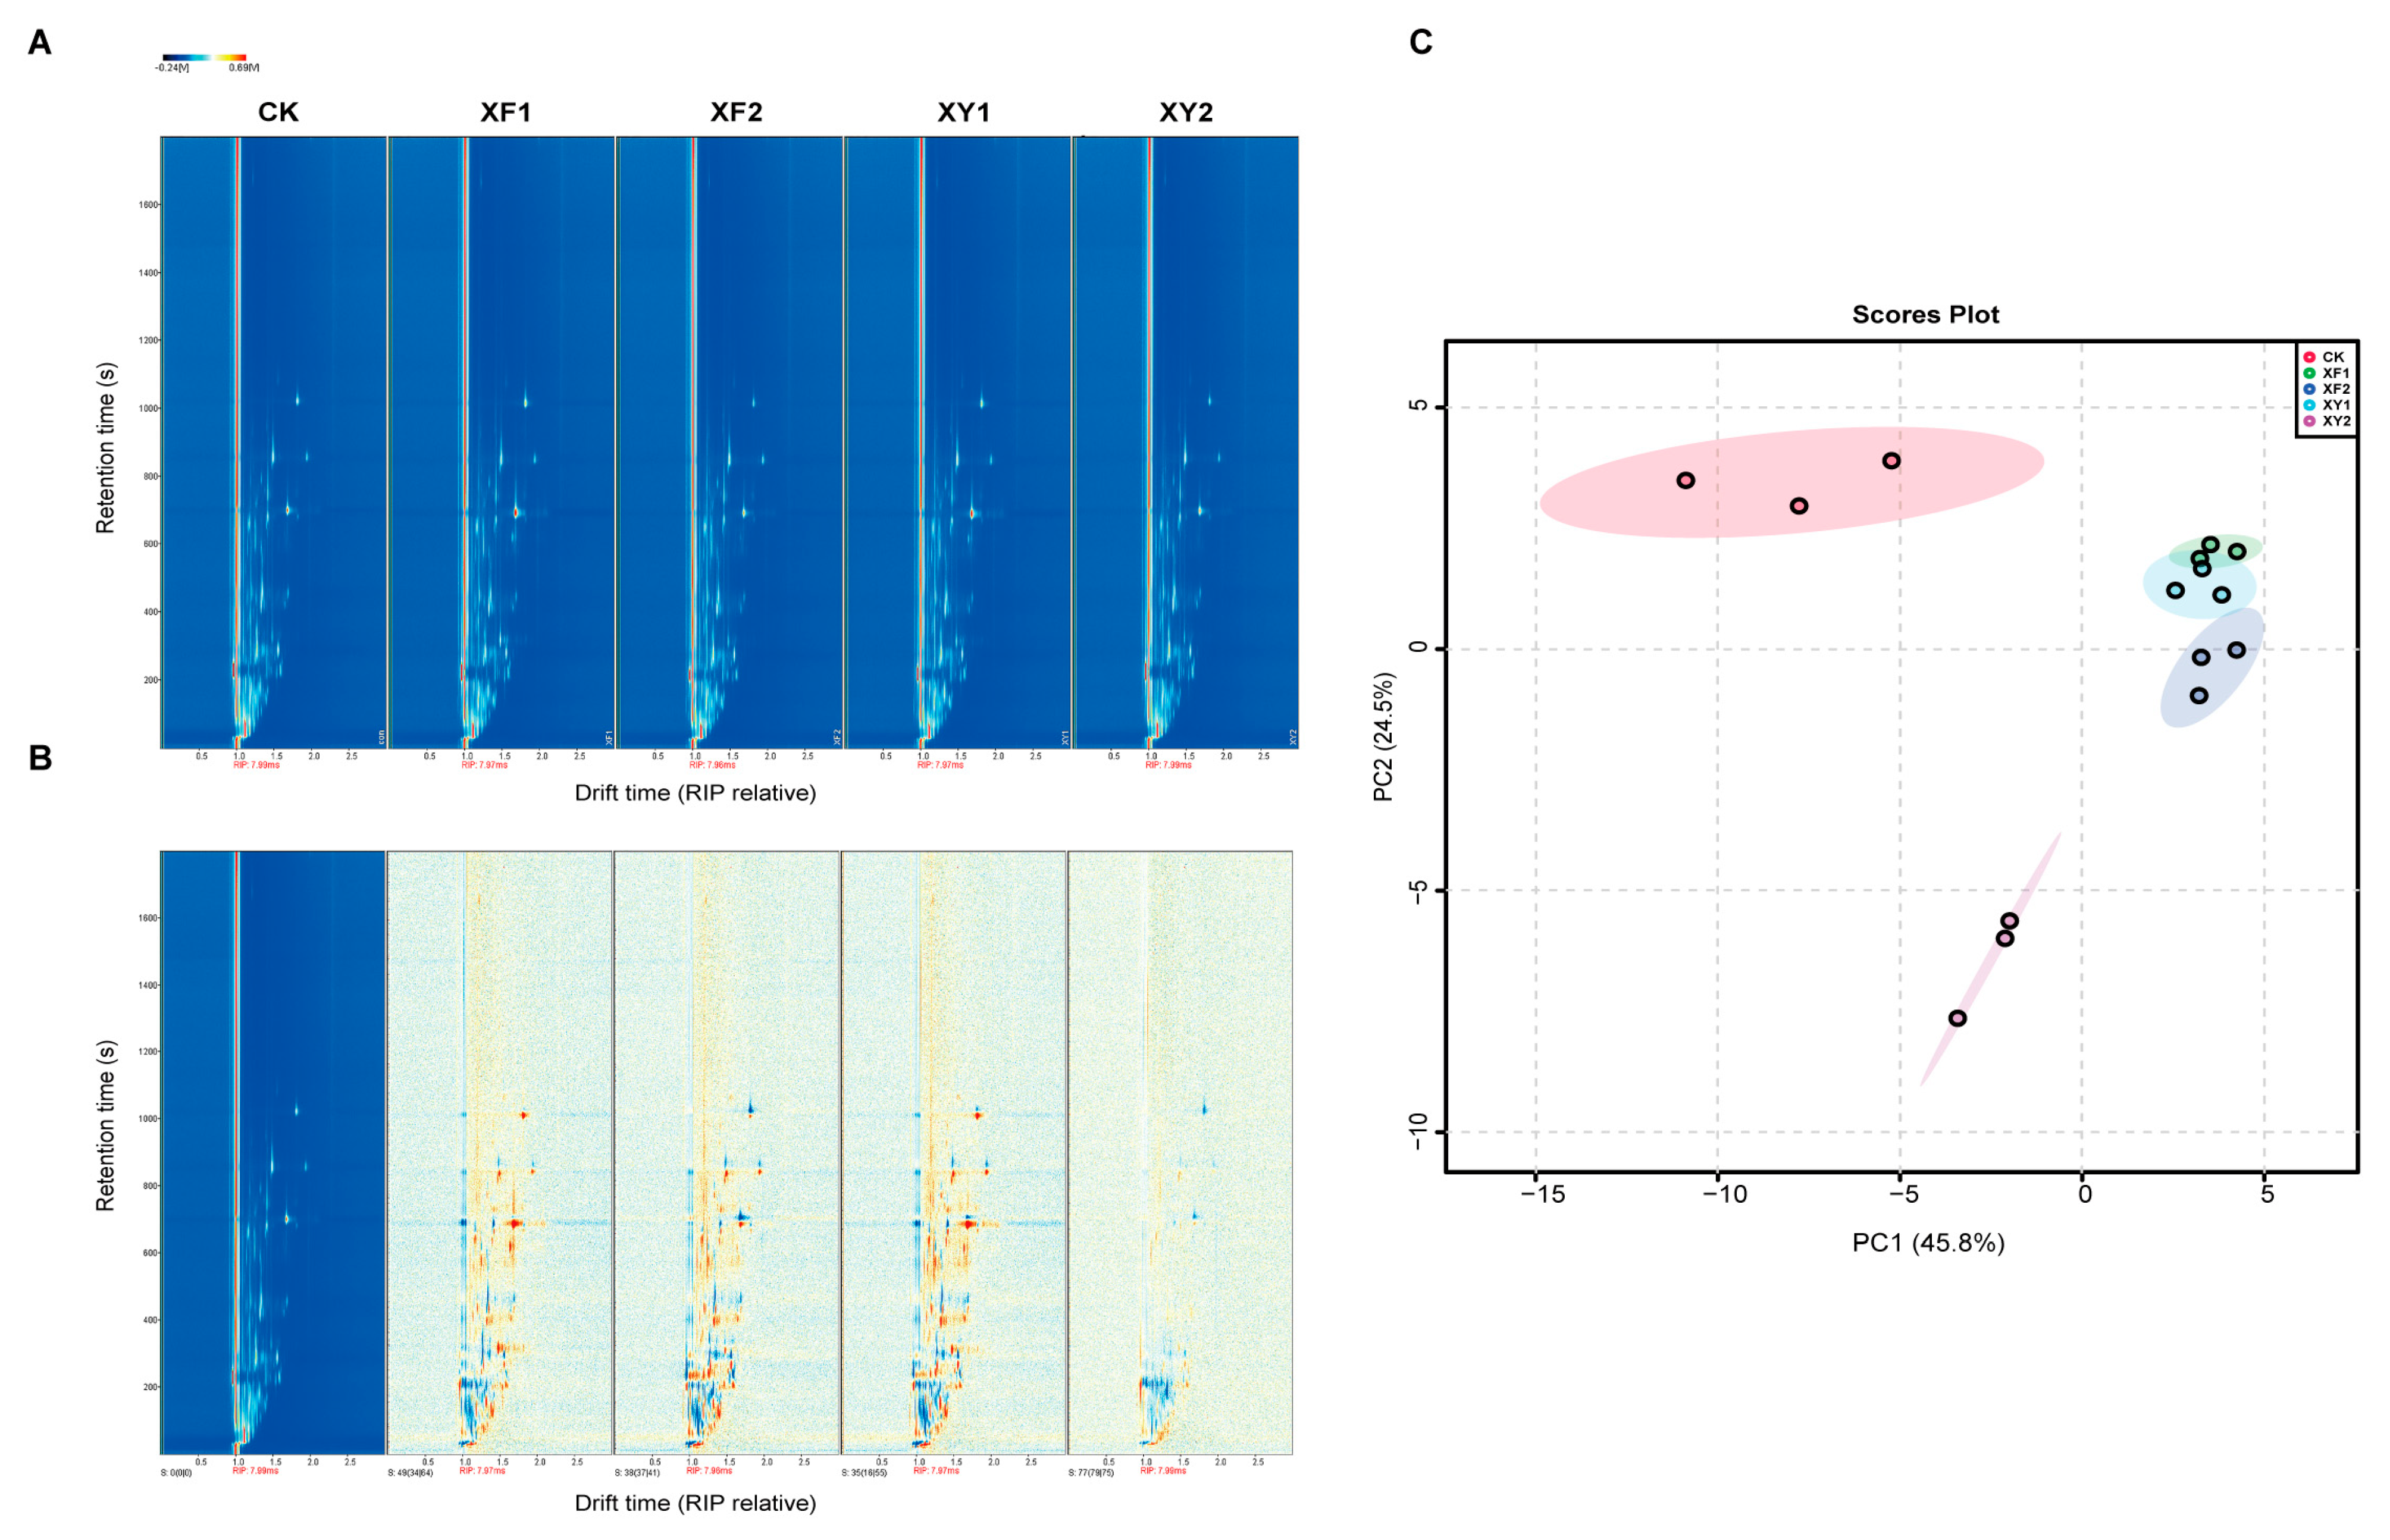
It has been reported that VOCs are mainly distributed in the aleurone layer of brown rice [22]. To study the effect of SeNPs on the VOCs of brown rice, the differences and changes in VOCs were analyzed and their fingerprints in different Se treatment groups and CK were characterized by HS-GC-IMS. The top view plot of HS-GC-IMS (Figure 4A) was obtained by qualitative analysis of each compound from Se treatment groups based on the ion drift time and ion peak strength. The transverse and longitudinal axes represent the ion drift time and retention time after normalization, respectively. The whole spectrum represents the total VOCs, and each point of the reaction ion peak indicates one type of VOC detected from the samples. As shown in Figure 4B, the differences in VOCs between samples from different treatment groups can be reflected by the position, quantity, strength, and drift time of ion peaks. The retention time of most VOCs was between 100 s and 1000 s, and the drift time was mainly between 1.0 and 2.0 s. A PCA analysis was conducted to further evaluate the consistency of the samples. As shown in Figure 4C, the first and second principal components could account for 45.8% and 24.5% of the total variance, respectively. The CK samples were separated from those of the Se treatment groups. In addition, XF1, XF2, and XY1 were relatively close, while XY2 seemed to be independent of other Se treatment samples. These results indicated that VOCs are considerably different between the CK- and Se-treated rice samples, and a low Se concentration might have a positive impact on rice VOC strength, while Se at high concentrations may have a negative impact.
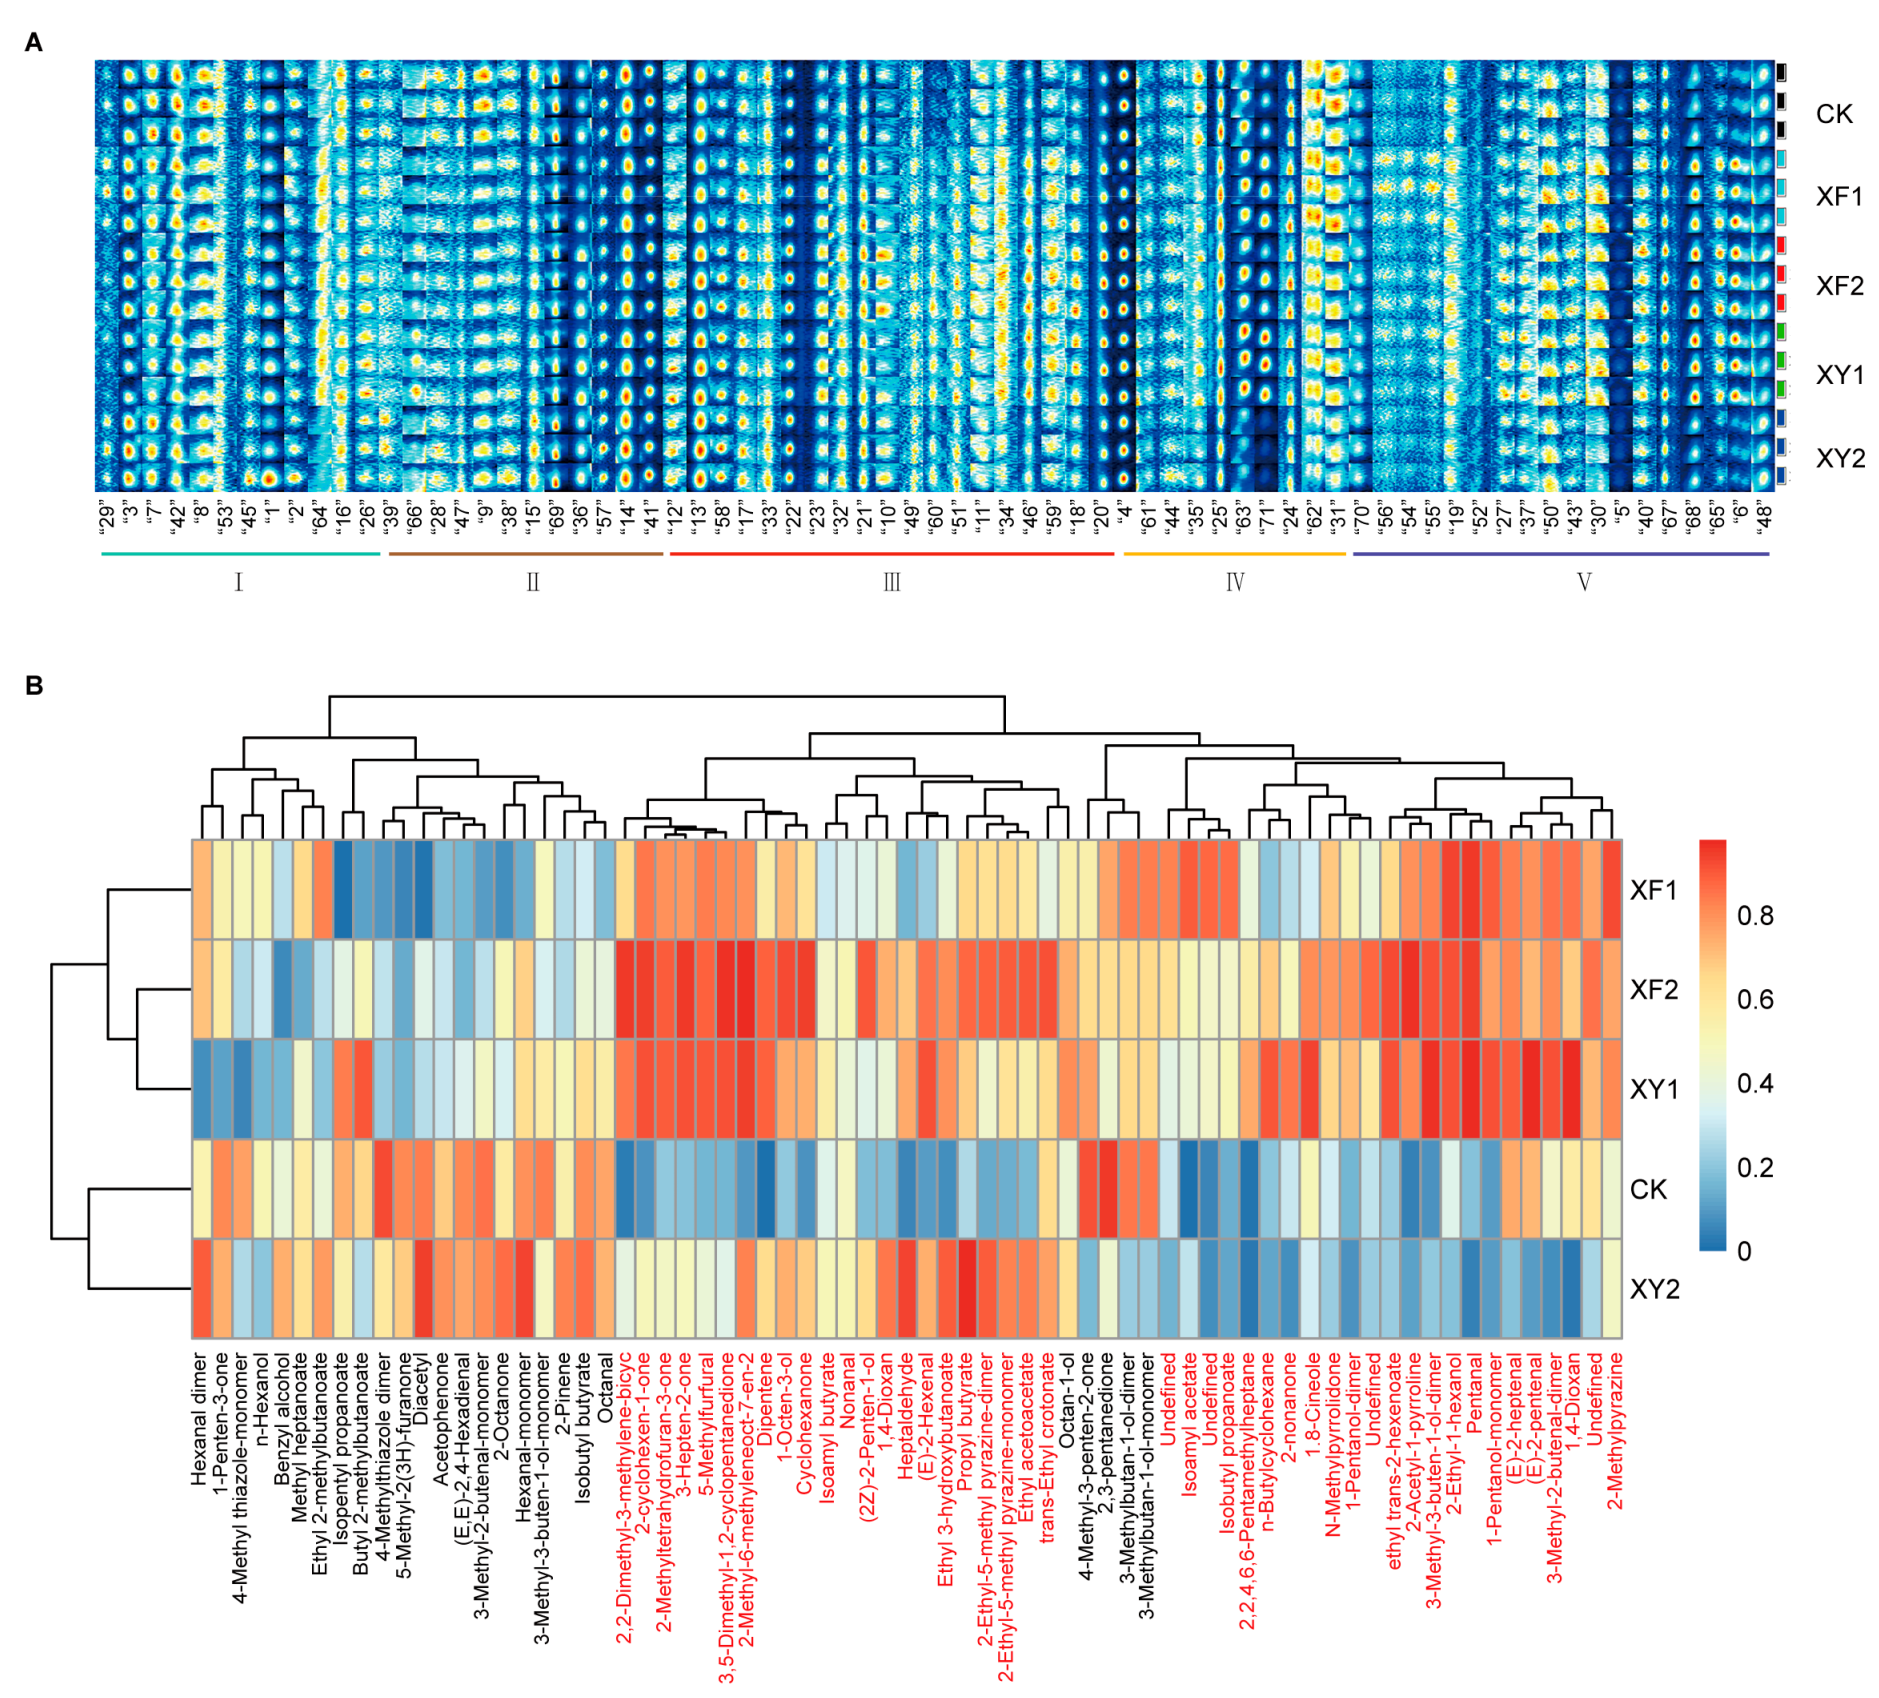
To determine the specific differences in VOCs between the CK and Se treatment groups, a hierarchical cluster analysis was performed to determine whether different SeNPs fertilizers or different Se concentrations could be categorized through VOCs and whether the VOCs could be clustered into different groups; moreover, all ion peaks from different clustered groups were selected for fingerprint analysis (Figure 4A,B). As shown in Figure 4A, each row represents a tested sample and each column indicates the signal peak of the same VOC detected in different samples. The color extent of each dot in the fingerprint indicates the relative content of the VOC, with a darker color representing a higher content. In the fingerprint, all VOCs are represented by numbers, and some VOCs were detected as monomers and some as dimers. As shown in Table 1 and Figure 4A, a total of 60 VOCs were detected, including 11 alcohols, 11 aldehydes, 13 esters, 14 ketones, 6 heterocyclic compounds and 5 hydrocarbons. However, four VOCs were not identified in the ion mobility library (numbered 19, 24, 54, and 70; listed in Table 1). Ketones and esters were the most widely detected VOCs. As shown in Figure 5A, each of the areas (from Ⅰ to Ⅴ) represents the characteristic VOCs of the Se treatments. The peak intensities of VOCs in area Ⅰ showed no significant difference between Se treatment groups and the CK. In area Ⅱ, the VOC peak intensity became weaker in low Se treatment groups but stronger in high Se treatment groups. In area Ⅳ, the VOC peak intensity remained stable in low-Se treatment groups but became weaker in high-Se treatment groups compared with that of the CK. The VOCs exhibited different changing tendencies between different Se-treatment groups in area Ⅱ and Ⅳ. In both area Ⅲ and area Ⅴ, the contents of all VOCs in the Se-treatment groups were higher than those in the CK. The difference is that all Se-treatment groups had higher VOC contents than the CK in area Ⅲ; however, in area Ⅴ, low Se treatment groups had higher VOC contents than the CK, while high Se treatment group (XY2) showed almost no difference in VOC contents from the CK. As shown in Figure 5A and Table 1, many VOCs were present in different concentrations, with the generation of several signals, which represent the formation of corresponding monomers and dimers. These VOCs had a similar retention time but different drift time. As shown in Figure 5B, the contents of most VOCs increased under Se application, and it is notable that the high-Se-treatment group (XY2) had significantly lower contents of VOCs than low-Se-treatment groups. In our study, the peak intensity of 2-AP was stronger in XF1, XF2, and XY1 than in the CK, but turned weaker in the high-Se-treatment group XY2. These results are consistent with the previous finding that appropriate low-Se application could enhance the content of 2-AP and its precursor’s biosynthesis in fragrant rice [23].
Alcohols can confer pleasant aromas such as sweet, floral, or fruity aromas to rice. Aldehydes are associated with lipid breakdown products that can contribute to different flavors such as grassy and fatty flavors. In addition, ketones can confer pleasant aromas such as banana-like, fruity, and nutty aromas to rice [35]. Figure 5B shows that more than half of alcohols, esters, aldehydes, heterocyclic compounds, and ketones were increased by different Se treatments (VOCs indicated by red font). For example, the signal intensities of 2-AP, 1-octen-3-ol, pentanol, 3-methylbantan-1-ol, 5-methyl furfural, 2-Ethyl-5-methyl pyrazine, and 2-methylpyrazine in Se treatment groups were higher than those in the CK. The compound 2-AP has been recognized as a characteristic volatile compound in aromatic rice and confers a popcorn-like aroma to rice [22]. It has been reported that 1-octen-3-ol has quite a low odor threshold and plays an important role in rice flavor, and is the most abundant volatile alcohol in rice with a strong earthy, sweet, and herbaceous flavor [36]. Pentanol with a woody and fruity flavor can positively influence rice flavor [37]. The compound 3-methylbantan-1-ol present in wheat flour has a malt flavor [38], and 5-methyl furfural and 2-methylpyrazine are the main flavor compounds in roasted brown rice [22]. All these results indicated that the appropriate application of Se at low concentrations can enhance the formation of many VOCs to confer pleasant aromas to rice grains. VOCs are mainly composed of lipid oxidation products [39]. Interestingly, the VOC peak intensities were consistent with the lipid contents under different Se treatments. Hence, it can be inferred that SeNPs fertilizer application may improve rice aroma by promoting lipid synthesis.

4. Conclusions

This study used two SeNPs fertilizers at five Se concentrations to evaluate the influence of SeNPs fertilizers on some rice agricultural traits, such as the contents of Se and microelements, eating and cooking quality, and aroma of rice grains. The results showed that various SeNPs fertilizers and Se concentrations significantly affect the agricultural traits of rice grains. The eating and cooking quality, except for fatty-acid content, seemed to be insensitive to different Se treatments. Moreover, it was observed that a low concentration of Se could enhance the rice grain quality and VOCs while a high Se concentration would increase heavy-metal accumulation and decrease the aroma of rice grains. XY1 treatment exhibited the highest Se enriching efficiency and relatively lower risks of heavy-metal accumulation, with a moderate organic Se and total Se ratio. Overall, the foliar application of SeNPs fertilizer at moderate concentration could improve the rice quality. These findings suggest an economic and resource-saving way to improve both Se contents and rice grain qualities.

Supplementary Materials

The following supporting information can be downloaded at: https://www.mdpi.com/article/10.3390/su151310553/s1, Table S1: The basic chemical properties of test rice grain.

Author Contributions

Conceptualization, D.X., A.Y. and S.C. (Shuiyuan Cheng); methodology, X.Z. and S.C. (Shaoyu Chen); investigation, X.T. and T.Q.; formal analysis, Y.X., X.T. and T.Q.; writing—original draft preparation, Y.X.; writing—review and editing, M.W. and D.X.; funding acquisition, X.C. and Y.X. All authors have read and agreed to the published version of the manuscript.

Funding

This work was supported by grants from Hubei Key Laboratory of Food Crop Germplasm and Genetic Improvement (2020lzjj05); School of Modern Industry for Selenium Science and Engineering, Wuhan Polytechnic University (Se1-202111) and Scientific Research Program of Education Department of Hubei Province (Q20221613).

Institutional Review Board Statement

The study did not involve humans or animals.

Informed Consent Statement

The study did not involve humans or animals.

Data Availability Statement

Data will be made available on request.

Conflicts of Interest

The authors declare no conflict of interest.

References

  1. Rayman, M.P. The argument for increasing selenium intake. Proc. Nutr. Soc. 2002, 61, 203–215. [Google Scholar] [CrossRef] [PubMed]
  2. Blazina, T.; Sun, Y.; Voegelin, A.; Lenz, M.; Berg, M.; Winkel, L.H.E. Terrestrial selenium distribution in China is potentially linked to monsoonal climate. Nat. Commun. 2014, 5, 4717. [Google Scholar] [CrossRef] [PubMed] [Green Version]
  3. White, P.J.; Broadley, M.R. Biofortification of crops with seven mineral elements often lacking in human diets—Iron, zinc, copper, calcium, magnesium, selenium and iodine. New Phytol. 2009, 182, 49–84. [Google Scholar] [CrossRef] [PubMed]
  4. Li, S.; Xiao, T.; Zheng, B. Medical geology of arsenic, selenium and thallium in China. Sci. Total Environ. 2012, 421–422, 31–40. [Google Scholar] [CrossRef]
  5. Lucca, P.; Poletti, S.; Sautter, C. Genetic engineering approaches to enrich rice with iron and vitamin A. Physiol. Plant. 2006, 126, 291–303. [Google Scholar] [CrossRef]
  6. Williams, P.N.; Lombi, E.; Sun, G.; Scheckel, K.; Zhu, Y.; Feng, X.; Zhu, J.; Carey, A.; Adomako, E.; Lawgali, Y.; et al. Selenium Characterization in the Global Rice Supply Chain. Environ. Sci. Technol. 2009, 43, 6024–6030. [Google Scholar] [CrossRef]
  7. Kikkert, J.; Hale, B.; Berkelaar, E. Selenium accumulation in durum wheat and spring canola as a function of amending soils with selenite, selenate and or sulphate. Plant Soil 2013, 372, 629–641. [Google Scholar] [CrossRef]
  8. Longchamp, M.; Angeli, N.; Castrec-Rouelle, M. Selenium uptake in Zea mays supplied with selenate or selenite under hydroponic conditions. Plant Soil 2013, 362, 107–117. [Google Scholar] [CrossRef]
  9. Stroud, J.L.; Broadley, M.R.; Foot, I.; Fairweather-Tait, S.J.; Hart, D.J.; Hurst, R.; Knott, P.; Mowat, H.; Norman, K.; Scott, P.; et al. Soil factors affecting selenium concentration in wheat grain and the fate and speciation of Se fertilisers applied to soil. Plant Soil 2010, 332, 19–30. [Google Scholar] [CrossRef]
  10. Ros, G.H.; van Rotterdam, A.M.D.; Bussink, D.W.; Bindraban, P.S. Selenium fertilization strategies for bio-fortification of food: An agro-ecosystem approach. Plant Soil 2016, 404, 99–112. [Google Scholar] [CrossRef]
  11. Danso, O.P.; Asante-Badu, B.; Zhang, Z.; Song, J.; Wang, Z.; Yin, X.; Zhu, R. Selenium Biofortification: Strategies, Pro-gress and Challenges. Agriculture 2023, 13, 416. [Google Scholar] [CrossRef]
  12. Hartikainen, H. Biogeochemistry of selenium and its impact on food chain quality and human health. J. Trace Elem. Med. Biol. 2005, 18, 309–318. [Google Scholar] [CrossRef]
  13. Wang, Q.; Yu, Y.; Li, J.; Wan, Y.; Huang, Q.; Guo, Y.; Li, H. Effects of Different Forms of Selenium Fertilizers on Se Accumulation, Distribution, and Residual Effect in Winter Wheat–Summer Maize Rotation System. J. Agric. Food Chem. 2017, 65, 1116–1123. [Google Scholar] [CrossRef]
  14. Kumar, A.; Prasa, K.S. Role of Nano-Selenium in health and environment. J. Biotechnol. 2021, 325, 152–163. [Google Scholar]
  15. Pilon-Smits, E.A.; Quinn, C.F.; Tapken, W.; Malagoli, M.; Schiavon, M. Physiological functions of beneficial elements. Curr. Opin. Plant Biol. 2009, 12, 267–274. [Google Scholar] [CrossRef]
  16. El-Badri, A.M.; Hashem, A.M.; Batool, M.; Sherif, A.; Nishawy, E.; Ayaad, M.; Hassan, H.M.; Elrewainy, I.M.; Wang, J.; Kuai, J.; et al. Comparative efficacy of bio—Selenium nanoparticles and sodium selenite on morpho—Physiochemical attributes under normal and salt stress conditions, besides selenium detoxification pathways in Brassica napus L. J. Nanobiotechnol. 2022, 20, 163. [Google Scholar] [CrossRef]
  17. Silva, M.A.; de Sousa, G.F.; Corguinha, A.P.B.; de Lima Lessa, J.H.; Dinali, G.S.; Oliveira, C.; Lopes, G.; Amaral, D.; Brown, P.; Guilherme, L.R.G. Selenium biofortification of soybean genotypes in a tropical soil via Se-enriched phosphate fertilizers. Front. Plant Sci. 2022, 13, 988140. [Google Scholar] [CrossRef]
  18. Hossain, A.; Skalicky, M.; Brestic, M.; Maitra, S.; Sarkar, S.; Ahmad, Z.; Vemuri, H.; Garai, S.; Mondal, M.; Bhatt, R.; et al. Selenium Biofortification: Roles, Mechanisms, Responses and Prospects. Molecules 2021, 26, 881. [Google Scholar] [CrossRef]
  19. Lidon, F.C.; Oliveira, K.; Ribeiro, M.M.; Pelica, J.; Pataco, I.; Ramalho, J.C.; Leitão, A.E.; Almeida, A.S.; Campos, P.S.; Ribeiro-Barros, A.I.; et al. Selenium biofortification of rice grains and implications on macronutrients quality. J. Cereal Sci. 2018, 81, 22–29. [Google Scholar] [CrossRef]
  20. Pokhrel, G.R.; Wang, K.T.; Zhuang, H.; Wu, Y.; Chen, W.; Lan, Y.; Zhu, X.; Li, Z.; Fu, F.; Yang, G. Effect of selenium in soil on the toxicity and uptake of arsenic in rice plant. Chemosphere 2020, 239, 124712. [Google Scholar] [CrossRef]
  21. Wu, Z.; Xu, S.; Shi, H.; Zhao, P.; Liu, X.; Li, F.; Deng, T.; Du, R.; Wang, X.; Wang, F. Comparison of foliar silicon and selenium on cadmium absorption, compartmentation, translocation and the antioxidant system in Chinese flowering cabbage. Ecotox. Environ. Saf. 2018, 166, 157–164. [Google Scholar] [CrossRef] [PubMed]
  22. Hu, X.; Lu, L.; Guo, Z.; Zhu, Z. Volatile compounds, affecting factors and evaluation methods for rice aroma: A review. Trends Food Sci. Technol. 2020, 97, 136–146. [Google Scholar] [CrossRef]
  23. Luo, H.; He, L.; Du, B.; Pan, S.; Mo, Z.; Duan, M.; Tian, H.; Tang, X. Biofortification with chelating selenium in fragrant rice: Effects on photosynthetic rates, aroma, grain quality and yield formation. Field Crop. Res. 2020, 255, 107909. [Google Scholar] [CrossRef]
  24. Vanavichit, A.; Yoshihashi, T. Molecular Aspects of Fragrance and Aroma in Rice. In Advances in Botanical Research; Academic Press: Cambridge, MA, USA, 2010; pp. 49–73. [Google Scholar]
  25. NY/T 2639-2014; Determination of Amylose Content in Rice–Spectrophotometry Method. China Standard Press: Beijing, China, 2014.
  26. NY/T 83-2017; Determination of Rice Quality. China Standard Press: Beijing, China, 2017.
  27. Zhang, L.; Song, H.; Guo, Y.; Fan, B.; Huang, Y.; Mao, X.; Liang, K.; Hu, Z.; Sun, X.; Fang, Y.; et al. Benefit–risk assessment of dietary selenium and its associated metals intake in China (2017–2019): Is current selenium-rich agro-food safe enough? J. Hazard. Mater. 2020, 398, 123224. [Google Scholar] [CrossRef] [PubMed]
  28. GB/T 22499-2008; Rich Selenium Paddy. China Standard Press: Beijing, China, 2008.
  29. GB 2762-2017; Food Safety National Standard Food Pollutant Limits. China Standard Press: Beijing, China, 2017.
  30. Hu, Y.; Norton, G.J.; Duan, G.; Huang, Y.; Liu, Y. Effect of selenium fertilization on the accumulation of cadmium and lead in rice plants. Plant Soil 2014, 384, 131–140. [Google Scholar] [CrossRef]
  31. Liao, G.; Xu, Y.; Chen, C.; Wu, Q.; Feng, R.; Guo, J.; Wang, R.; Ding, Y.; Sun, Y.; Xu, Y.; et al. Root application of selenite can simultaneously reduce arsenic and cadmium accumulation and maintain grain yields, but show negative effects on the grain quality of paddy rice. J. Environ. Manag. 2016, 183, 733–741. [Google Scholar] [CrossRef] [Green Version]
  32. Rayman, M.P. Food-chain selenium and human health: Emphasis on intake. Br. J. Nutr. 2008, 100, 254–268. [Google Scholar] [CrossRef] [Green Version]
  33. Farooq, M.U.; Tang, Z.; Zeng, R.; Liang, Y.; Zhang, Y.; Zheng, T.; Ei, H.H.; Ye, X.; Jia, X.; Zhu, J. Accumulation, mobilization and transformation of selenium in rice grain provided with foliar sodium selenite. J. Sci. Food Agric. 2019, 99, 2892–2900. [Google Scholar] [CrossRef]
  34. Yoon, M.; Lee, S.; Kang, M. The lipid composition of rice cultivars with different eating qualities. J. Korean Soc. Appl. Biol. Chem. 2012, 55, 291–295. [Google Scholar] [CrossRef]
  35. Bryant, R.J.; Mcclung, A.M. Volatile profiles of aromatic and non-aromatic rice cultivars using SPME/GC–MS. Food Chem. 2011, 124, 501–513. [Google Scholar] [CrossRef]
  36. Jia, M.; Wang, X.; Liu, J.; Wang, R.; Wang, A.; Strappe, P.; Shang, W.; Zhou, Z. Physicochemical and volatile characteristics present in different grain layers of various rice cultivars. Food Chem. 2022, 371, 131119. [Google Scholar] [CrossRef]
  37. Xia, Q.; Mei, J.; Yu, W.; Li, Y. High hydrostatic pressure treatments enhance volatile components of pre-germinated brown rice revealed by aromatic fingerprinting based on HS-SPME/GC–MS and chemometric methods. Food Res. Int. 2017, 91, 103–114. [Google Scholar] [CrossRef]
  38. Sahin, B.; Schieberle, P. Effect of texture modification by ascorbic acid and monoglycerides on the release of aroma compounds from fresh and aged wheat dumplings. Eur. Food Res. Technol. 2020, 246, 1–11. [Google Scholar] [CrossRef]
  39. Xi, L.; Zhang, J.; Wu, R.; Wang, T.; Ding, W. Characterization of the Volatile Compounds of Zhenba Bacon at Different Process Stages Using GC-MS and GC-IMS. Foods 2021, 10, 2869. [Google Scholar] [CrossRef]
Figure 1. Effects of different Se treatments on Se (A), Cd (B), Pb (C), As (D), Cr (E) and Zn (F) contents in brown and polished rice. Significant differences in the mean values of brown and polished rice are indicated by different lowercase letters based on the SNK test (p < 0.05, n = 3).
Sustainability 15 10553 g001
Figure 2. Se content (A,B) and the percentage of organic and inorganic Se in brown and polished rice (C,D) under different Se treatments. Significant differences in the contents of organic and inorganic Se and percentage of organic Se in brown and polished rice are indicated by different lowercase letters based on the SNK test (p < 0.05, n = 3).
Sustainability 15 10553 g002
Figure 3. Effects of different Se treatments on different rice fatty acid contents. Significant differences in the mean value of different rice fatty acids contents are indicated by different lowercase letters based on the SNK test (p < 0.05, n = 3).
Sustainability 15 10553 g003
Figure 4. Analysis of volatile compounds detected by headspace-gas chromatography-ion mobility spectrometry (HS-GC-IMS) in brown rice under different Se treatment groups. (A) Topographic plot of HS-GC-IMS spectra of the selected markers obtained for different Se treatment groups and CK. (B) HS-GC-IMS plot in difference comparison mode of brown rice from different Se treatment groups; (C) PCA of volatile compounds detected in brown rice from different Se treatment groups and CK.
Sustainability 15 10553 g004
Figure 5. Fingerprint and cluster analysis of volatile compounds detected in brown rice under different Se treatments. (A) Fingerprint of volatile compounds detected in brown rice from different Se treatment groups and CK; and (B) cluster analysis of volatile compounds detected in brown rice from different Se treatment groups and CK.
Sustainability 15 10553 g005
Table 1. Qualitative results of volatile organic compounds detected in brown rice under different Se treatments.
CountCompoundCASFormulaMWRIRTDTComment
1Isoamyl butyrate106-27-4C9H18O2158.21064853.8741.9382
2Methyl heptanoate106-73-0C8H16O2144.21018.3680.3961.8108
3Hexanal66-25-1C6H12O100.2786.8228.4271.5821dimer
36Hexanal66-25-1C6H12O100.2808.9259.4081.2509monomer
4trans-Ethyl crotonate623-70-1C6H10O2114.1827.9286.8871.5509
51-Pentanol71-41-0C5H12O88.1775.8213.4141.5338dimer
481-Pentanol71-41-0C5H12O88.1748.2177.2711.2013monomer
6Pentanal110-62-3C5H10O86.1722.9147.2981.3868
71-Penten-3-one1629-58-9C5H8O84.1677.7106.0941.3288
84-Methylthiazole693-95-8C4H5NS99.2826.5284.7211.3405monomer
94-Methylthiazole693-95-8C4H5NS99.2830.1290.0331.3652dimer
10(2Z)-2-Penten-1-ol1576-95-0C5H10O86.1787.1228.9491.4685
112-Methyltetrahydrofuran-3-one3188-00-9C5H8O2100.1797.5243.3781.4306
12(E)-2-Hexenal6728-26-3C6H10O98.1818.2272.7181.5168
13Heptaldehyde111-71-7C7H14O114.2910.1416.531.3216
14Isobutyl butyrate539-90-2C8H16O2144.2929.5451.761.3428
152-Octanone111-13-7C8H16O128.2989.5589.9161.3249
16Isopentyl propanoate105-68-0C8H16O2144.2976.5554.7081.3449
17Propyl butyrate105-66-8C7H14O2130.2926445.0351.2609
183-Hepten-2-one1119-44-4C7H12O112.2934.7461.5351.2217
19Undefined 901.1401.099981.233
202,2-Dimethyl-3-methylene-bicyc79-92-5C10H16136.2926444.9671.1926
211-Octen-3-ol3391-86-4C8H16O128.2989.6590.4461.1544
222-Ethyl-5-methyl pyrazine13360-64-0C7H10N2122.21010.2653.2651.1705dimer
232-Ethyl-5-methyl pyrazine13360-64-0C7H10N2122.21008.2646.7011.159monomer
24Undefined 1013.9665.699951.251
25(E)-2-heptenal18829-55-5C7H12O112.2986.1580.2191.2515
26butyl 2-methylbutanoate15706-73-7C9H18O2158.21039.6757.9591.3794
27n-butylcyclohexane1678-93-9C10H20140.31030.1722.6351.2553
28(E,E)-2,4-hexadienal142-83-6C6H8O96.1934460.231.4368
29Ethyl 2-methylbutanoate7452-79-1C7H14O2130.2822.2278.4651.6455
303-methyl-2-butenal107-86-8C5H8O84.1724148.5521.3534dimer
663-methyl-2-butenal107-86-8C5H8O84.1761.7194.5011.0746monomer
313-Methylbutan-1-ol123-51-3C5H12O88.1719.2143.2821.2566dimer
623-Methylbutan-1-ol123-51-3C5H12O88.1718142.0171.2366monomer
32cyclohexanone108-94-1C6H10O98.1879.2365.1331.1492
33ethyl acetoacetate141-97-9C6H10O3130.1928448.8841.1533
345-methylfurfural620-02-0C6H6O2110.1962.3520.2241.1213
354-Methyl-3-penten-2-one141-79-7C6H10O98.1812.2264.1371.1225
372-nonanone821-55-6C9H18O142.21087.4950.1521.4029
38Acetophenone98-86-2C8H8O120.21064.4855.4131.5693
39Benzyl alcohol100-51-6C7H8O108.11018.4680.9521.5018
40N-Methylpyrrolidone872-50-4C5H9NO99.11037.6750.051.45
41Octanal124-13-0C8H16O128.21018679.571.413
422,3-pentanedione600-14-6C5H8O2100.1673.6103.2621.22
432-ethyl-1-hexanol104-76-7C8H18O130.21038.6754.1351.8008
44octan-1-ol111-87-5C8H18O130.21064.5855.8431.8772
45nonanal124-19-6C9H18O142.211211090.6631.5465
463,5-Dimethyl-1,2-cyclopentanedione13494-07-0C7H10O2126.21047786.2281.1852
475-Methyl-2(3H)-furanone591-12-8C5H6O298.1862.9339.4541.3641
491,4-cineole470-67-7C10H18O154.31013.8665.4491.3233
502-Methylpyrazine109-08-0C5H6N294.1831.3291.7821.3955
512-Methyl-6-methyleneoct-7-en-253219-21-9C10H20O156.31055.9821.081.2213
522,2,4,6,6-Pentamethylheptane13475-82-6C12H26170.3986.9582.671.3742
53n-Hexanol111-27-3C6H14O102.2866.4344.9231.2998
54Undefined 847.7316.259981.821
55isobutyl propanoate540-42-1C7H14O2130.2845.9313.611.6972
56Isoamyl acetate123-92-2C7H14O2130.2848.4317.3111.755
572-pinene80-56-8C10H16136.2928.2449.1461.6811
58ethyl 3-hydroxybutanoate5405-41-4C6H12O3132.2910.8417.6911.6381
592-cyclohexen-1-one930-68-7C6H8O96.1910.8417.6931.3949
60Dipentene138-86-3C10H16136.21041.7765.6651.2225
611,8-Cineole470-82-6C10H18O154.31038.9755.1681.2943
63(E)-2-pentenal1576-87-0C5H8O84.1744.5172.6011.1206
683-Methyl-3-buten-1-ol763-32-6C5H10O86.1739.6166.5671.1768dimer
643-Methyl-3-buten-1-ol763-32-6C5H10O86.1750.6180.2951.1522monomer
652-Acetyl-1-pyrroline85213-22-5C6H9NO111.1918.4431.2571.1311
67ethyl trans-2-hexenoate27829-72-7C8H14O2142.21047.6788.3271.332
69diacetyl431-03-8C4H6O286.1621.174.71.1768
70Undefined 914.7424.621.373
711,4-Dioxan123-91-1C4H8O288.1726.1150.81.3232
MW represents molecular mass; RI indicates the retention index; RT stands for the retention time; DT represents the drift time.
Disclaimer/Publisher’s Note: The statements, opinions and data contained in all publications are solely those of the individual author(s) and contributor(s) and not of MDPI and/or the editor(s). MDPI and/or the editor(s) disclaim responsibility for any injury to people or property resulting from any ideas, methods, instructions or products referred to in the content.