Abstract
Organic agriculture is considered an important component of sustainable development because it promotes environmental sustainability and social responsibility, involving the use of practices that minimize the negative impact of agriculture on the environment and human health. Through this research, we aim to gain a more comprehensive understanding of the current state of and perspectives on specific indicators of organic agriculture from the perspective of the SDGs assumed by EU member countries in the context of the implementation of the 2030 Agenda for Sustainable Development. Based on Eurostat data covering the timeframe from 2008 to 2021, an ARIMA model was used to analyze the data and forecast trends in the selected indicators until 2030. The results of this unique study provide relevant information on the indicators and countries for which positive developments are expected up to 2030, as opposed to those indicators for which mixed or negative developments are forecast. The findings of this research empower policymakers, researchers, and other stakeholders to identify possible negative developments and take appropriate corrective action, with the aim of achieving the goals proposed in the 2030 Agenda for Sustainable Development.
1. Introduction
This research focuses on organic agriculture in the context of the implementation of the UN’s 2030 Agenda for Sustainable Development [1], which is today one of the most relevant global strategies for the sustainable development of society in the medium and long term. The 2030 Agenda promotes a different way of being for the planet and a different way of being in the 21st century, which has been marked by profound, radical changes, uncertainties, and dangers, as well as opportunities created in particular by the unprecedented development of information and telecommunication technologies.
We are thus witnessing major global changes, often unintentional, which are generating a different way of conducting all human activities, as well as a different lifestyle that profoundly influences existence on the planet and society. In light of these major and profound changes and global constraints linked in particular to global warming, the limitation of natural resources, and global population growth, the implementation of the 2030 Agenda in all countries of the world is not only a necessity but is our only chance to reduce environmental imbalances that seem to be increasingly aggressive and profound.
The 2030 Agenda aims to support the successful implementation of the 17 Sustainable Development Goals (SDGs), which encompass various aspects of global sustainability and wellbeing. However, significant disparities persist among countries worldwide. These disparities stem from contrasting economic conditions, as well as political and social contexts, which hinder the ability of economic systems to achieve their intended outcomes. Consequently, each country’s response to the intricate challenges associated with the SDGs’ implementation and the attainment of these targets by 2030 differs both temporally and spatially. Moreover, the areas targeted for change or transformation, often requiring radical shifts, vary across nations.
The 2030 Agenda and Organic Agriculture
The transition to organic and sustainable food production, aimed at meeting the needs of a global population of eight billion people, presents challenges amidst economic and political controversies [2]. Balancing the daily demand for food with a transformative vision requires us to address ecological footprints, responsible resource allocation, and equitable access. The efficient management of land, water, energy, and inputs is crucial for long-term sustainability and minimizing environmental impacts. Furthermore, promoting the fair distribution and availability of sustainably produced food ensures food justice and mitigates disparities. This complex transition necessitates comprehensive strategies that consider economic, political, ecological, and social dimensions to create a just and sustainable future.
While the augmentation of agricultural production is commonly perceived as a favorable economic and social pursuit, it regrettably carries numerous adverse implications within the framework of sustainable development. These repercussions primarily encompass soil degradation, biodiversity depletion, water and soil contamination, escalated greenhouse gas emissions, and other associated costs. Consequently, the sustainability of ecosystems and the future fertility of our planet are at risk. Consequently, the establishment and execution of investment strategies focused on organic food and farming are crucial. Long-term sustainable investment projects are needed to bolster the objectives outlined in the 2030 Agenda, as supported by scholarly sources [3,4,5].
The widespread adoption of sustainable agricultural practices in 191 countries has led to over 76 million hectares of agricultural land being managed organically by at least 3.7 million farmers as well as organic food and beverage sales reaching nearly €125 billion in 2021. However, it is important to note that these figures do not demonstrate a satisfactory level of implementation. These statistics account for less than 10% of the total global agricultural production, with significant variations observed across different regions and countries [5,6,7]. Therefore, it can be emphasized that the sustainability of the planet and of people’s lives is closely linked to the implementation of measures that converge towards the 2030 Agenda, because it supports through its Sustainable Development Goals (SDGs) the large-scale promotion of organic agriculture as an essential condition for wellbeing, quality of life, and environmental protection as well as the reduction in climate imbalances [1,8].
Based on these general considerations, the objective of this research is to gain a more comprehensive understanding of the current state of sustainable development and the dynamics of organic agriculture. We aim to contribute to closing the knowledge gap by assessing the progress made by EU countries towards the SDGs, in particular with regard to indicators belonging to SDG 2, SDG 6, SDG 13, SDG 14, and SDG 15.
The present research approaches organic agriculture from the perspective of its contribution to achieving the SDGs, opening new directions of action for the organisms directly involved in food production processes. Moreover, this point of view is supported by the FAO (Food and Agriculture Organization) through all the actions and projects in which it is involved.
In this regard, discussions that took place during the 2016 EAT Food Forum should be mentioned. Therein, the objectives of the sustainable development of the planet and the development of organic farming activities were presented in an interrelated manner, with economies and societies being encouraged to view them as integrated parts of sustainable development [9].
As can be seen, the FAO clearly supports the fact that organic agriculture is influenced by the way in which the SDGs of the 2030 Agenda are addressed by all the actors involved as well as that organic agriculture has direct implications in achieving the 2030 targets at the global level. In other words, the SDGs that are directly or indirectly related to healthy food, healthy living environments, and organic agriculture need to be the focus of short-, medium-, and long-term projects and action plans.
In this regard, the FAO identifies a total of eight SDGs as being the most relevant to organic agriculture including the following: SDG 6: Clean Water; SDG 13: Climate Action; SDG 14: Life Below Water; SDG 15: Life on Land; SDG 2: Zero Hunger; SDG 3: Good Health and Wellbeing; SDG 8: Decent Work, and SDG 12: Responsible Consumption and Production, of which five of these make direct contributions, namely SDG 2, SDG 6, SDG 13, SDG 14, and SDG 15. However, it should be mentioned that the indicators tracking the achievement of the SDG targets do not include specific indicators using exclusively organic farming data. As the framework for monitoring progress towards the SDG targets has been defined, the contribution of organic agriculture to the implementation of the 2030 Agenda has been quantified through the indicators defining the SDGs included in this research.
The transition towards ecological and organic production necessitates a simultaneous consideration of the social sustainability of such a transition. It is crucial to evaluate the potential of this ecological and agri-food shift to perpetuate existing inequalities and injustices on a global scale. The question arises: to what extent can this transition address sustainable objectives while overlooking persistent social inequalities and injustices? Therefore, a comprehensive examination of social justice within this transition becomes imperative. The 2030 Agenda underscores the significance of two relevant objectives in this context: “Reduced inequalities” (SDG 10) and “Peace, Justice, and Strong Institutions” (SDG 16). Taking these objectives into account is vital for ensuring a sustainable and equitable transition. We also support this approach in that organic agriculture helps to reduce the negative impact that conventional agriculture currently has on plant sustainability and in that organic farming has a direct positive impact on achieving the SDGs.
2. Literature Review
2.1. Organic Agriculture in Today’s Global Context
In the existing literature, organic agriculture is defined as a mode of agricultural production that uses organic production methods with an emphasis on the protection of the environment and wildlife. Organic agricultural production involves a large reduction in the use of synthetic chemicals, such as fertilizers, pesticides (fungicides, herbicides, insecticides), additives, and veterinary drugs, replacing them when possible with cultural, biological, and mechanical methods. As a consequence, organic producers contribute to healthy and fertile soil by growing and rotating a mix of crops, while avoiding the production of genetically modified crops [6,10,11].
In the European Union statistical registers, agriculture is considered organic if it complies with Regulation 834/2007 of 28 June 2007 on organic production and the labelling of organic products. Detailed rules for the implementation of this Regulation are laid down in Regulation 889/2008 [12,13].
From another perspective, the Food and Agriculture Association (FAO) of the United Nations defines organic agriculture as “a holistic production management system that promotes and enhances agro-ecosystem health, including biodiversity, biological cycles and soil biological activity. It emphasizes the use of management practices over the use of off-farm inputs, as regional conditions require locally adapted systems” [14]. The FAO also stresses that organic farming must be based on the following principles: the health principle, the ecological principle, the fairness principle, and the principle of caring for people and the environment.
Evidently, various perspectives exist regarding the principles and characteristics of organic agriculture. However, it is apparent that there are shared elements among these approaches, with a primary emphasis on promoting the wellbeing of the planet and its inhabitants. This is achieved through the direct, indirect, and induced effects of organic production, yielding positive outcomes over the medium and long term.
By emphasizing sustainable methods, organic farming systems promote resilience, stability, and security in the face of unpredictable disruptions. Organic agriculture’s emphasis on diversification, soil health enhancement, reduced reliance on external inputs, and preservation of genetic diversity enhance its capacity to withstand and recover from adversities. Therefore, recognizing the role of organic farming in mitigating food crises becomes imperative in devising strategies for a more sustainable and resilient future.
In this context, organic farming is the most sustainable response to ongoing crises of all kinds, through better anticipation and preparedness for crises as well as by building the equity and resilience of food systems in the long term [15,16].
Thus, the state of the environment and the quality of food contribute to the increased demand for organic products. However, even though organic farming has been within sight since the 20th century as a reaction to the obvious failures of conventional or non-organic agriculture, no single interpretation of it in terms of the practices and procedures used can be decided upon even today. Among the most common practices are the following: fertilizing with organic fertilizers instead of mineral fertilizers, using natural plant protection products instead of synthetic ones, and managing mechanical instead of chemical cropping systems. On the other hand, organic farming faces several challenges, such as 19–25% lower crop yields compared to those of conventional practices, the lack of animal and green manure produced on organic farms, and the lack of plant and animal varieties specifically adapted to organic practices. In this context, great efforts are needed to perfect organic farming as well as to sustain environmental health. However, there is one positive aspect, which is the continuing growth in the number of consumers of organic food globally [17,18,19,20].
2.2. Organic Agriculture and SDGs
A comprehensive and useful approach in terms of the economic, social, and environmental aspects of organic agriculture is that the long-term sustainable development of the planet is directly linked to healthy and therefore organic food, which directly influences the achievement of sustainable development goals. In other words, all the SDGs are directly or indirectly influenced by organic agriculture, as we have already stated at the beginning of this paper [14].
Equally important to note is that, within each SDG, all human activities are directed towards sustainable production and consumption patterns, including in the agricultural and food sectors. This is because environmentally friendly, clean practices are the only ones that can limit/stop climate change and conserve biodiversity as well as promote the circular economy.
Based on these considerations, many scholars [21] posit that the world’s population could be fed on food that comes exclusively from organic farming, while reducing food waste and changing diets. Moreover, researchers advocate an urgent transition to sustainable food systems, with agriculture being a key driver of ecosystem sustainability [22]. The conservation of biodiversity and its implications for other areas of activity, such as health, tourism, education, finance, etc., are just some of the arguments that justify the claim that organic farming makes a sustained contribution to achieving the 2030 Agenda targets.
Therefore, the role that organic agriculture can play in achieving the Sustainable Development Goals (SDGs) contained in the 2030 Agenda is indisputable, even if this is often not sufficiently recognized at present in the attitudes and projects of decision-making bodies. So, given that agriculture has a key role in sustainable development, being by the nature of its specific processes one of the best examples of a sustainable economy, we believe that its large-scale expansion is the foundation for the implementation of the SDGs. Putting organic agriculture at the top of the SDG agenda also contributes to managing risks and maximizing its direct, indirect, and induced benefits [22,23,24].
How organic agriculture contributes to the achievement of certain SDGs is also evident through the analysis of a series of specific indicators that measure the targets set by the 2030 Agenda, which also underpins our research. The specific indicators analyzed are included in the following SDGs: SDG 2, SDG 6, SDG 13, SDG 14, and SDG 15.
2.3. SDG 2—Zero Hunger
“Zero Hunger” is one of the targets proposed for 2030 under the 2030 Agenda. How organic agriculture contributes to achieving this target is certainly easy to see, given that ensuring a predominantly healthy and diverse diet is one of the planet’s long-term sustainability imperatives.
Organic agriculture relies heavily on healthy soils, which is why we stress the importance of implementing organic farming practices that preserve soils less affected by conventional agriculture and directly reduce soil erosion caused mainly by global warming. We support these claims by the fact that more than 95% of food crops are directly or indirectly linked to soil, while about 10 million hectares of land that used to be fertile have become ineligible for agriculture due to soil degradation [25,26].
However, organic yields are low (currently only 1% of global land) and soil degradation is increasing in many agricultural regions, which is why it can be argued that only by expanding the area under organic farming can soil quality be maintained, the loss of agricultural land reduced, and healthy food provided, benefitting society and the planet as a whole. On the other hand, it should also be noted that organic food is less accessible to poor consumers, especially in developing countries, which is why it is important to specify that only intelligent combinations of organic and conventional methods can contribute to sustainable productivity growth in global agriculture in the short and medium term, so that the entire population of the planet benefits in the immediate future [27,28].
Countries’ performance in organic farming and their contribution to achieving the SDGs are also highlighted by the following specific indicators: agricultural factor income per annual work unit (AWU) [29], area under organic farming [30], use of more hazardous pesticides [31], and ammonia emissions from agriculture [32].
2.4. Agricultural Factor Income per Annual Work Unit (AWU)
The contribution of agriculture to the sustainable development of the economy is recognized by all countries of the world, including the European Union, as reflected in the Common Agricultural Policy.
Thus, at the EU level, it has been found that thanks to support from the Common Agricultural Policy, the average farm income is approaching the average income of the non-farm sector. However, the influence of subsidies on changes in economic sustainability is uneven, with the farms benefiting most, meaning that social sustainability in terms of equal income distribution has not been achieved. This is also why it is often recommended that future reforms should aim to maintain support for the agricultural sector in terms of the volume of financial flows and change payment distribution systems to encourage productivity growth on all farms. On the other hand, the agricultural value added could be increased by higher production as well as by higher value added, avoiding adverse price changes that may subsequently affect consumption [33,34,35].
2.5. Area under Organic Farming
Organic farming should be seen as an alternative to conventional agriculture with major contributions to the enhancement of biodiversity and the sustainable economy. However, the certification of organic production is in many cases limited to the banning of synthetic fertilizers, which, unfortunately, can reduce yields and has limited benefits for biodiversity. Therefore, achieving farmland diversification in both conventional and organic farming can boost biodiversity on a much larger scale. This can be taken into account by policy makers and may even lead to a change in the agricultural paradigm [36,37].
The organic agriculture sector in Europe is currently heading in important directions in its development. On the one hand, the market for organic products has seen a high growth rate (10.9 percent in the European Union in 2017), but the growth in organic farmland has increased at a slower rate (6.4 percent in the EU in 2017). This shows an increase in consumer interest in organic products that is greater than the increase in production. Equally important, organic farming can have considerable and positive effects on emissions control, which is another strong argument for the implementation of organic food production [38,39,40].
2.6. Use of More Hazardous Pesticides
Global pesticide use has increased more than 1.5 times in the last three decades. As a result, both soils and waters are increasingly contaminated with pesticides, leading to a number of problems related to the degradation of pesticide products. As Ponnuchamy et al. demonstrate in their research [41], organochlorine pesticides are considered the most dangerous because of their long dissipation time in the environment, up to five to fifteen years. This is one of the major problems affecting health and requiring advanced methods of cleaning water.
Pesticides are chemical or biological compounds that are designed to prevent, control, or destroy any biological organism considered harmful to plants. In this category, there are pesticides that are not persistent and can easily disappear when exposed to light, which is why they are considered to be safe. Identifying natural sources of pesticides is therefore a priority which supports and encourages investment in organic farming [42,43].
Nevertheless, despite their integral role in the agricultural sector and their direct contribution to food production, the utilization of pesticides is considered a hindrance to the attainment of the targets outlined in the 2030 Agenda, particularly in the context of sustainable agriculture. Consequently, the primary apprehensions revolve around mitigating the detrimental impacts of pesticides on both human health and the environment. Notwithstanding these concerns, prominent agrochemical companies continue to allocate significant investments towards the research and development of novel pesticides, presenting a substantial challenge to be addressed [44,45,46].
2.7. Ammonia Emissions from Agriculture
It is well known that emissions of ammonia (NH3) from agricultural sources have contributed over time to air pollution, water eutrophication, the loss of biodiversity, and declining human health. Numerous strategies have been implemented to reduce NH3 emissions from agricultural systems, but their effectiveness varies from region to region. On the other hand, there is the lack of an integrated assessment of measures to reduce NH3 emissions at both the livestock and crop production levels. There are also strategies, such as the use of ammonium nitrate and controlled-release fertilizers, that can contribute to reducing NH3 emissions. The choice of a fertilizer suitable for local conditions is also essential to lowering NH3 emissions, as is the implementation of innovative strategies [47,48,49].
Another important point to mention is that the increase in livestock production with the increase in the human population has resulted in higher emissions of ammonia into the environment. To reduce ammonia emissions, a number of regional management processes have been implemented in most EU countries, but individual measures differ from country to country, as attempts to reduce ammonia emissions can lead to significant increases in methane, nitrous oxide, or carbon dioxide. A number of management strategies have been effective to some extent, such as biological treatments, sequestering liquid sludge with different materials, and variable field applications. This is because strategies focused on decreasing ammonia emissions have neglected the consequences of other greenhouse gas emissions. As a consequence, a combination of technologies is recommended, such as acidization, the use of microbial inhibitors, and slow-release fertilizers [50,51].
2.8. SDG 6—Clean Water and Sanitation
The role of agriculture in water quality and sanitation is an undeniable issue at the global level. According to the literature, agriculture accounts for 70% of global water abstraction. This is the reason why a lot of problems are generated from this huge consumption of water, such as the following: the excessive use of drinking water, high pressure on water supplies to agricultural networks, deterioration of water quality, etc. Due to the substantial quantities of agrichemicals generated in relationship with traditional agriculture, including pesticides, fertilizers, organic matter, residues, and sediments, there is a significant strain on drinking water systems. As a result, we are witnessing an alarming threat to the environment, particularly to aquatic ecosystems and human health [27,52].
In view of these aspects, it can be stated that organic farming can make a significant contribution to achieving the 2030 Agenda targets, because by eliminating the synthetic pesticides that are included in conventional agriculture, the trade-off between water pollution and food production is significantly reduced [53,54].
The relationship between organic farming and SDG 6 is defined, as the FAO proposes in its approach, by the following specific indicators: the biochemical oxygen demand in rivers [55], nitrate in groundwater [56], phosphate in rivers [57], and the water exploitation index plus (WEI+) [58].
2.9. Biochemical Oxygen Demand in Rivers
It is well known that both surface and groundwater resources are systems that are extremely sensitive to various sources of pollution, which unfortunately are increasing. Thus, determining water quality often seems difficult, especially as we are talking about large areas, different regions, and territories often belonging to different countries, which impact water quality differently depending on the nature of the activities carried out [59,60].
Water quality indicators (physico-chemical variables) as well as change factors (the monthly aggregate air temperature, stream flow, population density, and percentage of agricultural land use) have a direct impact on the quality of human life, agricultural production, and water use. Moreover, positive trends in increasing water temperature as well as negative trends in the dissolved oxygen in water are directly correlated with the increasing trends in air temperature. Unfortunately, therefore, the aquatic ecosystems of rivers are facing oxygen depletion, which impacts the sustainable future of the planet and human life. Added to this is the fact that conventional agriculture worsens the present situation through the high concentrations of phosphates that are constantly used. Therefore, detailed analyses and an in-depth knowledge of water use systems and procedures are the only tools for decision makers in watershed planning, as well as in sizing the potential impact of agriculture on aquatic ecosystems and beyond [61,62].
2.10. Nitrate in Groundwater
The correlation between clean water and the health of the global population is one of the most important challenges set by the 2030 Agenda, as one in three people worldwide still lacks access to safe drinking water. The main cause is linked to the fact that groundwater, one of the main sources of freshwater, has been constantly affected by human activities, including conventional agriculture.
Unfortunately, however, most facilities globally aim to remove pollutants from surface waters, while groundwater remediation facilities are far fewer in number. This is why there is now a growing concern about the presence of nitrates (NO3) in groundwater. This is a consequence of the intensive use of fertilizers as well as of other sources generated by anthropogenic activities (sewage, industrial wastewater discharge, etc.).
In this context, a comprehensive strategy implementing highly effective, low-cost solutions for sustainable groundwater management needs to be formed. The use of advanced technology in large-scale nitrate treatment plants for groundwater treatment is a solution that could lead to significant progress in the near future [63,64]. Today, advanced techniques are capable of achieving a significantly greater removal of nitrates and other contaminants from groundwater. However, the challenges posed by high energy consumption present a challenge in implementing these technologies for groundwater remediation [65].
2.11. Phosphate in Rivers
Phosphate plays an extremely important role in biogeochemical cycles and has a major influence on the quality of the environment and agri-food crops. Thus, there are more and more concerns for the determination of phosphates in surface waters. Sophisticated methodologies (spectrophotometry, fluorescence sensors, UV–Vis spectroscopy, chromatography, and mass spectrometry) as well as analytical platforms (thin-film diffusive gradients, microfluidics, and flow analyzers) are thus being promoted and implemented. It is also worth mentioning smartphone technology is being increasingly used in the chemical and biological detection of a wide range of chemical agents. Thus, the development of smartphone-based testing is an important step in the long road society has to take towards clean water, organic agriculture, and sustainable growth of the global economy [66,67,68].
It is therefore increasingly important to adopt sustainable agricultural practices that can directly influence the production of agri-food crops without the excessive use of fertilizers. The use of alternative solutions, such as the use of nanomaterials to improve plant nutrition as an alternative to traditional chemical or mineral fertilizers, contributes directly to the efficiency of micro- and macronutrients in plants. Thus, the current and future role of nanotechnology in the biofortification of plant nutrition can be highlighted; it can respond to the challenges related to the environmental impact and toxic effects of conventional fertilizers to a large extent. In the same vein, concerns about the use of nanoparticle-based fertilizers in organic farming should also be mentioned [69,70].
2.12. SDG 13—Climate Action
There is no doubt about the potential that organic agriculture has in the sustainable growth of the planet and the achievement of the 2030 Agenda targets. We thus identify the significant contributions of organic agriculture in mitigating climate change, starting with nutrient and pest management. According to organic farming regulations, it can be seen that organic farming does not use mineral and chemical pesticides that require large amounts of fossil fuels, which directly leads to a significant reduction in carbon dioxide emissions [71].
Recent research also shows that 10% of global direct agricultural emissions and 1% of total greenhouse gas emissions are human induced, which can be directly mitigated by organic farming [72].
On the other hand, there are also a number of risks in terms of the sustainability of the economy, in particular those related to the fact that organic farming uses more energy because it involves more labor and uses more machinery.
However, organic farming contributes directly to climate change mitigation by using organic soil generated by organic vegetation. Through the process of carbon sequestration and the long-term storage of atmospheric carbon dioxide through biological, chemical, or physical processes, organic farming plays a major role in reducing net greenhouse gas emissions. Moreover, soils rich in organic matter have an increased capacity to store water, reduce erosion, and support water supply processes during droughts [28].
The relevant indicators for highlighting the above issues are the following: the net greenhouse gas emissions [73] and net greenhouse gas emissions of land use, land use changes, and the forestry (LULUCF) sector [74].
2.13. Net Greenhouse Gas Emissions
The effects of net greenhouse gas emissions and intensity on soil fertility and crop yields are extremely evident in conventional agriculture. At the same time, the alternative use of organic procedures generates a number of positive results, such as significant increases in the carbon and nitrogen content of microbial biomass, an increased soil pH, the increased nutrient quality of agri-food products, etc. Therefore, the consistent use of organic farming procedures can considerably mitigate greenhouse gas emissions and improve soil fertility [75,76].
2.14. Net Greenhouse Gas Emissions of the Land Use, Land Use Change, and Forestry (LULUCF) Sector
Each country’s greenhouse gas mitigation programs are playing an increasingly important role in achieving progress in terms of their commitments to implement the 2030 Agenda targets.
From the point of view of agriculture, sustainable land use, land use change, and forestry programs, especially for countries where forests and agriculture are expected to contribute significantly to greenhouse gas reductions, programs and strategies need to be highly coherent and closely monitored. It is therefore recommended that the evolution of each country in terms of its volume of trees, cultivated land, and pastureland is monitored continuously and in detail, since the role of land use, land use change, and forestry is unanimously recognized as the only way to mitigate climate change. Massive afforestation, reduced deforestation, forest management plans, and land use change plans are strategies that countries are pursuing today [77,78,79].
2.15. SDG 14—Life below Water
Based on the fact that organic agriculture prohibits the use of synthetic pesticides, it can be said that it directly contributes to the pollution of the planet’s surface and groundwater.
On the other hand, the analysis of nitrate and phosphorus quantities resulting from organic farming supports the positive impact it has over time compared to that of conventional agriculture. It is worth mentioning, however, that this is much more evident in developed countries, even if the production per unit of product is lower than that in conventional agriculture. However, to minimize losses, measures are proposed to intensify crop rotation processes as well as to better recycle biomass and nutrients; thus, organic farming is seen as a component of sustainable growth.
2.16. Marine Waters Affected by Eutrophication
The importance of analyzing this indicator [80] derives from the fact that many aquatic ecosystems, especially those in densely populated regions around the world, are subject to stress and pollution due to overexploitation. Moreover, continued global population growth is likely to generate even greater pressure in the coming decades, which is why urgent, radical measures can help mitigate climate change.
These measures are justified in particular by the fact that the water quality in all water systems is affected by climate variability in several ways: through the process of global climate change, in particular temperature and sea level increases; through changes in wind circulation patterns in the oceans; through changes in rainfall volume and flow fluctuations in rivers and streams; and through local climate fluctuations. As a consequence, a change in water quality due to climate variability can also be observed [81,82].
2.17. SDG 15—Life on Land
The steady loss of biodiversity in recent decades has led to a change in global policies and a reorientation of all economic activities towards processes and procedures that are less damaging to nature. Organic agriculture now shows a quick, achievable way to mitigate this loss, even though the human, material, and financial costs may be high.
Biodiversity loss and land degradation affect the food chain and cause changes in ecosystems and nature, which is why only the expansion of organic agriculture can contribute positively to the rational management of the planet’s resources.
Indicators have clearly measured how organic agriculture contributes to the long-term sustainability of the planet, as well as the achievement of the 2030 Agenda targets for each country, such as the share of forest area [83], surface of terrestrial protected areas [84], and soil sealing index [85]
Research findings indicate a significant decrease of over two-thirds in agricultural land over recent decades. However, investments in organic farmland, considered crucial for environmental preservation endeavors, are being neglected. It is imperative for land, urban, and rural planning entities to prioritize sustainable land use development to ensure a sustainable future. This necessitates proactive measures and strategies supported by scholarly sources [86,87,88].
An important aspect of organic farming concerns externalities and how these are addressed in research [27,89,90,91]. Externalities encompass the non-commercial impacts resulting from the production activities of an actor, with implications for the wellbeing of others and the absence of any trade-off. These externalities are not immediately observable or quantifiable by consumers. Negative externalities can inflict harm upon specific economic actors, the general public, and taxpayers, thereby incurring costs associated with pollution, health risks, and related factors. To comprehend the comprehensive societal costs arising from these impacts, numerous studies have been conducted to estimate negative externalities.
Positive externalities require the attribution of value to be acknowledged. The magnitude of these externalities relies on the perception of the “normal state” or baseline condition, which can be exemplified by the environmental state. Any degradation exceeding this baseline is regarded as detrimental to society, while any improvement is seen as advantageous. The establishment of accepted norms in this context is a social construct, with scientific knowledge playing a role in understanding sustainable objectives.
In the organic agriculture context, externalities are evaluated relative to social norms and prevailing “conventional” farming practices. Thus, their assessment is inherently subjective and subject to natural evolution. Increasing positive externalities and decreasing negative externalities are regarded as beneficial for the local community. In a schematic, the framework for addressing the impact of organic farming on the SDGs is described in Table 1.

Table 1.
The impact of organic farming on the SDGs.
In conclusion, the views of specialists in the field presented above highlight the importance of organic agriculture in relation to the targets set by Agenda 2030 that are supported by all countries. In this context, our research’s assessment of the performance achieved by EU member states is particularly useful, thus adding to the range of knowledge in this field as well as to the best practice models identified in the European space.
3. Research Methodology
To evaluate the progress towards achieving Sustainable Development Goals (specifically indicators belonging to SDG 2, SDG 6, SDG 13, SDG 14, and SDG 15) in the organic agriculture sector of EU countries, data from Eurostat were used for the analysis. Our objective was to obtain a comprehensive understanding of the current state of sustainable development in this area, and to achieve this, specific data from 2008 to 2021 were aggregated. This allowed us to obtain a more precise and informed view of the main indicators included in our analysis, both in terms of their current status and potential future trends [92]. In cases in which values for specific indicators had not been published for 2021, the corresponding values were estimated on the basis of the present methodology.
An analysis of the published literature, which discusses the comparative advantages and disadvantages of using econometric models for forecasting time series, shows that there is no established forecasting model that offers indisputable advantages. The specific literature presents two classes of available models, i.e., traditional models (such as ETS, ARMA, ARIMA, and SARIMA) or models developed in recent times, based on technological advances, which aim to replace the already established models in time series forecasting (LSTM, DNN, NARNN, and FBProphet) [93,94,95,96,97,98].
From the existing literature [93,94,95,96,97,98], two econometric time series forecasting models emerged as relevant for the objectives of this study: the ETS model (Error Trend and Seasonality or exponential smoothing) and the ARIMA model (Auto Regressive Integrated Moving Average). Due to the complexity of the analysis and the robustness of its forecasting capabilities, the ARIMA model, available in the SPSS software package, v. SPSS Statistics 26 [99], was selected for this research. The analysis of the preliminary results obtained from running the ARIMA models (fit values, upper and lower confidence limits, residual autocorrelations, and partial autocorrelations) did not show abnormal or disproportionate values, suggesting that the models are valid and provide consistent results. The use of specific tools available in the SPSS software package offers the possibility to identify the best model fit based on the available data, which was a real advantage for the processing of the 420 individual models used in this analysis.
The present study employed the ARMA methodology developed by Box and Jenkins, which integrates an autoregressive process (AR) and moving average (MA) model [100,101]. The AR process, as the first component, involves a linear regression of the current value of the series against one or more previous values of the series. This generates an AR process of order p, wherein p represents the number of lags or previous values considered in the regression model. The AR component of the model captures the influence of past values on the present value of the series, thus enabling the identification of patterns and trends in the data, as shown in Equation (1):
where:
- Tt is the time series;
- is white noise;
- , with μ denoting the process mean.
The second component of the model implemented in this study involves modeling the evolution of the moving average (MA) series. This was accomplished through a linear regression of the current value of the series against white noise, or random shocks, in combination with one or more previous values of the series. It is assumed that the random shocks at each point in time originate from the same data distribution, typically following a normal distribution as in Equation (2):
where:
- Tt is the time series;
- μ is the mean of the series;
- At−i are white noise terms;
- θ1, …, θq are the parameters of the model;
- q is the order of the MA model.
The SPSS software package offers the capability to estimate exponential smoothing, univariate, or multivariate Autoregressive Integrated Moving Average (ARIMA) models based on the best-fitting ARIMA model for one or more dependent variable series. The procedure encompasses an Expert Modeler that aims to automatically identify and estimate the most optimal ARIMA or exponential smoothing model for one or more series of dependent variables. As a result, the requirement of manually determining a suitable model through trial and error is obviated, and the software will automatically find the best-fitting model for each of the dependent variable series.
The notation used for this model is ARIMA (p, d, q), where p represents the order of the autoregressive process, d represents the order of differencing, and q represents the order of the moving average process [102,103]. ACF and PACF values were considered for each individual model. ACF helps to determine the appropriate lag for the moving average through the error term, and PACF helps to determine the appropriate lag for the autoregressive component. Following model fitting, a residual diagnostic procedure is performed and the models from ACF and PACF are considered to test whether the residuals are white noise. The overall fit of the model is evaluated by assessing the residuals. According to Box and Jenkins [100], the residuals should follow a white noise process with zero mean and unit standard deviation. If the errors are normally distributed and not uncorrelated with each other, then we actually have a good model and can use it for forecasting the values of the indicator under analysis (Figure 1).
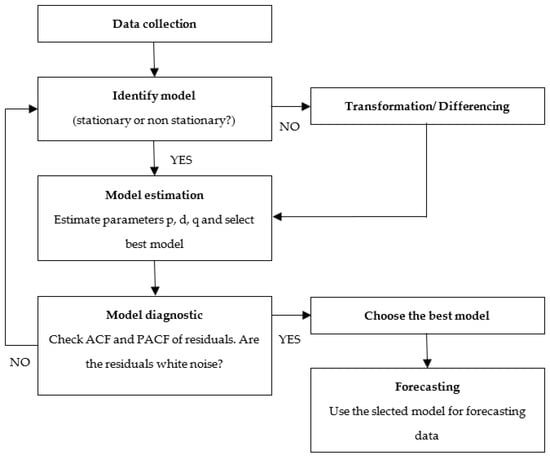
Figure 1.
Flow diagram for ARIMA models.
It should be noted that, based on the existing literature [104,105,106], there is no single, unanimously accepted methodology for minimum reference values of extrapolation errors. Taking into account the purpose of the research and the selected method, as well as the fact that the recognized methodology was followed, we can consider the predicted values as valid.
Apart from the forecast data analyzed for the 2030 horizon, this study sought to provide additional insights into the evolution of the selected indicators by means of dynamic index analysis. This involves assessing two crucial periods within the considered time horizon, specifically 2025 and 2030. The analysis of the values during these periods is relative to the base year for this research, which is 2015. This year was chosen as the reference point because it marks the adoption of the 2030 Agenda for Sustainable Development.
To estimate the dynamic indices, this study utilized the ratio of the selected indicator at a given point in time to its value during the base year. This was achieved by employing Equation (3) as follows:
where:
- In = the indicator value at a given moment of time;
- I0 = the indicator value in the base period (2015).
The inclusion of the paribus principle is crucial for accurate and robust forecasting in scientific research. By incorporating the paribus principle into forecasting models, we can systematically evaluate the influence of individual factors on the predicted outcomes, thus enhancing our understanding of complex systems. This approach facilitates the identification of causal relationships and helps to mitigate potential confounding effects, enabling more reliable and precise forecasts. The paribus principle promotes transparency and rigor in forecasting methodologies, enhancing the reproducibility and generalizability of research findings. Its inclusion is essential for advancing the field of forecasting and promoting evidence-based decision making in various domains.
4. Results and Discussion
This research presents the results for each of the selected indicators analyzed in the form of summary tables. The first column in each table indicates the values of the analyzed indicator for the year 2015, while the second column records values for the year 2021. The third and fourth columns present the estimated values for the years 2025 and 2030, respectively. These tables (Table 2, Table 3, Table 4, Table 5, Table 6, Table 7, Table 8, Table 9, Table 10, Table 11, Table 12, Table 13, Table 14 and Table 15) provide a clear overview of the results obtained for each indicator.
Table 2.
SDG 2(20)—Agricultural factor income per annual work unit—AWU (index, 2010 = 100).
Table 3.
SDG 2(40)—Area under organic farming (percentage of total utilized agricultural area).
Table 4.
SDG 2(52)—Use of more hazardous pesticides (index, 2015–2017 average = 100).
Table 5.
SDG 2(60)—Ammonia emissions from agriculture (kilograms per hectare).
Table 6.
SDG 6(30)—Biochemical oxygen demand in rivers (mg O2 per liter).
Table 7.
SDG 6(40)—Nitrate in groundwater (mg NO3 per liter).
Table 8.
SDG 6(50)—Phosphate in rivers (mg PO4 per liter).
Table 9.
SDG 6(50)—Water exploitation index, plus (WEI+) (percentage).
Table 10.
SDG 13(10)—Net greenhouse gas emissions (index, 1990 = 100).
Table 11.
SDG 13(21)—Net greenhouse gas emissions of the land use, land use change, and forestry (LULUCF) sector (tons per square kilometer).
Table 12.
SDG 14(60)—Marine waters affected by eutrophication (square kilometer).
Table 13.
SDG 15(10)—Share of forest area (percentage of total land area).
Table 14.
SDG 15(20)—Surface of the terrestrial protected areas (percentage).
Table 15.
SDG 15(41)—Soil sealing index (index, 2006 = 100).
The agricultural factor income per annual work unit (AWU) serves as a metric for tracking progress towards the attainment of Sustainable Development Goal 2 (SDG 2), a top priority of the European Commission’s European Green Deal initiative [107]. Enhancing agricultural productivity and augmenting food producer incomes are pivotal to promoting economic development and safeguarding food security. These goals have taken on a heightened significance in recent times (Table 2).
The results of our research indicate a general upward trend at the EU level, given that, for 17 of the 27 Member States, an increase in the values of this indicator is forecast until 2030. However, the analysis of the results indicates the existence of a group of four countries (Spain, Malta, Romania, and Finland) for which a reduction in the AWU values is estimated for the analyzed horizon, which suggests the existence of some problems that should be corrected as a priority.
Moreover, a group of countries for which the estimated trend is not fully defined can also be identified, in particular, Denmark and Sweden. By analyzing the values of the dynamic indices, it can be seen that, in this case, too, some targeted measures may be necessary to correct the trend for this indicator for the horizon year 2030.
In terms of the area under organic farming at the EU country level, as a percentage of the total utilized agricultural area, the results of our research indicate the results of an intense pre-occupation with sustaining organic farming. For the vast majority of EU countries, a steady increase in the area allocated to organic farming is estimated by 2030, and this is likely to be one of the proposed targets that are reached (Table 3).
Of the 27 Member States, only five (Bulgaria, Greece, Malta, Poland, and Sweden) show a relatively stationary trend, which could be turned into an upward trend by the combined efforts of all stakeholders. However, for Bulgaria and Poland, the need for a stronger involvement of stakeholders to support more intensively the conversion of agricultural areas to organic farming should be underlined, considering that the estimated values until 2030 are below the 2015 level, as well as below the values for 2021.
At the European level, the use of more hazardous pesticides is a high-priority issue, with many efforts being made to reduce the amount used (Table 4).
It is encouraging that the research results for the EU countries that reported values in the reference period indicate a downward trend. The analysis suggests that the EU average values by 2030 may be significantly closer to zero, as is anticipated for several countries in the same time horizon (Belgium, Lithuania, Luxembourg, and the Netherlands). A group of seven Member States for which the projected trend until 2030 is stationary or slightly downward, which can be turned into a downward trend with minimal effort and commitment, can also be brought into question.
However, it should be mentioned that, for this indicator, 11 countries did not trans-submit data, so the research methodology could not be used. It is important that these countries also publish the values for this indicator, as the targets have been assumed at the EU level, and the negative implications of maintaining high values in the use of more hazardous pesticides has significant environmental and health implications. Only one European country (Latvia) is estimated to increase the amount of hazardous pesticides by 2030, but we are confident that stakeholders will make sustained efforts to reduce the amount in the coming years.
A similar situation to the indicator reflecting the use of more hazardous pesticides is also found for the evolution of ammonia emissions from agriculture, i.e., for a considerably large proportion of the European countries analyzed (24 out of 27), a downward trend is estimated until 2030 (Table 5).
For the other three Member States included in the analysis (Malta, Austria, and Slovakia), the results of our research estimate an increase in ammonia emissions from agriculture, which should be an alarm signal for all stakeholders. Even if EU-wide emissions are decreasing, it is important to realize that each country must do its best to reduce ammonia emissions.
Biochemical oxygen demand (BOD) is a widely utilized parameter for assessing water quality. Elevated levels of BOD5 typically serve as an indicator of organic pollution, which can have deleterious effects on water quality. Rivers exhibiting exceptional water quality feature BOD5 values below 1 mg O2/L. In contrast, moderately to severely polluted rivers exhibit BOD5 values within the range of 2 to 8 mg O2/L.
As the results of the present research show, the evolution of the values of this indicator until 2030 is positive, both in terms of the estimated values and the downward trend recorded for most European countries that reported values in the reference period (Table 6).
It should also be mentioned that for a small number of Member States, namely Spain, Austria, and Slovakia, the research shows negative forecast results, i.e., indicating the probability of an increase in pollution levels in the coming years if the current BOD5 trend is maintained.
Nitrate, primarily stemming from anthropogenic activities, particularly agriculture, is capable of enduring in groundwater over extended periods and accumulating at elevated concentrations. To ensure the protection of human health, the European Union has established a drinking water standard that restricts nitrate levels to 50 mg NO3/L.
As indicated by the results of the research on the evolution of nitrate levels in groundwater, a sharp decrease in these values can be observed, well below the maximum level set, with values up to 50 times lower than the threshold levels estimated for 2030 (Table 7).
However, potential negative developments should also be highlighted in order to raise the alarm and to draw the attention of stakeholders to the importance and urgency of reducing nitrate levels in drinking water, due to the particularly harmful effects on health and the environment. Thus, for Cyprus, despite the expected downward trend in the values of this indicator, there is a need for immediate and firm measures to significantly reduce the amount of nitrates in groundwater, given that both the current and projected values are above the maximum limit set at the EU level.
Moreover, for a group of five European countries (Bulgaria, Estonia, Ireland, Latvia, and Malta), the results obtained from the research methodology suggest an increase in nitrate in the groundwater in the coming years. These estimates can be worrying, even if the absolute values are not necessarily close to the maximum reference value, because of the harmful effects on the population and the environment.
The third indicator specific to SDG 6 selected for research because of its implications for organic agriculture is the amount of phosphate in rivers (Table 8). As the results suggest, 26 out of 27 EU countries are on a downward trend, or at least do not show an upward trend by 2030. This is a very encouraging result, considering that elevated levels of phosphate can give rise to water quality issues, such as eutrophication, via the stimulation of macrophyte and algae growth (Table 8).
It should be mentioned that the results of the research indicate only one EU Member State (Lithuania) for which the values of this indicator are on an upward trend. Consistent measures are needed to reduce phosphate levels in rivers, both to reverse the trend that is likely to occur in the coming years and to protect life below water and life on land, as well as human health and wellbeing.
The regionalized water exploitation index plus (WEI+) is employed to gauge the total water consumption as a percentage of the available renewable freshwater resources for a given region and timeframe. It provides a quantification of monthly or seasonal water abstractions and returns to the environment via river basins. The discrepancy between water abstractions and returns is categorized as “water consumption”. In the absence of formally agreed-upon targets across Europe, values above 20% typically signify water scarcity, while values equal to or greater than 40% indicate instances of severe water scarcity, which indicates that freshwater resource utilization is unsustainable.
As the results indicate, the situation at the EU level is a mixed one, which should be a wake-up call for all parties involved, both at the EU level and at the level of the countries for which the values of this indicator are expected to deteriorate. If the trend in the values recorded until 2021 continues, 12 of the 27 EU countries are expected to see a decrease in water consumption, while 11 EU countries are expected to see an increase in water consumption by 2030 (Table 9).
However, there are a number of countries for which the values currently recorded are particularly high (Malta, Portugal, and Romania) or even unsustainable (Cyprus). The most worrying aspect is that the forecasted values and trends for 2030 are not likely to improve either, with a worsening of the situation being expected for Malta.
This is particularly important that in the current conditions of increasing global average ocean temperatures and the amplification of the effects of the El Nino phenomenon that will occur in the coming years, we expect a worsening of the situation in terms of the evolution of the WEI+ indicator. Sustained efforts and considerable resources will have to be invested in protecting available water resources in order not to endanger life in the most affected countries and regions and to achieve a transition to a sustainable form of water consumption.
Regarding net GHG emissions, on a yearly basis, the EU Member States submit greenhouse gas (GHG) emission inventories to the United Nations Framework Convention on Climate Change (UNFCCC). The results of the research demonstrate the effects of the sustained efforts made over the last decade to reduce GHG emissions, with the vast majority of European countries included in the analysis predicting declining trends in this indicator until 2030 (Table 10).
However, it should be noted that three EU countries (Latvia, Lithuania, and Slovenia) are in potential danger of increasing GHG emissions if they do not take immediate measures to reduce GHG emissions and enact a downward trend. There are numerous studies showing similar results [108,109,110], and stakeholders are certainly concerned about adopting the most appropriate measures to reduce GHG emissions.
Concerning the evolution of the net greenhouse gas emissions of the land use, land use change, and forestry (LULUCF) sector, it should be mentioned that this indicator measures net carbon removals, considering both emissions and removals from the sector, and could play a key role in achieving net zero greenhouse gas (GHG) emissions.
As indicated by the results of our research, the evolution of the values of this indicator for EU countries is likely to raise some concerns, given that the estimates of the future evolution until 2030 do not suggest significantly positive results. In other words, only a relatively small number of Member States are expected to see an improvement in the values of this indicator, namely Greece, Spain, Hungary, Malta, and the Netherlands. For the rest of the countries, as well as for the European Union as a whole, the values of this indicator are expected to deteriorate, unless firm measures are taken to reverse this trend (Table 11).
It should, however, be noted that before 2020, there were no designated objectives in place for land use, land use change, and forestry (LULUCF). Regulation (EU) 2018/841 was instituted to establish national commitments for the period between 2021 and 2030, mandating that the greenhouse gas (GHG) emissions accounting from this sphere must be correspondingly balanced with CO2 removal accounting (through the ‘no-debit’ rule) by EU Member States. This regulation is currently being reviewed with the aim of including more ambitious targets.
Another important indicator considered in the present research is the marine waters affected by eutrophication. This indicator is directly influenced by the amount of phosphate in rivers, as mentioned above.
Analyzing the available data, it can be seen that out of the 21 EU countries that have published information on this indicator, the research results for nine countries indicate an upward trend for marine waters affected by eutrophication, while for the remaining 12 countries, a downward or stationary trend is forecast until 2030 (Table 12).
However, at the aggregate level for the European Union, if the current trend is maintained for the Member States analyzed, the values of this indicator are expected to evolve negatively, i.e., the affected area is likely to increase steadily. It is clear that measures are needed to halt this phenomenon as soon as possible, given that the positive effects will not be seen immediately, but it will take several years to report an improvement. Corrective measures must also take into account the linkages between different indicators, given the complexity of the ecosystems involved.
As regards the share of forest area at the EU level, expressed as a percentage of the total land area, the research results indicate a very good situation, both at the EU level and at the level of most Member States, for which increasing values are estimated until 2030 (Table 13).
With regard to this indicator, we can indicate only one European country (Malta) for which our analysis identified a potential negative evolution, i.e., a decrease in the share of forest area. This is explained both by the manifestation of natural factors as a feature and by the influence of other indicators included in the analysis, such as the increase in ammonia and nitrates in soil and water or the evolution of the water exploitation index. It is clear that measures are needed to correct this negative trend, even if the positive effects will be seen over a longer period of time.
Another relevant indicator considered in the present research refers to the percentage of the area of terrestrial protected areas. As in the case of the previous indicator, concerning the share of forest area at the EU level, the research results indicate a consistently positive development for all the countries analyzed (Table 14).
Even if the results show a stationary trend for two European countries (Denmark and Sweden), this is not necessarily worrying because the level at which the trend is estimated to be stationary is above the 2015 baseline, and it is evident that due to the experience and commitment of these countries in promoting and supporting the SDGs with a minimum of corrective measures, the stationary trend can be transformed into an upward trend.
Soils offer various services, such as the production of food and materials, the control of water, energy, and matter, the creation of habitats for diverse forms of life, the provision of areas for recreational activities, and assistance in the formation of landscapes that hold aesthetic and cultural significance. Artificial and impenetrable surfaces used for soil sealing disrupt the crucial environmental, economic, and social functions performed by soils.
Examining the results obtained through the analysis of the available data for SDG 15(41), it can be noted that the results suggest an increasing trend in the soil sealing index for all 27 countries considered in our research, without exception (Table 15). This is clearly a negative aspect, but one that can hardly be countered in the current conditions, in which buildings of all types are taking the place of soils, supporting both the growing need for housing areas and the development of roads or industry.
It is very unlikely that effective measures can be taken to reduce this overall negative trend by 2030, let alone reverse it. It is very likely that the specific targets for this indicator will be missed entirely by 2030, as foreseen in the 2030 Agenda.
Analyzing the results obtained, we can distinguish three distinct situations regarding the achievement of the 2030 Agenda targets from the perspective of organic agriculture in EU countries. There is a first group of indicators for which most Member States report significant progress, and the projected results indicate a continuation of this trend until 2030. Thus, we can strongly affirm that, if the current state of affairs is maintained, the 2030 Agenda targets for SDG 2(40)—Area under organic farming, SDG 6(40)—Nitrate in groundwater, SDG 13(10)—Net GHG emissions, SDG 15(10)—Share of forest area, and SDG 15(20) Surface of the terrestrial protected areas will be achieved to a significant extent.
These are important indicators, especially as they aim to ensure the development of large areas for organic agriculture, while increasing the area of land under cultivation and declaring additional areas as protected areas. Alarm bells about the reduction in harvested forest area over Europe have been sounded by Checcherini et al. [111], who state that if a high rate of forest harvest is maintained, then the post 2020 EU vision of forest-based climate mitigation may be hampered and the additional carbon losses from forests would require extra emission reductions. Similar studies [112,113,114] indicate concerns about the pressures on protected areas and their importance for ensuring biodiversity and an increased level of wellbeing for society. The results of our survey confirm that progress has been made in addressing these concerns, provided that Member States continue their efforts to achieve these objectives.
Looking at the projected results up to 2030, it can be seen that there is a general trend of improvement in the values of these indicators for most of the EU countries, but there are also cases in which some of the countries’ performance is expected to deteriorate, which leads to the identification of a second category of countries. In this category, we can predominantly include indicators related to water, water quality, and ammonia emissions, which tend to show harmful effects on the health and wellbeing of the population, while simultaneously affecting the long-term quality of the environment [115,116,117,118]. The results obtained by the present survey confirm the concerns expressed by researchers and other stakeholders, as well as partially confirm some published results. However, our survey also indicates that there is a potential for improving the shortcomings highlighted and the possibility of partially achieving the targets set by the 2030 Agenda. However, at the level of all European countries, there is a need for a significant involvement of policy makers and civil society to continuously improve the values of the indicators related to organic agriculture and contribute to achieving the SDGs.
Finally, the third category includes indicators specific to organic farming for which our research indicates a significant under-performance, suggesting that Member States will miss their targets by 2030. In this category, we can include indicators specific to SDG 14(60)—Marine waters affected by eutrophication and SDG 15(41)—Soil sealing index.
Regarding marine waters affected by eutrophication, there are several published studies that prove both the importance of this topic for sustainable agriculture and development and the concern of researchers to follow the evolution of this indicator [119,120,121,122,123]. The results of our research support those identified in the literature, and we also are concerned about limiting the eutrophication of tidal waters, given the significantly higher detrimental effects on the aquatic ecosystem in the long term compared to the benefits obtained by increasing agricultural production, but on an unsustainable basis.
Worrying results have also been revealed for the degree of soil sealing, a phenomenon that is manifested in all EU Member States. There are numerous published studies that include the profoundly negative effects of this indicator as well as growing concerns about the irreversible degradation of available surfaces [124,125,126]. Published research indicates both that multiple forms of physical, chemical, and biological degradation affect the soils across Europe and that a continuous and harmonized soil assessment is required to evaluate trends in soil degradation. This is a wake-up call for the research community, and the results of our research confirm these concerns and reinforce the need for additional public policy instruments to limit soil degradation in all EU countries.
Our research provides a unique insight into the evolution of the Agenda 2030 indicators specific to organic agriculture, highlighting strengths and weaknesses that are likely to materialize by the 2030 horizon, as long as the current trend in the values of these indicators is maintained for the coming years. The results obtained are all the more important as integrated studies on these aspects are becoming increasingly necessary in order to provide all stakeholders with a solid basis for making decisions that can improve performance in organic farming and thus achieve sustainable development goals.
5. Conclusions
The significance of organic agriculture in EU countries and the persistent apprehensions voiced by all decision makers at the EU level are apparent. Nevertheless, the findings of our investigation indicate numerous inconsistencies among Member States regarding their current stage of progress and capability to attain the particular objectives of the 2030 Agenda for Sustainable Development concerning organic agriculture.
At the EU level, the importance of organic agriculture is widely recognized; however, significant disparities exist among European countries in terms of their development. To address this issue, our research sought to assess the potential for achieving the 2030 Agenda targets for selected relevant indicators in the organic agriculture sector. By modeling the available Eurostat data on 15 defining indicators included in SDGs 2, 6, 13, 14, and 15, our study fills an important knowledge gap and provides valuable insights to stakeholders. While some positive developments were observed towards the 2030 targets, our findings also suggest potential negative impacts with significant risks to both people and the environment.
The results of our research indicate that the indicators analyzed are mostly on a positive trend towards 2030. Thus, for the indicators Area under organic farming, Nitrate in groundwater, Net GHG emissions, Share of forest area, and Surface of the terrestrial protected areas, the results obtained indicate particularly good results, with the vast majority of EU Member States registering positive results. The analyses carried out suggest a high probability of achieving the targets assumed by Agenda 2030, both at the national and European level.
Furthermore, following the application of the proposed research methodology, it can be observed that, for a number of relevant indicators included in the analysis, the projected results for the year 2030 indicate mixed developments, both positive and negative, for the Member States, but in general positive developments at the EU level. Thus, for the indicators Agricultural factor income per annual work unit, Ammonia emissions, Phosphate in rivers, Water exploitation index, and Net GHG emissions of the land use, land use change, and forestry (LULUCF) sector, the results obtained from the research indicate European countries for which positive developments are forecast, as well as countries for which poor results are estimated. For the latter, there is a need for the greater involvement of and support from stakeholders to implement measures to correct the negative trend forecast, in order to reduce the negative effects.
In the end, our research also highlighted two indicators for which a negative evolution is estimated for the horizon of 2030, namely for the indicators Marine waters affected by eutrophication and Soil sealing index. In the case of the first indicator, the results obtained are mixed, but predominantly negative, and in the case of the soil sealing index, the forecast results unanimously indicate a negative trend, which suggests a high probability of missing the targets set to be reached for these indicators by 2030.
The outcomes of this research ought to be considered in the context of the inherent restrictions and limitations that are intrinsic to predictive analyses of this kind. The most important limitation of this study is that the framework for monitoring progress towards the SDG targets does not include specific indicators monitored solely on the basis of organic farming data. Moreover, the absence or inconsistency of data, flaws in the model employed for forecasting, or political, economic, and social factors could affect the obtained results as well as the future scenarios. Even if the accuracy of the results obtained can be questioned due to limitations, the trend information provided by the indicators considered for each individual European country, as well as the aggregated EU-wide values, can provide extremely valuable information for policy makers, researchers, or stakeholders to assess the potential for future development if the current state of affairs is maintained.
Our research has contributed to the existing knowledge gap on the potential of achieving the 2030 Agenda targets for organic agriculture. The information obtained from this study can be useful in informing decisions and actions taken by involved parties. Furthermore, we hope that our findings will stimulate further research and deepen the understanding of various aspects, thus promoting organic agriculture and sustainable development. Time is of the essence in achieving the targets set by the 2030 Agenda for Sustainable Development, and any deviation from these targets will have adverse effects not only on the present generation but also on future generations.
Author Contributions
Conceptualization, D.F. and G.H.I.; Investigation, R.L.P., A.C. and D.M.M.; Methodology, D.F., G.H.I. and R.P.; Supervision, D.F., G.H.I. and R.P.; Writing—original draft, D.F. and G.H.I.; Writing—review and editing, D.F., G.H.I., R.L.P., A.C., D.M.M. and R.P. All authors have read and agreed to the published version of the manuscript.
Funding
This research received no external funding.
Institutional Review Board Statement
Not applicable.
Informed Consent Statement
Not applicable.
Data Availability Statement
Not applicable.
Conflicts of Interest
The authors declare no conflict of interest.
References
- United Nations. Transforming Our World: The 2030 Agenda for Sustainable Development. 2015. Available online: www.https://sustainabledevelopment.un.org (accessed on 10 April 2023).
- United Nations, Department of Economic and Social Affairs, Population Division. World Population Prospects 2022. 2022. Available online: https://population.un.org/wpp/Download/Standard/MostUsed/ (accessed on 10 April 2023).
- OECD/FAO. OECD-FAO Agricultural Outlook 2018–2027; OECD Publishing: Paris, France; FAO: Rome, Italy, 2018. [Google Scholar]
- FAO. The State of World Fisheries and Aquaculture 2018—Meeting the Sustainable Development Goals; Food and Agriculture Organization of the United Nations: Rome, Italy, 2018. [Google Scholar]
- Research Institute of Organic Agriculture FiBL IFOAM—Organics International. The World of Organic Agriculture Statistics and Emerging Trends 2023. 2023. Available online: https://www.fibl.org/fileadmin/documents/shop/1254-organic-world-2023.pdf (accessed on 12 April 2023).
- Research Institute of Organic Agriculture FiBL IFOAM—Organics International. The World of Organic Agriculture Statistics and Emerging Trends 2021. 2021. Available online: https://www.fibl.org/fileadmin/documents/shop/1150-organic-world-2021.pdf (accessed on 12 April 2023).
- Eurostat. Organic Farming Statistics. 2023. Available online: https://ec.europa.eu/eurostat/statistics-explained/index.php?title=Organic_farming_statistics#Organic_production (accessed on 12 April 2023).
- Bennetzen, E.H.; Smith, P.; Porter, J.R. Agricultural production and greenhouse gas emissions from world regions—The major trends over 40 years. Glob. Environ. Change 2016, 37, 43–55. [Google Scholar] [CrossRef]
- Rockström, J.; Sukhdev, P. How Food Connects All the SDGs—Stockholm Resilience Centre. 2016. Available online: https://www.stockholmresilience.org/research/research-news/2016-06-14-how-food-connects-all-the-sdgs.html (accessed on 25 May 2023).
- Seufert, V. Comparing Yields: Organic versus Conventional Agriculture. In Encyclopedia of Food Security and Sustainability; Ferranti, P., Berry, E., Jock, A., Eds.; Elsevier: San Diego, CA, USA, 2019; pp. 196–208. [Google Scholar]
- Shennan, C.; Krupnik, T.J.; Baird, G.; Cohen, H.; Forbush, K.; Lovell, R.J.; Olimpi, E.M. Organic and Conventional Agriculture: A Useful Framing? Annu. Rev. Environ. Resour. 2017, 42, 317–346. [Google Scholar] [CrossRef]
- The Council of European Union. Council Regulation (EC) No 834/2007 of 28 June 2007 on Organic Production and Labelling of Organic Products and Repealing Regulation (EEC) No 2092/91. 2007. Available online: https://eur-lex.europa.eu/legal-content/EN/TXT/?uri=CELEX:32007R0834 (accessed on 15 April 2023).
- The Council of European Union. Commission Regulation (EC) No 889/2008 of 5 September 2008 Laying down Detailed Rules for the Implementation of Council Regulation (EC) No 834/2007 on Organic Production and Labelling of Organic Products with Regard to Organic Production, Labelling and Control. 2008. Available online: https://eur-lex.europa.eu/legal-content/EN/ALL/?uri=CELEX%3A32008R0889 (accessed on 15 April 2023).
- IFOAM Organics International. Organic Agriculture and the Sustainable Development Goals. 2019. Available online: https://archive.ifoam.bio/sites/default/files/nm19_329_report_sdg_lr.pdf (accessed on 15 April 2023).
- Arben, M.; Gould, D.; Stopes, C. Organic 3.0—For Truly Sustainable Farming and Consumption; IFOAM—Organics International and SOAAN: Bonn, Germany, 2016; Available online: https://www.ifoam.bio/sites/default/files/2020-03/summary_organic3.0_web_1.pdf (accessed on 14 April 2023).
- Padel, S.; Röcklinsberg, H.; Verhoog, H.; Fjelsted Alrøe, H.; de Wit, J.; Kjeldsen, C.; Schmid, O. Balancing and Integrating Basic Values in the Development of Organic Regulations and Standards: Proposal for a Procedure Using Case Studies of Conflicting Areas, Report from the Organic Revision Project. 2007. Available online: https://orgprints.org/id/eprint/10940/1/D_2_3_Integrating_values_final_2007.pdf (accessed on 15 April 2023).
- Aleixandre, J.L.; Aleixandre-Tudó, J.L.; Bolaños-Pizarro, M.; Aleixandre-Benavent, R. Mapping the scientific research in organic farming: A bibliometric review. Scientometrics 2015, 105, 295–309. [Google Scholar] [CrossRef]
- Bengtsson, J.; Ahnström, J.; Weibull, A.C. The effects of organic agriculture on biodiversity and abundance: A meta-analysis. J. Appl. Ecol. 2005, 42, 261–269. [Google Scholar] [CrossRef]
- Boone, L.; Roldán-Ruiz, I.; Van Linden, V.; Muylle, H.; Dewulf, J. Environmental sustainability of conventional and organic farming: Accounting for ecosystem services in life cycle assessment. Sci. Total Environ. 2019, 695, 133841. [Google Scholar] [CrossRef] [PubMed]
- Clark, M.; Tilman, D. Comparative analysis of environmental impacts of agricultural production systems, agricultural input efficiency, and food choice. Environ. Res. Lett. 2017, 12, 064016. [Google Scholar] [CrossRef]
- Vavrik, U.A. Securing Planetary Health and Sustainable Food Systems with Global Organic Agriculture: Best Practice from Austria. In Case Studies on Sustainability in the Food Industry; Idowu, S.O., Schmidpeter, R., Eds.; Management for Professionals; Springer: Cham, Switzerland, 2022. [Google Scholar]
- Foguesatto, R.; Borges, R.; Machado, D. A review and some reflections on farmers’ adoption of sustainable agricultural practices worldwide. Sci. Total Environ. 2020, 729, 138831. [Google Scholar] [CrossRef]
- Lamichhane, S.; Eğilmez, G.; Gedik, R.; Khurrum, S.; Erenay, B. Benchmarking OECD countries’ sustainable development performance: A goal-specific principal component analysis approach. J. Clean. Prod. 2021, 287, 125040. [Google Scholar] [CrossRef]
- Kledal, P.; Kjeldsen, C.; Refsgaard, K.; Söderbaum, P. Ecological Economics and Organic Farming. In Global Development of Organic Agriculture; Halberg, N., Alrøe, H.F., Knudsen, M.T., Kristensen, E.S., Eds.; CABI Publishing: Wallingford, UK, 2006; pp. 113–133. [Google Scholar]
- McGuire, S. FAO, IFAD, and WFP. The state of food insecurity in the world 2015: Meeting the 2015 international hunger targets: Taking stock of uneven progress. Rome: FAO, 2015. Adv. Nutr. 2015, 6, 623–624. [Google Scholar] [CrossRef]
- Meemken, E.-M.; Qaim, M. Organic Agriculture, Food Security, and the Environment. Annu. Rev. Resour. Econ. 2018, 10, 39–63. [Google Scholar] [CrossRef]
- Eyhorn, F.; Muller, A.; Reganold, J.P.; Frison, E.; Herren, H.R.; Luttikholt, L.; Mueller, A.; Sanders, J.; El-Hage Scialabba, N.; Seufert, V.; et al. Sustainability in global agriculture driven by organic farming. Nat. Sustain. 2019, 2, 253–255. [Google Scholar] [CrossRef]
- Gennari, P.; Rosero-Moncayo, J.; Tubiello, F.N. The FAO contribution to monitoring SDGs for food and agriculture. Nat. Plants 2019, 5, 1196–1197. [Google Scholar] [CrossRef] [PubMed]
- Eurostat. Agricultural Factor Income per Annual Work Unit (AWU). 2023. Available online: https://ec.europa.eu/eurostat/databrowser/view/SDG_02_20/default/table?lang=en (accessed on 15 April 2023).
- Eurostat. Area Under Organic Farming. 2023. Available online: https://ec.europa.eu/eurostat/databrowser/view/SDG_02_40/default/table?lang=en (accessed on 15 April 2023).
- Eurostat. Use of More Hazardous Pesticides. 2023. Available online: https://ec.europa.eu/eurostat/databrowser/view/SDG_02_52/default/table?lang=en (accessed on 15 April 2023).
- Eurostat. Ammonia Emissions from Agriculture. 2023. Available online: https://ec.europa.eu/eurostat/databrowser/view/SDG_02_60/default/table?lang=en (accessed on 15 April 2023).
- Guth, M.; Smędzik-Ambroży, K.; Czyżewski, B.; Stępień, S. The Economic Sustainability of Farms under Common Agricultural Policy in the European Union Countries. Agriculture 2020, 10, 34. [Google Scholar] [CrossRef]
- Brody, M.; Hristov, J.; Höjgård, S.; Jansson, T.; Johansson, H.; Larsson, C.; Nordin, I.; Rabinowicz, E. Impacts of Direct Payments Lessons for CAP Post-2020 from a Quantitative Analysis; AgriFood Economics Centre: Lund, Sweden, 2017. [Google Scholar]
- Smędzik-Ambroży, K.; Guth, M.; Stępień, S.; Brelik, A. The Influence of the European Union’s Common Agricultural Policy on the Socio-Economic Sustainability of Farms (the Case of Poland). Sustainability 2019, 11, 7173. [Google Scholar] [CrossRef]
- Tscharntke, T.; Grass, I.; Wanger, T.C.; Westphal, C.; Batáry, P. Beyond organic farming—Harnessing biodiversity-friendly landscapes. Trends Ecol. Evol. 2021, 36, 919–930. [Google Scholar] [CrossRef] [PubMed]
- Tscharntke, T.; Clough, Y.; Wanger, T.C.; Jackson, L.; Motzke, I.; Perfecto, I.; Vandermeer, J.; Withbread, A. Global food security, biodiversity conservation and the future of agricultural intensification. Biol. Conserv. 2012, 151, 53–59. [Google Scholar] [CrossRef]
- Diacono, M.; Persiani, A.; Testani, E.; Montemurro, F.; Ciaccia, C. Recycling Agricultural Wastes and By-products in Organic Farming: Biofertilizer Production, Yield Performance and Carbon Footprint Analysis. Sustainability 2019, 11, 3824. [Google Scholar] [CrossRef]
- Westerman, P.W.; Bicudo, J.R. Management considerations for organic waste use in agriculture. Bioresour. Technol. 2005, 96, 215–221. [Google Scholar] [CrossRef]
- Firoiu, D.; Ionescu, G.H.; Pîrvu, R.; Cismaș, L.M.; Tudor, S.; Patrichi, I.C. Dynamics of Implementation of SDG 7 Targets in EU Member States 5 Years after the Adoption of the Paris Agreement. Sustainability 2021, 13, 8284. [Google Scholar] [CrossRef]
- Ponnuchamy, M.; Ashish, K.; Senthil Kumar, P.; Vo, D.-V.N.; Balakrishnan, A.; Jacob, M.M.; Sivaraman, P. Environmental Chemistry Letters. Dordrecht 2021, 19, 2425–2463. [Google Scholar]
- Kongtip, P.; Nankongnab, N.; Mahaboonpeeti, R.; Bootsikeaw, S.; Batsungnoen, K.; Hanchenlaksh, C.; Tipayamongkholgul, M.; Woskie, S. Differences among Thai Agricultural Workers’ Health, Working Conditions, and Pesticide Use by Farm Type. Ann. Work. Expo. Health 2018, 62, 167–181. [Google Scholar] [CrossRef] [PubMed]
- Orawan, K.; Kongtip, P.; Woskie, S. Occupational health and safety for agricultural workers in Thailand: Gaps and recommendations, with a focus on pesticide use. NEW SOLUTIONS A J. Environ. Occup. Health Policy 2015, 25, 102–120. [Google Scholar]
- Lykogianni, M.; Bempelou, E.; Karamaouna, F.; Aliferis, K.A. Do pesticides promote or hinder sustainability in agriculture? The challenge of sustainable use of pesticides in modern agriculture. Sci. Total Environ. 2021, 795, 148625. [Google Scholar] [CrossRef] [PubMed]
- Sharifzadeh, M.S.; Abdollahzadeh, G.; Damalas, C.A.; Rezaei, R. Farmers’ Criteria for Pesticide Selection and Use in the Pest Control Process. Agriculture 2018, 8, 24. [Google Scholar] [CrossRef]
- Damalas, C.A.; Gholamhossein, A. Farmers’ use of personal protective equipment during handling of plant protection products: Determinants of implementation. Sci. Total Environ. 2016, 571, 730–736. [Google Scholar] [CrossRef] [PubMed]
- Ti, C.; Xia, L.; Chang, S.X.; Yan, X. Potential for mitigating global agricultural ammonia emission: A meta-analysis. Environ. Pollut. 2019, 245, 141–148. [Google Scholar] [CrossRef]
- Webb, J.; Audsley, E.; Williams, A.; Pearn, K.; Chatterton, J. Can UK livestock production be configured to maintain production while meeting targets to reduce emissions of greenhouse gases and ammonia? J. Clean. Prod. 2014, 83, 204–211. [Google Scholar] [CrossRef]
- Webb, J.; Pain, B.; Bittman, S.; Morgan, J. The impacts of manure application methods on emissions of ammonia, nitrous oxide and on crop response—A review. Agric. Ecosyst. Environ. 2010, 137, 39–46. [Google Scholar] [CrossRef]
- Emmerling, C.; Krein, A.; Junk, J. Meta-Analysis of Strategies to Reduce NH3 Emissions from Slurries in European Agriculture and Consequences for Greenhouse Gas Emissions. Agronomy 2020, 10, 1633. [Google Scholar] [CrossRef]
- Petersen, S.O.; Højberg, O.; Poulsen, M.; Schwab, C.; Eriksen, J. Methanogenic community changes, and emissions of methane and other gases, during storage of acidified and untreated pig slurry. J. Appl. Microbiol. 2014, 117, 160–172. [Google Scholar] [CrossRef]
- Lamastra, L.; Suciu, N.A.; Trevisan, M. Sewage sludge for sustainable agriculture: Contaminants’ contents and potential use as fertilizer. Chem. Biol. Technol. Agric. 2018, 5, 10. [Google Scholar] [CrossRef]
- Pimentel, D.; Hepperly, P.; Hanson, J.; Douds, D.; Seidel, R. Environmental, Energetic, and Economic Comparisons of Organic and Conventional Farming Systems. BioScience 2005, 55, 573–582. [Google Scholar] [CrossRef]
- Sadoff, C.W.; Borgomeo, E.; Uhlenbrook, S. Rethinking water for SDG 6. Nat. Sustain. 2020, 3, 346–347. [Google Scholar] [CrossRef]
- Eurostat. Biochemical Oxygen Demand in Rivers. 2023. Available online: https://ec.europa.eu/eurostat/databrowser/view/SDG_06_30/default/table?lang=en (accessed on 15 April 2023).
- Eurostat. Nitrate in Groundwater. 2023. Available online: https://ec.europa.eu/eurostat/databrowser/view/SDG_06_40/default/table?lang=en (accessed on 15 April 2023).
- Eurostat. Phosphate in Rivers. 2023. Available online: https://ec.europa.eu/eurostat/databrowser/view/SDG_06_50/default/table?lang=en (accessed on 15 April 2023).
- Eurostat. Water Exploitation Index, Plus (WEI+). 2023. Available online: https://ec.europa.eu/eurostat/databrowser/view/SDG_06_60/default/table?lang=en (accessed on 15 April 2023).
- Tao, H.; Bobaker, A.M.; Ramal, M.M.; Yassen, Z.M.; Hossain, M.S.; Shahid, S. Determination of biochemical oxygen demand and dissolved oxygen for semi-arid river environment: Application of soft computing models. Environ. Sci. Pollut. Res. 2019, 26, 923–937. [Google Scholar] [CrossRef]
- Bouamar, M.; Ladjal, M. A comparative study of RBF neural network and SVM classification techniques performed on real data for drinking water quality. In Proceedings of the 2008 5th International Multi-Conference on Systems Signals and Devices, Amman, Jordan, 20–22 July 2008; pp. 1–5. [Google Scholar]
- Diamantini, E.; Lutz, S.R.; Mallucci, S.; Majone, B.; Merz, R.; Bellin, A. Driver detection of water quality trends in three large European river basins. Sci. Total Environ. 2018, 612, 49–62. [Google Scholar] [CrossRef]
- Aguilera, R.; Marcé, R.; Sabater, S. Detection and attribution of global change effects on river nutrient dynamics in a large Mediterranean basin. Biogeosciences 2015, 12, 4085–4098. [Google Scholar] [CrossRef]
- Abascal, A.; Gómez-Coma, L.; Ortiz, I.; Ortiz, A. Global diagnosis of nitrate pollution in groundwater and review of removal technologies. Sci. Total Environ. 2022, 810, 152233. [Google Scholar] [CrossRef]
- Huno, S.K.M.; Rene, E.R.; van Hullebusch, E.D.; Annachhatre, A.P. Nitrate removal from groundwater: A review of natural and engineered processes. J. Water Supply Res. Technol.-Aqua 2018, 67, 885–902. [Google Scholar] [CrossRef]
- Martinelli, G.; Dadomo, A.; De Luca, D.A.; Mazzola, M.; Lasagna, M.; Pennisi, M.; Pilla, G.; Sacchi, E.; Saccon, P. Nitrate sources, accumulation and reduction in groundwater from Northern Italy: Insights provided by a nitrate and boron isotopic database. Appl. Geochem. 2018, 91, 23–35. [Google Scholar] [CrossRef]
- Zhu, X.; Ma, J. Recent advances in the determination of phosphate in environmental water samples: Insights from practical perspectives. TrAC Trends Anal. Chem. 2020, 127, 115908. [Google Scholar] [CrossRef]
- Li, H.; Fang, T.; Tan, Q.-G.; Ma, J. Development of a versatile smartphone-based environmental analyzer (vSEA) and its application in on-site nutrient detection. Sci. Total Environ. 2022, 838, 156197. [Google Scholar] [CrossRef] [PubMed]
- Forano, C.; Farhat, H.; Mousty, C. Recent trends in electrochemical detection of hosphate in actual waters. Curr. Opin. Electrochem. 2018, 11, 55–61. [Google Scholar] [CrossRef]
- Basavegowda, N.; Baek, K.H. Current and future perspectives on the use of nanofertilizers for sustainable agriculture: The case of phosphorus nanofertilizer. 3 Biotech 2021, 11, 357. [Google Scholar] [CrossRef] [PubMed]
- Abdel-Aziz, H.M.M.; Hasaneen, M.N.A.; Omer, A.M. Nano chitosan-NPK fertilizer enhances the growth and productivity of wheat plants grown in sandy soil. Span. J. Agric. Res. 2016, 14, e0902. [Google Scholar] [CrossRef]
- Jouzi, Z.; Azadi, H.; Taheri, F.; Zarafshani, K.; Gebrehiwot, K.; Van Passel, S.; Lebailly, P. Organic Farming and Small-Scale Farmers: Main Opportunities and Challenges. Ecol. Econ. 2017, 132, 144–154. [Google Scholar] [CrossRef]
- Scialabba, N.E.-H.; Müller-Lindenlauf, M. Organic Agriculture and Climate Change. Renew. Agric. Food Syst. 2010, 25, 158–169. [Google Scholar] [CrossRef]
- Eurostat. Net Greenhouse Gas Emissions. 2023. Available online: https://ec.europa.eu/eurostat/databrowser/view/SDG_13_10/default/table?lang=en (accessed on 15 April 2023).
- Eurostat. Net Greenhouse Gas Emissions of the Land Use, Land Use Change and Forestry (LULUCF) Sector. 2023. Available online: https://ec.europa.eu/eurostat/databrowser/view/SDG_13_21/default/table?lang=en (accessed on 15 April 2023).
- Wang, C.; Liu, J.; Shen, J.; Chen, D.; Li, Y.; Jiang, B.; Wu, J. Effects of biochar amendment on net greenhouse gas emissions and soil fertility in a double rice cropping system: A 4-year field experiment. Agric. Ecosyst. Environ. 2018, 262, 83–96. [Google Scholar] [CrossRef]
- Luo, Y.; Durenkamp, M.; De Nobili, M.; Lin, Q.; Brookes, P.C. Short term soil priming effects and the mineralisation of biochar following its incorporation to soils of different pH. Soil Biol. Biochem. 2011, 43, 2304–2314. [Google Scholar] [CrossRef]
- McGlynn, E.; Li, S.; Berger, F.M.; Amend, M.; Harper, L.K. Addressing uncertainty and bias in land use, land use change, and forestry greenhouse gas inventories. Clim. Change 2022, 170, 5. [Google Scholar] [CrossRef]
- Cojocaru, T.M.; Ionescu, G.H.; Firoiu, D.; Cismaș, L.M.; Oțil, M.D.; Toma, O. Reducing Inequalities within and among EU Countries—Assessing the Achievement of the 2030 Agenda for Sustainable Development Targets (SDG 10). Sustainability 2022, 14, 7706. [Google Scholar] [CrossRef]
- Friedlingstein, P.; O’Sullivan, M.; Jones, M.W.; Andrew, R.M.; Hauck, J.; Olsen, A.; Peters, G.P.; Peters, W.; Pongratz, J.; Sitch, S.; et al. Global Carbon Budget. Earth Syst. Sci. Data 2020, 12, 3269–3340. [Google Scholar] [CrossRef]
- Eurostat. Marine Waters Affected by Eutrophication. 2023. Available online: https://ec.europa.eu/eurostat/databrowser/view/SDG_14_60/default/table?lang=en (accessed on 15 April 2023).
- Rozemeijer, J.; Noordhuis, R.; Ouwerkerk, K.; Pires, M.D.; Blauw, A.; Hooijboer, A.; van Oldenborgh, G.J. Climate variability effects on eutrophication of groundwater, lakes, rivers, and coastal waters in the Netherlands. Sci. Total Environ. 2021, 771, 145366. [Google Scholar] [CrossRef] [PubMed]
- Kakade, A.; Salama, E.-S.; Han, H.; Zheng, Y.; Kulshrestha, S.; Jalalah, M.; Harraz, F.A.; Alsareii, S.A.; Li, X. World eutrophic pollution of lake and river: Biotreatment potential and future perspectives. Environ. Technol. Innov. 2021, 23, 101604. [Google Scholar] [CrossRef]
- Eurostat. Share of Forest Area. 2023. Available online: https://ec.europa.eu/eurostat/databrowser/view/SDG_15_10/default/table?lang=en (accessed on 15 April 2023).
- Eurostat. Surface of the Terrestrial Protected Areas. 2023. Available online: https://ec.europa.eu/eurostat/databrowser/view/SDG_15_20/default/table?lang=en (accessed on 15 April 2023).
- Eurostat. Soil Sealing Index. 2023. Available online: https://ec.europa.eu/eurostat/databrowser/view/SDG_15_41/default/table?lang=en (accessed on 15 April 2023).
- Schaefer, M.; Thinh, N.X. Evaluation of Land Cover Change and Agricultural Protection Sites: A GIS and Remote Sensing Approach for Ho Chi Minh City, Vietnam. Heliyon 2019, 5, e01773. [Google Scholar] [CrossRef]
- Langella, G.; Basile, A.; Giannecchini, S.; Moccia, F.D.; Mileti, F.A.; Munafó, M.; Pinto, F.; Terribile, F. Soil Monitor: An internet platform to challenge soil sealing in Italy. Land Degrad. Dev. 2020, 31, 2883–2900. [Google Scholar] [CrossRef]
- Luti, T.; Segoni, S.; Catani, F.; Munafò, M.; Casagli, N. Integration of Remotely Sensed Soil Sealing Data in Landslide Susceptibility Mapping. Remote Sens. 2020, 12, 1486. [Google Scholar] [CrossRef]
- International Federation of Organic Agriculture Movements EU Group. Organic Farming, Climate Change Mitigation and Beyond. 2016. Available online: https://www.organicseurope.bio/content/uploads/2020/06/ifoameu_advocacy_climate_change_report_2016.pdf?dd (accessed on 25 May 2023).
- Institut Technique de l’Agriculture Biologiques. How Do We Evaluate and Give Economical Values to Organic Farming Externalities? 2018. Available online: http://www.itab.asso.fr/downloads/amenites/organic_farming_externalities_synthesis.pdf (accessed on 25 May 2023).
- Sautereau, N.; Benoit, I.; Savini, I. How Do We Evaluate And Give Economical Values to Organic Farming and Food Externalities? In Proceedings of the 6th ISOFAR Conference Co-Organised with INRA, FiBL, Agroecology Europe, TP Organics and ITAB, Rennes, France, 8–10 September 2021. [Google Scholar]
- Eurostat. Sustainable Development Goals. 2023. Available online: https://ec.europa.eu/eurostat/web/sdi/database (accessed on 15 April 2023).
- Zhang, R.; Song, H.; Chen, Q.; Wang, Y.; Wang, S.; Li, Y. Comparison of ARIMA and LSTM for prediction of hemorrhagic fever at different time scales in China. PLoS ONE 2022, 17, e0262009. [Google Scholar] [CrossRef]
- Verma, P.; Reddy, S.V.; Ragha, L.; Datta, D. Comparison of Time-Series Forecasting Models. In Proceedings of the International Conference on Intelligent Technologies (CONIT), Hubli, India, 25–27 June 2021; pp. 1–7. [Google Scholar]
- Lou, H.R.; Wang, X.; Gao, Y.; Zeng, Q. Comparison of ARIMA model, DNN model and LSTM model in predicting disease burden of occupational pneumoconiosis in Tianjin, China. BMC Public Health 2022, 22, 2167. [Google Scholar] [CrossRef]
- Kirbas, I.; Sozen, A.; Tuncer, A.D.; Kazancioglu, F.S. Comparative analysis and forecasting of COVID-19 cases in various European countries with ARIMA, NARNN and LSTM approaches. Chaos Solitons Fractals 2020, 138, 110015. [Google Scholar] [CrossRef]
- Wang, J.Y.; Li, X.L.; Li, J.Z.; Sun, Q.H.; Wang, H.Y. NGCU: A new RNN model for time-series data prediction. Big Data Res. 2022, 27, 100296. [Google Scholar] [CrossRef]
- Chaurasia, V.; Pal, S. COVID-19 pandemic: ARIMA and regression model-based worldwide death cases predictions. SN Comput. Sci. 2020, 1, 288. [Google Scholar] [CrossRef]
- George, D.; Mallery, P. IBM SPSS Statistics 25 Step by Step, 15th ed.; Routledge: New York, NY, USA, 2018. [Google Scholar]
- Box, G.E.P.; Jenkin, G.M. Time Series of Analysis, Forecasting and Control; Holden-Day: San Francisco, CA, USA, 1976. [Google Scholar]
- Box, G.E.P.; Jenkins, G.M.; Reinsel, G.C. Time Series Analysis, Forecasting and Control, 3rd ed.; Prentice Hall: Bergen County, NJ, USA, 1994. [Google Scholar]
- Abraham, B.; Ledolter, J. Statistical Methods for Forecasting; Wiley: New York, NY, USA, 1983. [Google Scholar]
- Brockwell, P.J.; Davis, R.A. Introduction to Time Series and Forecasting, 2nd ed.; Springer: Berlin/Heidelberg, Germany, 2002. [Google Scholar]
- Hyndman, R.J.; Athanasopoulos, G. Forecasting: Principles and Practice, 3rd ed.; OTexts: Melbourne, Australia, 2019. [Google Scholar]
- Hyndman, R.J.; Koehler, A.B. Another look at measures of forecast accuracy. Int. J. Forecast. 2006, 22, 679–688. [Google Scholar] [CrossRef]
- Davydenko, A.; Fildes, R. Forecast Error Measures: Critical Review and Practical Recommendations. In Business Forecasting: Practical Problems and Solutions; John Wiley & Sons Inc.: Hoboken, NJ, USA, 2016. [Google Scholar]
- European Commission. The European Green Deal. 2019. Available online: https://eur-lex.europa.eu/resource.html?uri=cellar:b828d165-1c22-11ea-8c1f-01aa75ed71a1.0002.02/DOC_1&format=PDF (accessed on 19 April 2023).
- Cialani, C.; Mortazavi, R. Sectoral analysis of club convergence in EU countries’ CO2 emissions. Energy 2021, 235, 121332. [Google Scholar] [CrossRef]
- Baležentis, T.; Dabkienė, V.; Štreimikienė, D. Eco-efficiency and shadow price of greenhouse gas emissions in Lithuanian dairy farms: An application of the slacks-based measure. J. Clean. Prod. 2022, 356, 131857. [Google Scholar] [CrossRef]
- Gaigalis, V.; Katinas, V. Analysis of the renewable energy implementation and prediction prospects in compliance with the EU policy: A case of Lithuania. Renew. Energy 2020, 151, 1016–1027. [Google Scholar] [CrossRef]
- Ceccherini, G.; Duveiller, G.; Grassi, G.; Lemoine, G.; Avitabile, V.; Pilli, R.; Cescatti, A. Abrupt increase in harvested forest area over Europe after 2015. Nature 2020, 83, 72–77. [Google Scholar] [CrossRef]
- Kauppi, P.E.; Sandström, V.; Lipponen, A. Forest resources of nations in relation to human well-being. PLoS ONE 2018, 13, e0196248. [Google Scholar] [CrossRef]
- Visconti, P.; Butchart, S.H.M.; Brooks, T.M.; Langhammer, P.F.; Marnewick, D.; Vergara, S.; Yanosky, A.; Watson, J.E.M. Protected areas targets post-2020. Science 2019, 364, 239–241. [Google Scholar] [CrossRef]
- Jones, K.R.; Venter, O.; Fuller, R.A.; Allan, J.R.; Maxwell, S.R.; Negret, P.J.; Watson, J.E.M. One-third of global protected land is under intense human pressure. Science 2018, 360, 788–791. [Google Scholar] [CrossRef]
- Groenestein, C.M.; Hutchings, N.J.; Haenel, H.D.; Amon, B.; Menzi, H.; Mikkelsen, M.H.; Misselbrook, T.H.; van Bruggen, C.; Kupper, T.; Webb, J. Comparison of ammonia emissions related to nitrogen use efficiency of livestock production in Europe. J. Clean. Prod. 2019, 211, 1162–1170. [Google Scholar] [CrossRef]
- Zhang, X.; Gu, B.; van Grinsven, H.; Lam, S.K.; Liang, X.; Bai, M.; Chen, D. Societal benefits of halving agricultural ammonia emissions in China far exceed the abatement costs. Nat. Commun. 2020, 11, 4357. [Google Scholar] [CrossRef] [PubMed]
- Farmer, A.M. Phosphate pollution: A global overview of the problem. In Phosphorus: Polluter and Resource of the Future—Removal and Recovery from Wastewater; Schaum, C., Ed.; IWA Publishing: London, UK, 2018; pp. 35–55. [Google Scholar]
- Sousa, J.C.G.; Ribeiro, A.R.; Barbosa, M.O.; Ribeiro, C.; Tiritan, M.E.; Fernando, M.; Pereira, R.; Silva, A.M.T. Monitoring of the 17 EU Watch List contaminants of emerging concern in the Ave and the Sousa Rivers. Sci. Total Environ. 2019, 649, 1083–1095. [Google Scholar] [CrossRef] [PubMed]
- Boesch, D.F. Barriers and Bridges in Abating Coastal Eutrophication. Front. Mar. Sci. 2019, 6, 123. [Google Scholar] [CrossRef]
- Bol, R.; Gruau, G.; Mellander, P.-E.; Dupas, R.; Bechmann, M.; Skarbøvik, E.; Bieroza, M.; Djodjic, F.; Glendell, M.; Jordan, P.; et al. Challenges of Reducing Phosphorus Based Water Eutrophication in the Agricultural Landscapes of Northwest Europe. Front. Mar. Sci. 2018, 5, 276. [Google Scholar] [CrossRef]
- Grizzetti, B.; Vigiak, O.; Udias, A.; Aloe, A.; Zanni, M.; Bouraoui, F.; Pistocchi, A.; Dorati, C.; Friedland, R.; De Roo, A.; et al. How EU policies could reduce nutrient pollution in European inland and coastal waters. Glob. Environ. Change 2021, 69, 102281. [Google Scholar] [CrossRef]
- Murray, C.J.; Müller-Karulis, B.; Carstensen, J.; Conley, D.J.; Gustafsson, B.G.; Andersen, J.H. Past, Present and Future Eutrophication Status of the Baltic Sea. Front. Mar. Sci. 2019, 6, 2. [Google Scholar] [CrossRef]
- Jansson, T.; Andersen, H.E.; Gustafsson, B.G.; Hasler, B.; Höglind, L.; Choi, H. Baltic Sea eutrophication status is not improved by the first pillar of the European Union Common Agricultural Policy. Reg. Environ. Change 2019, 19, 2465–2476. [Google Scholar] [CrossRef]
- Stankovics, P.; Tóth, G.; Tóth, Z. Identifying Gaps between the Legislative Tools of Soil Protection in the EU Member States for a Common European Soil Protection Legislation. Sustainability 2018, 10, 2886. [Google Scholar] [CrossRef]
- Ronchi, S.; Salata, S.; Arcidiacono, A.; Piroli, E.; Montanarella, L. Policy instruments for soil protection among the EU member states: A comparative analysis. Land Use Policy 2019, 82, 763–780. [Google Scholar] [CrossRef]
- Ferreira, C.S.S.; Seifollahi-Aghmiuni, S.; Destouni, G.; Ghajarnia, N.; Kalantari, Z. Soil degradation in the European Mediterranean region: Processes, status and consequences. Sci. Total Environ. 2022, 805, 150106. [Google Scholar] [CrossRef]
Disclaimer/Publisher’s Note: The statements, opinions and data contained in all publications are solely those of the individual author(s) and contributor(s) and not of MDPI and/or the editor(s). MDPI and/or the editor(s) disclaim responsibility for any injury to people or property resulting from any ideas, methods, instructions or products referred to in the content. |
© 2023 by the authors. Licensee MDPI, Basel, Switzerland. This article is an open access article distributed under the terms and conditions of the Creative Commons Attribution (CC BY) license (https://creativecommons.org/licenses/by/4.0/).