Article

Assessment of Potential Pennycress Availability and Suitable Sites for Sustainable Aviation Fuel Refineries in Ohio

1
Department of Food, Agricultural and Biological Engineering, The Ohio State University, Columbus, OH 43210, USA
2
Forest Products Laboratory, United States Forest Service, 1 Gifford Pinchot Drive, Madison, WI 53726, USA
*
Author to whom correspondence should be addressed.
Sustainability 2023, 15(13), 10589; https://doi.org/10.3390/su151310589
Submission received: 24 January 2023 / Revised: 24 June 2023 / Accepted: 27 June 2023 / Published: 5 July 2023

Abstract

:
Pennycress grain has a relatively high oil content (25–36%) and it is considered a desirable feedstock to produce sustainable aviation fuel (SAF). Pennycress crop can be integrated into the corn–soybean rotation as a winter cover crop in the midwestern U.S. to provide both ecosystem services and economic benefits for the farmers, while serving as a promising feedstock for SAF production. For pennycress-based SAF biorefineries to be established at the commercial scale, a sustainable design of the supply system is required to provide reliable information on feedstock availability and optimal facility locations. The objectives of this research were to assess the pennycress production potential in Ohio, and to identify the best locations to establish the SAF biorefineries. To estimate the pennycress production potential in Ohio, a geographic information system (GIS)-based model was developed using the spatially explicit six-year historical data on areas that were planted in the corn–soybean rotation for the period of 2013 through 2018, pennycress yield estimates from field-based experiments reported in the literature, and the soil productivity index for the region of study. Optimal SAF biorefinery locations were identified using a GIS-based location-allocation model. Annual land potentially available for pennycress production in Ohio was estimated to be ~0.6 million ha, which could produce ~1.1 million metric tons of pennycress grain as feedstock to produce ~210 million liters of SAF, depending on the pennycress yield level, oil content, and conversion efficiencies. In addition, the optimum locations for 12 biorefineries, each at an annual capacity of 18.9 million liters of SAF, were identified, and the average transportation distance was estimated to be 35 and 58 km for maximizing attendance and coverage conditions, respectively. The outcomes of this research would help minimize the risks associated with feedstock supply and cost variabilities for pennycress-based SAF production in the region.

1. Introduction

Replacing fossil aviation fuels with renewable jet fuel from biobased resources offers a potential solution to decrease the environmental impacts associated with this industry, and to ensure energy security [1]. Several types of feedstocks, including lignocellulosic biomass such as corn stover, oil-based feedstocks such as camelina and carinata, and sugar-based feedstocks such as corn grain, have been identified as potential sources to produce sustainable aviation fuel (SAF) [2,3,4,5,6,7,8,9]. In addition, several SAF production routes from biobased feedstocks have been technologically approved by the American Society for Testing and Materials (ASTM) [10,11,12,13]. However, the sustainable establishment of the biorefineries to commercially produce SAF from biobased feedstocks is still challenging. One of the main issues is feedstock supply at a reasonable price, which plays a major role in the successful operations of SAF biorefineries [14,15]. This requires reliable information on the spatiotemporal availability of feedstock and existing logistics systems to reduce the time, resources, and cost of feedstock supply for continuous operations of the biorefineries [16].
Pennycress has a relatively higher grain oil content (25–36%) compared to similar oilseeds, such as soybean (~20%), and the fatty acid profile of pennycress oil has desirable characteristics, which make it suitable for conversion to SAF [17,18]. The crop can potentially be planted in September and harvested in May in most of the regions in the midwestern U.S. [19]. Considering the relatively shorter growing season of pennycress compared to similar oilseeds, it is considered as a suitable winter cover crop for integrating into the corn–soybean rotation in most of the corn belt region of the U.S. [20,21]. Thus, it can be produced without additional land requirements, which prevents competition with row crops, thereby avoiding the food versus fuel debate. In addition, the crop needs less inputs, and it can be produced at a lower price compared to similar oilseeds, such as camelina and canola [22,23]. It is estimated that there is more than 12 million ha of land in the midwestern U.S. which is suitable for growing pennycress [24]. Plantation of pennycress as a cover crop in these lands provides several environmental benefits, such as a reduction in nutrient runoff, leaching, and soil erosion, enhanced carbon sequestration, and improved soil health, which directly or indirectly help increase the productivity of other subsequent row crops planted after pennycress, thereby increasing profitability for the farmers [23,25]. Despite such potential advantages, plantation of pennycress is limited, and it is mainly due to knowledge gaps from micro- (production benefits) to macro-scales (local to national institutional and policy drivers). Identifying the area of potential pennycress production and the potential logistics systems for establishing the pennycress-based SAF biorefineries help address such a knowledge gap.
Sustainable design, establishment, and operation of biorefineries require a thorough assessment of the local availability of feedstock [26]. Identification of the optimal locations for establishment of the biorefineries, i.e., location-allocation, can be realistically accomplished using geospatial analysis tools to reduce the costs and risks associated with feedstock supply [16,27]. Geographic information system (GIS)-based location-allocation is one of the most efficient approaches for identifying the optimal locations for the biorefineries to minimize the feedstock transportation costs [27,28]. This technique has been previously used for strategic planning towards minimizing the cost of biowaste-to-bioethanol [29] and camelina-based biodiesel [30] supply chain systems. Considering the features of the Network Analyst extension in ArcGIS [31], GIS-based models on the assessment of potential pennycress harvest and location-allocation of the biorefineries can provide information on the physical locations of the production system (i.e., pennycress farms), optimal logistics systems (i.e., road networks and distances), and optimal locations of demand points (i.e., oil extraction facilities and SAF biorefineries). This information can help reduce the risk associated with feedstock supply and cost variabilities of pennycress-based SAF production at a large scale.
The GIS-based approach has been previously used in several studies to estimate potential resources’ availability as well as the optimal locations of the biorefineries, such as the potential agricultural biomass availability assessment in India [32] and the potential biomass availability assessment for electricity generation and site selections of facilities in south Italy [16]. Zhang et al. [33] used a GIS-based method to identify a set of feasible locations for biofuel production facilities in the Upper Peninsula of Michigan, and they identified the best facility locations by solving an optimization problem to minimize the transportation costs of biomass. This approach was also used to assess the potential biomass availability for biogas production and site selection of biogas plants in southern Finland [34]. From this study, it was concluded that this approach can be effectively used for location-allocations of biofuel facilities using the real data on supply points, transportation routes, and distances [34]. More recently, a GIS-based model was constructed to estimate the potential feedstock availability for renewable energy generation from agricultural residues of eight crops in Mexico [35]. A set of criteria, including agriculture residue production, roads, electrical network, population, land use, slope, natural protected areas, waterbodies, natural vegetation, populated areas, airports, and historical sites, were used for the analysis. Their results indicated that 70,000–80,000 MWh/yr of electricity and ~18 million metric tons (MMT)/yr of Fischer-Tropsch liquids could be produced using ~700 MMT/yr of agricultural residues from maize, wheat, sugarcane, barley, sorghum, agave, paddy rice, and pecan nut in Mexico [35].
Considering the existing corn–soybean rotation as the main cropping system in Ohio, pennycress has a huge potential to be produced on a large scale by incorporating it in a corn–soybean rotation. Despite several advantages of pennycress as a promising feedstock for SAF production, the literature lacks information on potential pennycress production at the commercial scale, as well as the optimum locations for establishing the pennycress-based SAF biorefineries. The objectives of this study were to assess the pennycress production potential in Ohio by developing a GIS-based resource assessment model, and to identify the best locations for establishing the SAF biorefineries using a location-allocation model. Areas for potential pennycress production in the corn–soybean rotation in Ohio were identified, and potential pennycress grain production from these areas was estimated using land cover, soil productivity, and pennycress yield data. A set of inclusion and exclusion criteria, such as accessibility to the transportation network and proximity to cities, were used to identify the candidate locations for establishing the biorefineries, and an optimization problem was solved to minimize the transportation distances, and consequently, the logistics costs of feedstock supply to the biorefineries.

2. Materials and Methods

2.1. System Overview

Pennycress can be planted in September in standing corn and harvested in May before planting soybean [36]. Due to the shorter growing season of pennycress, this study considered integration of pennycress as a cover crop into the corn–soybean cropping system to serve as a SAF feedstock, while avoiding competition with row crops for food production [23]. Typical field operations associated with pennycress production include aerial seeding (planting), fertilizing, and spraying for pesticide application (Figure 1). Logistics operations needed for pennycress grain supply include grain harvest using small-grain combine harvesters, at-field handling, transportation from the field to the elevator, as well as at-elevator handling, drying, and storage [22]. Oil extraction through mechanical and solvent extraction processes, as well as oil-to-SAF conversion processes through the hydro-processing pathway, are needed at the biorefinery (Figure 1). Based on a previous work on process simulation of SAF production from pennycress, on average, 1 L of SAF can be produced from 5.6 kg of pennycress [37]. Other co-products are listed in Figure 1. More details of the processes are provided in [37]. This study considered a SAF biorefinery size of 18.9 million liters per year (ML/yr) (i.e., 5 million gallons per year—MG/yr), which was the typical capacity for small-scale biodiesel refineries in the U.S. in 2019 [38].
The corn–soybean rotation is the dominant cropping system in Ohio and the midwestern U.S. Currently, the fields under this cropping system mostly remain fallow during the winter months after corn or soybean are harvested in the fall. Annual land under corn and soybean production in Ohio for the six years of study (2013–2018) are presented in Table 1.

2.2. Data Collection

Multiple data types, including spatial data on the distribution of corn and soybean production areas in Ohio for the last six years (2013–2018), elevation, waterbodies, protected areas, transportation networks, urban areas, and soil productivity based on the Soil Survey Geographic Database (SSURGO), were collected in vector and raster formats from the geospatial data gateway website maintained by the U.S. Department of Agriculture (USDA) [39,40]. A similar range of spatial data on crop production has been used in the literature to estimate the potential biomass availability for bioenergy generation [35]. Information on previously developed models on the technical feasibility and costs of pennycress production and logistics operations [22], as well as oil extraction and conversion processes [37], were pulled from the literature.

2.3. Pennycress Resources’ Assessment

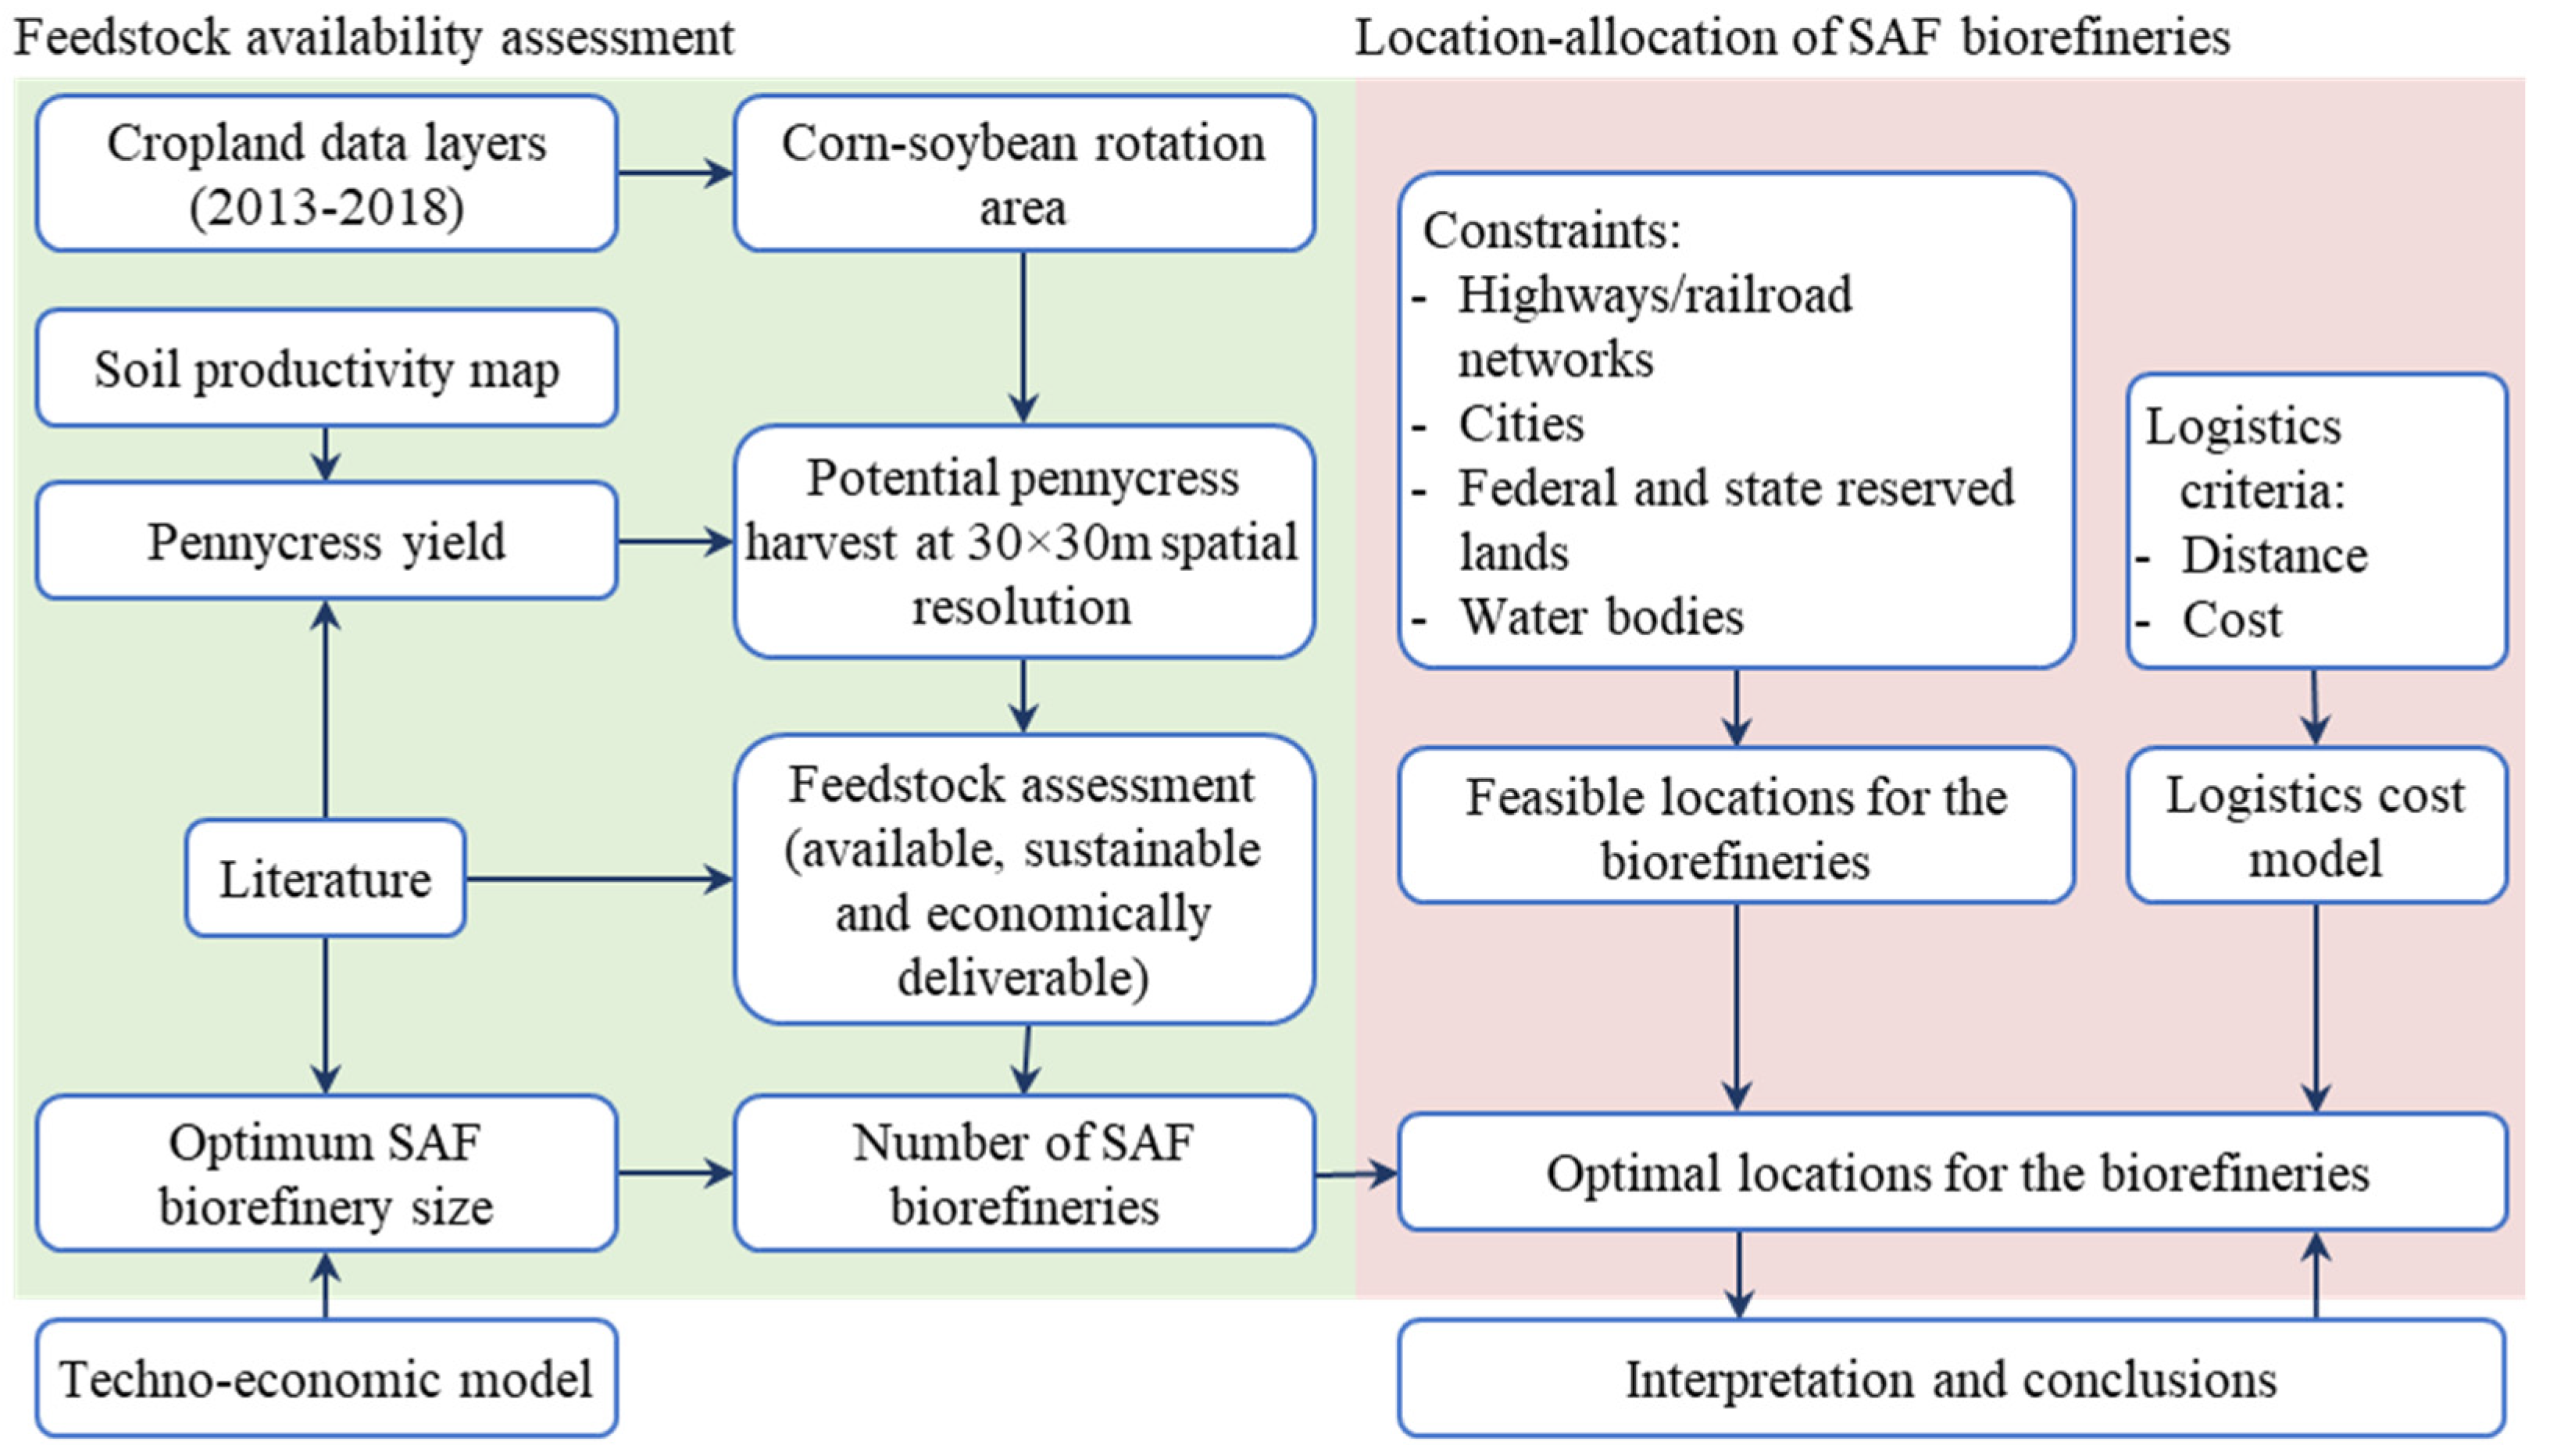
The integrated GIS-based modeling approach was used for the assessment of the potential availability of pennycress and associated logistics required for the establishment of SAF biorefineries in Ohio (Figure 2). Pennycress production potential was estimated using the cropland data layers representing corn and soybean plantation areas in Ohio, and literature on the pennycress yield level. A similar approach was previously used in a lignocellulosic feedstock availability assessment in the northeastern U.S. [41]. A spatial resolution of 30 × 30 m, i.e., the resolution of the cropland data layers [39,40], was used for the analysis to assess the potential pennycress grain production. The maps representing the spatial distribution of pennycress fields in the corn–soybean rotation in Ohio were created by merging individual maps representing corn and soybean for each year for the period of 2013–2018. For instance, a map representing soybean-planting areas in 2017 (Figure S2) was overlapped with a map representing corn-planting areas in 2018 (Figure S3). In this process, only the areas that were consistently in the corn–soybean rotation for six years were considered. Six data layers obtained from the years 2013–2018 were compiled into a single set to allow estimation of the average area for potential pennycress plantation in Ohio. A similar methodology was previously used to estimate the crop residual biomass as feedstock for energy generation in Mexico [35].
Pennycress yield was estimated to be 1500–2500 kg/ha, based on the literature [36,42,43,44,45]. Since spatial variability in soil productivity impacts pennycress yield and thus the potential availability of pennycress for SAF biorefineries, pennycress yield was adjusted based on soil productivity. As an indicator of soil productivity across the state, the National Commodity Crops Productivity Index (NCCPI), available in the SSURGO database for the entire state, was used [39,40]. This index represents soil productivity based on several factors, including soil chemical properties such as pH, available water capacity, bulk density, frost-free days, and precipitation, as well as slope and surface erosion [46]. The NCCPI values range from zero to one, with zero indicating no production and one indicating the highest soil productivity for crop production [46,47]. This indicator has been previously used to estimate the yield level of corn grain [48,49], corn silage [48], soybean [48,49], willow [50], perennial grasses [50], and alfalfa [48]. Burli et al. [47] used the NCCPI to estimate biomass feedstock availability for bioenergy and bioproducts. Since this parameter is not provided specifically for pennycress production, the NCCPI value for small grains was considered for the assessment of the potential pennycress production in this analysis. The NCCPI values of small grains for potential pennycress production areas were extracted and normalized at the state level using the following equations [49]:
N C C P I n = ( N C C P I N C C P I m i n ) ( N C C P I m a x N C C P I m i n )
Y i e l d c a l = 1500 + 963 × N C C P I n
where NCCPIn represents the normalized NCCPI at the state level, NCCPImin and NCCPImax are the minimum and maximum NCCPI for the areas with potential pennycress production, and Yieldcal represents the calibrated yield of pennycress at the state level. The number of SAF biorefineries in the region was estimated by considering the fixed capacity of SAF biorefineries and potential pennycress harvest in the region.

2.4. Location-Allocation of SAF Biorefineries

2.4.1. Identifying the Feasible Biorefinery Locations

Multicriteria inclusion and exclusion analyses were used to identify the feasible areas for establishing the SAF biorefineries (Figure 2). These analyses focused on minimizing the cost of transporting pennycress feedstocks from individual fields to the biorefineries. During multicriteria analyses, several assumptions were made, similar to prior studies focused on location-allocation of biorefineries [27,33]. For instance, the location of a biorefinery was considered close to major state and national highways to ensure connectivity and smooth traffic for large numbers of vehicles when transporting raw materials/products to/from the biorefinery. The feasible areas for establishing the SAF biorefineries were assumed to be in the range of 1 to 3 km from the primary (highways) (Figure S7) and secondary roads (Figure S8). This constraint is needed to avoid locating the biorefineries at the places very close to the transportation networks to avoid traffic, as well as at places very far from the transportation networks to minimize the need for off-road transportation of feedstock and products. This criterion was similarly used in a previous study on optimum site selection for Jatropha oil-based biodiesel plants [51] and palm oil-based bioenergy plants [52]. To implement this criterion, buffer zones of 1–3 km around primary and secondary roads were created (Figure S12). Similarly, the distance of feasible areas for establishing the SAF biorefineries from the urban area (Figure S13) was assumed to be 5–10 km so that the functions of the biorefinery will not be impacted by the human and social activities, and at the same time, the distance is minimum enough to reduce the transportation costs for human resources between the urban areas and the biorefinery. A vector data layer representing buffer zones of 5 to 10 km from the urban areas was created and used for this constraint (Figure S18).
The data layers representing the two-sided buffer zones of primary and secondary roads, and one-sided buffer zones of urban areas, were overlapped (Figure S19), and the resulting data layer was used for inclusion analysis.
Certain areas, such as waterbodies (Figure S20), wetlands (Figure S21), rivers (Figure S22), as well as conservation lands, federal lands, and protected areas (Figure S23), were excluded from the set of feasible locations for establishing the biorefineries [50]. Similarly, areas with a slope higher than 10% (Figure S24) were excluded from the feasible locations to prevent the high costs of biorefinery construction and transportation of feedstock and products. It was also assumed that land with minimum area of 10 ha is required for establishing a biorefinery for the selected capacity. Therefore, the data layers representing these constraints were created and used for the inclusion and exclusion analyses.
The vector data layer representing the conservation and federal lands, protected areas, waterbodies, and rivers (Figure S25) was created and used for exclusion analysis. The resulting vector data layer was converted to raster type and intersected with the raster data layer, representing a suitable slope for establishing the biorefineries. The resulting raster data layer was converted to polygon format, which was filtered by the areas greater than 10 ha. The resulting data layer was used as the feasible locations for establishing the SAF biorefineries. The feasible locations were converted to points, based on the centroid of polygons, representing the feedstock supply points from pennycress fields. These fields were defined as supply points (j = 1, 2, 3, ..., n), which were used for solving the location-allocation model.

2.4.2. Identifying the Optimum Locations of SAF Biorefineries

Pennycress grain availability was one of the main driving factors in identifying the optimum biorefinery locations. This was because the first priority during the site selection process was considered to be areas with a higher potential feedstock supply. In order to find the optimum locations for the pennycress-based SAF biorefineries in the region, the number of biorefineries and their capacities were considered to be fixed. An optimization problem was solved through a linear programming approach to minimize the pennycress transportation costs. The optimization problem was formulated using the following mathematical equations [53]:
M i n i m i z e i = 1 m j = 1 n P D C i j × x i j + j = 1 n y j × f j
P D C i j = q i j [ F G i + ( c + a × d i j ) ]
Subject to:
j = 1 n x i j = 1 ,       j ,   i = 1   t o   m
i = 1 m x i j × q i j y j q Q j                 j , j = 1   t o   n
j = 1 n y j P
where i represents the supply points (i = 1, 2, …, m), j denotes the possible biorefinery sites (j = 1, 2, …, n), PDCij is the pennycress delivery cost between the ith supply point (pennycress field) and jth demand point (biorefinery) locations, fj is the capital cost of locating a jet fuel refinery at location j, qij represents the quantity of feedstock supplied from source i to refinery location j, and FGi represents the farm-gate cost of pennycress at field i, i.e., ranging from 170 to 230 USD/t, with the average cost of 195 USD/t [22], based on a 90% central range of the distribution. Then, a and c are transportation cost constants equal to 0.095 and 0.016 USD/t.km, respectively, and xij is a binary variable, which equals 1 if pennycress is transported from supply point i to the potential biorefinery site j; otherwise, it equals 0. yj is a binary decision variable, being equal to 1 if the location j is selected for the biorefinery (0, otherwise), P represents the number of sites for the biorefinery, Qj represents the capacity of the biorefinery j, and n denotes the number of possible locations. Equation (3) minimizes the total pennycress transportation cost between the farms and biorefineries, which is estimated based on Equation (4). Equation (5) constrains the deliverable location of pennycress to only one biorefinery, while Equation (6) constrains the total biomass supply to a biorefinery to be less than its predefined capacity, and Equation (7) ensures the number of selected biorefineries does not exceed the total number of biorefineries estimated for the region.
In order to identify the set of optimum locations, the criteria of maximizing attendance and maximizing coverage were used. The maximizing attendance problem type was used to service the largest number of pennycress farms while minimizing the overall transportation distance [54]. Under the maximizing attendance situation, it is assumed that the farther a pennycress field is from a specific facility, the less likely pennycress grain will be transported to that facility. This criterion reflects how the area of pennycress harvest allocated to the facilities is reduced with the transportation distance. Under the maximizing coverage situation, a set of solutions will be generated to identify optimal locations for a finite number of facilities (i.e., biorefineries) that would serve as demand points for as many supply points (i.e., pennycress fields) as possible [55]. Therefore, under this analysis choice, the facilities are located such that as many pennycress plantation areas as possible are allocated to the final selected biorefineries.
The model was built in ArcMap 10.6.1 software to find the optimum locations for establishment of the SAF biorefineries. The inputs to the model included the pennycress supply points, a set of points representing the feasible locations for the biorefineries, as well as the transportation network, which is a combination of primary roads (highways) and secondary roads across the state of Ohio.

3. Results

3.1. Pennycress Production Potential in Ohio

The average area under corn–soybean and soybean–corn plantations from 2013 to 2018 was estimated to be 1.16 and 1.04 Mha, respectively (Figure 3). This difference in area can be justified by periodic variations of these commodity prices for different years. The total area under corn and soybean rotation for the period 2013–2018 was estimated to be 1.20 Mha. Since pennycress can be planted in the corn–soybean rotation every two years (i.e., after corn harvest until planting soybean, but not after soybean harvest until planting corn due to the earlier planting date of corn compared to soybean), it was estimated that there are ~0.6 Mha of land in Ohio available for planting pennycress every year (Figure 3). Areas representing the locations for potential pennycress production are shown in Figure 3.
Considering the NCCPI of potential pennycress-planting areas, the average state-level pennycress yield was estimated to be 1860 kg/ha (Table 2), which was less than the mean pennycress yield based on the literature (1950 kg/ha) [22].
Key parameters used for the location-allocation of SAF biorefineries in the state of Ohio are listed in Table 3. Using the adjusted yield data, pennycress production in Ohio was estimated to be ~1.1 MMT/yr. Accordingly, potential SAF production was estimated to be ~210 ML/yr. Considering the fixed capacity of SAF biorefineries as 18.9 ML/yr, the total number of SAF biorefineries was estimated to be 12.

3.2. Location-Allocation of SAF Biorefineries

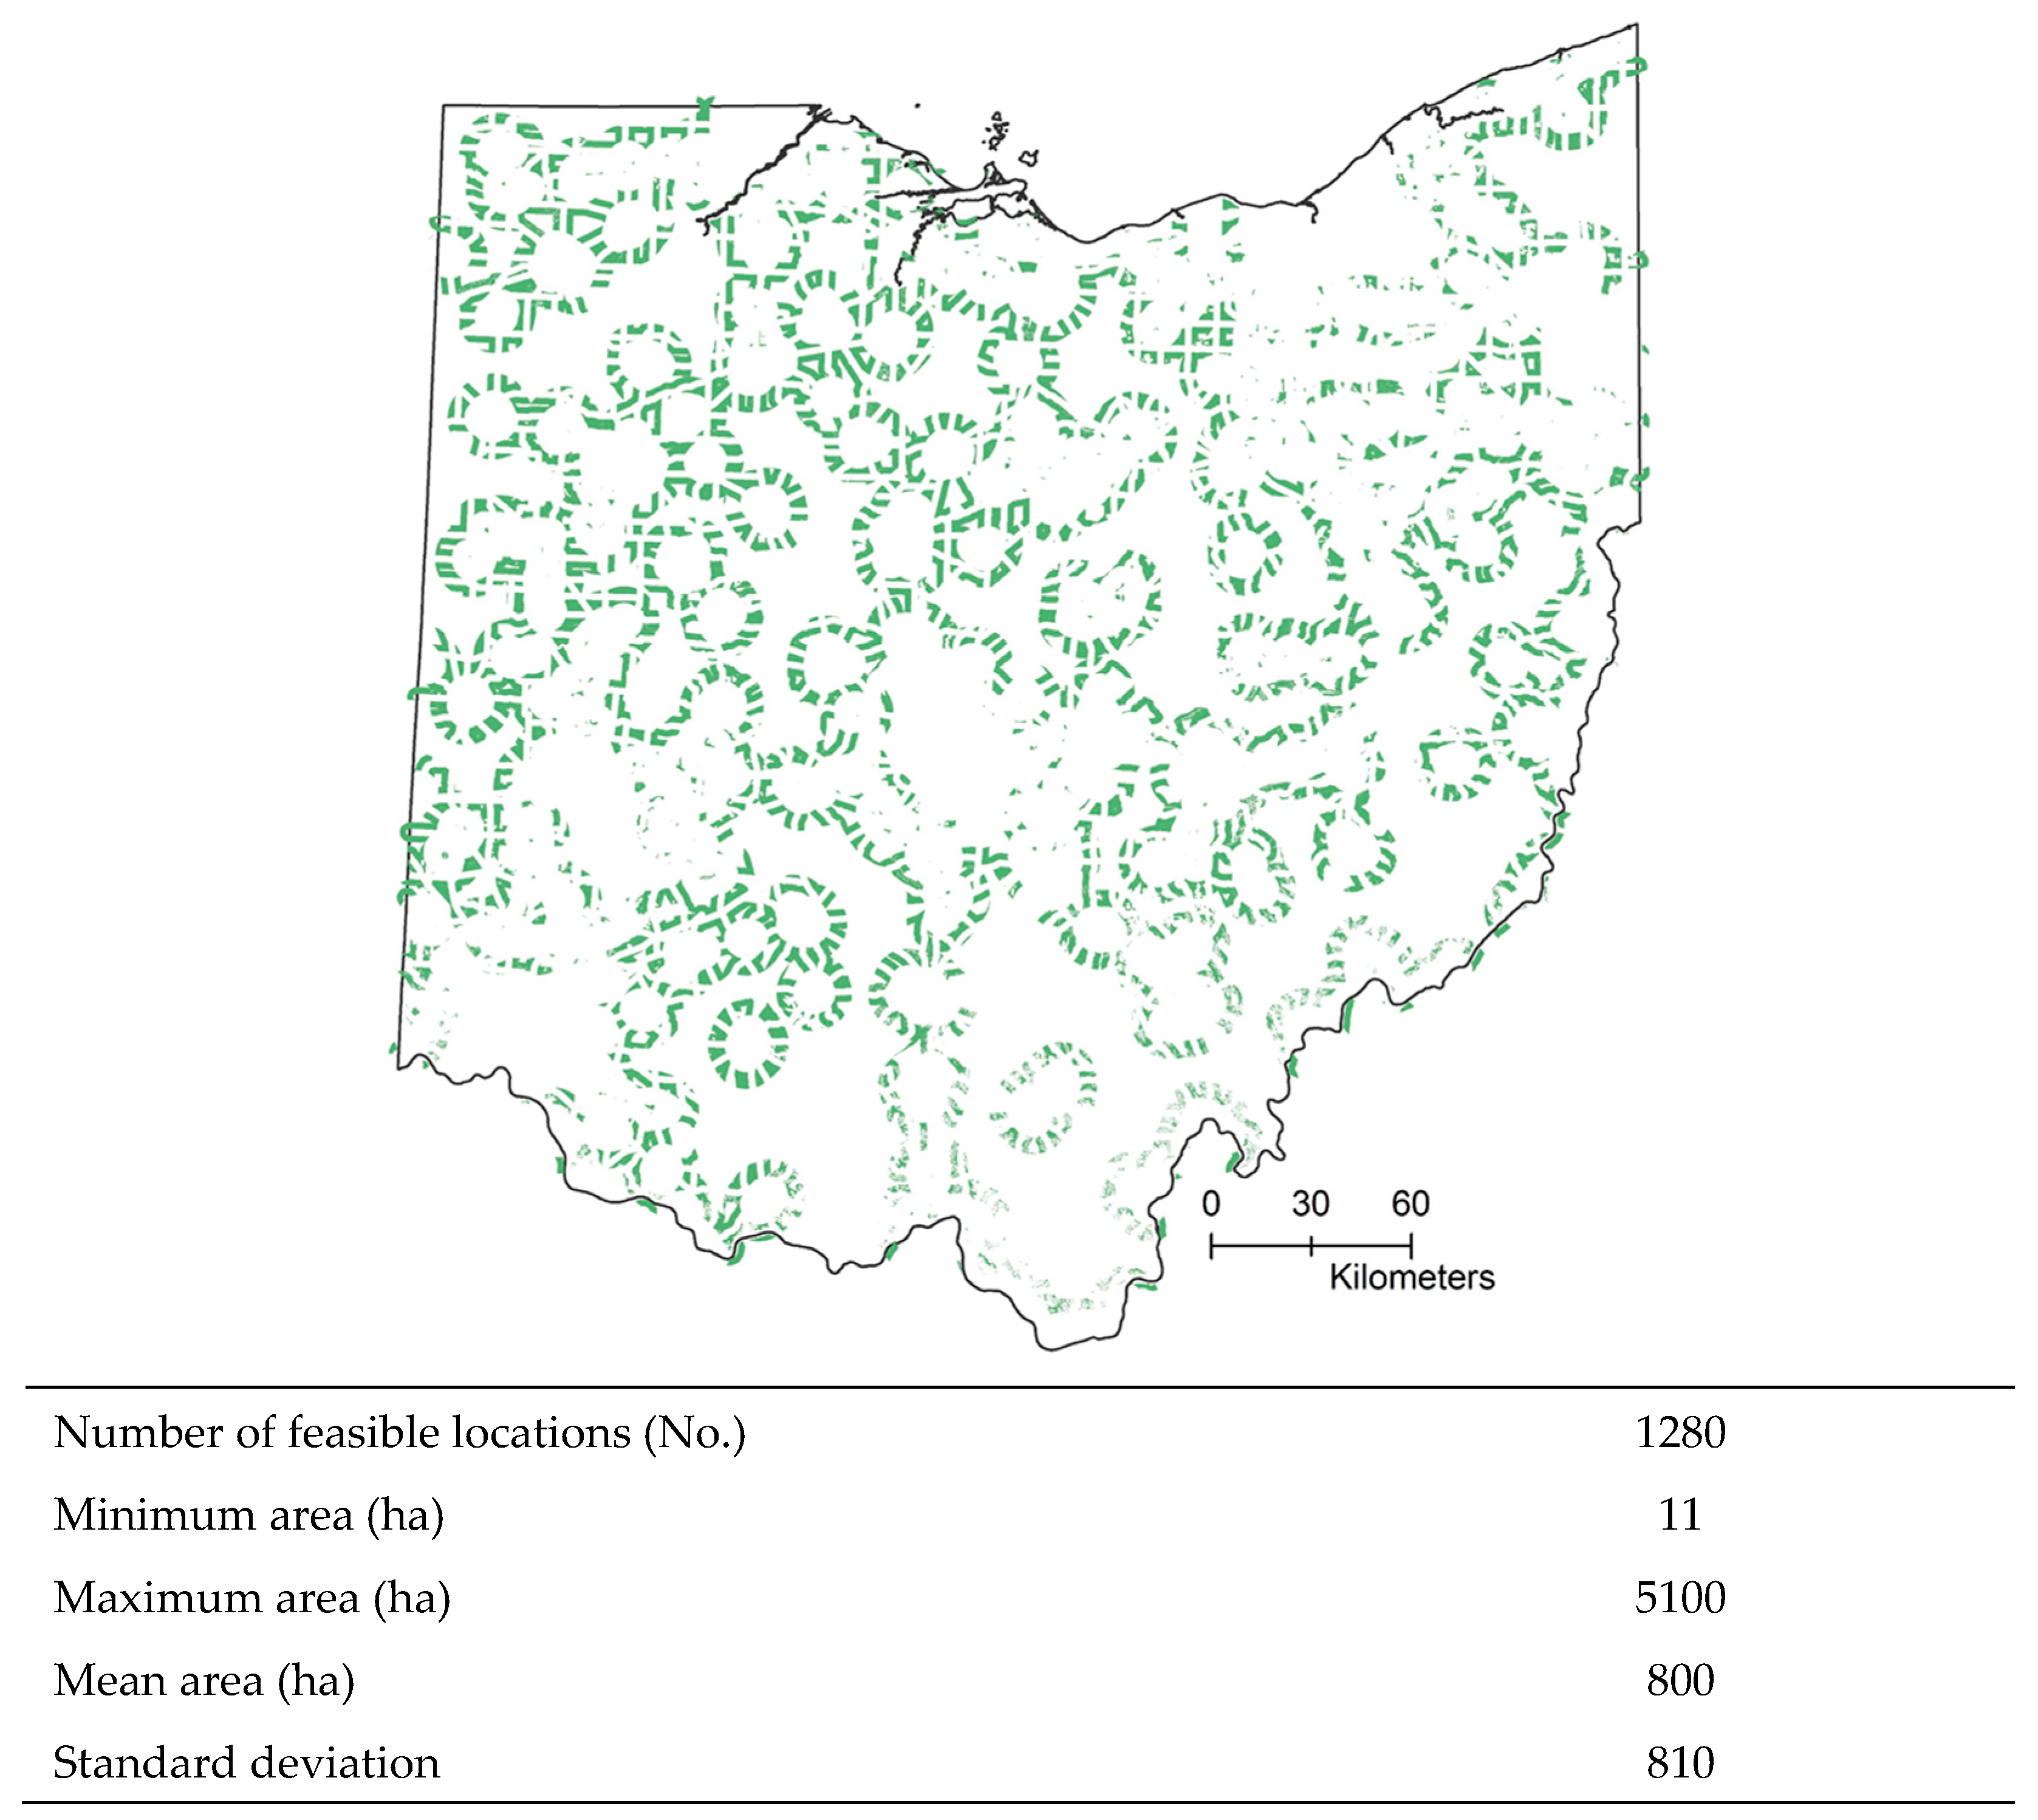
Using the inclusion and exclusion criteria, 1280 locations were identified as feasible locations for establishing the pennycress-based SAF biorefineries in Ohio (Figure 4); however, some of these locations were close to each other, so they were not selected as the feasible locations.
Considering the annual pennycress harvest in the region and the maximum capacity of biorefineries, the number of SAF biorefineries was estimated to be 12. Figure 5a represents 12 optimum locations for the biorefineries under the maximizing attendance conditions. The maximizing attendance problem type seeks to maximize the number of pennycress fields that the biorefinery can cover. In this model, the likelihood of attendance declined linearly with the increase in distance. Therefore, in this model, the biorefineries were located close to majority of fields with potential pennycress production. The average transportation distance from pennycress fields to a biorefinery was estimated to be 35 km, ranging from 0 to 83 km. In addition, the average amount of transportation of pennycress grain was estimated to be 750 t.km. The estimated transportation distance was in line with that previously reported in the literature (60 km). Additionally, the cost of pennycress production, harvest, and post-harvest logistics, assuming 60 km for round transportation, was estimated to be 170–230 USD/t, based on a 90% central range of the distribution [22]. These results are also in line with those of a previous study on location-allocation of pellet production plants [56]. In another study, an integrated mixed-integer linear programming model was combined with GIS to design a supply chain configuration for Carinata-based SAF production in Georgia. Then, the final selection of the farms and the number of SAF biorefineries were identified [57].
Under maximizing coverage conditions, the average transportation distance for the optimal locations (Figure 5b) was estimated to be 58 km, ranging from 0 to 100 km (Table 4). The maximizing coverage location-allocation model seeks to maximize the pennycress fields that can be covered within a certain drive time. The average transportation distance based on this model was higher than the maximize attendance model because the biorefineries were not necessarily located close to the areas with majority of fields. The amount of transportation (2100 t.km) was also higher than that of the maximizing attendance optimization model. The average transportation costs for the maximizing attendance condition and the maximizing coverage area were estimated to be USD 3.33/t and USD 3.50/t, respectively.
Overall, the results showed that there is huge potential for pennycress-based SAF production in Ohio. The study identified the optimal locations for minimizing the transportation costs. However, the findings of this study can be influenced by factors such as temporal and spatial variabilities in soil properties, weather conditions, topography, as well as management practices, which could influence pennycress production, and consequently, the optimum locations for establishing the biorefineries. In addition, the existing storage and oil extraction facilities in the region may also affect the optimal locations for new facilities; however, these existing sites could be leveraged to address supply logistics. To address the potential limited supply of pennycress for SAF production due to weather, mixed feedstock supply from alternative sources could be considered as a part of the mitigation plans, and such considerations may affect suitable locations of biorefineries. To design a robust feedstock supply system for SAF production, these factors need to be considered. The analyses could also be influenced by tax incentives for pennycress and SAF production, cost of land, and services’ availability; however, some of this information is not publicly accessible, and thus was not included in the analysis.

4. Conclusions

GIS-based models were developed to assess the potential pennycress grain production in Ohio and to identify the optimum locations for establishing SAF biorefineries. It was estimated that annually, ~1.1 MMT of pennycress grain can be potentially supplied by incorporating pennycress as a cover crop in the corn–soybean rotation in Ohio. This amount of pennycress grain is enough to produce ~210 ML/yr of SAF. Accordingly, 12 capacitated biorefineries with an annual SAF production of 18.9 ML/yr could be established in Ohio. The optimum locations for the SAF biorefineries were identified based on the minimization of the transportation distance and costs from individual fields to the biorefineries. The average transportation distance was estimated to be 35 km under the maximizing attendance conditions, and 58 km under the maximizing coverage conditions.
The study considered variabilities in pennycress yield due to soil productivity; however, temporal variabilities and climatic conditions can affect the potential pennycress grain supply and the optimum locations for establishing SAF biorefineries. Inclusion of these parameters will provide additional opportunities to find better locations of SAF biorefineries. The outcomes of this research are useful for reducing the risk associated with pennycress supply and cost variabilities for the SAF biorefineries. In addition, these analyses can be developed for other types of feedstocks and regions to minimize the transportation costs, time, and required resources associated with feedstock supply systems.

Supplementary Materials

The following supporting information can be downloaded at: https://www.mdpi.com/article/10.3390/su151310589/s1.

Author Contributions

Conceptualization, A.S.; methodology, S.H.M.-A., S.K. and A.S.; software, S.H.M.-A.; validation, S.H.M.-A., S.K. and A.S.; formal analysis, S.H.M.-A., S.K. and A.S.; investigation, S.H.M.-A., S.K. and A.S.; resources, A.S.; data curation, S.H.M.-A., S.K. and A.S.; writing—original draft preparation, S.H.M.-A.; writing—review and editing, S.H.M.-A., S.K. and A.S.; visualization, S.H.M.-A.; supervision, S.K. and A.S.; project administration, A.S.; funding acquisition, A.S. All authors have read and agreed to the published version of the manuscript.

Funding

This research was funded by the U.S. Department of Energy, award number: DE-SC0019233.

Institutional Review Board Statement

Not applicable.

Informed Consent Statement

Not applicable.

Data Availability Statement

The data presented in this study are available on request from the corresponding author.

Acknowledgments

We gratefully acknowledge the support from the funding agency and Ohio State University.

Conflicts of Interest

The authors declare no conflict of interest.

References

  1. O’Connell, A.; Kousoulidou, M.; Lonza, L.; Weindorf, W. Considerations on GHG Emissions and Energy Balances of Promising Aviation Biofuel Pathways. Renew. Sustain. Energy Rev. 2019, 101, 504–515. [Google Scholar] [CrossRef]
  2. Kandaramath Hari, T.; Yaakob, Z.; Binitha, N.N. Aviation Biofuel from Renewable Resources: Routes, Opportunities and Challenges. Renew. Sustain. Energy Rev. 2015, 42, 1234–1244. [Google Scholar] [CrossRef]
  3. Liu, G.; Yan, B.; Chen, G. Technical Review on Jet Fuel Production. Renew. Sustain. Energy Rev. 2013, 25, 59–70. [Google Scholar] [CrossRef]
  4. Elgowainy, A.; Han, J.; Wang, M.; Carter, N.; Stratton, R.; Hileman, J.; Malwitz, A.; Balasubramanian, S. Life-Cycle Analysis of Alternative Aviation Fuels in GREET; ANL/ESD/12-8; Argonne National Laboratory Energy Systems and Infrastructure Analysis Division: Lemont, IL, USA, 2012. Available online: https//publications.anl.gov/anlpubs/2016/05/127787.pdf (accessed on 3 March 2023).
  5. Chu, P.L.; Vanderghem, C.; MacLean, H.L.; Saville, B.A. Process Modeling of Hydrodeoxygenation to Produce Renewable Jet Fuel and Other Hydrocarbon Fuels. Fuel 2017, 196, 298–305. [Google Scholar] [CrossRef]
  6. De Jong, S.; Antonissen, K.; Hoefnagels, R.; Lonza, L.; Wang, M.; Faaij, A.; Junginger, M. Life-Cycle Analysis of Greenhouse Gas Emissions from Renewable Jet Fuel Production. Biotechnol. Biofuels 2017, 10, 64. [Google Scholar] [CrossRef] [Green Version]
  7. Li, X.; Mupondwa, E.; Tabil, L. Technoeconomic Analysis of Biojet Fuel Production from Camelina at Commercial Scale: Case of Canadian Prairies. Bioresour. Technol. 2018, 249, 196–205. [Google Scholar] [CrossRef]
  8. Alam, A.; Masum, M.F.H.; Dwivedi, P. Break-Even Price and Carbon Emissions of Carinata-Based Sustainable Aviation Fuel Production in the Southeastern United States. GCB Bioenergy 2021, 13, 1800–1813. [Google Scholar] [CrossRef]
  9. Masum, F.H.; Coppola, E.; Field, J.L.; Geller, D.; George, S.; Miller, J.L.; Mulvaney, M.J.; Nana, S.; Seepaul, R.; Small, I.M.; et al. Supply Chain Optimization of Sustainable Aviation Fuel from Carinata in the Southeastern United States. Renew. Sustain. Energy Rev. 2023, 171, 113032. [Google Scholar] [CrossRef]
  10. Pearlson, M.; Wollersheim, C.; Hileman, J. A Techno-Economic Review of Hydroprocessed Renewable Esters and Fatty Acids for Jet Fuel Production. Biofuels Bioprod. Biorefin. 2013, 7, 89–96. [Google Scholar] [CrossRef]
  11. Gutiérrez-Antonio, C.; Gómez-Castro, F.I.; de Lira-Flores, J.A.; Hernández, S. A Review on the Production Processes of Renewable Jet Fuel. Renew. Sustain. Energy Rev. 2017, 79, 709–729. [Google Scholar] [CrossRef]
  12. Tao, L.; Milbrandt, A.; Zhang, Y.; Wang, W.-C. Techno-Economic and Resource Analysis of Hydroprocessed Renewable Jet Fuel. Biotechnol. Biofuels 2017, 10, 261. [Google Scholar] [CrossRef] [Green Version]
  13. ASTM D7566-19; Standard Specification for Aviation Turbine Fuel Containing Synthesized Hydrocarbons. ASTM: West Conshohocken, PA, USA, 2019. [CrossRef]
  14. Diederichs, G.W.; Ali Mandegari, M.; Farzad, S.; Görgens, J.F. Techno-Economic Comparison of Biojet Fuel Production from Lignocellulose, Vegetable Oil and Sugar Cane Juice. Bioresour. Technol. 2016, 216, 331–339. [Google Scholar] [CrossRef] [PubMed]
  15. Pearlson, M. A Techno-Economic and Environmental Assessment of Hydroprocessed Renewable Distillate Fuels. Master’s Thesis, University Massachusetts, Boston, MA, USA, 2011. [Google Scholar]
  16. Delivand, M.K.; Cammerino, A.R.B.; Garofalo, P.; Monteleone, M. Optimal Locations of Bioenergy Facilities, Biomass Spatial Availability, Logistics Costs and GHG (Greenhouse Gas) Emissions: A Case Study on Electricity Productions in South Italy. J. Clean. Prod. 2015, 99, 129–139. [Google Scholar] [CrossRef]
  17. Phippen, W.B.; Phippen, M.E. Soybean Seed Yield and Quality as a Response to Field Pennycress Residue. Crop Sci. 2012, 52, 2767. [Google Scholar] [CrossRef]
  18. Dose, H.L.; Eberle, C.A.; Forcella, F.; Gesch, R.W. Early Planting Dates Maximize Winter Annual Field Pennycress (Thlaspi arvense L.) Yield and Oil Content. Ind. Crops Prod. 2017, 97, 477–483. [Google Scholar] [CrossRef] [Green Version]
  19. McGinn, M.; Phippen, W.B.; Chopra, R.; Bansal, S.; Jarvis, B.A.; Phippen, M.E.; Dorn, K.M.; Esfahanian, M.; Nazarenus, T.J.; Cahoon, E.B.; et al. Molecular Tools Enabling Pennycress (Thlaspi arvense) as a Model Plant and Oilseed Cash Cover Crop. Plant Biotechnol. J. 2019, 17, 776–788. [Google Scholar] [CrossRef] [Green Version]
  20. Evangelista, R.L.; Isbell, T.A.; Cermak, S.C. Extraction of Pennycress (Thlaspi arvense L.) Seed Oil by Full Pressing. Ind. Crops Prod. 2012, 37, 76–81. [Google Scholar] [CrossRef]
  21. Cubins, J.A.; Wells, M.S.; Frels, K.; Ott, M.A.; Forcella, F.; Johnson, G.A.; Walia, M.K.; Becker, R.L.; Gesch, R.W. Management of Pennycress as a Winter Annual Cash Cover Crop. A Review. Agron. Sustain. Dev. 2019, 39, 46. [Google Scholar] [CrossRef] [Green Version]
  22. Mousavi-Avval, S.H.; Shah, A. Techno-Economic Analysis of Pennycress Production, Harvest and Post-Harvest Logistics for Renewable Jet Fuel. Renew. Sustain. Energy Rev. 2020, 123, 109764. [Google Scholar] [CrossRef]
  23. Sindelar, A.J.; Schmer, M.R.; Gesch, R.W.; Forcella, F.; Eberle, C.A.; Thom, M.D.; Archer, D.W. Winter Oilseed Production for Biofuel in the US Corn Belt: Opportunities and Limitations. GCB Bioenergy 2017, 9, 508–524. [Google Scholar] [CrossRef]
  24. Phippen, W.B.; Rhykerd, R.; Sedbrook, J.C.; Handel, C.; Csonka, S. From Farm to Flight: CoverCress as a Low Carbon Intensity Cash Cover Crop for Sustainable Aviation Fuel Production. A Review of Progress towards Commercialization. Front. Energy Res. 2022, 10, 793776. [Google Scholar] [CrossRef]
  25. Sedbrook, J.; Phippen, W.; Marks, D. Advancing Field Pennycress as a New Oilseed Biofuels Feedstock That Does Not Require New Land Commitments. In Proceedings of the USDA NIFA/DOE Project Director/Principal Investigator Meeting, Washington, DC, USA, 24 February 2020. [Google Scholar]
  26. Sharma, B.; Ingalls, R.G.; Jones, C.L.; Khanchi, A. Biomass Supply Chain Design and Analysis: Basis, Overview, Modeling, Challenges, and Future. Renew. Sustain. Energy Rev. 2013, 24, 608–627. [Google Scholar] [CrossRef]
  27. Sultana, A.; Kumar, A. Optimal Siting and Size of Bioenergy Facilities Using Geographic Information System. Appl. Energy 2012, 94, 192–201. [Google Scholar] [CrossRef]
  28. Hu, M.C.; Huang, A.L.; Wen, T.H. GIS-Based Biomass Resource Utilization for Rice Straw Cofiring in the Taiwanese Power Market. Energy 2013, 55, 354–360. [Google Scholar] [CrossRef]
  29. Huang, Y.; Chen, C.W.; Fan, Y. Multistage Optimization of the Supply Chains of Biofuels. Transp. Res. Part E Logist. Transp. Rev. 2010, 46, 820–830. [Google Scholar] [CrossRef]
  30. Jeong, H.; Sieverding, H.L.; Stone, J.J. Biodiesel Supply Chain Optimization Modeled with Geographical Information System (GIS) and Mixed-Integer Linear Programming (MILP) for the Northern Great Plains Region. Bioenergy Res. 2019, 12, 229–240. [Google Scholar] [CrossRef]
  31. ESRI about the ArcGIS Network Analyst Extension Tutorial. Available online: http//desktop.arcgis.com/en/arcmap/latest/extensions/network-analyst/about-the-network-analyst-tutorial-exercises.htm (accessed on 3 May 2019).
  32. Natarajan, K.; Latva-Käyrä, P.; Zyadin, A.; Pelkonen, P. New Methodological Approach for Biomass Resource Assessment in India Using GIS Application and Land Use/Land Cover (LULC) Maps. Renew. Sustain. Energy Rev. 2016, 63, 256–268. [Google Scholar] [CrossRef]
  33. Zhang, F.; Johnson, D.M.; Sutherland, J.W. A GIS-Based Method for Identifying the Optimal Location for a Facility to Convert Forest Biomass to Biofuel. Biomass Bioenergy 2011, 35, 3951–3961. [Google Scholar] [CrossRef]
  34. Höhn, J.; Lehtonen, E.; Rasi, S.; Rintala, J. A Geographical Information System (GIS) Based Methodology for Determination of Potential Biomasses and Sites for Biogas Plants in Southern Finland. Appl. Energy 2014, 113, 1–10. [Google Scholar] [CrossRef]
  35. Lozano-García, D.F.; Santibañez-Aguilar, J.E.; Lozano, F.J.; Flores-Tlacuahuac, A. GIS-Based Modeling of Residual Biomass Availability for Energy and Production in Mexico. Renew. Sustain. Energy Rev. 2020, 120, 109610. [Google Scholar] [CrossRef]
  36. Fan, J.; Shonnard, D.R.; Kalnes, T.N.; Johnsen, P.B.; Rao, S. A Life Cycle Assessment of Pennycress (Thlaspi arvense L.) -Derived Jet Fuel and Diesel. Biomass Bioenergy 2013, 55, 87–100. [Google Scholar] [CrossRef]
  37. Mousavi-Avval, S.H.; Shah, A. Techno-Economic Analysis of Hydroprocessed Renewable Jet Fuel Production from Pennycress Oilseed. Renew. Sustain. Energy Rev. 2021, 149, 111340. [Google Scholar] [CrossRef]
  38. EIA (U.S. Energy Information Administration). U.S. Biodiesel Plant Production Capacity. 2022. Available online: https://www.eia.gov/biofuels/biodiesel/capacity/ (accessed on 3 March 2023).
  39. USDA-NRCS (U.S. Department of Agriculture-Natural Resources Conservation Service). Geospatial Data Gateway. 2018. Available online: https//datagateway.nrcs.usda.gov/ (accessed on 5 August 2019).
  40. U.S. Department of Agriculture (USDA). Soil Survey Geographic Database (SSURGO). 2020. Available online: https://www.nrcs.usda.gov/wps/portal/nrcs/detail/soils/survey/?cid=nrcs142p2_053627 (accessed on 20 May 2020).
  41. Wang, Y.; Wang, J.; Schuler, J.; Hartley, D.; Volk, T.; Eisenbies, M. Optimization of Harvest and Logistics for Multiple Lignocellulosic Biomass Feedstocks in the Northeastern United States. Energy 2020, 197, 117260. [Google Scholar] [CrossRef]
  42. Singh Sidhu, V.P. Establishing a Vegetative Cap for Sustainable Stabilization of Copper Contaminated Soils in Torch Lake, Michigan. Ph.D. Thesis, Montclair State University, Montclair, NJ, USA, 2016. [Google Scholar]
  43. Moser, B.R. Biodiesel from Alternative Oilseed Feedstocks: Camelina and Field Pennycress. Biofuels 2012, 3, 193–209. [Google Scholar] [CrossRef] [Green Version]
  44. Carr, P.M. Potential of Fanweed and Other Weeds as Novel Industrial Oilseed Crops; Janick, J., Simon, J.E., Eds.; New Crops. Wiley: New York, NY, USA, 1993; pp. 384–388. [Google Scholar]
  45. Phippen, W.B.; Phippen, M.E. Evaluation of Field Pennycress (Thlaspi arvense L.) Populations. In Proceedings of the Association for the Advancement of Industrial Crops Annual Meeting, Fort Collins, CO, Fort Collins, CO, USA, 19–22 September 2010. [Google Scholar]
  46. United States Department of Agriculture (USDA) Natural Resources Conservation Service (NRCS). User Guide for the National Commodity Crop Productivity Index (NCCPI); Version 2.0; United States Department of Agriculture (USDA) Natural Resources Conservation Service (NRCS): Washington, DC, USA, 2012. [Google Scholar]
  47. Burli, P.H.; Nguyen, R.T.; Hartley, D.S.; Griffel, L.M.; Vazhnik, V.; Lin, Y. Farmer Characteristics and Decision-Making: A Model for Bioenergy Crop Adoption. Energy 2021, 234, 121235. [Google Scholar] [CrossRef]
  48. Franklin Egan, J.; Hafla, A.; Goslee, S. Tradeoffs between Production and Perennial Vegetation in Dairy Farming Systems Vary among Counties in the Northeastern U.S. Agric. Syst. 2015, 139, 17–28. [Google Scholar] [CrossRef]
  49. Guida, R.J.; Remo, J.W.F.; Secchi, S. Applying Geospatial Tools to Assess the Agricultural Value of Lower Illinois River Floodplain Levee Districts. Appl. Geogr. 2016, 74, 123–135. [Google Scholar] [CrossRef]
  50. Wightman, J.L.; Ahmed, Z.U.; Volk, T.A.; Castellano, P.J.; Peters, C.J.; DeGloria, S.D.; Duxbury, J.M.; Woodbury, P.B. Assessing Sustainable Bioenergy Feedstock Production Potential by Integrated Geospatial Analysis of Land Use and Land Quality. Bioenergy Res. 2015, 8, 1671–1680. [Google Scholar] [CrossRef]
  51. Najafi, F.; Sedaghat, A.; Mostafaeipour, A.; Issakhov, A. Location Assessment for Producing Biodiesel Fuel from Jatropha Curcas in Iran. Energy 2021, 236, 121446. [Google Scholar] [CrossRef]
  52. Tan, S.T.; Hashim, H.; Abdul Rashid, A.H.; Lim, J.S.; Ho, W.S.; Jaafar, A.B. Economic and Spatial Planning for Sustainable Oil Palm Biomass Resources to Mitigate Transboundary Haze Issue. Energy 2018, 146, 169–178. [Google Scholar] [CrossRef]
  53. Klose, A.; Drexl, A. Facility Location Models for Distribution System Design. Eur. J. Oper. Res. 2005, 162, 4–29. [Google Scholar] [CrossRef] [Green Version]
  54. Thompson, E.; Wang, Q.; Li, M. Anaerobic Digester Systems (ADS) for Multiple Dairy Farms: A GIS Analysis for Optimal Site Selection. Energy Policy 2013, 61, 114–124. [Google Scholar] [CrossRef]
  55. Pratt, M.; Moore, H.; Craig, T. Solving a Public Health Problem Using Location-Allocation. ArcUser. 2014. Available online: https://www.esri.com/about/newsroom/wp-content/uploads/2018/10/solving-a-public-health-problem.pdf (accessed on 15 January 2023).
  56. Sultana, A.; Kumar, A.; Harfield, D. Development of Agri-Pellet Production Cost and Optimum Size. Bioresour. Technol. 2010, 101, 5609–5621. [Google Scholar] [CrossRef] [PubMed]
  57. Ullah, K.M.; Masum, F.H.; Field, J.L.; Dwivedi, P. Designing a GIS-Based Supply Chain for Producing Carinata-Based Sustainable Aviation Fuel in Georgia, USA. Biofuels Bioprod. Biorefin. 2023, 17, 786–802. [Google Scholar] [CrossRef]
Figure 1. System boundary of pennycress production, logistics operations, and conversion to sustainable aviation fuel and other byproducts.
Sustainability 15 10589 g001
Figure 2. Modeling framework for the pennycress feedstock availability assessment and location-allocation of SAF biorefineries.
Sustainability 15 10589 g002
Figure 3. Potential pennycress-planting area in Ohio. Note: Green color represents the areas which can potentially be used for planting pennycress.
Sustainability 15 10589 g003
Figure 4. Feasible sites for establishing the SAF biorefineries in Ohio. Note: Green color represents the feasible areas.
Sustainability 15 10589 g004
Figure 5. Spatial distribution of pennycress-based SAF biorefineries in Ohio, under (a) maximizing attendance and (b) maximizing coverage conditions. Note: Stars represent the locations of biorefineries.
Sustainability 15 10589 g005
Table 1. The area under corn and soybean production in Ohio for 2013–2018.
YearCorn (1000 ha)Soybean (1000 ha)
201315101790
201414401910
201514202000
201614302020
201713902140
201813802140
Map of crop production in 2018 (yellow and green colors show corn and soybean areas, respectively)Sustainability 15 10589 i001Sustainability 15 10589 i002
Table 2. Adjusted pennycress yield statistics based on state-level NCCPI values for Ohio.
Statistic ParametersPennycress Yield (kg/ha)
Minimum1500
Maximum2463
Mean1860
Standard deviation217
Table 3. Key parameters for location-allocation of SAF biorefineries in the state of Ohio.
ParameterValueUnitReference
Potential pennycress production1,118,100t/yrEstimated
SAF production rate 1357L/haEstimated based on [37]
Potential SAF production214ML/yrEstimated
1 The SAF production rate was estimated using the pennycress oil content of 29% [37].
Table 4. Summary of the transportation of pennycress grain from the fields to the biorefineries under maximizing attendance and maximizing coverage area conditions.
ItemMaximizing Attendance ConditionMaximizing Coverage Area
Total Weighted Length (t.km)Total Length (km)Total Weighted Length (t.km)Total Length (km)
Total count a12121212
Minimum----
Maximum33,00083125,700100
Mean75035210058
Standard deviation180018580024
Sum1,826,20096,4005,937,800176,999
a Total count represents the potential number of biorefineries.
Disclaimer/Publisher’s Note: The statements, opinions and data contained in all publications are solely those of the individual author(s) and contributor(s) and not of MDPI and/or the editor(s). MDPI and/or the editor(s) disclaim responsibility for any injury to people or property resulting from any ideas, methods, instructions or products referred to in the content.