Article

Biogeochemical Characteristics of Sedimentary Organic Matter in Coastal Waters of a Mariculture Area: The Big Impact of Bay Scallop Farming

1
CAS Key Laboratory of Coastal Zone Environmental Processes and Ecological Remediation, Yantai Institute of Coastal Zone Research, Chinese Academy of Sciences, Yantai 264003, China
2
Shandong Key Laboratory of Coastal Environmental Processes, Yantai 264003, China
3
University of Chinese Academy of Sciences, Beijing 100049, China
4
Shenzhen Institute, Guangdong Ocean University, Shenzhen 518114, China
5
Center for Ocean Mega-Science, Chinese Academy of Sciences, Qingdao 266071, China
6
Public Technology Service Center, Institute of Oceanology, Chinese Academy of Sciences, Qingdao 266071, China
7
National Research Council, Institute of Geosciences and Earth Resources, Via Gradenigo, 6, 35131 Padova, Italy
*
Authors to whom correspondence should be addressed.
Sustainability 2023, 15(13), 10595; https://doi.org/10.3390/su151310595
Submission received: 30 May 2023 / Revised: 25 June 2023 / Accepted: 26 June 2023 / Published: 5 July 2023
(This article belongs to the Section Sustainable Oceans)

Abstract

:
Four short sediment cores were collected to explore the impacts of bay scallop farming on the composition and accumulation of sedimentary organic matter (SOM). The results revealed that SOM was mainly composed of relatively easily biodegradable substances as evidenced by the high contribution rate of biopolymeric carbon (77.8–94.4%). The sediment accumulation rate in the scallop farming area (SFA) was 28.6% higher than that in the non-scallop farming area (NSFA). The total organic carbon (TOC) and total nitrogen (TN) burial fluxes in the SFA were 33.1 and 36.6% higher than those in the NSFA, respectively. A rough estimate showed that the burial fluxes of TOC, TN, scallop-derived OC, and marine algal-derived OC in the ~150 km2 SFA could increase by 1.08, 0.11, 0.39, and 0.68 g m−2 yr−1, respectively, with annual scallop production increasing 104 t. This study highlights the significant effects of scallop farming on the biogeochemistry of SOM in coastal waters, which provides a direct reference for future research on the carbon cycle in shellfish culture areas.

1. Introduction

With the continuous increase in demand for seafood and worldwide declines in ocean fishery stocks, mariculture has become the main source of seafood protein [1]. The rapid expansion of mariculture has eased tensions between demand and supply of seafood, but it has also generated many environmental issues [2]. One of the most serious problems is the bottom-up impact on the surrounding ecosystem due to the release of large amounts of particulate or dissolved organic matter, i.e., POM and DOM, into the sediment below, which leads to organic accumulation on the sea bottom, affecting the biogeochemical cycles occurring in sediment [3,4,5,6].
China is the world’s largest producer of shellfish [2]. Scallop is one of the important high-value farmed shellfish groups in China, and its annual output accounts for more than 80% of the world’s scallop aquaculture production [2]. Although scallop farming has always been considered a sustainable aquaculture industry [7], at high stocking densities, scallop can lead to overgrazing, which reduces primary productivity and simultaneously releases large amounts of biodeposits, i.e., feces and pseudofeces, affecting the biogeochemical cycle of sedimentary organic matter (SOM) [8]. In addition, scallop farming facilities, e.g., aquaculture rafts, can weaken the local hydrodynamic conditions to a certain extent, which further promotes the deposition of POM on the seafloor [9,10,11,12]. As a result, the sedimentary environment of scallop farming areas is considered an important place for marine carbon sequestration and storage [4].
Previous research indicated that the accumulation rate of deposited organic carbon in shellfish farming areas was an order of magnitude higher than that of the ocean [8], which undoubtedly increases the carbon sequestration capacity of the sedimentary environment. However, it has been demonstrated that most of this fixed organic carbon cannot be stored for long periods and is rapidly degraded during sedimentary diagenesis, and the eventual permanently sequestered organic carbon accounts for about 10–30% of the total input [13]. With the degradation of SOM, microorganisms consume a large amount of dissolved oxygen (DO) at the bottom, resulting in an anaerobic or hypoxic environment, and then produce toxic substances that harm the ecosystem. Furthermore, the above process releases inorganic nutrients into the overlying water and increases the possibility of water eutrophication.
The coastal waters around Yangma Island in the northern Yellow Sea are one of the important scallop breeding bases in China, with a history of more than 30 years (scallop aquaculture started in 1985). The main cultured species here is bay scallop (Argopecten irradians), and the cultivation type is raft culture without any provision of additional feed. About 300–400 individual spat are placed into a lantern net, and the maximum depth of the cultivating nets is 5–7 m above the sea bottom [10,11]. Scallops are harvested when they grow to 6 cm and above in size. Driven by market demand, the farming density and production of scallops in this area have increased sharply since 2011, with production increasing nearly three-fold (Figure A1) [12]. Undoubtedly, this is bound to have an impact on the breeding environment, e.g., affecting the carbon cycle of surrounding waters and sediments, leading to the occurrence of disasters such as bottom-water hypoxia and acidification [14,15]. Previous studies indicated that the decomposition of SOM was an important driving force leading to hypoxia and acidification of the bottom water in this area, which mainly depended on the composition of SOM, e.g., the ratio of labile components (proteins, carbohydrates, and lipids) to refractory components (lignin) [15]. However, so far, information regarding the chemical composition, sources, and temporal variation of SOM over the last 2–3 decades in this area remains unknown. In this study, four short sediment cores were collected from the coastal waters around Yangma Island to explore the biogeochemical characteristics of SOM and assess the impact of scallop farming on SOM dynamics.

2. Materials and Methods
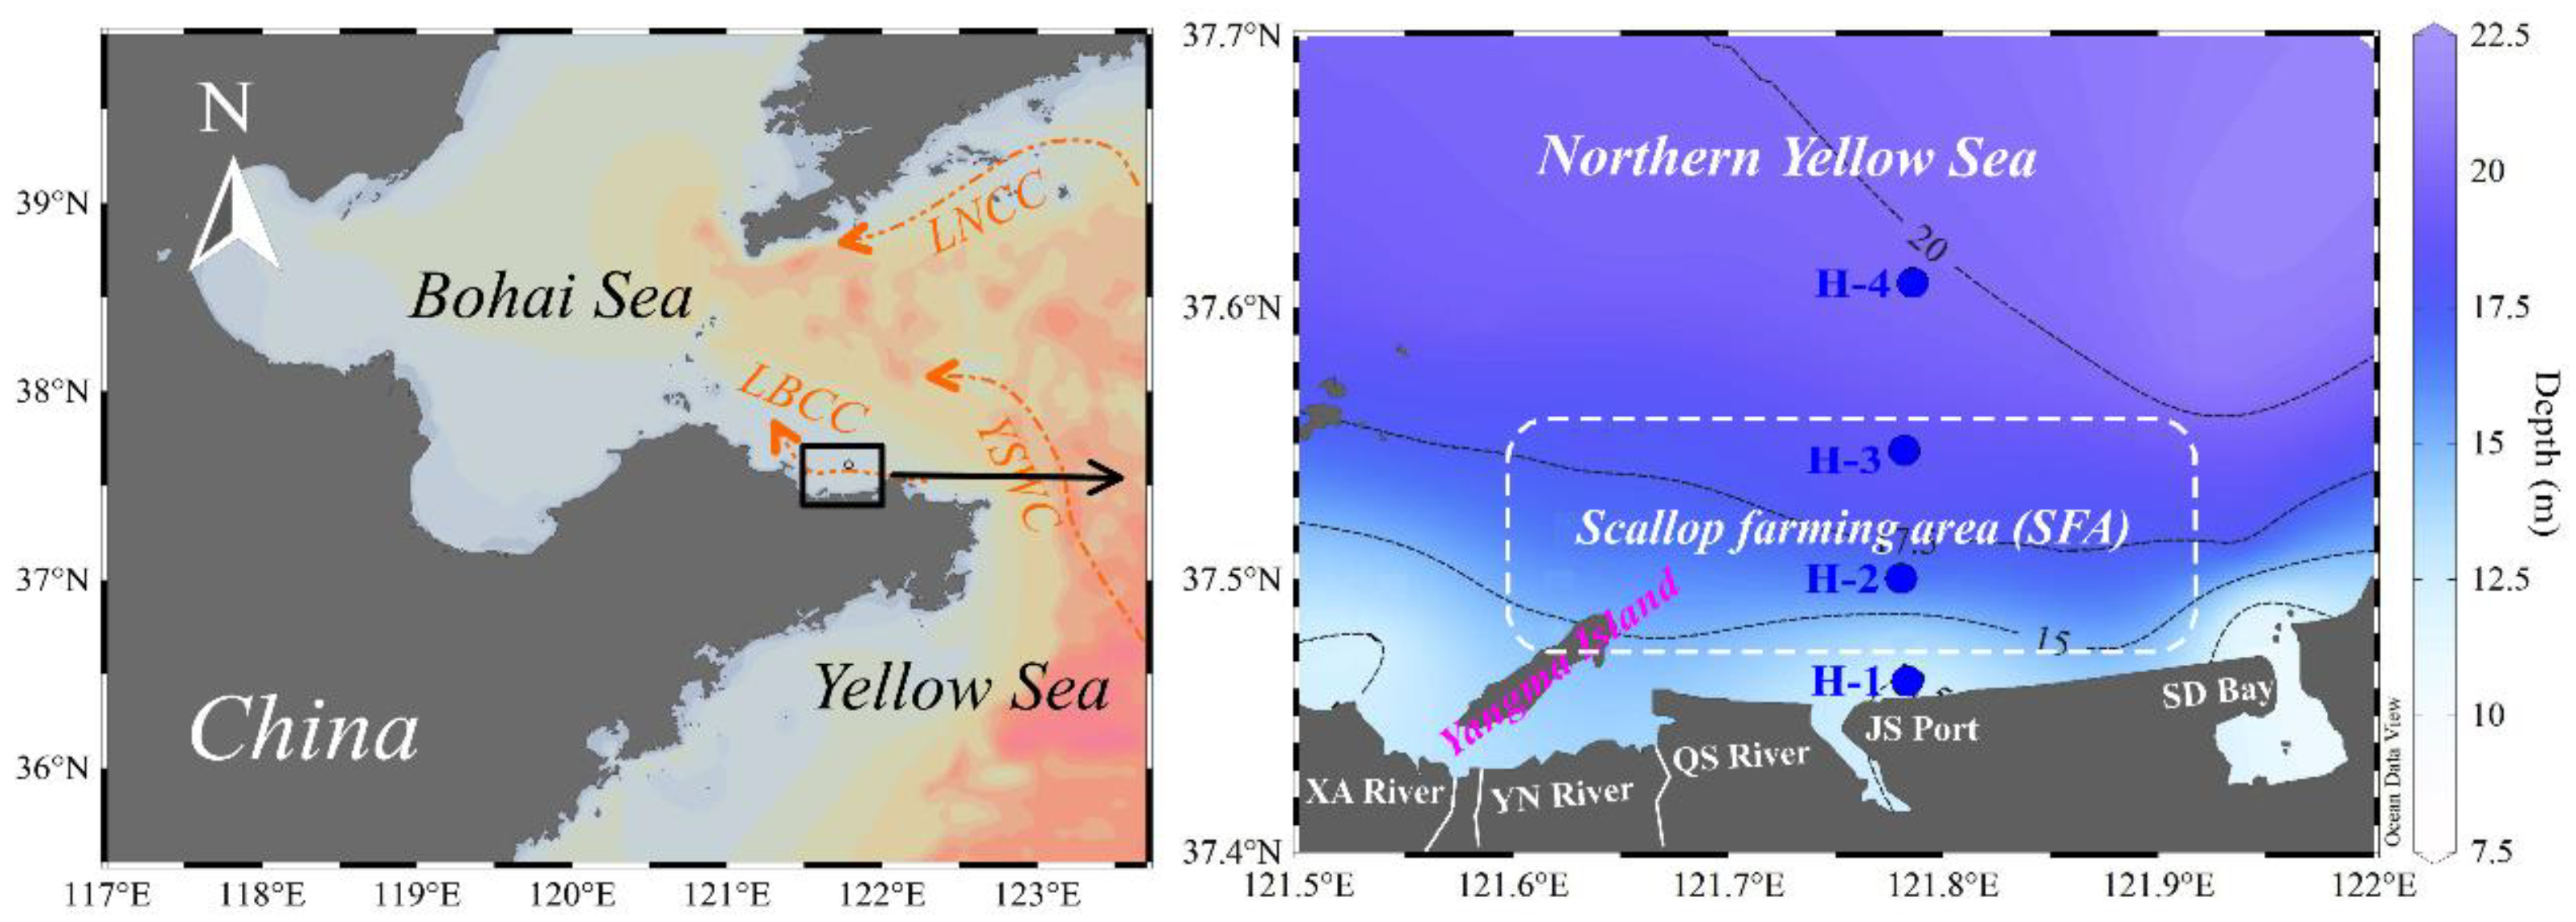
2.1. Field Sampling

Sediment samples were obtained from 4 stations in the coastal waters around Yangma Island in August 2020 (Figure 1). Among them, stations H2 and H3 were located in the scallop farming area (SFA). Stations H1 and H4 were located in the non-scallop farming area (NSFA). Furthermore, station H1 was near Yantai Jinshan Port (JS Port) (Figure 1), and its sedimentary environment is affected by terrigenous discharge to some extent [15]. Sediment samples were collected by using a box sampler, and then short cores of ~20 cm long were obtained from the sampler using PVC tubes. The cores were sealed and stored frozen. After returning to the laboratory, the sediments were slowly pushed from the bottom of the PVC tubes, sliced at 1 cm thick intervals, and stored at −20 °C.

2.2. Analytical Methods

All the sediments were freeze-dried before subsequent treatments, and all the results were obtained based on analyses of the dry sediments. The density of sediment was calculated as quotient of dry weight to volume. A sample aliquot (~5 g) of each sediment slice was analyzed for total 210Pb and 226Ra by using a gamma-ray spectrometer (Ortec Instruments) with measurement precisions of ±5% and ±10% at the 95% confidence level [16]. The sedimentation rates in marine sediments were calculated on the basis of the 210Pb radioactive decay results, based on the formula of the Constant Flux Constant Sedimentation (CFCS) model [16]. The age-specific depths of sediment samples were then designated. The samples for grain size data were analyzed using a laser granulometer (Mastersizer 2000, Malven Instruments Ltd., UK) after removing organic matter and carbonates with 15% H2O2 and 4 mol L−1 HCl. According to the data obtained, the sediments were classified as clay (<4 μm), silt (4–63 μm), and sand (>63 μm), respectively.
Total carbon (TC) and total nitrogen (TN) contents were determined by using an Elementar vario MACRO cube CHNS analyzer, while the corresponding total inorganic carbon (TIC) content was obtained by using a Shimadzu TOC-VCPH/SSM-5000A analyzer. Total organic carbon (TOC) content was obtained by subtracting TIC from TC. The corresponding precisions were ±0.02% TC and ±0.003% TN by dry weight (n = 3). For stable carbon isotopic composition (δ13C), the samples were first decarbonated with 0.5 mol L−1 HCl, then washed to neutrality with deionized water, and dried at 60 °C. Approximately 5.0 mg and 50.0 mg of acid-washed and unwashed samples were accurately weighed for the measurement of δ13C and δ15N, respectively, using a ThermoFisher MAT 253 Plus isotope ratio mass spectrometer, and the results were expressed in δ (‰):
δ (‰) = (Rsample/Rreference − 1) × 1000
where δ (‰) stands for δ13C or δ15N, and Rsample and Rreference are the heavy to light isotopic ratios (i.e., 13C/12C and 15N/14N) of the sample and reference. For δ13C, the reference is Peedee Belemnite, and for δ15N, it is atmospheric nitrogen. The analytical precisions were ±0.2‰ and ±0.3‰ for δ13C and δ15N (n = 3).
Biological components, namely, carbohydrate (CHO), protein (PRT), and lipid (LIP), of the samples were determined by photometry according to the procedure of Danovaro and Fabiano [17], and their corresponding contents were expressed in carbon equivalent through multiplying the conversion factors of 0.40, 0.49, and 0.75 mg C mg−1, respectively [18]. The sum of CHO, PRT, and lipid was called biopolymeric carbon (BPC).

2.3. Calculation of Source Proportions and Burial Fluxes

Generally, marine algae, terrestrial C3 plants, and shellfish biodeposits are the main sources of SOM in shellfish farming areas [8,19]. This study estimated the proportion of different sources of SOM based on a δ13C and δ15N three-end-member mixing model [20] as follows:
δ13Csample = (δ13Cter × fter) + (δ13Cmar × fmar) + (δ13Cbio × fbio)
δ15Nsample = (δ15Nter × fter) + (δ15Nmar × fmar) + (δ15Nbio × fbio)
fter + fmar + fbio = 1
where δ13Csample, δ13Cter, δ13Cmar, and δ13Cbio are the measured δ13C of the samples and the δ13C end-members of terrestrial, marine algae, and scallop biological deposits; δ15Nsample, δ15Nter, δ15Nmar, and δ15Nbio are the measured δ15N of the samples and the δ15N end-members of terrestrial, marine algae, and scallop biological deposits; fter, fmar, and fbio are the contributions of terrestrial, marine algal-derived, and scallop-biodeposited sources. In this study, the δ13C end-members of terrestrial, marine algae, and scallop biological deposits were −27, −20.5, and −21.9‰, respectively; the corresponding values of δ15N were 2.3, 6.0, and 5.8‰ [8,21,22,23].
The burial flux of a certain component of SOM (BFi) was calculated based on the following equation [24]:
BFi = Ci × S × ρ
where BFi (g m−2 yr−1) is the burial flux of the target component of SOM (i.e., TOC, TN, and BPC), Ci (%) is its content in the sediment, S (cm yr−1) is the sedimentation rate, and ρ (g cm−3) is the dry density of sediment.

2.4. Data Analysis

Data statistical analysis was performed using SPSS 19. Significance test was conducted on grain size, TOC, TN, δ13C, δ15N, CHO, PRT, and LIP between the SFA and NSFA through Mann–Whitney U test (2 independent samples), followed by Benjamini–Hochberg procedure [25] to correct for false positives. A corrected p < 0.05 was considered statistically significant.

3. Results

3.1. Bulk Sediment Properties

The bulk properties of the studied sediment cores are presented in Figure 2, Figure 3 and Figure 4, and a detailed description of the bulk properties of surface sediments in the study area was provided by Yang et al. [3]. As shown in Figure 2, cores H2, H3, and H4 were mainly composed of clayey silt, while core H1 was mainly sandy silt. The clay fraction in the SFA (20.0 ± 2.2%) was slightly higher than that in the NSFA (18.2 ± 2.1%) (Figure 2).
Generally, 210Pbex activity in the studied cores had obvious attenuation characteristics, but it was not a strict monotonic exponential attenuation (Figure 3). Based on the formula of the CFCS model [16,26,27], the average sedimentation rates of cores H1, H2, H3, and H4 were obtained as 0.64, 0.88, 0.91, and 0.76 cm yr−1, respectively. The chronology results indicated that the sedimentary sequences of cores H1, H2, H3, and H4 had ages of about 27a (1992–2019), 21a (1998–2019), 24a (1995–2019), and 27a (1992–2019). As for spatial distribution, the sedimentation rate in the SFA was ~28% higher than that in the NSFA. Vertically, however, no clear difference in sedimentation rate was observed in different layers of a certain core.
TOC and TN contents in the studied cores ranged from 0.27 to 0.62% (mean 0.47 ± 0.07%) and 0.48 to 0.75‰ (mean 0.61 ± 0.06‰), respectively (Figure 4a–d). On average, the TOC contents were highest in core H1 and lowest in core H4; in contrast, the TN contents were characterized as significantly higher in the SFA than in the NSFA (Figure 4a–d). Vertically, TOC content in cores H1 and H2 increased slightly with depth and the trend was the opposite for TN, but they both fluctuated greatly, suggesting the influence of multiple factors in different years, e.g., human activities and environmental factors. However, TOC and TN in cores H3 and H4 decreased with sediment depth. In particular, their contents in cores H3 and H4 had increased significantly since 2011 (Figure 4c,d), which was consistent with the increase in farmed scallop production over that time (Figure A1), and there was a good linear relationship between scallop production and TOC or TN content, especially for core H3 in the SFA (p < 0.01, Figure A5).
The TOC/TN ratios varied from 5.30 to 11.21, with mean values of 8.61 ± 1.48, 7.40 ± 0.84, 7.67 ± 0.51, and 7.06 ± 0.83 in cores H1, H2, H3, and H4, respectively. High TOC/TN values were observed in core H1, and values gradually decreased seaward. Vertically, TOC/TN ratios in core H1 generally increased slightly with depth but fluctuated greatly (Figure 4e–h).

3.2. Biological Compositions of SOM

BPC contents in cores H1, H2, H3, and H4 were 4.05 ± 0.56, 3.43 ± 0.33, 4.02 ± 0.49, and 3.80 ± 0.56 μg mg−1, accounting for 77.8, 74.0, 83.6, and 94.4% of TOC, respectively. In terms of BPC composition, protein was the biggest contributor (52% of BPC), followed by carbohydrate (26%) and lipid (22%). In terms of horizontal distribution, protein content presented a distribution characteristic of inshore areas being higher than offshore areas (Figure 5a–d). However, the horizontal distribution of carbohydrate and lipid content did not show clear differences. Vertically, the distribution of protein was similar to that of TOC and TN, and it showed a significant positive correlation with TOC and TN (p < 0.01, Table A1), indicating that protein may be a main component controlling variations of SOM content in sediment cores.

3.3. δ13C, δ15N, and the Sources of SOM

In this study, the δ13C values of SOM ranged from −23.13 to −21.21‰ with averages of −22.52 ± 0.25, −21.90 ± 0.42, −22.38 ± 0.26, and −22.48 ± 0.15‰ in cores H1, H2, H3, and H4, respectively (Figure 5e–h). Relatively higher δ13C values (−22.14 ± 0.42‰) were found in the cores from the SFA (H2 and H3), while the mean δ13C in the NSFA was slightly depleted (−22.50 ± 0.20‰). Vertically, the δ13C values in cores H1 and H2 generally increased slightly with depth (Figure 5e,f), which was contrary to those of TOC and may be related to the decrease in terrestrial OM input and/or the increase in marine autochthonous OM including scallop biodeposits in recent years, especially after 2014 (Figure 5e,f). In contrast, the vertical change in δ13C value was not obvious in cores H3 and H4, indicating that the relative contribution of different sources of OM had not obviously changed over time.
The δ15N values ranged from 3.13 to 5.96‰ (Figure 5e–h), with averages of 4.30 ± 0.73, 4.66 ± 0.50, 4.55 ± 0.43, and 4.65 ± 0.48‰ in cores H1, H2, H3, and H4, respectively. Contrary to the distribution of δ13C, the lowest δ15N values were observed in core H1. The δ15N values in cores H1 and H2 increased with depth, which was contrary to those of δ13C (Figure 5e,f). In comparison, the δ15N values in cores H3 and H4 varied less with depth, which was similar to those of δ13C (Figure 5g,h).
Overall, SOM in the study area was dominated by marine algal-derived OM with an average contribution rate of 42.6 ± 8.01%, followed by terrestrial source (mean 35.0 ± 6.97%). The contribution of scallop-derived OM was the lowest with an average of 22.4 ± 9.29%. Comparatively, the contribution of scallop-derived OM in the SFA (24.2 ± 8.0%) was higher than that of the NSFA (20.0 ± 10.4%). Additionally, it can be clearly seen from Figure A3 that the composition of OM in sediment cores varied in different time segments. Among them, the contribution rate of scallop-derived OM gradually decreased with depth, which indicated the development history of scallop aquaculture activities.

3.4. Burial Rates of SOM

The burial fluxes of SOM are shown in Table A2, and their corresponding variations in different years are shown in Figure 6. On average, the burial fluxes of TOC in the studied cores were 28.95 ± 3.88 (H1), 35.91 ± 4.16 (H2), 38.32 ± 3.55 (H3), and 26.54 ± 4.21 g m−2 yr−1 (H4), respectively; the TN burial fluxes were 3.48 ± 0.46, 4.84 ± 0.34, 5.04 ± 0.29, and 3.73 ± 0.27 g m−2 yr−1 (Table A2). The burial fluxes of BPC were 22.80 ± 2.60 (H1), 26.54 ± 3.26 (H2), 32.17 ± 3.64 (H3), and 25.41 ± 2.89 g m−2 yr−1 (H4), respectively. In comparison, the burial fluxes of TOC, TN, and BPC in the SFA (H2 and H3) were 13.3, 13.6, and 12.2% higher than those in the NSFA (H1 and H4), respectively. For SOM source, burial fluxes of marine algal-derived OC and scallop-derived OC in the SFA were 53.6 and 61.2% higher than those in the NSFA, respectively; however, terrestrial OC burial fluxes in the SFA were almost equal to that in the NSFA. For different time segments, the burial fluxes of TOC, TN, and scallop-derived OM has shown a significant upward trend in recent years (Figure 6).

3.5. Principal Component Analysis (PCA)

PCA was performed on the datasets containing TOC; TN; BPC and its constituents carbohydrate, protein, and lipid; scallop-derived OM; marine algal OM; terrestrial OM; and sediment grain size. Three principal components (PC1–PC3) were distinguished, which explained 60.4% of the total variance. Among them, PC1 accounted for 28.0% of the total variance with high positive loadings for BPC, TOC, protein, and clay, but negative loadings for silt (Figure 7a). This component clarified the composition and characteristics of BPC, which was the main component of TOC, mostly composed of protein, and more enriched in the clay fraction of sediment.
PC2 explained 19.1% of the total variance with high positive loadings for the variables of TN, scallop-derived OM, BPC, carbohydrate, lipid, and TOC, and high negative loadings for terrestrial OM (Figure 7a). This component revealed the composition of scallop-derived OM, which was mainly characterized by high nitrogen content. Therefore, scallop-derived OM and TN showed a significant positive correlation (p < 0.01) in this study (Table A1). In addition, the PC2 results also provided a clue that scallop-derived OM was one of the sources of carbohydrates and lipids in the SOM, although they did not show significant positive correlations (Table A1), which may be caused by the decomposition of SOM. PC3 explained 13.3% of the total variance, and high positive loadings for marine algal-derived OM and clay and negative loadings for sand and scallop-derived OM were identified (Figure 7b). This component showed that the marine-derived OM was more accumulated in fine-grained sediment.

4. Discussion

4.1. General Characteristics of SOM

4.1.1. Composition and Distribution of SOM

Generally, the composition and content of SOM are important indicators reflecting the nutritional status of a marine environment [18]. In this study, the TOC and TN contents in the studied cores were 0.47 ± 0.07% and 0.61 ± 0.06‰, respectively (Figure 4a–d). In comparison with previous reports listed in Table A3, the contents of TOC and TN in the study area were comparable to those in the Yellow Sea [28], higher than those in Jiaozhou Bay [29] and Bohai Bay [30], but lower than those in the East China Sea shelf [31].
Spatially, TN content in the SFA was significantly higher than that in the NSFA, while TOC content decreased seaward with the highest in core H1 and lowest in core H4 (Figure 4a–d). The scallop farming activity and terrestrial OM input were the main reasons for this. Generally, places closer to the coast receive more terrestrial OM [23], leading to an increase in TOC content in the sediments. In comparison, the above processes have relatively less effect on TN content due to the low nitrogen properties of terrestrial OM [32]. Additionally, bay scallop farming activities have significant impacts on coastal carbon and nitrogen cycles by changing the hydrological environment, as well as its efficient biological deposition process (see Section 4.2 for details) [33,34]. In this study, TOC and TN in the SFA (H2 and H3) were on average ~33% and ~37% higher than those in the NSFA (H1 and H4), confirming the important role of scallop farming activities in the accumulation of SOM, which was consistent with previous research findings [8,35].
Vertically, TOC in cores H1 and H2 increased slightly with depth and the trend was the opposite for TN, but they both fluctuated greatly. This mainly reflected the combined effects of aquaculture activities, terrestrial inputs, and coastal hydrodynamic conditions in different years [4,8]. However, TOC and TN in cores H3 and H4, which were less affected by terrestrial input, both decreased with sediment depth, which was consistent with the vertical distributions of TOC in most other aquaculture areas [4,8,36,37,38].
As for biological composition, protein was the biggest contributor (52% of BPC), followed by carbohydrate (26%) and lipid (22%). The high contribution rate of BPC to TOC (77.8–94.4%) indicated that SOM was mainly composed of relatively easily biodegradable substances [39,40]. Comparatively, BPC contents in the study area were higher than most of the results listed in Table A4, e.g., those obtained in Laizhou Bay [4], Galician coast [41], northern Adriatic Sea [42], Sounion Bay [43], Pachino Bay [44], and Gulf of Alicante, Spain [43].
In general, protein is labile in marine environments, and high protein content in sediments indicates high productivity of an ecosystem [45], which was the case in the coastal waters around Yangma Island. Similar results were observed in other shellfish farming areas [4]. This was mainly because the filter feeding and excretion processes of scallops accelerated the accumulation of phytoplankton into sediments, leading to the above situation [4,5]. In practical applications, PRT/CHO ratio in sediments can to some extent indicate the source of OM [41], and a value of >1 indicates that BPC consists mainly of freshly produced labile OM [45]. On the contrary, it indicates that BPC is mainly composed of aged organic debris [45]. In this study, PRT/CHO ratios in cores H1, H2, H3, and H4 were 1.91 ± 0.67, 1.90 ± 0.36, 1.73 ± 0.36, and 1.58 ± 0.42, respectively, which indicated that the sedimentary environment had higher fresh OM input.
Spatially, protein content presented a distribution characteristic of inshore areas being higher than offshore areas (Figure 5a–d). However, the spatial distribution of carbohydrate and lipid content did not show clear differences. This indicated that coastal scallop farming activities and terrestrial input affected the protein distribution but may have little effect on carbohydrates and lipids in the coastal waters around Yangma Island. This may be related to nutrient-rich biological sediments [4,46,47]. Vertically, the distribution of protein was similar to those of TOC and TN, and it showed a significant positive correlation with TOC and TN (p < 0.01, Table A1). Similar results were found in other aquaculture seas [48], indicating that protein may be a main component controlling variations of SOM content in sediment cores.
Generally, sediments with lower BPC have higher carbohydrate fractions, and conversely they have higher protein fractions [46,49]. This is mainly because organic nitrogen-rich compounds in sediments are generally more susceptible to rapid degradation and recycling [48]. In coastal aquaculture areas, e.g., fish, shrimp, or shellfish farming areas, the sedimentary environment usually accepts more nitrogen-containing compounds, especially during the high growth periods of cultured organisms [43], as was shown in Figure 5 of this study, which could be a main reason for the high protein content in the sediments. However, it can also be clearly seen that protein content in core H1 in the NSFA was also high (Figure 5a), indicating the influence of terrestrial input. Previous studies have shown that the protein content of aquatic algae was relatively high [50,51,52,53]. Thus, the rapid growth of algae caused by terrestrial nutrient input could be a main reason for the high protein content in core H1.

4.1.2. Source and Storage of SOM

TOC/TN ratios, δ13C, and δ15N were used in this study to clarify the source and storage of SOM. Generally, TOC/TN ratios have been widely used for source identification of bulk SOM; typically, values of 5–7 imply marine autochthonous source and >15 imply terrestrial source [32,54]. In this study, TOC/TN ratios varied from 5.30 to 11.21, suggesting a mixed contribution from marine autochthonous and terrestrial sources. High TOC/TN ratio was observed in core H1, and it gradually decreased seaward, which was consistent with our previous findings on its values in surface sediments of the study area [3], suggesting a relative increase in marine autochthonous OM input [54].
Vertically, TOC/TN ratios in core H1 generally increased slightly with depth but fluctuated greatly (Figure 4e), reflecting the combined effects of terrestrial inputs and marine production in different time spans. In comparison, TOC/TN ratios varied relatively little with depth in the other cores with the values fluctuating around 7, suggesting a predominant source of marine autochthonous [55,56]. It is worth noting, however, that this identification could be an overestimation of marine autochthonous source as there was a high positive intercept, ranging from 0.217 to 0.374‰, in the linear relationships of TOC vs. TN (Figure A2), indicating the presence of interference from inorganic nitrogen in these sediment samples [57,58,59,60]. The decomposition of SOM may be an important reason for the above results [57]. Previous studies have reported that fresh mariculture biodeposits are enriched with labile OC [58]. Degradation and mineralization of recalcitrant constituents in SOM could be enhanced by the “priming effect”, a mechanism that increases or causes changes in the remineralization rate of recalcitrant OC owing to the continuous addition of labile OC [59]. Therefore, the priming effect may be an important process affecting the storage of sedimentary TOC and TN in the study area, which needs further study.
Marine algal-derived OM typically has an average δ13C value of −20.5‰, varying between −19 and −21‰ [60,61]. For terrestrial C3 plants, it is from −22 to −33‰ with a mean of −27‰ [62]. The δ13C values of marine shellfish biodeposits were reported to range from −23 to −17‰ [37,56]. The δ13C values of SOM in this study ranged from −23.13 to −21.21‰, indicative of a mixed source, which is comparable to the results in most of the coastal waters listed in Table A3, but slightly lower than those in the East China Sea shelf. Relatively higher δ13C values (−22.14 ± 0.42‰) were found in the cores from the SFA (H2 and H3), while the mean δ13C in the NSFA was slightly depleted (−22.50 ± 0.20‰), suggesting the contribution of scallop biodeposits to SOM in the study area.
The δ15N data can also indicate the sources of SOM. The δ15N values in OM of marine algae and terrestrial sources usually range from 3 to 12‰ (mean 5 to 7‰) and −10 to 10‰ (mean 2.3‰), respectively [21]. The average δ15N in the OM of shellfish biodeposits was ~5.8‰ [8,37]. In this study, the δ15N values ranged from 3.13 to 5.96‰ (Figure 5e–h), indicating that algal-derived OM had a more significant effect on SOM distribution than terrestrial source. In comparison (Table A3), the δ15N values in this study were comparable to those in the East China Sea shelf [31] and Sishili Bay [63].
By applying a three-end-member model using δ13C and δ15N, we found that sedimentary OC in the study area was predominantly contributed by marine algae (~43%) and terrestrial OC input (~35%), while the contribution of scallop depositions (~22%) was relatively low. Dan et al. [64] reported similar results obtained from Daya Bay in the South China Sea. Comparatively, the contribution of scallop-biodeposited OM in the SFA (24.2 ± 8.0%) was about one fifth higher than that in the NSFA (20.0 ± 10.4%), indicating a significant impact of shellfish farming activities. Similar results were observed in previous studies [8,23,65].

4.1.3. Burial of SOM

The burial fluxes of TOC (BFTOC) and TN (BFTN) in this study ranged from 17.84 to 44.80 and 2.71 to 5.73 g m−2 yr−1, respectively (Figure 6). The TOC and TN burial fluxes in the SFA were about 1.3 and 1.4 times higher than those in the NSFA. Overall, the average BFTOC (27.87 ± 3.88 g m−2 yr−1) in the NSFA was comparable to that in other marginal seas, e.g., the Baltic Sea (19 g m−2 yr−1), Louisiana Inner Shelf (22.7 g m−2 yr−1), and Arabian Sea (21.0 g m−2 yr−1) [66,67,68], while the BFTOC (37.09 ± 4.02 g m−2 yr−1) in the SFA was higher than that in the above-mentioned marginal seas. Moreover, the average BFTOC in cores H2 and H3 was approximately 10-fold higher than the average global BFTOC in shelf sediments, 4.15 g m−2 yr−1 [69], suggesting that scallop farming areas could be an important coastal sink of sedimentary OC and play a significant role in the marine OC cycle.

4.2. Effect Mechanism of Scallop Farming on SOM Dynamics

Generally, sediment composition and accumulation rate, bioturbation, and redox condition are key factors governing SOM dynamics [42]. Shellfish farming can affect the SOM dynamics by its efficient biological deposition process and by changing the hydrological environment of the culture area, e.g., hydrodynamic characteristics and redox condition [14].
On one hand, metabolic activities of scallops produce a large amount of POM, i.e., feces and fake feces that are mainly composed of undecomposed phytoplankton, which potentially increases the amount of OM with lower carbon to nitrogen (C/N) ratio buried in sediments [8,19,65]. This is why the concentration of TN in the sediments of the SFA was higher than that of the NSFA (Figure 4). Additionally, it can be clearly seen from Figure A3 that the composition of OM in the studied sediment cores varied in different time segments. Among them, the contribution rate of scallop-biodeposited OM gradually decreased with depth, which indicated the development history of scallop aquaculture activities.
Official data show that, since 2011, the scale of scallop farming in this area has expanded significantly (Figure A1), potentially increasing the contribution of scallop-biodeposited OM to SOM [15]. Accordingly, the biodeposited OC showed a significant linear positive correlation with the annual production of scallops for the data obtained in cores H2–H4 (p < 0.001, Figure A5). Rough estimates indicate that scallop depositions could increase by 1.14–2.86% (contribution rate) in sedimentary OC content in the SFA, with annual scallop production increasing 104 t. Thus, the scallop biological deposition process is a key factor governing the preservation of OC in sediments of scallop farming areas.
On the other hand, current flow generally tends to decrease in scallop farming areas due to the additional drag caused by the presence of farming facilities, which is beneficial to the preservation of sedimentary TOC and TN [9,70,71]. Sedimentation rate is among the key factors controlling OC accumulation in sediments. Generally, <0.2 cm yr−1 is used to distinguish an environment with a low sedimentation rate, and >1 cm yr−1 is used to distinguish an environment with a high sedimentation rate [72]. Certain estuarine areas, such as the Yellow River Delta and the Yangtze River Estuary Delta, receive large amounts of terrigenous materials and have very high sedimentation rates of about 1.1–3.8 cm yr−1 [72].
In this study, the sedimentation rates in the SFA, 0.88–0.90 cm yr−1, were at a relatively high level, significantly higher than those observed in the central Bohai Sea (0.094–0.17 cm yr−1) and the coastal waters of the East China Sea (<0.2 cm yr−1), and comparable to those observed in other Chinese aquaculture areas along the west coastline of the Yellow Sea, e.g., Sanggou Bay (0.66 cm yr−1) and Jiaozhou Bay (0.64–1.74 cm yr−1) [19,73,74,75,76,77,78].
Spatially, the sedimentation rate in the SFA was ~28% higher than that in the NSFA, implying that scallop farming accelerated the sedimentation process of POM, and thus increased the source contributions of scallop-biodeposited OM and marine algal-derived OM (fake feces) in SOM. Such findings were also noted by Xia et al. [8] and Pan et al. [37], in which mariculture activities were shown to influence the SOC content and distribution by increasing POC flux and sedimentation rates in the surface sediments in Sanggou Bay and Ailian Bay.
Sediment grain size also greatly influences SOM dynamics and has been commonly used to reveal information about hydrodynamics and sediment transport [79]. Generally, the overall high abundance of clayey and silty sediments indicated that the study area was a low-energy environment with weak hydrodynamic conditions. Moreover, fine-grained sediment fractions (i.e., silt and clay) are more conducive to organic matter accumulation and preservation [80], which is due to the fact that fine particles have a larger specific surface area and stronger adsorption capacity for organic matter than coarse particles [81].
In the present study, site H1 was close to the coast and the water depth was relatively shallow (~7 m); thus, the fine-particle fractions of the sediment were easily resuspended by tides and coastal currents. Moreover, the transport of terrestrial detritus moved particles from rivers to coastal margins, and this process also determined the sedimentation pattern in the study area. With the increase in distance from the land, the hydrodynamic conditions gradually weaken, and the grain size of sediments tended to decrease.
Additionally, coastal aquaculture can affect sediment composition by weakening hydrodynamic forces, resulting in a decrease in sediment density and increase in water content of sediment [8,9,11,82,83], which may be the main reason for the slightly higher clay fractions at sites H2 and H3 in the SFA than at site H4 in the NSFA in this study (Figure 2). Furthermore, as mentioned in Section 3.5, TOC was significantly negatively correlated with the clay fraction of sediment (p < 0.05), suggesting that mariculture generally results in decreasing the average sediment grain size and increasing the accumulation of SOC. Similar results were also documented by Pan et al. [58], who observed much lower sedimentary grain sizes in aquaculture sites than at nearby control sites in Alian Bay, China.
Before POM is buried in sediments, it needs to undergo various transformation and mineralization processes in the water body and on the seafloor [84]. The DO concentration in overlying water is the main controlling factor affecting transformation and preservation of SOM, primarily through affecting the redox condition in the sediment. To be brief, higher DO in sediment and its overlying water results in a lower SOC preservation efficiency; on the contrary, it is conducive to the preservation of SOM [85].
Our previous research indicated that it was beneficial to the aerobic decomposition of SOM when the overlying water DO concentration was >100 μmol L−1 [14]. Affected by scallop farming activities, the DO concentration in the overlying water of the study area was usually <100 μmol L−1 in August (Figure A6), which was conducive to the burial and preservation of SOM; however, in other months, the DO concentration in the overlying water was mostly >100 μmol L−1, which could be more likely to promote SOM decomposition, and the SOM preservation rate was correspondingly lower. A similar reduction in DO of bottom seawater was also recorded in shrimp (Litopenaeus vannamei) aquaculture caused by the consumption of bottom water oxygen due to increased OM sedimentation derived from mariculture activities [86].

4.3. Response of SOM Burial to Mariculture Activities

To better understand the impact of scallop farming activities on SOM dynamics, it is helpful to reveal the relationship between historical changes in SOM storage and scallop production. In the study area, scallop aquaculture started in 1985 and has mainly gone through two stages, i.e., the initial development period before 2011 and the rapid development period after 2011. The development of scallop culture may seriously affect the SOM burial in the coastal waters around Yangma Island. As shown in Figure 6, overall the burial fluxes of TOC and its components, and TN in the sedimentary cores had a significant increasing trend in the past 30 years, but not a strictly monotonous increasing trend. In particular, the burial fluxes of TOC and TN at the nearshore stations H1 and H2 fluctuated greatly, mainly affected by terrestrial input at different historical stages [4,66]. In contrast, the burial fluxes of TOC and TN at stations H3 and H4 far from the coast fluctuated slightly with depth, indicating that they were less affected by terrestrial input. To further clarify the effect of scallop culture on SOM burial, we focused on stations H3 and H4 to analyze SOM burial and scallop farming activities in different years.
As can be seen in Figure 6, before 2011 (initial development period of scallop culture), overall the change in SOM burial fluxes at stations H3 and H4 was not significant, indicating the small effect of scallop farming activities at this stage. However, since 2011 (rapid development period), it was found that SOM burial flux, especially TN burial flux, increased significantly. As for its composition, SOC from marine algae and scallop increased significantly, indicating that scallop culture seriously affected the burial of these SOM components. Meanwhile, the correlation between scallop production and SOM burial fluxes at this stage was analyzed (Figure 8), and the results showed that the annual scallop production was significantly positively correlated with SOM burial rate at station H3 in the aquaculture area.
Based on the above linear relationship (Figure 8), the burial fluxes of TOC, TN, scallop-derived OC, and marine algal-derived OC in the SFA (with an area of 150 km2) could increase by 1.08, 0.11, 0.39, and 0.68 g m−2 yr−1, respectively, with annual scallop production increasing 104 t. However, it should be noted that the results obtained by this method are only rough estimates, which may have a large error compared with the actual results. In any case, this result directly confirms the important role of large-scale scallop farming in the accumulation of SOM [4,8,36]. Similar observations were also documented by Liu et al. [19] and Zhou et al. [87] in Sangou Bay and Daya Bay, China. Moreover, interestingly, it was also found that the scallop culture in this study seemed to promote the burial of terrestrial OC in the sediments of core H3 (Figure 6e), which may be related to the decomposition mode of SOM, e.g., priming effect, but the specific mechanism needs further research.

5. Conclusions

This study has clarified the bulk and biological compositions of SOM in a bay scallop farming area on the north coastline of China, and to a certain extent has revealed the main effect mechanism of scallop farming on SOM dynamics. The results showed that mariculture activities affected the content and composition of SOM, especially TN content. As for SOM composition, it was rich in high protein components, indicating high bioavailability, and its geochemical cycling process may adversely affect the ecological environment by causing hypoxia and acidification. As a whole, the sediments were dominated by algal-derived OM with an average contribution rate of 42.6 ± 8.01%, followed by terrestrial sources (mean 35.0 ± 6.97%) and scallop biodeposition (22.4 ± 9.29%). The contribution of scallop-biodeposited OC in the SFA (24.2 ± 8.0%) was clearly higher than that of the NSFA (20.0 ± 10.4%), indicating a significant impact of shellfish farming activities. Vertically, the contribution of scallop-biodeposited OM in sediment increased significantly after ~2011, especially in the SFA. A rough estimate indicated that the burial rates of TOC, TN, scallop-derived OC, and marine algal-derived OC in the SFA will increase by 1.08, 0.11, 0.39, and 0.68 g m−2 yr−1, respectively, with annual scallop production increasing 104 t. In addition to the influence through biodeposition, scallop farming activities reduced the hydrodynamic conditions and sediment grain size composition, thus promoting SOM storage. Therefore, mariculture activities are valuable for carbon storage and mitigation of the greenhouse effect.

Author Contributions

B.Y. and X.G. designed the research; B.Y. carried out the investigation and prepared the samples for instrumental determinations; J.L. measured the carbon and nitrogen stable isotope data; B.Y. and X.G. interpreted and discussed the results; B.Y. wrote the original draft; Writing—review & editing, X.G., L.X., J.Z., Q.X., S.D., L.T. and C.T. All authors have read and agreed to the published version of the manuscript.

Funding

This work was financially supported by the Strategic Priority Research Program of the Chinese Academy of Sciences (XDA23050303); the 2020–2022 Scientific Cooperation Program between the National Research Council of Italy and the Chinese Academy of Sciences (the Project “Coastal System Changes over the Anthropocene: Natural vs Induced Drivers”); and Guangdong Basic and Applied Basic Research Foundation (2022A1515110345).

Institutional Review Board Statement

Not applicable.

Informed Consent Statement

Not applicable.

Data Availability Statement

The data that support the findings of this study are available from the corresponding authors, X. Gao and J. Liu, upon reasonable request.

Acknowledgments

The assistance of Y.L. Liu in this research was greatly appreciated.

Conflicts of Interest

The authors declare no conflict of interest.

Appendix A

Table A1. Correlation between the measured sediment components.
ClaySiltSandTOCTNTerrestrial OMMarine Autogenic OMScallop-Deposited OMProteinCarbohydrateLipid
Silt−0.021
Sand−0.417 c−0.900 c
TOC0.230 a−0.440 c0.307 a
TN0.241 a−0.005−0.1110.492 c
Terrestrial OM0.138−0.500 c0.415 b0.661 c−0.057
Marine autogenic OM0.318 a−0.277 a0.1310.620 c0.1850.326 a
Scallop-deposited OM−0.0840.103−0.0620.289 a0.501 c−0.199−0.356 b
Protein0.462 c−0.435 c0.1950.241 a0.0100.423 b0.306 a−0.184
Carbohydrate−0.2140.122−0.0180.067−0.045−0.005−0.0060.115−0.306 b
Lipid0.0210.077−0.079−0.1350.011−0.017−0.1460.0000.0260.064
BPC0.171−0.1030.0190.0170.0020.1950.028−0.0590.390 c0.2020.890 c
a 0.01 < p < 0.05. b 0.001 < p < 0.01. c p < 0.001.
Table A2. Sediment accumulation rates (SAR) and burial fluxes of TOC, TN, BPC, marine algal-derived OC (Mar-OC), terrestrial OC (Ter-OC), and scallop-derived OC (Scal-OC) in the cores H1, H2, H3, and H4.
Core SAR (cm yr−1)Burial Flux (g m−2 yr−1)
TOCTNBPCMar-OCTer-OCScal-OC
NSFA (H1)Range 22.19–34.732.71–4.2118.83–29.297.33–16.568.28–15.520.05–11.83
Mean0.6428.95 ± 3.883.48 ± 0.4622.80 ± 2.6011.97 ± 2.8911.26 ± 2.325.49 ± 3.78
SFA (H2)Range 29.19–44.804.02–5.3821.62–34.5411.17–26.266.01–15.283.26–15.28
Mean0.8135.91 ± 4.164.84 ± 0.3426.54 ± 3.2616.70 ± 3.649.94 ± 3.038.47 ± 3.50
SFA (H3)Range 33.35–44.284.65–5.7326.73–37.8511.40–18.6410.17–15.854.83–15.42
Mean0.9138.32 ± 3.555.04 ± 0.2932.17 ± 3.6415.47 ± 2.5513.44 ± 1.669.23 ± 2.46
NSFA (H4)Range 17.84–32.033.34–4.2021.15–30.946.88–15.947.57–11.643.17–8.37
Mean0.7626.54 ± 4.213.73 ± 0.2725.41 ± 2.8910.83 ± 2.709.51 ± 1.235.44 ± 1.66
Table A3. Comparison of TOC, TN, TOC/TN ratios, δ13C, and δ15N in sediment cores in this study with those in other estuarine and coastal waters in China.
Location TOC (%)TN (‰)TOC/TNδ13C (‰)δ15N (‰)Reference
Yellow SeaRange0.08–1.070.20–1.035.4–14.7−23.14 to −21.26n.a.Hu et al. [28]
Mean0.46 ± 0.250.60 ± 0.308.05 ± 1.54n.a.n.a.
Bohai BayRange0.04–0.690.10–0.903.3–7.7−23.9 to −21.7n.a.Hu et al. [30]
Mean0.38 ± 0.17n.a.n.a.n.a.n.a.
Sishili BayRange0.17–1.330.20–1.047.9–10.1−22.7 to −21.65.4–6.5Liu et al. [64]
Pearl River EstuaryRange0.48–1.60n.a.8.50–15.32n.a.n.a.
Sanggou BayMean0.500.4411.47n.a.n.a.Liu et al. [19]
Jiaozhou BayRange0.07–0.450.16–0.48n.a.n.a.n.a.Dai et al. [29]
Mean0.380.32n.a.n.a.n.a.
East China Sea shelfRange0.15–0.750.22–1.514.69–9.12−22.08 to −19.993.67–6.28Zhou et al. [31]
Mean0.54n.a.n.a.n.a.n.a.
Coastal waters around Yangma IslandRange0.27–0.620.48–0.755.30–11.21−23.13 to −21.213.13–5.96This study
Mean0.47 ± 0.070.61 ± 0.067.68 ± 1.11−22.30 ± 0.384.54 ± 0.55
n.a. = not available.
Table A4. Comparison of sedimentary protein, carbohydrate, lipid, and biopolymerized carbon (BPC) contents in this study with those in other estuarine and coastal waters (mg g−1).
LocationProteinCarbohydrateLipidBPCReference
Laizhou Bay0.65 ± 0.231.45 ± 0.740.28 ± 0.081.18Huang et al. [4]
Galician Coast1.040.240.440.94Cividanes et al. [41]
Northern Adriatic1.05 ± 0.680.25 ± 0.130.06 ± 0.050.65Bianchelli et al. [42]
Akrotiri Bay, Cyprus3.04 ± 1.593.79 ± 1.820.70 ± 0.303.53Pusceddu et al. [43]
Sounion Bay, Greece0.90 ± 0.564.78 ± 4.640.46 ± 0.142.70Pusceddu et al. [43]
Pachino Bay, Italy0.80 ± 0.604.58 ± 3.280.16 ± 0.102.34Bongiorni et al. [44]
Gulf of Alicante, Spain2.04 ± 0.218.25 ± 3.030.45 ± 0.174.64Pusceddu et al. [43]
Coastal waters of New Caledonia4.82 ± 1.854.45 ± 1.081.91 ± 0.645.57Pusceddu et al. [50]
Coastal waters around Yangma Island4.31 ± 0.592.46 ± 0.401.02 ± 0.493.86This study
Figure A1. Annual scallop production in the study area during 2002–2019 (data obtained from the Bureau of Statistics of Yantai, China, through the webpage http://tjj.yantai.gov.cn/col/col118/index.html, accessed on 30 July 2022).
Sustainability 15 10595 g0a1
Figure A2. Relationships between TOC and TN contents in the studied sediment cores (H1, H2, H3, and H4).
Sustainability 15 10595 g0a2
Figure A3. Vertical distributions of terrestrial, marine, and scallop biological sources of OM to SOM in the sediment cores H1–H4 (ad).
Sustainability 15 10595 g0a3
Figure A4. Relationships between the contents of protein (PRT) and carbohydrate (CHO) in the studied sediment cores H1–H4.
Sustainability 15 10595 g0a4
Figure A5. Relationships between annual scallop production and the contents of TOC (a), TN (b), and scallop-deposited OM (c) in the studied sediment cores H1–H4.
Sustainability 15 10595 g0a5
Figure A6. Distributions of DO in the bottom water from 2015 to 2020 (adapted from Yang et al. (2021) [15]).
Sustainability 15 10595 g0a6

References

  1. Xu, J.; Han, L.; Yin, W. Research on the ecologicalization efficiency of mariculture industry in China and its influencing factors. Mar. Policy 2022, 137, 104935. [Google Scholar] [CrossRef]
  2. FAO. WaPOR Database Methodology: Version 2 Release, April 2020; FAO: Rome, Italy, 2020. [Google Scholar]
  3. Yang, B.; Gao, X.L.; Xing, Q.G. Geochemistry of organic carbon in surface sediments of a summer hypoxic region in the coastal waters of northern Shandong Peninsula. Cont. Shelf Res. 2018, 171, 113–125. [Google Scholar] [CrossRef]
  4. Huang, Q.; Olenin, S.; Jiang, T.; Sun, S.; Troch, M.D. Assessing environmental effects of the bay scallop Argopecten irradians culture in China: Using abiotic and biotic indicators. Aquaculture 2019, 499, 316–328. [Google Scholar] [CrossRef]
  5. Shi, R.; Han, T.; Xu, S.; Huang, H.; Qi, Z.; Zhu, Q. Bacterial community responses to the redox profile changes of mariculture sediment. Mar. Pollut. Bull. 2021, 166, 112250. [Google Scholar] [CrossRef]
  6. Souza, G.; Kuroshima, K.; Abreu, J.; Manzoni, G. Speciation and distribution of sedimentary phosphorus in an important mariculture area, Armação do Itapocoroy Bay, Southern Brazil. Reg. Stud. Mar. Sci. 2022, 49, 102137. [Google Scholar] [CrossRef]
  7. Tang, Q.S. Carbon sink fisheries and the development of modern fisheries. Jiangxi Fish. Sci. 2011, 2, 5–7. [Google Scholar]
  8. Xia, B.; Han, Q.; Chen, B.J.; Sui, Q.; Jiang, T.; Sun, X.M.; Zhu, L.; Chai, C.; Qu, K.M. Influence of shellfish biodeposition on coastal sedimentary organic matter: A case study from Sanggou Bay, China. Cont. Shelf Res. 2019, 172, 12–21. [Google Scholar] [CrossRef]
  9. Zhang, J.; Hansen, P.K.; Wu, W. Sediment-focused environmental impact of long-term large- scale marine bivalve and seaweed farming in Sungo Bay, China. Aquaculture 2020, 528, 735561. [Google Scholar] [CrossRef]
  10. Gao, X.L.; Yang, Y.W.; Wang, C.Y. Geochemistry of organic carbon and nitrogen in surface sediments of coastal Bohai Bay inferred from their ratios and stable isotopic signatures. Mar. Pollut. Bull. 2012, 64, 1148–1155. [Google Scholar] [CrossRef]
  11. Li, R.; Liu, S.; Zhang, J.; Jiang, Z.; Fang, J. Sources and export of nutrients associated with integrated multi-trophic aquaculture in Sanggou Bay, China. Aquacult. Env. Interac. 2016, 8, 285–309. [Google Scholar] [CrossRef] [Green Version]
  12. Yang, B.; Gao, X.L.; Zhao, J.M.; Liu, Y.L.; Gao, T.C.; Lui, H.K.; Huang, T.H.; Chen, C.T.A.; Xing, Q.G. The influence of summer hypoxia on sedimentary phosphorus biogeochemistry in a coastal scallop farming area, North Yellow Sea. Sci. Total Environ. 2021, 11, 143486. [Google Scholar] [CrossRef] [PubMed]
  13. Larowe, D.E.; Arndt, S.; Bradley, J.A. The fate of organic carbon in marine sediments—New insights from recent data and analysis. Earth-Sci. Rev. 2020, 204, 103146. [Google Scholar] [CrossRef]
  14. Yang, B.; Gao, X.L.; Zhao, J.M.; Lu, Y.X.; Gao, T.C. Biogeochemistry of dissolved inorganic nutrients in an oligotrophic coastal mariculture region of the northern Shandong Peninsula, north Yellow Sea. Mar. Pollut. Bull. 2020, 150, 110693. [Google Scholar] [CrossRef] [PubMed]
  15. Yang, B.; Gao, X.; Zhao, J.; Liu, Y.; Xie, L.; Lv, X.; Xing, Q. Summer deoxygenation in a bay scallop (Argopecten irradians) farming area: The decisive role of water temperature, stratification and beyond. Mar. Pollut. Bull. 2021, 173, 113092. [Google Scholar] [CrossRef]
  16. Fu, C.; Li, Y.; Zeng, L.; Zhang, H.; Tu, C.; Zhou, Q.; Luo, Y. Stocks and losses of soil organic carbon from Chinese vegetated coastal habitats. Global Chang. Biol. 2020, 27, 202–214. [Google Scholar] [CrossRef]
  17. Danovaro, R.; Fabiano, M. Seasonal changes in quality and quantity of food available for benthic suspension-feeders in the Golfo Marconi (North-western Mediterranean). Estuar. Coast. Shelf S. 1997, 44, 723–736. [Google Scholar] [CrossRef]
  18. Fabiano, M.; Danovaro, R.; Fraschetti, S. A three-year time series of elemental and biochemical composition of organic matter in subtidal sandy sediments of the Ligurian Sea (northwestern Mediterranean). Cont. Shelf Res. 1995, 15, 1453–1469. [Google Scholar] [CrossRef]
  19. Liu, S.; Huang, J.S.; Yang, Q.; Yang, S.; Yang, G.P.; Sun, Y. Burial fluxes and source apportionment of carbon in culture areas of Sanggou Bay over the past 200 years. Acta Oceanol. Sin. 2015, 34, 23–30. [Google Scholar] [CrossRef]
  20. Dan, S.F.; Liu, S.M.; Yang, B.; Udoh, E.C.; Umoh, U.; Ewa-Oboho, I. Geochemical discrimination of bulk organic matter in surface sediments of the Cross River estuary system and adjacent shelf, South East Nigeria (West Africa). Sci. Total Environ. 2019, 678, 351–368. [Google Scholar] [CrossRef]
  21. Brandes, J.A.; Devol, A.H. A global marine-fixed nitrogen isotopic budget: Implications for Holocene nitrogen cycling. Glob. Biogeochem. Cycles 2002, 16, 67-1–67-14. [Google Scholar] [CrossRef]
  22. Guo, Z.; Juyuan, L.I.; Feng, J.; Ming, F.; Yang, Z. Compound-specific carbon isotope compositions of individual long-chain n-alkanes in severe Asian dust episodes in the North China coast in 2002. Sci. Bull. 2006, 51, 2133–2140. [Google Scholar] [CrossRef]
  23. Xu, C.; Yang, B.; Dan, S.F.; Zhang, D.; Liao, R.; Lu, D.; Peng, S. Spatiotemporal variations of biogenic elements and sources of sedimentary organic matter in the largest oyster mariculture bay (Maowei Sea), Southwest China. Sci. Total Environ. 2020, 730, 139056. [Google Scholar] [CrossRef] [PubMed]
  24. Ingall, E.; Jahnke, R. Evidence for enhanced phosphorus regeneration from marine sediments overlain by oxygen depleted waters. Geochim. Cosmochim. Acta 1994, 58, 2571–2575. [Google Scholar] [CrossRef]
  25. Benjamini, Y.; Hochberg, Y. Controlling the false discovery rate: A practical and powerful approach to multiple testing. J. Roy. Statist. Soc. Ser. B 1995, 57, 289–300. [Google Scholar] [CrossRef]
  26. Sanchez-Cabeza, J.A.; Ruiz-Fernández, A.C. 210Pb sediment radiochronology: An integrated formulation and classification of dating models. Geochim. Cosmochim. Acta 2012, 82, 183–200. [Google Scholar] [CrossRef]
  27. Arias-Ortiz, A.; Serrano, O.; Masqué, P. A marine heatwave drives massive losses from the world’s largest seagrass carbon stocks. Nat. Clim. Chang. 2018, 8, 338. [Google Scholar] [CrossRef] [Green Version]
  28. Hu, L.; Shi, X.; Guo, Z.; Wang, H.; Yang, Z. Sources, dispersal and preservation of sedimentary organic matter in the Yellow Sea: The importance of depositional hydrodynamic forcing. Mar. Geol. 2013, 335, 52–63. [Google Scholar] [CrossRef]
  29. Dai, J.; Song, J.; Li, X.; Yuan, H.; Li, N.; Zheng, G. Environmental changes reflected by sedimentary geochemistry in recent hundred years of Jiaozhou Bay, North China. Environ. Pollut. 2007, 145, 656–667. [Google Scholar] [CrossRef]
  30. Hu, L.; Guo, Z.; Feng, J.; Yang, Z.; Fang, M. Distributions and sources of bulk organic matter and aliphatic hydrocarbons in surface sediments of the Bohai Sea, China. Mar. Chem. 2009, 113, 197–211. [Google Scholar] [CrossRef]
  31. Zhou, F.X.; Gao, X.L.; Yuan, M.H.; Song, J.M.; Chen, F.J. The distribution and seasonal variations of sedimentary organic matter in the East China Sea shelf. Mar. Pollut. Bull. 2018, 129, 163–171. [Google Scholar] [CrossRef]
  32. Meyers, P.A. Organic geochemical proxies of paleoceanographic, paleolimnologic, and paleoclimatic processes. Org. Geochem. 1997, 27, 213–250. [Google Scholar] [CrossRef]
  33. Zhang, M.; Zou, J.; Mao, Y.; Zhang, J.; Fang, J. Contribution of culturing scallop to carbon cycle in Sanggou Bay. Fish. Mod. 2011, 38, 13–16. [Google Scholar]
  34. Keil, R. Anthropogenic forcing of carbonate and organic carbon preservation in marine sediments. Annu. Rev. Mar. Sci. 2017, 9, 151–172. [Google Scholar] [CrossRef] [PubMed]
  35. Zhuang, W.; Gao, X.L.; Zhang, Y.; Xing, Q.G.; Tosi, L.; Qin, S. Geochemical characteristics of phosphorus in surface sediments of two major Chinese mariculture areas: The Laizhou Bay and the coastal waters of the Zhangzi Island. Mar. Pollut. Bull. 2014, 83, 343–351. [Google Scholar] [CrossRef] [PubMed]
  36. Shi, R.; Xu, S.; Qi, Z.; Zhu, Q.; Huang, H.; Weber, F. Influence of suspended mariculture on vertical distribution profiles of bacteria in sediment from Daya Bay, Southern China. Mar. Pollut. Bull. 2019, 146, 816–826. [Google Scholar] [CrossRef] [PubMed]
  37. Pan, Z.; Gao, Q.F.; Dong, S.L.; Wang, F.; Li, H.D.; Zhao, K. Effects of abalone (Haliotis discus hannai Ino) and kelp (Saccharina japonica) mariculture on sources, distribution, and preservation of sedimentary organic carbon in Ailian Bay, China: Identified by coupling stable isotopes (δ13C and δ15N) with C/N ratio analyses. Mar. Pollut. Bull. 2019, 141, 387–397. [Google Scholar]
  38. Tian, Y.; Chen, G.; Lu, H.; Zhu, H.; Ye, Y. Effects of shrimp pond effluents on stocks of organic carbon, nitrogen and phosphorus in soils of Kandelia obovata forests along Jiulong River Estuary. Mar. Pollut. Bull. 2019, 149, 110657. [Google Scholar] [CrossRef]
  39. Pusceddu, A.; Dell’Anno, A.; Fabiano, M.; Danovaro, R. Quantity and bioavailability of sediment organic matter as signatures of benthic trophic status. Mar. Ecol. Prog. Ser. 2009, 375, 41–52. [Google Scholar] [CrossRef] [Green Version]
  40. Dalu, T.; Cuthbert, R.N.; Chavalala, T.L.; Froneman, P.W.; Wasserman, R.J. Assessing sediment particle-size effects on benthic algal colonisation and total carbohydrate production. Sci. Total Environ. 2020, 710, 136348. [Google Scholar] [CrossRef]
  41. Cividanes, S.; Incera, M.; Lopez, J. Temporal variability in the biochemical composition of sedimentary organic matter in an intertidal flat of the Galician coast (NW Spain). Oceanol. Acta 2002, 25, 1–12. [Google Scholar] [CrossRef] [Green Version]
  42. Bianchelli, S.; Pusceddu, A.; Buschi, E.; Danovaro, R. Trophic status and meiofauna biodiversity in the Northern Adriatic Sea: Insights for the assessment of good environmental status. Mar. Environ. Res. 2016, 113, 18–30. [Google Scholar] [CrossRef]
  43. Pusceddu, A.; Fraschetti, S.; Mirto, S.; Holmer, M.; Danovaro, R. Effects of intensive mariculture on sediment biochemistry. Ecol. Appl. 2007, 17, 1366–1378. [Google Scholar] [CrossRef]
  44. Bongiorni, L.; Mirto, S.; Pusceddu, A.; Danovaro, R. Response of benthic protozoa and thraustochytrid protists to fish farm impact in seagrass (Posidonia oceanica) and soft-bottom sediments. Microb. Ecol. 2005, 50, 268–276. [Google Scholar] [CrossRef] [PubMed]
  45. Pusceddu, A.; Dell’Anno, A.; Fabiano, M. Organic matter composition in coastal sediments at Terra Nova Bay (Ross Sea) during summer 1995. Polar. Biol. 2000, 23, 288–293. [Google Scholar] [CrossRef]
  46. Kautsky, N.; Evans, S. Role of biodeposition by Mytilus edulis in the circulation of matter and nutrients in a Baltic coastal ecosystem. Mar. Ecol. Prog. Ser. 1987, 38, 201–212. [Google Scholar] [CrossRef]
  47. Miller, D.C.; Norkko, A.; Pilditch, C.A. Influence of diet on dispersal of horse mussel Atrina zelandica biodeposits. Mar. Ecol. Prog. Ser. 2002, 242, 153–167. [Google Scholar] [CrossRef]
  48. Danovaro, R.; Corinaldesi, C.; La Rosa, T.; Luna, G.; Mazzola, A.; Mirto, S.; Vezzulli, L.; Fabiano, M. Aquaculture impact on benthic microbes and organic matter cycling in coastal Mediterranean sediments: A synthesis. Chem. Ecol. 2003, 19, 59–65. [Google Scholar] [CrossRef]
  49. Tselepides, A.; Polychronaki, T.; Marrale, D.; Akoumianaki, I.; Dell’Anno, A.; Pusceddu, A.; Danovaro, R. Organic matter composition of the continental shelf and bathyal sediments of the Cretan Sea (NE Mediterranean). Prog. Oceanogr. 2000, 46, 311–344. [Google Scholar] [CrossRef]
  50. Pusceddu, A.; Fraschetti, S.; Scopa, M.; Rizzo, L.; Danovaro, R. Meiofauna communities, nematode diversity and C degradation rates in seagrass (Posidonia oceanica L.) and unvegetated sediments invaded by the algae Caulerpa cylindracea (Sonder). Mar. Environ. Res. 2016, 119, 88–99. [Google Scholar] [CrossRef]
  51. Rizzo, L.; Pusceddu, A.; Stabili, L.; Alifano, P.; Fraschetti, S. Potential effects of an invasive seaweed (Caulerpa cylindracea, Sonder) on sedimentary organic matter and microbial metabolic activities. Sci. Rep. 2017, 7, 12113. [Google Scholar] [CrossRef] [Green Version]
  52. Liu, H.; Li, Y.; Ma, F.; Ren, G.; Xiong, H.; Zhao, P.; Wang, J. Research progress of algae protein. Bot. Res. 2019, 8, 79–87. [Google Scholar]
  53. Rizzo, L.; Pusceddu, A.; Bianchelli, S.; Fraschetti, S. Potentially combined effect of the invasive seaweed Caulerpa cylindracea (sonder) and sediment deposition rates on organic matter and meiofaunal assemblages. Mar. Environ. Res. 2020, 159, 104966. [Google Scholar] [CrossRef]
  54. Redfield, A.C. The influence of organisms on the composition of sea-water. Sea 1963, 40, 640–644. [Google Scholar]
  55. Lu, F.Y.; Liu, Z.Q.; Ji, H.B. Carbon and nitrogen isotopes analysis and sources of organic matter in the upper reaches of the Chaobai River near Beijing, China. Sci. China Earth Sci. 2012, 42, 1912–1922. [Google Scholar] [CrossRef]
  56. Xia, B.; Cui, Y.; Chen, B.; Cui, Z.; Qu, K.; Ma, F. Carbon and nitrogen isotopes analysis and sources of organic matter in surface sediments from the Sanggou Bay and its adjacent areas, China. Acta Oceanol. Sin. 2014, 33, 48–57. [Google Scholar] [CrossRef]
  57. Kuwae, M.; Yamaguchi, H.; Tsugeki, N.K.; Miyasaka, H.; Fukumori, K.; Ikehara, M.; Genkai-Kato, M.; Omori, K.; Sugimoto, T.; Ishida, S.; et al. Spatial distribution of organic and sulfur geochemical parameters of oxic to anoxic surface sediments in Beppu Bay in southwest Japan. Estuar. Coast. Shelf Sci. 2007, 72, 348–358. [Google Scholar] [CrossRef]
  58. Pan, Z.; Tan, Y.M.; Gao, Q.F.; Dong, S.L.; Fang, X.D.; Yan, J.L. A 120-year record of burial fluxes and source apportionment of sedimentary organic carbon in Alian Bay, China: Implication for the influence of mariculture activities, and regional environment changes. Aquaculture 2021, 535, 736421. [Google Scholar] [CrossRef]
  59. Bianchi, T.S. The role of terrestrially derived organic carbon in the coastal ocean: A changing paradigm and the priming effect. Proc. Natl. Acad. Sci. USA 2011, 108, 19473–19481. [Google Scholar] [CrossRef]
  60. Fry, B.; Sherr, E.B. δ13C measurements as indicators of carbon flow in marine and freshwater ecosystems. In Stable Isotopes in Ecological Research; Rundel, P.W., Ehleringer, J.R., Nagy, K.A., Eds.; Springer: New York, NY, USA, 1984; pp. 196–229. [Google Scholar]
  61. Torres, I.; Inglett, P.; Brenner, M.; Kenney, W.; Ramesh Reddy, K. Stable isotope (δ13C and δ15N) values of sediment organic matter in subtropical lakes of different trophic status. J. Paleolimnol. 2012, 47, 693–706. [Google Scholar] [CrossRef]
  62. Pancost, R.D.; Boot, C.S. The palaeoclimatic utility of terrestrial biomarkers in marine sediments. Mar. Chem. 2004, 92, 239–261. [Google Scholar] [CrossRef]
  63. Liu, D.Y.; Shen, X.H.; Wang, Y.J.; Chen, Y.J.; Li, L. Tracking the sources of organic matter in the surface sediments of Sishili Bay, Northern Yellow Sea and the environmental implication. Acta Oceanol. Sin. 2012, 34, 205–212. [Google Scholar]
  64. Dan, S.F.; Cui, D.; Yang, B.; Wang, X.; Ning, Z.; Lu, D.; Kang, Z.; Huang, H.; Zhou, J.; Cui, D.; et al. Sources, burial flux and mass inventory of black carbon in surface sediments of the Daya Bay, a typical mariculture bay of China. Mar. Pollut. Bull. 2022, 179, 113708. [Google Scholar] [CrossRef]
  65. Ren, L.; Zhang, J.; Fang, J.; Tang, Q.; Zhang, M.; Du, M. Impact of shellfish biodeposits and rotten seaweed on the sediments of Ailian Bay, China. Aquac. Int. 2013, 22, 811–819. [Google Scholar] [CrossRef]
  66. Bhushan, R.; Dutta, K.; Somayajulu, B.L.K. Concentrations and burial fluxes of organic and inorganic carbon on the eastern margins of the Arabian Sea. Mar. Geol. 2001, 178, 95–113. [Google Scholar] [CrossRef]
  67. Gordon, E.S.; Goñi, M.A.; Roberts, Q.N.; Kineke, G.C.; Allison, M.A. Organic matter distribution and accumulation on the inner Louisiana shelf west of the Atchafalaya River. Cont. Shelf Res. 2001, 21, 1691–1721. [Google Scholar] [CrossRef]
  68. Winogradow, A.; Pempkowiak, J. Organic carbon burial rates in the Baltic Sea sediments. Estuar. Coast. Shelf Sci. 2014, 138, 27–36. [Google Scholar] [CrossRef]
  69. Berner, R.A. Burial of organic carbon and pyrite sulfur in the modern ocean: Its geochemical and environmental significance. Am. J. Sci. 1982, 282, 451–473. [Google Scholar] [CrossRef]
  70. Plew, D.R.; Stevens, C.L.; Spigel, R.H.; Hartstein, N.D. Hydrodynamic implications of large offshore mussel farms. IEEE J. Ocean. Eng. 2005, 30, 95–108. [Google Scholar] [CrossRef]
  71. Shi, J.; Wei, H. Simulation of hydrodynamic structures in a semi-enclosed bay with dense raft-culture. J. Ocean U. China 2009, 39, 1181–1187. [Google Scholar]
  72. Gao, S. Shallow marine sedimentat ion and physical environment evolution as a part of global change: An example from the Bohai, yellow and East China Sea regions. Earth Sci. Front. 2002, 9, 329–335. [Google Scholar]
  73. Chen, Y.; Zhao, Y.Y.; Liu, J.Y.; Qiu, J.G. Distribution characteristics of 226Ra in sediments of the East China Sea and determination of sedimentation rate in near-shore region. Oceanol. Limnol. Sin. 1982, 13, 381–387. [Google Scholar]
  74. Dong, T. Modern sedimentation models in the Bohai Sea. Mar. Geol. Quat. Geol. 1996, 16, 45–53. [Google Scholar]
  75. Li, F.Y.; Song, J.M.; Li, X.G.; Wang, Y.P.; Qi, J. Modern sedimentation rate and flux in the Jiaozhou Bay. Mar. Geol. Quat. Geol. 2003, 23, 29–33. [Google Scholar]
  76. Liu, G.S.; Li, D.M.; Yi, Y.; Liu, S.M.; Bai, J.; Zhang, J. Radionuclide distribution in sediments and sedimentary rates in the Jiaozhou Bay. Acta Geosci. Sin. 2008, 29, 769–777. [Google Scholar]
  77. Hu, B.Q.; Li, G.; Li, J.; Yang, M.; Wang, L.B.; Bu, R.Y. Spatial variability of the 210Pb sedimentation rates in the Bohai and Huanghai Seas and its influencing factors. Acta Oceanol. Sin. 2012, 33, 127–132. [Google Scholar]
  78. Luo, H.; Liang, B.; Bao, C.G.; Li, M.; Yu, C.Y.; Ma, M.H. Optimization design for marine sediment monitoring frequency based on sedimentation rate. Mar. Sci. 2015, 39, 52–59. [Google Scholar]
  79. Molinaroli, E.; Guerzoni, S.; Sarretta, A.; Masiol, M.; Pistolato, M. Thirty-year changes (1970 to 2000) in bathymetry and sediment texture recorded in the lagoon of Venice sub-basins, Italy. Mar. Geol. 2009, 258, 115–125. [Google Scholar] [CrossRef] [Green Version]
  80. Hedges, J.I.; Keil, R.G. Sedimentary organic matter preservation: An assessment and speculative synthesis. Mar. Chem. 1995, 49, 123–126. [Google Scholar] [CrossRef]
  81. McLaren, P.; Bowles, D. The effects of sediment transport on grain-size distributions. J. Sediment. Res. 1985, 55, 457–470. [Google Scholar]
  82. Biggs, R.B.; Howell, B.A. The estuary as a sediment trap: Alternate approaches to estimating its filtering efficiency. In The Estuary as a Filter; Kennedy, V.S., Ed.; Academic Press: Orlando, FL, USA, 1984; pp. 107–129. [Google Scholar]
  83. Franzo, A.; Cibic, T.; Del, N.P.; Solidoro, C. Microphytobenthic response to mussel farm biodeposition in coastal sediments of the northern Adriatic Sea. Mar. Pollut. Bull. 2014, 79, 379–388. [Google Scholar] [CrossRef]
  84. Burdige, D.J. Burial of terrestrial organic matter in marine sediments: A reassessment. Global Biogeochem. Cycles 2005, 19, 922–932. [Google Scholar] [CrossRef] [Green Version]
  85. Hartnett, H.E.; Keil, R.G.; Al, E. Influence of oxygen exposure time on organic carbon preservation in continental marine regions. Nature 1998, 391, 572–575. [Google Scholar] [CrossRef]
  86. Wiyoto, W.; Sukenda, S.; Harris, E.; Nirmala, K.; Djokosetiyanto, D.; Ekasari, J. The effects of sediment redox potential and stocking density on Pacific white shrimp Litopenaeus vannamei production performance and white spot syndrome virus resistance. Aquac. Res. 2017, 48, 2741–2751. [Google Scholar] [CrossRef]
  87. Zhou, P.; Li, D.M.; Zhao, L.; Li, H.T.; Ni, Z.X.; Zhao, F.; Yu, H.S.; Li, X.M. 120-year sedimentary record and its environmental implications, in a dated marine sediment core from Daya bay in the northeastern South China Sea. Mar. Pollut. Bull. 2019, 145, 248–253. [Google Scholar] [CrossRef]
Figure 1. Sampling sites in the coastal waters around Yangma Island, northern Yellow Sea. XA River, YN River, QS River, JS Port, and SD Bay represent the Xin’an River, Yuniao River, Qinshui River, Jinshan Port, and Shuangdao Bay, respectively. LNCC, LBCC, and YSWC refer to the Liaonan coastal current, Lubei coastal current, and Yellow Sea warm current, respectively.
Sustainability 15 10595 g001
Figure 2. Ternary diagram showing the Shepard’s classification and textures of the sediment cores H1–H4.
Sustainability 15 10595 g002
Figure 3. Vertical distributions of 210Pbex activity in the sediment cores H1–H4 (ad).
Sustainability 15 10595 g003
Figure 4. Vertical distributions of TOC and TN (ad) and TOC/TN ratios (eh) in the sediment cores H1–H4.
Sustainability 15 10595 g004aSustainability 15 10595 g004b
Figure 5. Vertical distributions of biopolymeric carbon (BPC) content and percentage contributions of carbohydrates (CHO), proteins (PRT), and lipids (LIP) to the BPC (ad), as well as δ13C and δ15N values (eh) in the sediment cores H1–H4.
Sustainability 15 10595 g005
Figure 6. Burial flux of TOC (a), TN (b), BPC (c), marine algal-derived OC (d), terrestrial OC (e), and scallop-derived OC (f) in the sediment cores H1–H4.
Sustainability 15 10595 g006
Figure 7. Principal component analysis diagram (PC1-PC3) (a,b) for the sediment parameters.
Sustainability 15 10595 g007
Figure 8. Relationships between annual scallop production and the burial rates of TOC (a), TN (b), scallop-derived OC (c), and marine algal-derived OC (d) in the studied sediment cores H1–H4.
Sustainability 15 10595 g008
Disclaimer/Publisher’s Note: The statements, opinions and data contained in all publications are solely those of the individual author(s) and contributor(s) and not of MDPI and/or the editor(s). MDPI and/or the editor(s) disclaim responsibility for any injury to people or property resulting from any ideas, methods, instructions or products referred to in the content.

