Abstract
From the perspective of energy consumption optimization, this paper studies the impact of green finance on carbon emissions in China. Firstly, based on the theoretical perspective, this paper explores the mechanism and path by which green finance influences carbon emissions, and analyzes the role of energy consumption in this process. Then, this paper utilizes the STIRPAT model, chain multiple mediation effect model and panel threshold model to empirically analyze the influence of green finance on carbon emissions, using provincial data from China from 2005 to 2019. The results are as follows: (1) Green finance significantly reduces carbon emissions. After accounting for potential endogeneity, this conclusion is still valid. The heterogeneity test reveals that the inhibitory effect is more remarkable in northern regions, high-carbon emission regions and energy-rich regions. (2) The results of the bootstrap test reveal that at the national level, green finance decreases carbon emissions through three paths: green technological innovation, ecological evolution of the industrial structure and green technological innovation facilitating ecological evolution of the industrial structure. Furthermore, in energy-rich regions, green finance significantly inhibits carbon emissions through all three paths, while in energy-poor regions, green finance reduces carbon emissions only through green technological innovation. (3) There is a nonlinear relationship between green finance and carbon emissions. Specifically, regardless of energy intensity or energy consumption structure, only when it is below the threshold can green finance significantly inhibit carbon emissions. Thus, realizing energy consumption optimization is an effective way to ensure the carbon emission reduction effect of green finance.
1. Introduction
China’s economy has created world-renowned achievements. By 2021, China’s total economic output had reached CNY 114.4 trillion, rising 8.1%, and it continues to rank second in the world. However, we have to admit that China’s past high-speed economic growth was at the expense of the massive use of fossil energy and serious ecological destruction [1]. Many studies have shown that economic growth does lead to an increase in energy consumption, and the consumption of energy, especially fossil energy, is generally considered to be the main cause associated with carbon emissions [2,3,4]. The energy consumption structure of China, which is dominated by fossil energy, aggravates this problem [5]. Since entering the new economic normal, China has assigned great importance to climate change and has made positive efforts to address this issue. As a responsible dominant economy, China actively committed itself to “reaching carbon emissions peak by 2030, and achieving carbon neutralization by 2060”. In order to ensure that relevant departments can actively implement the carbon peaking and carbon neutrality goals, in April 2023, the National Standardization Administration and 10 other departments jointly issued the “Carbon Peak Carbon neutral Standard System Construction Guide” to establish “how to calculate and how to be accurate” regarding carbon emissions data, “how to reduce and how to neutralize” carbon emissions and how to quantify and trade carbon emissions. This guide provides coordinated, comprehensive standards that provide support for achieving the goals in key industries and areas [6]. Establishing how to efficiently realize the dual objectives of “excellent environment” and “stable growth” is taking central stage. In 2021, at the 28th informal meeting of APEC leaders, President Xi once again stressed that China would “actively respond to climate change, adhere to the harmonious coexistence between human and nature, and strive to build a community of life on earth”.
Finance plays a critical function in resource allocation, monetary circulation and macro-control. As the core department of modern economic operation, the financial industry is an important backing for the government to carry out environmental governance [7]. However, Boutabba [8] admitted that traditional financial services have many shortcomings, such as insufficient development, imperfect transmission mechanism and low efficiency. In addition, traditional finance often focuses on economic effects and lacks attention to ecological benefits. Consequently, it is unable to offer a hospitable market environment for green and low-carbon development. Differing from traditional finance, green finance is a special financing tool which combines market regulation and environmental interests, supplying green capital for social production [9]. Specifically, under the condition that the overall credit scale of the society is certain, green finance optimizes the allocation of financial resources among various industries through differential financial measures, meaning that limited financial resources can be invested in efficient and sustainable green industries and the overall carbon emissions can be reduced [10]. For example, firms willing to transform their polluting technologies into environmentally friendly technologies will gain access to cheaper borrowing (financed through green bonds), and as the firms adopt non-polluting devices, they are classified as lower risk. Consequently, the cost of equity is reduced thanks to lower risk arising from a decrease in environmental risk, which is considered a systematic risk. The combination of a lower cost of debt and a lower cost of equity decreases the cost of capital, which in turn leads to a general increase in the value of the firm. During this transitory period, firms tend to experience higher short-term cost, which is outweighed by the long-term increase in their share value. It is assumed that polluting firms that do not alter their methods of production will experience a higher cost of capital and will face a drastic decline in their share price in the long run. Several studies showed that green finance contributes to saving resources [11], pollution emission reduction [12] and green total factor productivity [13]. In 2016, the People’s Bank of China and seven ministries and commissions issued “the Guiding Opinions on Building a Green Financial System”, which defined green finance as taking environmental protection as a policy premise [14]. In the 19th Party Congress, it was explicitly emphasized that green finance is a key measure to deal with the imbalance between “steady growth” and “less pollution”, so as to elevate green finance to a strategic height [15]. Green finance started relatively late, but in recent years, with the constant emergence of its product types, it has formed a strong support for environmentally inclusive growth [16]. Prior to the UN Climate Change Conference of the Parties (COP26) in Glasgow in 2021, government initiatives were used to control emissions, but following COP26, governments have been asking the private sector to join forces to realize the net zero target. In other words, low-carbon economic growth needs the support of green finance. For the market-oriented economic system, the growth of green finance can guide financial resources to flow into new energy industries, increasing investment in green technology and enhancing fossil energy utilization efficiency, which contributes to accelerating the ecological civilization’s construction [17].
Energy resources are a key engine of economic operation, but energy consumption is responsible for 68% of greenhouse gas emissions. As shown in Figure 1, from 2005 to 2021, China’s total energy consumption increased by 102% from 2.61 billion tons to 5.26 billion tons of standard coal, and at the same time, carbon emissions doubled in a similar trend. There is no doubt that excessive energy consumption and carbon emissions caused by economic development not only threaten human survival and development, but also bring serious risks to the environmentally inclusive growth of economic society [18]. Recognizing the grim situation regarding the environment and energy, the central government made the reduction in energy intensity a binding target in the 11th Five-Year Plan for the first time. In addition, resource conservation has been incorporated into the basic state policy, and an energy development strategy giving top priority to both conservation and development has been implemented [19]. These moves have paid off; from 2001 to 2021, the share of natural gas and non-fossil energy in China’s total energy consumption increased by nearly 300% and 100%, respectively, while the share of coal and oil consumption fell 17.6% and 11.8%, respectively, which means that China’s energy consumption structure has gradually improved [20]. Additionally, China’s energy intensity continues to decline [21]. However, there are still some problems that need continuous improvement, such as the fact that China’s energy consumption structure is still dominated by coal, and there is still a large gap between China’s energy intensity and that of developed countries. Improving energy intensity and energy consumption structure not only contributes to carbon emission reduction but can also play a role in the process of financial development inhibiting carbon emissions [22].
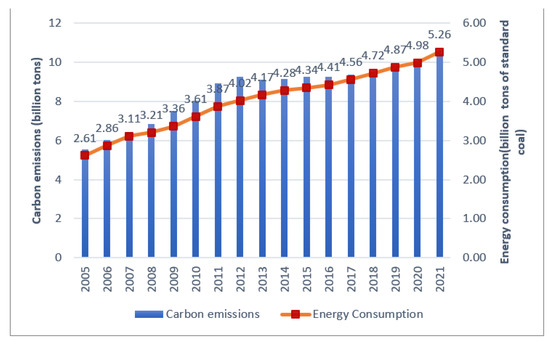
Figure 1.
Changes in China’s total carbon emissions and energy consumption from 2005 to 2021.
Against the background of realizing environmentally inclusive growth, exploring the linkage between green finance and carbon emissions has profound implications in theory and practice. Does green finance reduce carbon emissions? If so, what is the internal mechanism by which it influences carbon emissions? Furthermore, does the mechanism differ in various regions with different energy endowments in China? Additionally, more importantly, considering that 70% of carbon emissions are generated by the use of fossil energy, do energy intensity and energy consumption structure influence the carbon emission reduction effect of green finance? Solving the above problems has far-reaching practical significance, which will not only help to provide suggestions for the implementation of green financial policy, but also contribute to realizing low-carbon transformation in China. More importantly, China is regarded as a main driver for the demand for fossil fuel in the world, and any mechanism that reduces reliance on fossil fuels will help the future of our planet.
This study deeply investigates the linkage between green finance and carbon emissions through the STIRPAT model, the chain multiple mediation effect model and the panel threshold model, using provincial data from 2005 to 2019 in China. The contributions are as follows. First, a green finance index system is established, covering green credit, green securities, green insurance and green investment, which conquers the insufficiency of using a single index observed in previous studies. Second, this study systematically interprets the theoretical mechanism of green finance on carbon emissions through three intermediary paths: (1) green technological innovation, (2) ecological evolution of the industrial structure and (3) green technological innovation facilitating the ecological evolution of the industrial structure. Then, this paper applies the chain multiple mediation effect model to empirically examine the action path of green finance affecting carbon emissions at the national and regional levels. Third, from the energy consumption optimization perspective, this paper applies the panel threshold model to prove the nonlinear relationship between green finance and carbon emissions. Thus, this paper enriches the relevant research on low-carbon economies, providing evidence and experiences for promoting the environmentally inclusive growth of China and other countries.
The remainder of this paper is set out as follows. Section 2 presents a literature review. Section 3 provides the theoretical analysis framework according to which green finance affects carbon emissions. Section 4 briefly introduces the empirical methods, variables and data used in this paper. Section 5 provides the empirical results and discussions. Finally, Section 6 draws the main conclusions and corresponding policy implications.
2. Literature Review
In recent years, global warming resulting from excessive carbon emissions has come to seriously threaten the human living environment, as well as social and economic development [23]. Establishing how to effectively reduce carbon emissions has become a major target for humankind at present and in the future, becoming the focus of current domestic and international attention.
Early scholars were keen to examine the impact of economic growth on carbon emissions, empirically testing the Environmental Kuznets Curve (EKC), but the conclusions are different in various countries [24,25,26]. Shahbaz et al. [27] found that Malaysia’s carbon emissions mainly come from energy consumption, and tapping new resources and improving fuel efficiency is a useful way of achieving this. In addition, Obas et al. [28] explored the characteristics of China’s carbon emissions in the light of spatial econometric methods, and revealed that energy structure, technological progress and urbanization are critical factors affecting carbon emissions. Wang et al. [29] and Zhu et al. [30] pointed out that industrial economic activities produce a large amount of carbon dioxide, and it is necessary to adjust industrial structure and develop green industry.
Finance occupies a core position in modern society and plays an increasingly significant role in the economy. Supported by public international law, some countries are deepening bilateral and multilateral fintech cooperation to promote trade, investment and ecosystem development in the fintech market sector [31]. More and more scholars have been taking financial factors into consideration, and explore whether financial development can help to achieve carbon emission reduction. However, the academic community has not reached a consensus on this issue. Claessens et al. [32] believed that financial development can reduce transaction costs and information costs, and that it helps to increase investment in environmentally friendly projects, thereby improving the environment. Tamazian et al. [33] took the total value of the stock market and total deposits and loans as financial development level indicators, and confirmed that financial development contributes to reducing pollution emissions. Contrary to the above research conclusions, Boutabba [8] conducted an empirical study on India, which confirmed that financial development leads to an increase in the use of fossil fuel and exacerbates ecological degradation. Similar conclusions were reached by Hye et al. [34], Bayar et al. [35] and Ali et al. [36]. Additionally, Yan et al. [37] confirmed that there is an inverted U-shaped relationship between financial development and carbon emissions.
As a new method of environmental governance, green finance can decrease the operational risk of the financial industry, maintain stable growth of the industry and coordinate the ecological environment and economic growth [38]. Most scholars confirmed that green finance has a restraining influence on ecological pollution [39,40,41]. Pyka et al. [42] showed that in Poland, the availability of greening credit reversed the dominance of ecologically harmful projects, instead increasing investment in projects in the field of modern environmentally friendly energy. Chen et al. [43] believed that green finance can promote the concept of green consumption, build a green investor network and encourage investors to invest more in green projects. In addition, Su et al. [44] quantitatively analyzed the policy effect of the “Green Credit Guidelines” issued in 2012. They discovered that after 2012, the debt financing and new investment of heavily polluting enterprises markedly decreased, indicating that green finance can force polluting enterprises to undergo green transformation. Ringe et al. [45] argued that green financial products play a key role in attracting private capital, which in turn attracts private capital to clean energy projects. Li et al. [46] conducted least square estimation and the Granger causality test in 129 countries from 1980 to 2011, and discovered that both in the short term and the long term, green finance will restrain increases in carbon emissions.
There are many scholars devoted to studying the relationship between energy consumption and carbon emissions. According to the research of Acaravci et al. [47], energy consumption and carbon dioxide emissions maintain a positive correlation in the long run. Ajmi et al. [48] discovered that there is a unidirectional causality running from energy consumption to carbon emissions for France, but a bidirectional causality for the U.S. In addition to total energy consumption, the structure of energy consumption also affects carbon dioxide emissions. The main source of carbon emissions is fossil fuel consumption, of which coal accounts for 82% [49]. Adams et al. [50] showed that the use of clean energy emits less carbon dioxide, and so increasing the proportion of clean energy can reduce carbon dioxide emissions on the basis of ensuring energy supply. In addition, Zhou et al. [22] found that when the energy consumption structure and energy intensity are below certain thresholds, financial scale can significantly reduce industrial carbon emissions.
In summary, previous studies provide a solid foundation for our study, but there remain some defects to be further improved. For one thing, the existing studies mainly theoretically investigate the carbon emission reduction effect of green finance, but few scholars empirically test the mechanism of green finance affecting carbon emissions. Additionally, academic circles generally acknowledge that both green finance and energy consumption can affect carbon emissions, but fewer scholars have combined above three variables to analyze. Therefore, this paper brings green finance, energy consumption and carbon emissions into a unified framework, deeply discusses the direct, indirect and non-linear impact of green finance on carbon emissions, enriches relevant research on low-carbon economies, and aims to provide a practical and effective path for China to achieve sustainable development.
3. Theoretical Analysis Framework
The essence of the ecological evolution of a real economy is to alter the original production mode, which involves a great amount of investment. The continuous supply of financial resources is the fundamental guarantee for the realization of the environmentally inclusive growth of economy and society [51]. Unfortunately, under the condition of limited financial resources, traditional financial sectors often have a “backward” preference—that is, they choose credit customers based only on the assets and profitability of enterprises, and even tilt financial resources toward some highly polluting sectors, resulting in the financial exclusion of those enterprises with development potential and in the growth period [52]. Green finance emphasizes environmental interests and pursues the dual goals of “steady growth” and “reducing pollution”. Therefore, the stricter the green finance is, the stronger the incentive for backward production capacity and industries to perform environmental investment and pollution control, and the more obvious the competitive advantage of clean industry. In other words, green finance guides enterprises to adjust their production mode and improve green productivity through optimizing capital allocation, risk dispersion and market supervision. Taghizadeh-Hesary et al. [53] pointed out that green finance guides consumers to form the concept of green consumption, improves residents’ awareness of green environmental protection, and encourages consumers to choose green products, thereby promoting the environmentally inclusive growth of a society. Thus, green finance is conductive to realize carbon emission reduction.
Furthermore, this paper analyzes the mechanism by which green finance influences carbon emissions. First, as we all know, green technologies have the characteristics of high risk and uncertain income, which leads to the reluctance of traditional capital suppliers to invest [54]. Green financial products such as carbon neutral bonds, green development fund and green insurance can better measure the risks and benefits of green technological innovation and attract investors with different risk preferences to invest, so as to meet the capital needs of enterprises or projects actively implementing clean technologies. Meanwhile, green finance can reduce the information transaction cost. The establishment of green information systems such as green rating and certification can provide investors with accurate credit, price, cost and other information, meaning that investors can quickly and accurately find green investment projects, and thus enterprises can focus more on the innovation and adoption of clean technologies [55]. Furthermore, the application of green technology will improve energy efficiency, promote the utilization of renewable energy, accelerate the application of carbon reduction technology, and subsequently reduce carbon emissions.
Second, green finance raises the financing costs of pollution industries in order to restrict the expansion of their production scale, and force them to innovate and transform, so as to realize the dual optimization of technology and industry. In the meantime, green finance provides more financial resources for environmental protection industries, which can alleviate financing constraints and encourage the growth of environmental protection industries, and thereby realize carbon emission reduction. Leeuwen et al. [56] pointed out that green finance can restrain the flow of social idle funds into energy-intensive industries, strengthen the credit supply to technology intensive industries, and finally achieve the green transformation of the industrial structure. Additionally, Wang et al. [57] further emphasized that the green credit provided by commercial banks has a demonstrative role, which stimulates other enterprises to carry out green business. Specifically, enterprises that actively innovate and transform will receive more preferential credit funds and a wider range of funding sources. To sum up, the tertiary industry of “low-carbon, high output” has received more financial support, while the traditional secondary industry of “high pollution and low output” has been gradually abandoned by capital. Failure to obtain the funds required for daily operation will inevitably force this type of enterprise to go bankrupt or transform, and ultimately promote the ecological transformation of the industrial structure [58]. In other words, in the process of limiting the development of pollution industries and encouraging the growth of green industries, green finance promotes ecological evolution of the industrial structure, thereby effectively reducing carbon emissions.
Third, many studies showed that green technological progress and industrial structure optimization have a close relationship [59,60]. Bi et al. [61] proposed that the diffusion effect of green technology contributes to the ecological evolution of the industrial structure, thereby reducing carbon emissions. In other words, the rise of emerging industries triggered by green technology breakthroughs has “creative destruction” and is regarded as the source of green growth. Concretely, for one thing, green finance forces enterprises to strengthen their green technological innovation, reallocate production factors, eliminate backward production capacity and reduce ineffective supply, and turn more toward the production of clean products, thereby achieving the ecological evolution of the industry [10]. Additionally, green finance stimulates enterprises to enhance their R&D investment to obtain advanced technologies, decrease the marginal cost of pollution control, and enhance their competitiveness, while eliminating high-pollution and low-efficiency enterprises, meaning that the whole industry will develop in the direction of being “green, safe, and sustainable”. In brief, green finance can inhibit carbon emissions through green technological innovation propelling ecological evolution of the industrial structure.
Additionally, considering the long-term regional disparity in China’s energy intensity and energy structure, the carbon emission reduction effect of green finance may present a nonlinear relationship. Specifically, when the energy intensity and use of fossil energy is relatively high, the regional energy utilization efficiency is low, the substitution elasticity of clean energy for coal energy is small, and the economic development depends more on coal energy [62]. Under such circumstances, it is hard for green finance to exert its carbon emission reduction effect. With the decline in energy intensity and the use of fossil energy, the regional energy utilization efficiency is gradually improving, the economic production mode is gradually changing from energy-dependent to innovation-driven, and the negative external effect of energy consumption on the environment is gradually reducing [63,64]. Under these circumstances, green finance will enhance production efficiency, encourage the growth of the renewable energy industry, and effectively facilitate green and low-carbon development. Therefore, regardless of energy intensity or the energy consumption structure, only when it is lower than a certain value can green finance remarkedly reduce carbon emissions. Furthermore, the theoretical analysis framework of this study is described in Figure 2.
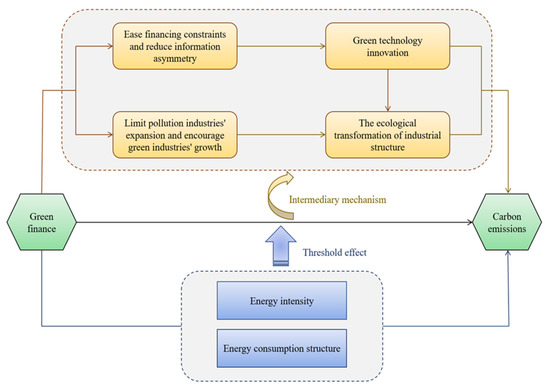
Figure 2.
The theoretical analysis framework of this study.
4. Methodology and Data
4.1. Empirical Model
4.1.1. STIRPAT Model
Ehrlich and Holden [65] put forward the IPAT equation for investigating the impact of human activities on the environment. The basic form is , where I, P, A and T indicate ecological pollution, population, affluence and technology, respectively. Later, Dietz and Rosa [66] redeveloped the IPAT equation and created the STIRPAT model, that is, . Its linear form is: , where a is a constant term; b, c and d are the estimated coefficients of P, A and T; and e is a random disturbance term.
Compared with the IPAT equation, the STIRPAT model has greater flexibility, which allows it to decompose and add other environmental factors. Additionally, according to the study by Gani [67], another appealing feature of the STIRPAT model is that it allows for testing the environmental Kuznets curve (EKC) effect. In view of these features, the STIRPAT model has unique advantages in studying the impact of driving factors on the environment, as it can take into account a variety of comprehensive factors and expand the model according to different measurement indicators to build a more realistic STIRPAT model, which has been widely used in the field of carbon emission research in recent years.
Considering the scope of applicability and advantages of the STIRPAT model, it is suitable for the study in this paper. Based on the characteristics of China’ carbon emissions, this paper extends the STIRPAT model to examine the impact of green finance on carbon emissions. It can be expressed as follows:
where i and t symbolize the province and year, CI is the explained variable, carbon emissions, and GF is the explanatory variable, green finance. Control variables include PGDP, POS, EI, OPEN, FDI, and GOV, which represent economic development, population density, energy intensity, trade openness, foreign direct investment and government intervention, respectively. In addition, is the constant term, to are the estimated coefficients of variables, represents the province-fixed effect, and is a random disturbance term.
4.1.2. Chain Multiple Mediation Effect Model
Mediation models have been widely used to explore the role of mediating variables in the process of independent variables affecting the dependent variable. The mediating variables involved in the chain multiple mediation models show certain sequential characteristics. Because the process of independent variables influencing dependent variables is often complicated in reality, it is difficult for a single mediating variable to fully explain it, and so the multiple mediation models came into being [68].
According to the theoretical analysis in this paper, green finance decreases carbon emissions through three paths: green technological innovation, ecological evolution of the industrial structure, and green technological innovation facilitating ecological evolution of the industrial structure. It can be seen that there is a certain sequence between green technological innovation and the ecological upgrading of the industrial structure. Therefore, this study applies the chain multiple mediation effect model to test the mechanism of green finance affecting carbon emissions in Equations (2)–(4) [69]. Furthermore, the specific path is shown in Figure 3.
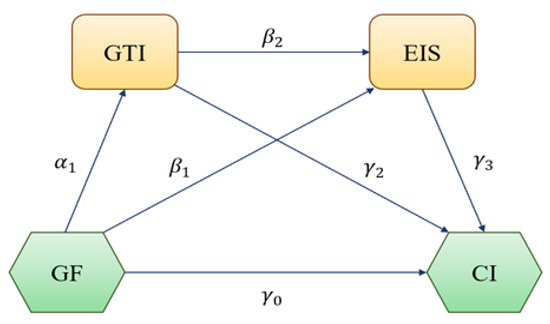
Figure 3.
The path of the chain multiple mediation effect model.
Equations (2)–(4) constitute a multi-equation system, where GTI denotes green technological innovation, EIS stands for the ecological transformation of the industrial structure, and X represents a series of control variables. In addition, , and are the constant terms, while to , to and to are the estimated coefficients of variables.
Equation (2) tests the impact of green finance on green technological innovation. Equation (3) verifies the influence of green technological innovation on the ecological transformation of the industrial structure under the control of green finance. Equation (4) examines the effect of the ecological transformation of the industrial structure on carbon emissions under the control of green finance and green technological innovation. In the chain multiple mediation effect model, mediating channels include two separate mediating channels and one chain-mediating channel.
4.1.3. Panel Threshold Model
The panel threshold model can incorporate a certain threshold as an unknown variable into the regression model and construct a piecewise function, so as to empirically test and estimate the corresponding threshold and its impact [70]. Considering the long-term regional disparity in China’s energy intensity and energy consumption structure, the carbon emission reduction effect of green finance may present a nonlinear relationship. For this reason, this study takes the energy intensity and energy consumption structure as threshold variables to estimate the nonlinear effects between green finance and carbon emissions, from the perspective of energy consumption optimization, based on panel threshold model proposed by [71]. The panel threshold model is as follows:
where the energy intensity (EI) and energy consumption structure (ES) are threshold variables, X represents a series of control variables, and ω and τ are threshold values to be estimated. I(∙) is an indicator function.
4.2. Variable Selection
4.2.1. Explained Variable
Carbon emission intensity (CI). This paper selects carbon emissions per unit of GDP to measure the carbon emission level of various provinces. There are no official carbon emission detection data in China, and some global carbon emission databases such as the British Petroleum Corporation (BP) and US Energy Information Agency (EIA) cannot provide sufficient and accurate detailed data on China’s carbon emissions. Thus, according to the method provided by IPCC, this study builds the carbon emission inventory and energy inventory to calculate the provincial carbon emissions in China. For specific estimation, refer to Zhang et al. [72].
4.2.2. Explanatory Variable
Green finance development index (GF). Based on a deep understanding of the implications of green finance as well as the “Guidance on Building a Green Financial System” report released in 2016, this paper constructs a green finance evaluation index system covering four dimensions, namely, green credit, green securities, green insurance and green investment, and applies the entropy weight method to calculate the green finance development index.
Table 1 presents the specific indicator system for green finance. Among them, green credit is estimated using the interest proportion of six high-energy-consuming industries, which is a typical negative indicator. Furthermore, this paper applies the market value ratio of environmental protection industries and market value ratio of high-energy-consuming industries to reflect the development of green securities [73]. In terms of the green insurance index, China began to implement environmental liability insurance in 2013, lacking relevant statistical material, and agriculture is the industry most affected by the natural environment. Consequently, this paper uses the agricultural insurance scale and loss ratio to approximately reflect the development of green insurance, following Sun et al. [74]. Moreover, as the government is a major investor in environmental protection in China, the energy saving and environmental protection expenditure ratio as well as the investment ratio for pollution control are suitable indexes for green investment [75].

Table 1.
Green finance evaluation index system.
4.2.3. Other Variables
The mediating variables. (1) Green technological innovation (GTI). This paper applies the sum of green patent applications in various provinces to represent green technological innovation. Compared with technological input or technological performance, green patent applications can be accurately classified according to IPC information, so as to deeply understand the specific technology field of innovation activities and the connotation and contribution of technology value. (2) Ecological evolution of the industrial structure (EIS). This paper employs the ratio of the added value of environmental protection industry to that of pollution industry to measure ecological evolution of the industrial structure, referring to Gao et al. [76].
The threshold variables. (1) Energy intensity (EI). Energy intensity refers to the amount of energy consumed per unit of GDP. Energy intensity represents the comprehensive utilization efficiency of energy and reflects the economic benefits of energy utilization. (2) Energy consumption structure (ES). As we all know, coal consumption is the most important factor causing excessive carbon emissions. Given the current reliance on coal in China, this paper applies the proportion of coal consumption in energy consumption to measure the energy consumption structure.
In addition, to control other factors affecting carbon emissions, this study adopts five control variables. (1) Economic development level (PGDP). The per-capita GDP is an appropriate variable for estimating the economic development level. (2) Population density (POS). The permanent resident population per km2 is used to measure the population density. (3) Trade openness (OPEN). Trade openness is represented by the total export and import volumes. (4) Foreign direct investment (FDI). The actual use of foreign direct investment. (5) Government intervention (GOV). Government intervention is expressed by the total government spending.
Table 2 suggests descriptive statistics of variables. As can be seen, carbon emission intensity is relatively serious, and the variance is large, revealing that there exists a great disparity in the carbon emissions of various regions in China. In terms of green finance, in the sample period, the average value is 0.270, demonstrating that China’s green finance still has plenty of room for growth. Regarding green technological innovation, the gap between provinces is huge, and the variance is 1.668, suggesting that the level of green technology is uneven among provinces. For the control variables, there are obvious differences in specific variables among provinces. Among them, the gap between provinces in population density is the largest, and the gap between provinces in foreign direct investment is the smallest.
Table 2.
Descriptive statistics of variables.
4.3. Data
Considering the availability of data, this paper employs 30 province panel datasets from 2005 to 2019 in China (Tibet, Hong Kong, Macao and Taiwan are not included). All data were obtained from the China Statistical Yearbook, provincial statistical yearbooks and wind database, and missing data were filled in by means of interpolation. Stata17.0 was used for all empirical analysis.
5. Empirical Results and Analysis
5.1. Benchmark Regression Results
This section uses the STIRPAT model to conduct empirical research, using the provincial data from China from 2005 to 2019. According to the Hausman test (p < 0.05), the fixed effects model (FE) is the most appropriate estimation method. To enhance the reliability of regression results, this paper also lists the results of the random effects model (RE). From columns (1) to (2) of Table 3, under the control of other variables, the coefficients of green finance are −0.394 and −0.338, respectively, in both estimators (FE and RE), indicating that green finance remarkably reduces carbon emissions. The basic reason for this is that green finance boosts the progress of green technology, thus improving energy utilization efficiency, restricting the expansion of high-pollution industries and supporting the growth of green industries, thereby providing powerful support for the realization of the “dual carbon” goal.
Table 3.
The results of benchmark regression and robustness test.
Simultaneously, based on the test results of fixed effects, the coefficients of lnPGDP and its quadratic term are not significant, showing that at the provincial level in China, the linkage between economic growth and carbon emissions does not conform to the EKC hypothesis, which is similar to [77]. Population density has a remarkable positive influence on carbon emissions (1.385). The greater the population, the more energy will be consumed in industrial production and daily activities. Meanwhile, the rapid growth of the population will influence and even destroy the ecological environment, which will weaken the absorption of carbon emissions by ecosystems, leading to carbon dioxide increases. Moreover, the coefficient of energy intensity is significantly positive (2.904). This means that the decline in energy intensity is conducive to lower carbon emissions. Furthermore, the coefficient of trade openness is markedly positive (0.460). That is because opening up will lead to the exportation of more energy-intensive products, increasing carbon emissions. The influx of foreign capital promotes technological progress, but it also supports the development of high-pollution enterprises. Thus, the coefficient of FDI is not significant owing to these effects offsetting each other. In addition, the coefficient of government intervention is markedly positive (2.188). That is because excessive government intervention will lead to the loss of market efficiency and the distortion of resource allocation, which is unfavorable for carbon emission reduction.
In addition, this paper also adopted three methods for the robustness test: (1) replacing the estimation method. System GMM is a well-known generalized method of estimating moments which takes the lagged dependent variable and past values of other potentially endogenous variables in the regression as instruments, because there may be a reverse causality between carbon emissions and the development of green finance, causing the endogeneity problem. This paper introduces the first-year lag of carbon emissions, establishes a dynamic panel model and applies system GMM estimation to overcome the endogenous problem to a certain extent. (2) Changing sample size. Considering that municipalities, directly under the control of the central government, often receive more economic resources and preferential policies, this paper excludes Beijing, Shanghai, Tianjin and Chongqing from the total sample to ensure the universality of the research conclusions. (3) Tailing processing. To further to prevent the impact of extreme values on the regression results, the data of the explained variable and main explanatory variables are processed with 1% and 99% bidirectional tailing. The robustness test results are in columns (3)–(5) of Table 3; as we can see, the coefficient signs and significance levels of explanatory variables remain basically unchanged. Hence, the conclusion that green finance has a carbon emission reduction effect is reliable.
5.2. Heterogeneity Analysis
Since entering the new economic normal, the economic imbalance between the north and the south of China has become increasingly prominent, presenting a new pattern of economic aggregation rising in the south and falling in the north, and economic growth being faster in the South and slower in the north. In addition, central heating in the north consumes a lot of coal resources, and although China has issued the “Guidance on promoting clean heating in cities and towns in the Northern Heating Region” to address this problem [78], central heating still provides challenges to carbon emission reduction in the northern region. Therefore, taking the Qinling Mountains–Huaihe River as the boundary, this paper divides 30 provinces into the northern and southern regions, and then carries out regression estimation for the two subsamples. From Table 4, as we can see, the coefficient of green finance in northern regions is significant (−0.703), while its coefficient in southern regions is not significant. This result reveals that green finance remarkably inhibits carbon emissions in northern regions, but fails to reduce carbon emissions in southern regions.
Table 4.
The results of the heterogeneity test.
Moreover, this paper divides 30 provinces into two sub-samples, and then carries out regression estimation for the two subsamples. From Table 4, as we can see, the coefficient of green finance in high-carbon-emission regions is −0.743, which is significant at 1%, while its coefficient in low-carbon-emission regions is not significant, revealing that green finance remarkedly inhibits the increase in carbon emissions in high-carbon-emission regions, but fails to reduce carbon emissions in low-carbon-emission regions. These regions may strengthen the enforcement of green finance policies and impose stricter control on the financing and investment activities of polluting enterprises, so that the inhibition of green finance on carbon emissions is more prominent.
In addition, considering the different energy endowments of China’s provinces, there may be prominent differences in the economic development pattern. Based on the China coal industry yearbook, this paper selects 15 provinces as energy-rich regions and the rest as energy-poor regions, and then makes regression estimates for the two sub samples. From Table 4, as we can see, in energy-rich regions and energy-poor regions, the coefficients of green finance are significant (−0.696 and −0.266). This result reveals that the inhibitory effect of green finance on carbon emissions in energy-rich regions is more obvious than that in energy-poor regions—that is, the marginal green effect of green finance in energy-rich regions is higher.
5.3. Mechanism Analysis
The benchmark regression results suggest that green finance remarkably inhibits carbon emissions. Next, this paper adopts the chain multiple mediation effect model to investigate whether green finance can inhibit carbon emissions through three paths: (1) green technological innovation, (2) ecological evolution of the industrial structure, and (3) green technological innovation facilitating ecological evolution of the industrial structure.
Table 5 shows the regression results of the chain multiple mediation model at the national level. Concretely, in column (1), taking green technological innovation (GTI) as the explained variable, the coefficient of green finance is significant (1.215), suggesting that green finance can meet the capital needs of enterprises or projects actively carrying out clean technologies. Then, in column (2), taking ecological evolution of the industrial structure (EIS) as the explained variable, the coefficients of green finance and green technological innovation are significant (0.013 and 0.005), showing that the improvement of green finance and innovation ability can accelerate the transition of enterprises in traditional industries to the upstream of the industrial chain and improve the allocation of factors between traditional industries and emerging industries, promoting ecological evolution of the industrial structure. Furthermore, in column (3), taking carbon emissions (CI) as the explained variable, the coefficients of green technological innovation and ecological evolution of the industrial structure are significant (−0.348 and −18.790), but the coefficient of green finance is not significant, revealing that green technologies such as biological carbon reduction technology, in addition to ecological evolution of the industrial structure, can inhibit carbon emissions, while green finance cannot directly inhibit carbon emissions.
Table 5.
The results of the chain multiple mediation effect model at the national level.
Next, this paper uses the bootstrap test to determine whether intermediary channels exist, as shown in Table 6. At the national level, both green technological innovation and ecological evolution of the industrial structure play separate mediating roles, and the intermediary effect values are −0.415 and −0.246, respectively. Meanwhile, green technological innovation facilitating ecological evolution of the industrial structure plays a chain-mediating role, and the intermediary effect value is −0.117. Furthermore, the total intermediary effect is −0.77. The above results reveal that at the national level, green finance can reduce carbon emissions not only through separate mediating channels of green technological innovation and ecological evolution of the industrial structure, but also through the chain-mediating channel of green technological innovation facilitating ecological evolution of the industrial structure. In particular, green technological innovation is the most prominent way of realizing environmentally inclusive growth in China.
Table 6.
The result for the bootstrap test at the national level.
Furthermore, this paper investigates whether the mechanism of green finance affecting carbon emissions is diverse in various regions with different energy endowments. Table 7 and Table 8 present the regression results and bootstrap test results of the chain multiple mediation effect model, respectively. As we can see, in energy-rich regions, green technological innovation and ecological evolution of the industrial structure play separate mediating roles, and the intermediary effect values are −0.754 and −0.511, respectively. Meanwhile, green technological innovation facilitating ecological evolution of the industrial structure plays a chain-mediating role, and the intermediary effect value is −0.184. Furthermore, the total intermediary effect is −1.449. Thus, in energy-rich regions, green finance can break the resource curse and reduce carbon emissions not only through separate mediating channels of green technological innovation and ecological evolution of the industrial structure, but also through the chain-mediating channel of green technological innovation facilitating ecological evolution of the industrial structure. In particular, green technological innovation is the most effective way of realizing green transformation in energy-rich regions.
Table 7.
The results of the chain multiple mediation effect model at the regional level.
Table 8.
The results for the bootstrap test at the regional level.
5.4. Threshold Effect Analysis
This paper uses energy intensity (EI) and energy consumption structure (ES) as threshold variables, and the panel threshold model is constructed to prove the nonlinear relationship between green finance and carbon emissions. Before estimating the panel threshold model, it is necessary to verify whether there is a threshold effect, so we use the bootstrap method to test whether the threshold effect exists and, if so, to establish the number of thresholds. Table 9 shows the results of threshold effect self-help sampling and the threshold estimation test.
Table 9.
The results of threshold effect self-help sampling and the threshold estimation test.
In Figure 4 and Figure 5, the horizontal axis represents the threshold value, the vertical axis represents the likelihood ratio statistic, the red dotted line represents the 95% significance reference line, the intersection of the curve and the horizontal line (LR = 0) represents the threshold estimate, and the interval formed by the intersection with the red dotted line is the 95% confidence interval corresponding to the threshold value. Table 10 shows the threshold regression estimation results when energy intensity and energy consumption structure are used as threshold variables, respectively. It can be seen that both energy intensity and energy consumption structure have threshold effects in the relationship between green finance and carbon emissions. As shown in column (1) of Table 10, when the energy intensity is lower than the threshold estimation value (EI ≤ 2.1786), the coefficient of green finance is −1.022, with a significance level of 1%, which means that when energy intensity is at a low level, green finance will significantly inhibit the increase in carbon emissions. However, when the energy intensity is higher than the threshold estimation value (EI > 2.1786), the coefficient of green finance is 2.947, which is not significant, indicating that the energy consumed per unit of GDP is higher than 2.1786, and green finance cannot reduce carbon emissions. The results indicate that only when energy intensity is lower than the threshold value can green finance significantly inhibit carbon emissions. The fluctuation trend of China’s energy consumption is generally on the rise, while the energy intensity continues to decline, as shown in Figure 6. Apart from 2005, the energy intensity has always been lower than the threshold value of 2.1786, indicating that the development of green finance in China can effectively achieve carbon emission reduction. Thus, the further reduction in energy intensity in order to enhance the energy utilization efficiency is necessary to realize carbon emission reduction.
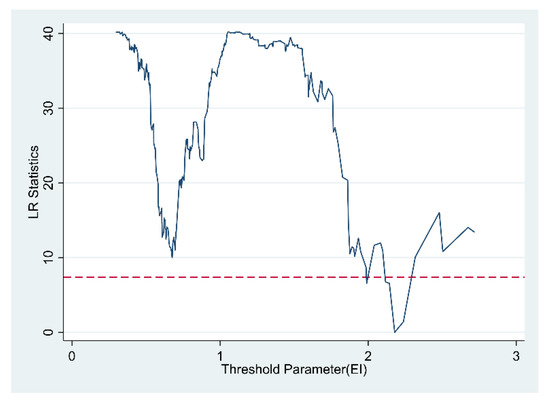
Figure 4.
Likelihood ratio statistics for energy intensity as a threshold variable.
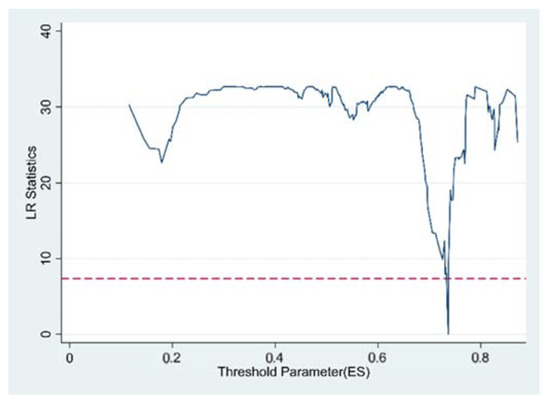
Figure 5.
Likelihood ratio statistics for energy consumption structure as a threshold variable.
Table 10.
The results of panel threshold model.
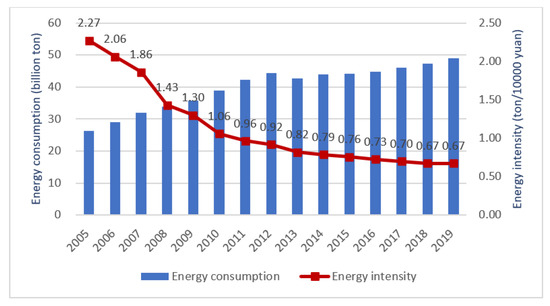
Figure 6.
Evolution trend of energy consumption and energy intensity from 2005 to 2019.
Table 10 presents the threshold regression estimation results. As seen in column (1) of Table 10, when EI ≤ 2.179, the coefficient of green finance is significant (−1.022), indicating that when energy intensity is at a low level, green finance will remarkedly inhibit carbon emissions. However, when EI > 2.179, the coefficient of green finance is not significant, showing that when energy intensity is higher than 2.179, green finance cannot reduce carbon emissions. In other words, only when energy intensity is lower than the threshold value can green finance significantly inhibit carbon emissions. The fluctuation trend of energy consumption is generally on the rise, while energy intensity continues to decline, as shown in Figure 6. Apart from 2005, the energy intensity has always been lower than the threshold value of 2.179, showing that green finance in China effectively achieves carbon emission reduction. To sum up, further reduction in energy intensity in order to enhance energy utilization efficiency is necessary to decrease carbon emissions.
As seen in column (2) of Table 10, when the energy consumption structure is lower than the threshold estimation value (ES ≤ 0.7371), the coefficient of green finance is −0.378, which is significant at 5%, indicating that when coal consumption is at a low level, green finance will significantly inhibit the increase in carbon emissions. However, when the energy consumption structure is higher than the threshold estimation value (ES > 0.7371), the coefficient of green finance changes from −0.378 to 1.061, which is significant at 1%, indicating that when the proportion of coal consumption to the total energy consumption is higher than 0.7371, green finance will increase carbon emissions instead. The results indicate that only when the energy consumption structure is lower than the threshold value can green finance significantly inhibit carbon emissions. The evolution trend of China’s coal consumption is roughly on the rise, while the proportion of coal consumption in energy consumption is declining, as shown in Figure 7, indicating that China’s energy consumption structure is constantly optimized. Since 2007, the energy consumption structure has always been lower than the threshold value of 0.7371, indicating that the development of green finance in China can significantly reduce carbon emissions. Thus, further reducing the proportion of coal consumption to total energy consumption in order to improve the energy consumption structure is conducive to inhibiting carbon emissions.
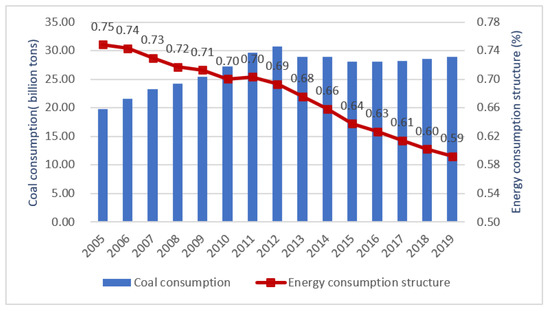
Figure 7.
Evolution trend of coal consumption and energy consumption structure from 2005 to 2019.
6. Conclusions and Policy Implications
From the perspective of energy consumption optimization, this paper utilizes the STIRPAT model, chain multiple mediation effect model and panel threshold model to empirically analyze the impact of green finance on carbon emissions, using the provincial level panel data from China from 2005 to 2019. The empirical results are as follows: (1) green finance significantly reduces carbon emissions. After accounting for potential endogeneity, this conclusion is still valid. The heterogeneity test reveals that the inhibitory effect of green finance on carbon emissions in northern regions, high-carbon-emission regions and energy-rich regions is more significant. (2) The results of the bootstrap test show that at the national level, green finance can decrease carbon emissions through three paths: green technological innovation, the ecological transformation of the industrial structure, and green technological innovation facilitating the ecological transformation of the industrial structure. Furthermore, the intermediary mechanism of green finance affecting carbon emissions differs in various regions with different energy endowments. In energy-rich regions, green finance significantly inhibits carbon emissions through all three paths, while in energy-poor regions, green finance reduces carbon emissions through one path, that is, green technological innovation. (3) There is a nonlinear relationship between green finance and carbon emissions. Specifically, regardless of energy intensity or energy consumption structure, only when it is below the threshold can green finance significantly inhibit carbon emissions. Thus, realizing energy consumption optimization, that is, enhancing energy utilization efficiency and improving energy consumption structure, is an effective way to give full play to the carbon emission reduction effect of green finance.
Based on the results and conclusions, several policy implications are drawn up and summarized as follows. Firstly, it is important to strengthen the development of green finance in accordance with the “Guiding Opinions on Building a Green Financial System” [14] and give full play to its positive role in the process of low-carbon economic transformation. China should continue to build and improve a green financial system, continuously improve the development of green finance, and increase its effectiveness in green capital supply and resource allocation. Meanwhile, the financial supervision department needs to further strengthen legal supervision of the green financial system, increase the punishment for using green capital in the field of pollution, and eliminate the abuse of green capital by enterprises at the root, so that green capital can be reasonably and effectively used in practice. In addition, considering the heterogeneity impact of green finance on carbon emissions, green finance development policies should be created rationally according to the characteristics of the local industrial structure and the advantages of energy endowment.
Secondly, more attention must be given to the intermediary role of green technological innovation and ecological evolution of the industrial structure in order to decrease carbon emissions. For example, the government must provide incentives to financial institutions to increase financial support for clean technology, accelerate the application and promotion of clean technology, and alleviate financing constraints of green technologies. It is also critical for financial resources to be rechanneled toward green low-carbon industries, particularly to encourage and support the development of cleaning enterprises, so as to accelerate the ecological evolution of the industrial structure. During the transitory period where firms are seeking alternative modes of production to achieve the net zero target, the government must turn green technological innovation into a priority area. The government must support the ecological evolution of the industrial structure through stimulating green technological innovation, promoting the realization of the environmentally inclusive growth of the economy and society. Furthermore, the government must work alongside with the private sector to adopt differentiated green development policies based on the local energy endowment. More specifically, the government must (1) encourage reinvestment in non-fossil fuel energy product development for energy-rich regions and (2) promote the usage of low-emission products, clean technologies, and the new energy industry and cultivate new advantageous industries for energy-poor provinces.
Thirdly, it is imperative to take steps to improve energy efficiency and the energy structure to realize energy consumption optimization, so as to reduce carbon emissions. Given the current reliance on coal, China must urgently find technological innovations that will reduce emissions of the generation and utilization of coal resources. Next, China must explore other large-scale clean energy methods of production such as nuclear power, thereby achieving the stable supply of clean energy.
One limitation of our research that is worth pointing out is that we cover 30 provinces in China, implying that our study lacks microcosmic elements. In order to achieve the net zero target by 2060, China requires the participation of microenterprises (including scientific and technological enterprises and green enterprises), and our study does not address this element. In addition, we do not consider the support of laws and regulations for green finance and draw knowledge from the research of scholars from different countries in a balanced manner. In the future, we will fully consider the role of laws and regulations and make balanced reference to valuable scientific works in the global database. Then, based on our existing research, we will explore a new research perspective, search for a new research direction and further improve our paper.
Author Contributions
Conceptualization, W.X.; Data curation, X.F.; Formal analysis, X.F.; Funding acquisition, W.X.; Investigation, X.F.; Methodology, W.X.; Software, Y.Z.; Supervision, W.X.; Validation, Y.Z.; Writing—original draft, X.F.; Writing—review and editing, W.X.; Writing—review and editing, Y.Z. All authors have read and agreed to the published version of the manuscript.
Funding
This research was funded by the National Social Science Foundation of China (18CJY008) and Philosophy and Social Science Planning Fund of Qingdao (QDSKL2101029).
Data Availability Statement
Relevant data for other variables were mainly obtained from the China Statistical Yearbook, China Energy Statistical Yearbook, and China Environmental Statistical Yearbook.
Conflicts of Interest
The authors declare no conflict of interest.
References
- Zhao, B.; Sun, L.; Qin, L. Optimization of China’s provincial carbon emission transfer structure under the dual constraints of economic development and emission reduction goals. Environ. Sci. Pollut. Res. 2022, 29, 21692–21704. [Google Scholar] [CrossRef] [PubMed]
- Apergis, N.; Payne, J.E. Energy consumption and economic growth in central America: Evidence from a panel cointegration and error correction model. Energy Econ. 2009, 31, 211–216. [Google Scholar] [CrossRef]
- Wang, S.; Li, Q.; Fang, C.; Zhou, C. The relationship between economic growth, energy consumption, and CO2 emissions: Empirical evidence from China. Sci. Total Environ. 2016, 542, 360–371. [Google Scholar] [CrossRef] [PubMed]
- Shafiei, S.; Salim, R.A. Non-renewable and renewable energy consumption and CO2 emissions in OECD countries: A comparative analysis. Energy Policy 2014, 66, 547–556. [Google Scholar] [CrossRef]
- Jia, Z.; Lin, B. How to achieve the first step of the carbon-neutrality 2060 target in China: The coal substitution perspective. Energy 2021, 233, 121179. [Google Scholar] [CrossRef]
- Ministry of Ecology and Environment of the People’s Republic of China. Carbon Peak Carbon neutral Standard System Construction Guide. Available online: http://www.mee.gov.cn/xxgk2018/xxgk/xxgk10/202304/t20230424_1028080.html/ (accessed on 25 June 2023).
- Li, L.; Dong, B. Research on the development level and influencing factors of regional carbon finance. Econ. Manag. 2018, 32, 60–65. [Google Scholar]
- Boutabba, M.A. The impact of financial development, income, energy and trade on carbon emissions: Evidence from the Indian economy. Econ. Model. 2014, 40, 33–41. [Google Scholar] [CrossRef]
- He, L.; Zhang, L.; Zhong, Z. Green credit, renewable energy investment and green economy development: Empirical analysis based on 150 listed companies of China. J. Clean. Prod. 2019, 208, 363–372. [Google Scholar] [CrossRef]
- Zeng, Y.; Wang, F.; Wu, J. The Impact of Green Finance on Urban Haze Pollution in China: A Technological Innovation Perspective. Energies 2022, 15, 801. [Google Scholar] [CrossRef]
- Xing, Y. Research on the dynamic relationship between economic growth, energy consumption and credit extension—An empirical analysis of provincial panel based on carbon emission intensity grouping. J. Financ. Res. 2015, 12, 17–31. [Google Scholar]
- Zhang, W.; Hong, M.; Li, J. An examination of green credit promoting carbon dioxide emissions reduction: A provincial panel analysis of China. Sustainability 2021, 13, 7148. [Google Scholar] [CrossRef]
- Lee, C.C.; Lee, C.C. How does green finance affect green total factor productivity? Evidence from China. Energy Econ. 2022, 107, 105863. [Google Scholar] [CrossRef]
- Ministry of Ecology and Environment of the People’s Republic of China. The Guiding Opinions on Building a Green Financial System. Available online: http://www.mee.gov.cn/gkml/hbb/gwy/201611/t20161124_368163.htm/ (accessed on 25 June 2023).
- Ding, J. Green credit policy, credit resource allocation and enterprise strategic response. Econ. Rev. 2019, 4, 62–75. [Google Scholar]
- Gu, B.; Chen, F.; Zhang, K. The policy effect of green finance in promoting industrial transformation and upgrading efficiency in China: Analysis from the perspective of government regulation and public environmental demands. Environ. Sci. Pollut. Res. 2021, 28, 47474–47491. [Google Scholar] [CrossRef]
- Ronaldo, R.; Suryanto, T. Green finance and sustainability development goals in Indonesian Fund Village. Res. Policy 2022, 78, 102839. [Google Scholar] [CrossRef]
- Meng, F.; Su, B.; Thomson, E. Measuring China’s regional energy and carbon emission efficiency with DEA models: A survey. Appl. Energy 2016, 183, 1–21. [Google Scholar] [CrossRef]
- The National People’s Congress of the People’s Republic of China. Energy Conservation Law of the People’s Republic of China. Available online: www.npc.gov.cn/npc/c12435/201811/045c859c5a31443e855f6105fe22852b.shtml/ (accessed on 25 June 2023).
- Xue, Y.; Tang, C.; Wu, H.; Liu, J.; Hao, Y. The emerging driving force of energy consumption in China: Does digital economy development matter? Energy Policy 2022, 165, 112997. [Google Scholar] [CrossRef]
- Zhu, J.; Lin, B. Convergence analysis of city-level energy intensity in China. Energy Policy 2020, 139, 111357. [Google Scholar] [CrossRef]
- Zhou, Y.; Li, N. Panel threshold effect of provincial financial development on industrial carbon emission reduction. Seeker 2016, 292, 104–109. [Google Scholar]
- Wen, L.; Zhang, Y. A study on carbon transfer and carbon emission critical paths in China: I-O analysis with multidimensional analytical framework. Environ. Sci. Pollut. Res. 2020, 27, 9733–9747. [Google Scholar] [CrossRef]
- Narayan, P.K.; Saboori, B.; Soleymani, A. Economic growth and carbon emissions. Econ. Model. 2016, 53, 388–397. [Google Scholar] [CrossRef]
- Martínez, Z.I.; Bengochea, M.A. Pooled mean group estimation of an environmental Kuznets curve for CO2. Econ. Lett. 2004, 82, 121–126. [Google Scholar] [CrossRef]
- Apergis, N.; Payne, J.E. CO2 emissions, energy usage, and output in Central America. Energy Policy 2009, 37, 3282–3286. [Google Scholar] [CrossRef]
- Shahbaz, M.; Solarin, S.A.; Mahmood, H.; Arouri, M. Does financial development reduce CO2 emissions in Malaysian economy? A time series analysis. Econ. Model. 2013, 35, 145–152. [Google Scholar] [CrossRef]
- Obas, J.E.; Anthony, J.I. Decomposition analysis of CO2 emission intensity between oil-producing and non-oil-producing sub-Saharan African countries. Energy Policy 2006, 34, 3599–3611. [Google Scholar]
- Wang, G.; Deng, X.; Wang, J.; Zhang, F.; Liang, S. Carbon emission efficiency in China: A spatial panel data analysis. China Econ. Rev. 2019, 56, 101313. [Google Scholar] [CrossRef]
- Zhu, B.; Zhang, T. The impact of cross-region industrial structure optimization on economy, carbon emissions and energy consumption: A case of the Yangtze River Delta. Sci. Total Environ. 2021, 778, 146089. [Google Scholar] [CrossRef]
- Tache, C.E.P. Public international law and fintech challenges. Perspect. Law Public Adm. 2022, 11, 218–225. [Google Scholar]
- Claessens, S.; Feijen, E. Financial Sector Development and the Millennium Development Goals; World Bank Publications: Washington, DC, USA, 2007. [Google Scholar]
- Tamazian, A.; Raob, B. Do economic, financial and institutional development matter for environmental degradation: Evidence from transition economies. Energy Econ. 2010, 32, 137–145. [Google Scholar] [CrossRef]
- Hye, Q.M.A.; Islam, F. Does financial development hamper economic growth: Empirical evidence from Bangladesh. J. Bus. Econ. Manag. 2013, 14, 558–582. [Google Scholar] [CrossRef]
- Bayar, Y.; Diaconu, L.; Maxim, A. Financial development and CO2 emissions in post-transition European Union countries. Sustainability 2020, 12, 2640. [Google Scholar] [CrossRef]
- Ali, S.; Waqas, H.; Ahmad, N. Analyzing the dynamics of energy consumption, liberalization, financial development, poverty and carbon emissions in Pakistan. J. Appl. Environ. Biol. Sci. 2015, 5, 166–183. [Google Scholar]
- Yan, C.L.; Li, T.; Lan, W. Financial Development, Innovation and Carbon Emission. J. Financ. Res. 2016, 1, 14–30. [Google Scholar]
- Nasreen, S.; Anwar, S.; Ozturk, I. Financial stability, energy consumption and environmental quality: Evidence from South Asian economies. Renew. Sust. Energ. Rev. 2017, 67, 1105–1122. [Google Scholar] [CrossRef]
- Pan, D.Y.; Chan, C.Q.; Grubb, M. Financial Policy and Low-Carbon Transition of the Economy: A Growth Perspective. J. Financ. Res. 2021, 498, 1–19. [Google Scholar]
- Scholtens, B. Finance as a driver of corporate social responsibility. J. Bus. Ethics 2006, 68, 19–33. [Google Scholar] [CrossRef]
- Yang, W.Z.; Yu, J.; Li, K. Financial Resource Allocation, Technological Progress, and Economic High-Quality Development. J. Financ. Res. 2020, 486, 75–94. [Google Scholar]
- Pyka, I.; Nocoń, A. Responsible lending policy of green investments in the energy sector in Poland. Energies 2021, 14, 7298. [Google Scholar] [CrossRef]
- Chen, Y.F.; Ma, Y.B. Does green investment improve energy firm performance? Energy Policy 2021, 153, 112252. [Google Scholar] [CrossRef]
- Su, D.W.; Lian, L.L. Does Green Credit Policy Affect Corporate Financing and Investment? Evidence from Publicly Listed Firms in Pollution-Intensive Industries. J. Financ. Res. 2018, 462, 123–137. [Google Scholar]
- Ringel, M.; Mjekic, S. Analyzing the role of banks in providing green finance for retail customers: The case of Germany. Sustainability 2023, 15, 8745. [Google Scholar] [CrossRef]
- Li, C.; Gan, Y. The spatial spillover effects of green finance on ecological environment—Empirical research based on spatial econometric model. Environ. Sci. Pollut. Res. 2021, 28, 5651–5665. [Google Scholar] [CrossRef] [PubMed]
- Acaravci, A.; Ozturk, I. On the relationship between energy consumption, CO2 emissions and economic growth in Europe. Energy 2010, 35, 5412–5420. [Google Scholar] [CrossRef]
- Ajmi, A.N.; Hammoudeh, S.; Nguyen, D.K.; Sato, J.R. On the relationships between CO2 emissions, energy consumption and income: The importance of time variation. Energy Econ. 2015, 49, 629–638. [Google Scholar] [CrossRef]
- Xu, G.; Schwarz, P.; Yang, H. Adjusting energy consumption structure to achieve China’s CO2 emissions peak. Renew. Sust. Energ. Rev. 2020, 122, 109737. [Google Scholar] [CrossRef]
- Adams, S.; Acheampong, A.O. Reducing carbon emissions: The role of renewable energy and democracy. J. Clean. Prod. 2019, 240, 118245. [Google Scholar] [CrossRef]
- Liu, C.; Xiong, M. Green Finance Reform and Corporate Innovation: Evidence from China. Financ. Res. Lett. 2022, 48, 102993. [Google Scholar] [CrossRef]
- Feng, S.; Zhang, R.; Li, G. Environmental decentralization, digital finance and green technological innovation. Struc. Chang. Econ. Dyn. 2022, 61, 70–83. [Google Scholar] [CrossRef]
- Taghizadeh-Hesary, F.; Yoshino, N. Sustainable Solutions for Green Financing and Investment in Renewable Energy Projects. Energies 2020, 13, 788. [Google Scholar] [CrossRef]
- Huang, S.Z. Do green financing and industrial structure matter for green economic recovery? Fresh empirical insights from Vietnam. Econ. Anal. Policy 2022, 75, 61–73. [Google Scholar] [CrossRef]
- Yin, W.; Kirkulak-Uludag, B.; Zhang, S. Is financial development in China green? Evidence from city level data. J. Clean. Prod. 2019, 211, 247–256. [Google Scholar] [CrossRef]
- Leeuwen, G.V.; Mohnen, P. Revisiting the Porter hypothesis: An empirical analysis of Green innovation for the Netherlands. Econ. Innov. New Technol. 2013, 67, 295–319. [Google Scholar] [CrossRef]
- Wang, X.; Wang, Q. Research on the impact of green finance on the upgrading of China’s regional industrial structure from the perspective of sustainable development. Res. Policy 2021, 74, 102436. [Google Scholar] [CrossRef]
- Taghizadeh-Hesary, F.; Yoshino, N. The way to induce private participation in green finance and investment. Financ. Res. Lett. 2019, 31, 98–103. [Google Scholar] [CrossRef]
- Chen, Y.S.; Lai, S.B.; Wen, C.T. The Influence of Green Innovation Performance on Corporate Advantage in Taiwan. J. Bus. Ethics 2006, 67, 331–339. [Google Scholar] [CrossRef]
- Zhong, Z.; Peng, B. Can environmental regulation promote green innovation in heavily polluting enterprises? Empirical evidence from a quasi-natural experiment in China. Sustain. Prod. Consum. 2022, 30, 815–828. [Google Scholar] [CrossRef]
- Bi, K.X.; Yang, C.J.; Huang, P. Research on the Impact of FDI on the Green Process Innovation of Chinese Manufacturing Industries: An Empirical Analysis Based on the Panel Data. China Soft Sci. 2011, 9, 172–180. [Google Scholar]
- Gan, C.; Voda, M. Can green finance reduce carbon emission intensity? Mechanism and threshold effect. Environ. Sci. Pollut. Res. 2023, 30, 640–653. [Google Scholar] [CrossRef]
- Cheng, Z.; Kai, Z.; Zhu, S.W.J. Does green finance regulation improve renewable energy utilization? Evidence from energy consumption efficiency. Renew. Energy 2023, 208, 63–75. [Google Scholar] [CrossRef]
- Ye, X.; Rasoulinezhad, E. Assessment of impacts of green bonds on renewable energy utilization efficiency. Renew. Energy 2023, 202, 626–633. [Google Scholar] [CrossRef]
- Ehrlich, P.R.; Holdren, J.P. Impact of Population Growth: Complacency concerning this component of man’s predicament is unjustified and counterproductive. Science 1971, 171, 1212–1217. [Google Scholar] [CrossRef] [PubMed]
- Dietz, T.; Rose, E.A. Rethinking the environmental impacts of population, affluence and technology. Hum. Ecol. Rev. 1994, 1, 277–300. [Google Scholar]
- Gani, A. Fossil fuel energy and environmental performance in an extended STIRPAT model. J. Clean Prod. 2021, 297, 126526. [Google Scholar] [CrossRef]
- Wen, Z.L.; Zhang, L.; Hou, J.T. Mediating effect test program and its application. Acta Psychol. Sin. 2004, 5, 614–620. [Google Scholar]
- Yuan, Y.; MacKinnon, D.P. Robust mediation analysis based on median regression. Psychol. Methods 2014, 19, 1–20. [Google Scholar] [CrossRef]
- Wang, Q.; Wang, L. The nonlinear effects of population aging, industrial structure, and urbanization on carbon emissions: A panel threshold regression analysis of 137 countries. J. Clean Prod. 2021, 287, 125381. [Google Scholar] [CrossRef]
- Hansen, B.E. Threshold effects in non-dynamic panels: Estimation, testing, and inference. J. Econom. 1999, 93, 345–368. [Google Scholar] [CrossRef]
- Zhang, F.; Deng, X.; Phillips, F. Impacts of the industrial structure and technical progress on carbon emission intensity: Evidence from 281 cities in China. Tech. Forecast. Soc. Chang. 2020, 154, 119949. [Google Scholar] [CrossRef]
- Ye, T.; Xiang, X.; Ge, X. Research on green finance and green development based eco-efficiency and spatial econometric analysis. Sustainability 2022, 14, 2825. [Google Scholar] [CrossRef]
- Sun, H.; Chen, F. The impact of green finance on China’s regional energy consumption structure based on system GMM. Res. Policy 2022, 76, 102588. [Google Scholar] [CrossRef]
- Xiong, Q.; Sun, D. Influence analysis of green finance development impact on carbon emissions: An exploratory study based on fsQCA. Environ. Sci. Pollut. Res. 2022, 2, 61369–61380. [Google Scholar] [CrossRef]
- Gao, J.J.; Zhang, W.W. Research on the Impact of Green Finance on the Ecologicalization of China’s Industrial Structure-Empirical Test Based on System GMM Model. Econ. Rew. J. 2021, 2, 105–115. [Google Scholar]
- Yilanci, V.; Pata, U.K. Investigating the EKC hypothesis for China: The role of economic complexity on ecological footprint. Environ. Sci. Pollut. Res. 2020, 27, 32683–32694. [Google Scholar] [CrossRef]
- Ministry of Housing and Urban-Rural Developmentof the People’s Republic of China. The Guiding Opinions on Promoting Clean Urban Heating in Northern Heating Areas. Available online: http://www.mohurd.gov.cn/gongkai/zhengce/zhengcefilelib/201709/20170913_233287.html/ (accessed on 4 July 2023).


Disclaimer/Publisher’s Note: The statements, opinions and data contained in all publications are solely those of the individual author(s) and contributor(s) and not of MDPI and/or the editor(s). MDPI and/or the editor(s) disclaim responsibility for any injury to people or property resulting from any ideas, methods, instructions or products referred to in the content. |
© 2023 by the authors. Licensee MDPI, Basel, Switzerland. This article is an open access article distributed under the terms and conditions of the Creative Commons Attribution (CC BY) license (https://creativecommons.org/licenses/by/4.0/).