Article

Performance Evaluation of an Absorber Tube of a Parabolic Trough Collector Fitted with Helical Screw Tape Inserts Using CuO/Industrial-Oil Nanofluid: A Computational Study

1
Department of Mechanical Engineering, College of Engineering, Fasa University, Fasa 74616-86131, Iran
2
School of Mechanical Engineering, Shiraz University, Shiraz 71946-84334, Iran
3
Department of Water Engineering, Faculty of Agriculture, Fasa University, Fasa 74616-86131, Iran
*
Authors to whom correspondence should be addressed.
Sustainability 2023, 15(13), 10637; https://doi.org/10.3390/su151310637
Submission received: 24 May 2023 / Revised: 19 June 2023 / Accepted: 28 June 2023 / Published: 5 July 2023
(This article belongs to the Section Resources and Sustainable Utilization)

Abstract

:
Improvement of the performance of renewable energy harvesters is a crucial and complicated task. Among currently utilized renewable energy harvesters, parabolic solar collectors are some of the most promising and widely used apparatuses. However, researchers are still facing some issues regarding the optimization of PTC performance, including the enhancement of heat flux absorption by the absorber tubes. Among the proposed methods to overcome this drawback, the implementation of helical screw tape (HST) and nanofluids has proven to be most effective. In the present study, the CFD simulation of an absorber tube with HST is conducted. CuO/oil nanofluid with a nanoparticle volume fraction of 1 to 3% was chosen as the working fluid. The simulation is based on the realistic operational condition of a PTC absorber tube with corresponding nonuniform solar heat flux based on the local concentration ratio. The effects of the mass flow rate (Re), HST width and nanofluid volume fraction on pumping power and heat transfer are studied. Moreover, to combine the effect of both parameters, the performance evaluation criterion (PEC), a dimensionless variable, is calculated for all of the studied cases. Enhancement of the PEC parameter by the implementation of nanofluid and HST in comparison to base fluid passing through a plain tube is also determined and reported. According to the obtained results, with the implementation of the CuO/oil nanofluid, the PEC can be enhanced by 57.3–70.8, 68.7~86.4, and 83.4~105.9% for volume fractions of 1, 2, and 3%, respectively.

1. Introduction

Solar energy, as a renewable source of energy, is compatible with the concept of sustainability. The implementation of solar energy can provide a necessary energy source without diminishing its future availability, while avoiding the harmful side effects of other energy sources, especially fossil fuels. Linear parabolic trough solar collectors (PTCs) are one of the most commonly utilized collectors throughout the world. These collectors concentrate the reflected solar irradiation onto absorber components using a parabolic mirror to bring the working fluid to the desired temperature. The selected working fluid is usually oil due to its high conductivity, to improve the heat transfer mechanism [1]. However, the absorbed solar energy distribution around the tube is not uniform, and the heat flux density is usually much higher in the lower absorber side (the part that is in front of the mirror). This nonuniform heat flux leads to high-temperature gradients in fluid and more heat losses on the downward surface, while the fluid passing through the upper half of the absorber tube will exit the collector with insufficient thermal gain [2]. One recent strategy to overcome this drawback is to insert a helical screw tape (HST) into the absorber tube. The HST mixes the working fluid, allowing the colder fluid to reach the high-temperature side of the tube, and vice versa. However, these kinds of obstacles in the flow stream usually reduce the cross-section area, consequently increasing the pressure drop. Generally, more heat transfer and less pressure drop are required to achieve higher efficiency in the absorber tubes [3]. Therefore, closer attention is needed to balance these two inversely related effects. Several researchers have focused on this subject to propose an optimum set of geometrical and operating conditions for absorber tubes.
Yaghoubi et al. [4,5] studied the heat losses from absorber tubes of PTCs for the 250 kW collector field of the Shiraz (Iran) solar power plant. They studied the effect of collector conditions on heat losses, and additionally performed an exergoeconomic analysis of the power plant. Golneshan et al. [6] computationally investigated the unsymmetrical heat flux in the absorber tubes and proposed C-shaped and cylindrical plates to improve heat transfer characteristics. They reported that by using C-shaped plates in collectors, up to 95% heat transfer enhancement is achievable; however, the pressure drop might be increased as much as fourfold. They also investigated the effect of the plate’s position on heat transfer and pressure drop. Eiamsa-ard and Promvonge [7] experimentally investigated the effect of helical screw tape with/without core-rod inserts on heat transfer. Based on their results, by the implementation of HST the heat transfer is enhanced for both cases, while the pressure drop increase was more significant in the presence of a core rod. Their research suggested that higher efficiency could be achieved using helical screw tape without a core rod. Based on the findings of Eiamsa-ard and Promvonge [7], Zhang et al. [8] inserted helical screw tape without a core rod into a pipe in order to enhance heat transfer. They investigated four different helical shapes with different widths. They computationally calculated pressure drop and heat transfer in the pipe and reported their results using the non-dimensional performance evaluation criterion (PEC) parameter.
Another strategy for improving the thermal performance of a working fluid is the addition of conductive nanosized particles to the base fluid [9,10]. Several researchers focus on the beneficial properties of nanofluids, especially in the heat exchanger tubes [11,12]. The effect on thermal performance of the insertion of helical screw tape into a plain circular tube was experimentally measured by Suresh et al. [13] using CuO/water and Al2O3/water nanofluids. Based on the obtained experimental data, the implementation of helical inserts with twist ratios of 1.78, 2.44, and 3 can result in Nu enhancement of 156.2, 122.1, and 89.2%, respectively, for pure water. When CuO nanoparticles (NPs) were added to the base fluid, Nu could be improved to 179.8, 144.2, and 105.6%, respectively, for the abovementioned twist ratios. Moreover, it was demonstrated that for constant pumping power consumption, the CuO/water mixture had higher thermal efficiency than the Al2O3/water nanofluid.
In 2015, Sandesh et al. [14] experimentally evaluated the thermal performance of a heated tube with helical screw tape using Al2O3/water and CNT/water nanofluids. The effect of NP volume fraction as well as the twist ratio of the tape was studied. The heating was assumed to be uniform on the tube surface, and only the transient portion of the tube was studied. According to the results, heat transfer was improved more using CNT/water than when using Al2O3/water. Moreover, the best thermal performance occurred with a twist ratio of 1.5 and an NP volume fraction of 1.0%. In 2020, Chaurasia and Sarviya [15] performed an experimental analysis on the thermal and hydraulic performance of single- and double-strip helical screw tape inserts in copper tubes. They utilized a CuO/water nanofluid and applied the inserts with various twist ratios. According to the results, the Nusselt number was increased by 182 and 170%, respectively, using nanofluids with double and single strip tapes at a twist ratio of 1.5. Moreover, for higher twist ratios, it was demonstrated that the implementation of double-strip helical screw tape could improve heat transfer performance significantly and, consequently, the required size of the heat transfer unit could be reduced. Finally, based on the obtained results, a correlation for Nu as a function of Re, the number of strips, and the twist ratio was proposed.
In another experimental study, a solar water heater thermosyphon with various twisted-tape configurations was investigated (Almeshaal et al. [16]). According to the results, by increasing the rod and spacer length, the heat augmentation and friction was decreased. Moreover, it was concluded that utilization of the maximum spacer length is a key factor for reduction of friction.
Based on the reviewed literature, it can be stated that several investigations, mostly experimental ones, have been performed to determine the performance of nanofluid-based heat exchanger tubes with HST insertions. However, no computational simulation modeling a realistic PTC solar absorber tube with the combined effect of all of the influencing parameters has been previously performed. The coupled effect of pressure drop reduction and heat transfer enhancement as a function of various geometrical and operational condition parameters is another novel aspect of the present study.
In the present study, a CFD simulation of an absorber tube with a helical screw tape was conducted. CuO/oil nanofluid with an NP volume fraction of 1 to 3% was chosen as the working fluid. The simulation is based on the realistic operational condition of a PTC absorber tube with corresponding nonuniform solar heat flux based on the local concentration ratio. The effects of the mass flow rate (Re), HST width, and nanofluid volume fraction on the pressure drop (friction factor) and the heat transfer coefficient (Nusselt number) were studied. Moreover, to combine the effect of both parameters, the dimensionless variable of PEC was calculated for all of the cases. In addition, the enhancement of the PEC parameter by the implementation of nanofluid and HST in comparison to a base fluid passing through a plain tube was also determined and reported.

2. Computational Simulation

2.1. Governing Equations

To determine the temperature and flow pattern within the studied absorber tube, the continuity, momentum, and energy equations were implemented as follows.
Continuity:
x i ρ n f u i = 0
where x is the coordinate, ρ n f is the nanofluid density, u represents the velocity components and i denotes the vector index.
Momentum:
x j ρ n f u i u j = p x i + x j μ n f u i x j + u j x i + x j ρ n f u i u j ¯
where p and μ n f are the pressure and viscosity, respectively. The velocity fluctuation components are represented by u , which will be discussed in relation to the turbulence modelling.
Energy:
x i ρ n f u i T = x j Γ n f + Γ n f , t T x j fluid x j Γ T x j = 0 solid
where T is the temperature and Γ , Γ n f and Γ n f , t are the solid phase conductivity and the molecular and turbulent thermal diffusivity of the nanofluid, respectively. Γ n f , t is defined as:
Γ n f , t = μ n f , t / P r n f , t
The heat transfer in the solid tape is also measured based on the conduction heat transfer equation.
Solar heat flux has a time-dependent magnitude. However, it should be noted that the majority of the useful energy gain of solar collectors occurs around solar noon, when solar heat flux variation is significantly lower than during the sunrise and sunset time periods. Therefore, considering the higher energy gain and lower solar flux variations around solar noon, the governing equations can be solved in the steady-state form.
The Reynolds-averaged approach for turbulence modeling requires the Reynolds stresses, i.e., ρ n f u i u j ¯ , to be modeled. Raheem et al. (2021) [17], numerically calculated Nu using three different turbulent models and compared the results with experimental data for various insert types in a circular tube, implementing RNG kω and kω models with enhanced wall treatment and SST kω models. Based on the obtained results, it can be concluded that the k-ε models with enhanced wall treatment had the least deviation from the experimental measurements (14%). Accordingly, in the present study, the well-known k ε model with enhanced wall treatment is utilized.
The Boussinesq hypothesis is implemented to relate the Reynolds stresses to the mean velocity gradients as:
ρ n f u i u j ¯ = μ n f , t u i / x j + u j / x i
The turbulent viscosity term can be calculated as:
μ n f , t = ρ n f c μ k 2 / ε
where k and ε are turbulence kinetic energy and dissipation rate, respectively. The transport equations for k and ε are as follows:
x i ρ n f k u i = x j μ n f + μ n f , t σ k k x j + G k ρ n f ε + S k
x i ρ n f ε u i = x j μ n f + μ n f , t σ ε ε x j + C 1 ε ε k G k + C 2 ε ρ n f ε 2 k + S ε
ρ n f ε represents the destruction rate and G k is the generation rate of turbulence kinetic energy and is defined as:
G k = ρ n f u i u j ¯ u j x i
s k and s ε are the source terms for k and ε and currently are taken as zero. The boundary values for the turbulent quantities near the wall are specified using the standard wall-treatment method. The values of c μ = 0.009 , C 1 ε = 1.44 , C 1 ε = 1.92 , σ k = 1 , σ ε = 1.3 and P r n f , t = 0.9 are chosen as empirical constants in the turbulence transport equations [17]. The following equations are used to calculate the intensity (I), kinetic energy (k) and dissipation rate (ε) of turbulency at the inlet section of the tube:
I = 0.16 R e 1 8 k = 3 / 2 ( I × u i n ) 2 ε = c μ 0.75 × k 1.5 / 0.1 D
where D and uin are the tube diameter and inlet velocity, respectively. For the inlet and outlet of the channel the boundary conditions can be expressed as:
T x = 0 , u x = 0   outflow   boundary   condition
T = T i n , u = U , v = 0   inlet   boundary   conditions
where n ^ and x denote the normal vector to the surface and the coordinate along the cylinder axis, respectively, T i n is the inlet temperature and U denotes the inlet velocity based on the Re number.
The boundary condition for the peripheral walls of the absorber is divided into two states. Referring to Figure 1, the adiabatic boundary condition is assigned at the calming and fully developed sections, while a predefined solar flux distribution is set at the middle section of the absorber tube where the HST is placed:
T x = f θ , u = v = 0   HST   sec tion
T n ^ = 0 , u = v = 0   calming   and   FD   sec tions  
In Equation (13), f θ refers to the distribution shown in Figure 2.
To determine the performance of the absorber tube, several dimensionless parameters must be utilized. The Reynolds number is defined as:
R e = ρ f u i n D μ f .
The heat transfer coefficient can be defined as:
h = q T w T m
where the mean temperature or bulk temperature ( T m ) would be:
T m = 0 R u T r d r 0 R u r d r
To examine the heat transfer and pressure drop performance of the studied absorber tube, appropriate parameters should be incorporated. The Nusselt number (Nu) for heat transfer and the friction factor (f) for pressure drop estimations are defined as:
N u = h D K
f = 2 Δ p D L ρ u m 2
where u m is the mean velocity.
Since the effects of pressure drop and heat transfer on PTC efficiency inversely affect system performance, there must be a collective parameter to combine their impact on overall collector behavior. The PEC number is suitable for the combination of heat transfer and pressure drop effects, and can be defined as [18,19]:
P E C = N u N u 0 f f 0 1 3
where the ‘0’ subscript refers to a simple pipe without HST inserts or nanoparticles (pure fluid). Therefore, a PEC value above one implies an improvement in system performance due to HST insertion.
The buoyancy force affects the flow field as a significant temperature gradient develops in the absorber tube. However, since one of the main beneficial properties of the helical screw tape is to rotate the nanofluid passing through the absorber tube, the temperature gradient becomes less significant in the present configuration in comparison to simple absorber tubes. In other words, the temperature difference between the upper and lower surfaces of the absorber tube (which are subjected to different solar heat fluxes) becomes lower as a result of implementing the screw tape. Therefore, the buoyancy force has negligible magnitude in comparison to other affecting parameters, and consequently can be neglected in the computation process.

2.2. Nanofluid Modeling

To improve the thermal performance of the base fluid, CuO NPs were added to the oil. The thermophysical properties of the fluid mixture are determined based on the single-phase model. According to the single-phase model, the mixture properties, including viscosity, density and thermal conductivity, are functions of each component’s properties as well as its respective volume fraction.
The mixture density can be estimated as [20]:
ρ n f = φ ρ n p + 1 φ ρ b f
where in Equation (21), φ is the nanoparticle volume fraction and the np and bf subscripts denote the nanoparticles and base fluid, respectively.
Several models have been presented to predict the thermal conductivity of nanofluid mixtures, namely, the Maxwell, Hamilton and Crosser, Wasp, Xue and Sokhansefat models. Therefore, it is important to determine the effect of model selection on the calculated thermal conductivity. Akhatov et al. (2022) [21] focused on the differences among these models for a wide range of volume fractions and temperatures for several selected nanoparticle materials. Based on these results, the effect of the thermal conductivity model for CuO nanoparticles was 1 and 5% at volume fractions of 1 and 3%, respectively. Consequently, in the current study the well-known and basic Maxwell model is utilized.
To determine the single-phase conductivity, the correlation proposed by Maxwell [21] is applied as:
Γ n f = Γ b f Γ n p + 2 Γ b f + 2 φ Γ n p Γ b f Γ n p + 2 Γ b f φ Γ n p Γ b f
Finally, the viscosity of nanofluid can be estimated using the Einstein model [22] as:
μ n f = μ b f 1 + 2.5 φ
The thermophysical properties of the base fluid in addition to the CuO nanoparticles are implemented as shown in Table 1.

2.3. Study Configuration and Operating Conditions

The 3D geometry of a parabolic solar collector using helical screw tape without a core was utilized for the computational simulation. Screw tapes with four different widths (7.5, 12, 15 and 20 mm) were inserted in an absorber tube with a 25 mm radius, and 4 different fluid velocities (0.1, 0.2, 0.5, and 0.7 m/s) were applied to determine the effect of flow rate. The tube length is 8 m and an HST with a length of 5 m was inserted at a distance of 2 m from the absorber entrance. Tape thickness was 1 mm and the tape was made of copper. A nonuniform heat flux was assigned to the absorber peripheral surface as the thermal boundary condition (see Figure 1). The tape revolved around its axis ten times through its length, reaching a pitch of 2.06 rad/m. As the nanoparticle volume fraction increases, the degree of agglomeration intensifies. Consequently, more compact agglomerates provide the base fluid with enhanced heat transfer properties. Accordingly, in the present study, to prevent the negative effect of agglomeration, the numerical computations were limited to a 3% nanoparticle volume fraction.

2.4. Distribution of Solar Thermal Flux

The absorber tube of a parabolic trough collector receives thermal radiation nonuniformly around its peripheral area. Therefore, it is essential to apply a realistic flux distribution to obtain thermal performance of the system. To determine the correct value of solar flux of the PTC on the absorber tube, the local concertation ratio should be multiplied by direct irradiance and the absorptivity of the tube’s coating. The maximum direct solar intensity and the absorptivity coefficient are taken as 836 W/m2 and 0.94, respectively [24]. The distribution of the local concentration ratio at the winter and summer solstice and the spring and autumnal equinox are shown in Figure 2 [4]. The data for the summer solstice were implemented in the current study.

2.5. Computational Grid

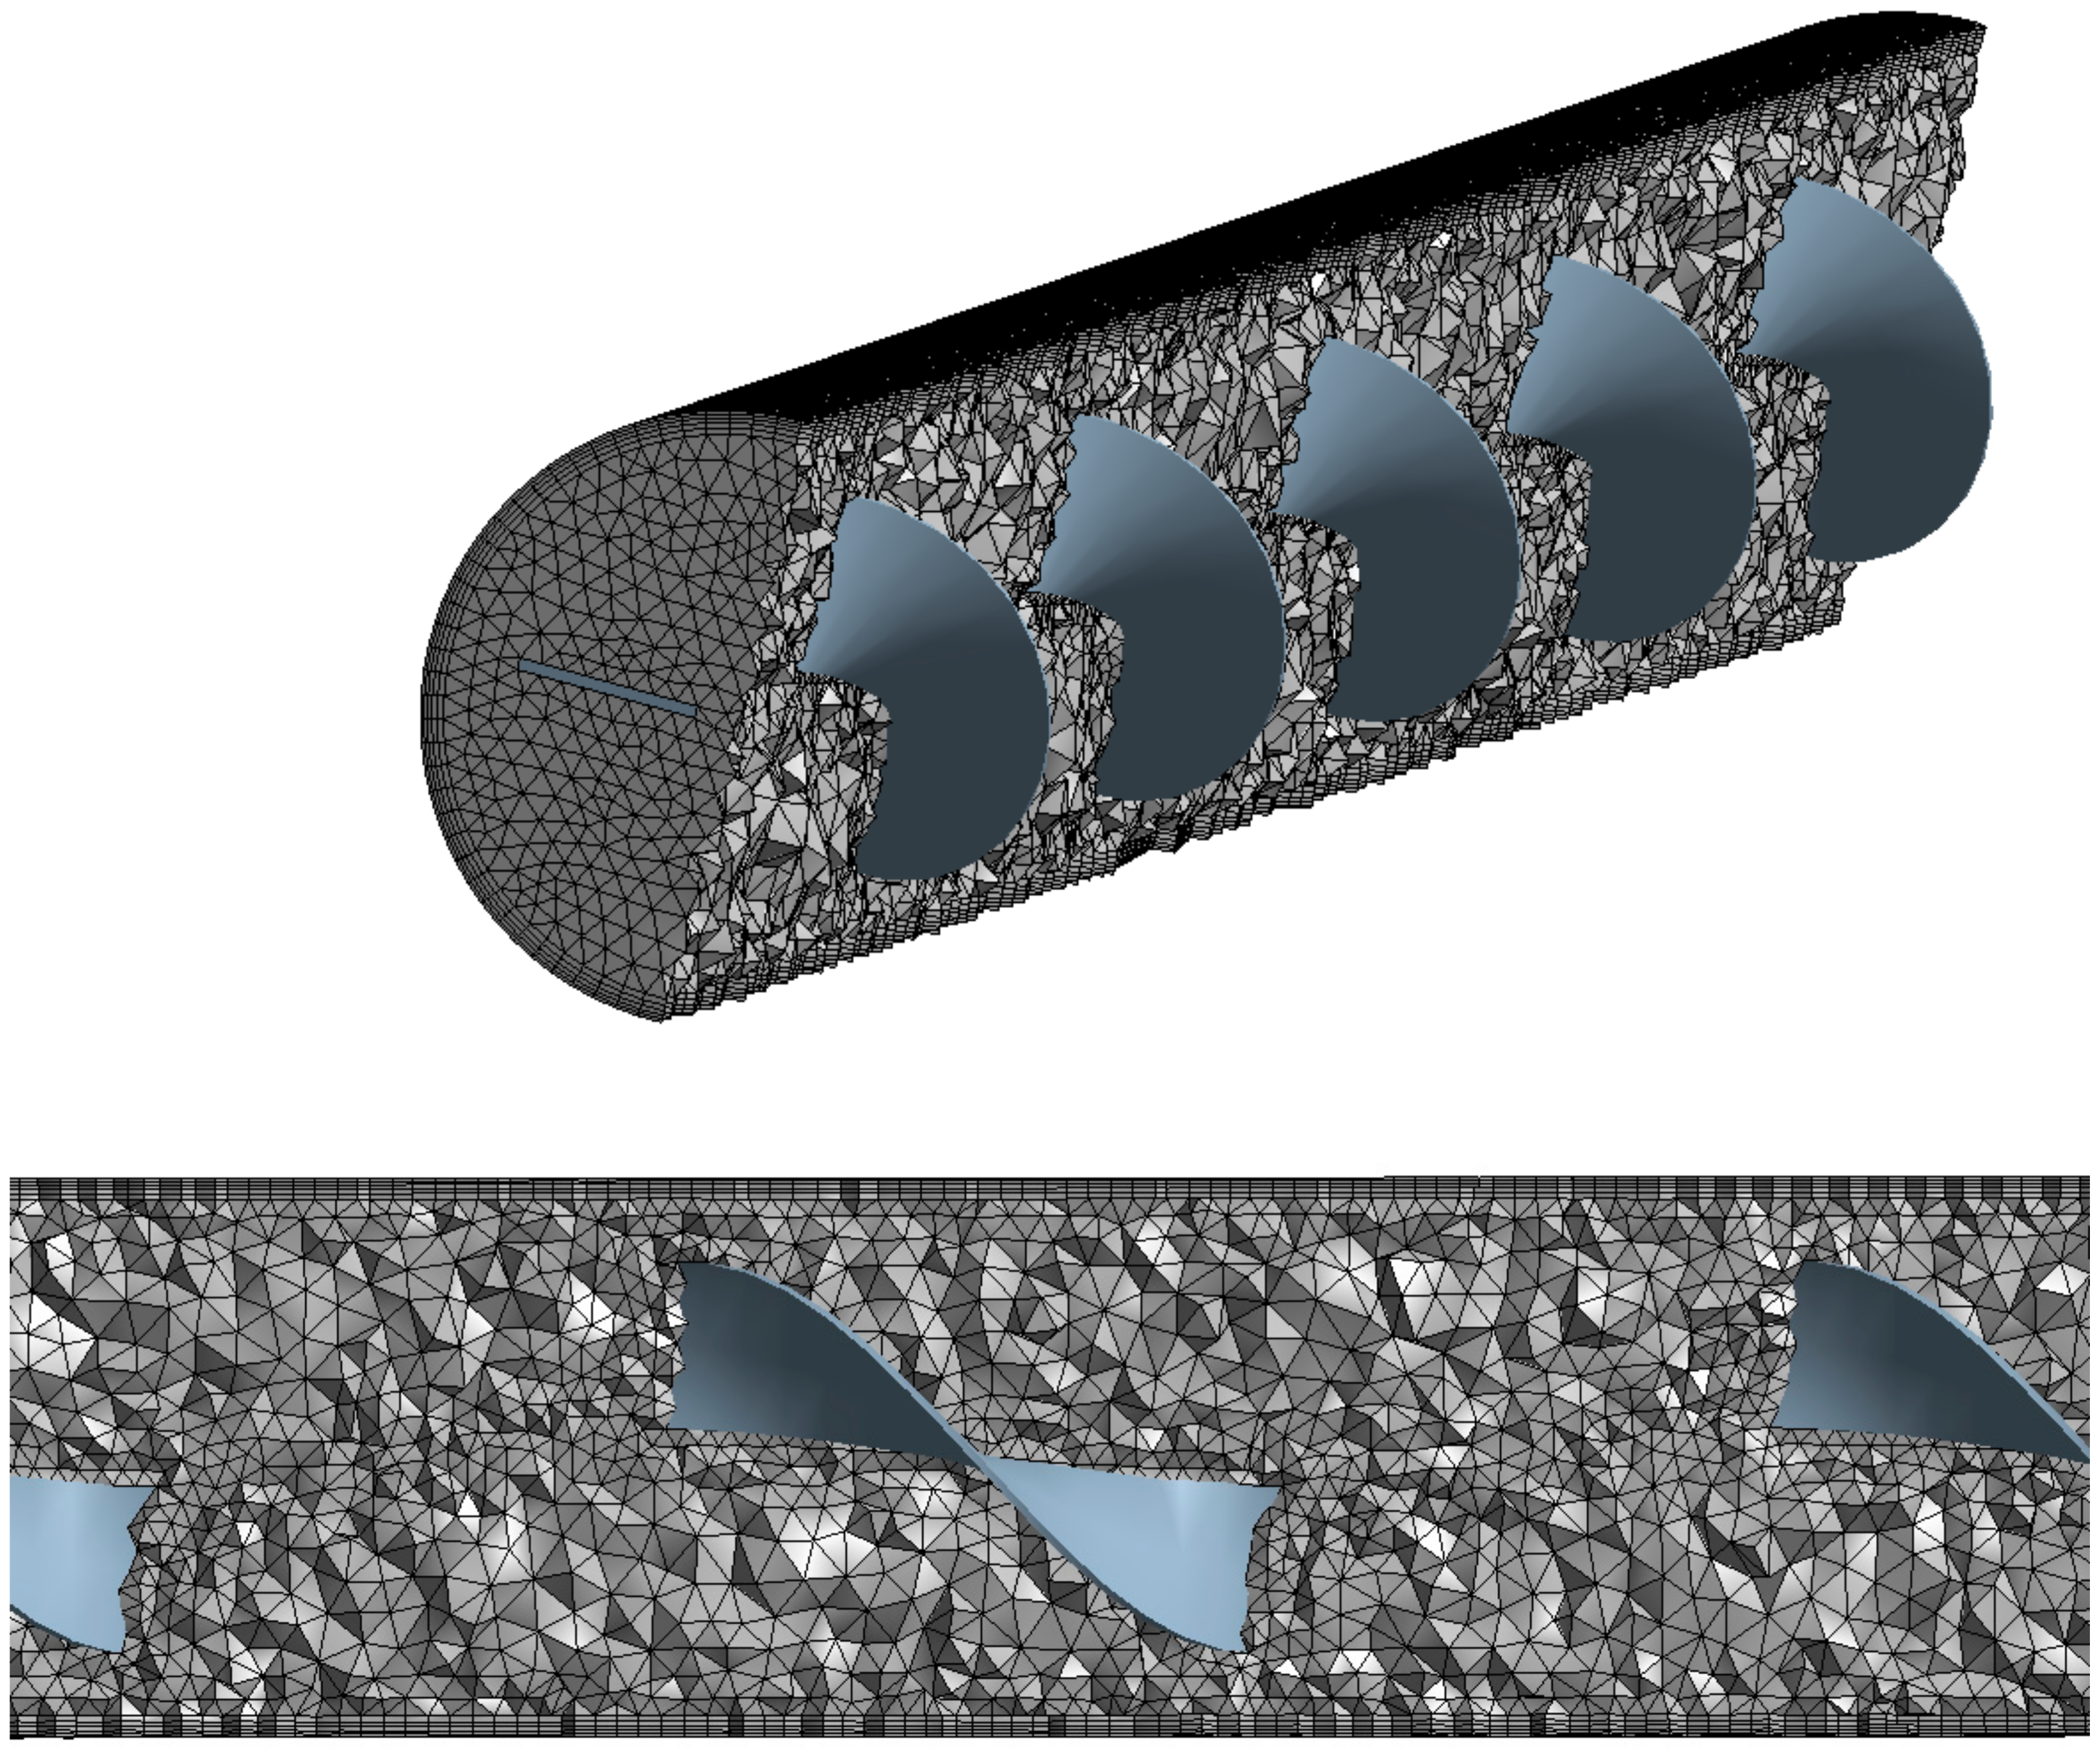
The computational grid utilized in sectioned views is illustrated in Figure 3. Tetrahedral cells with higher density near the tube wall and the HST, as well as boundary layer inflation near the tube outer surface, were utilized to increase the simulation accuracy. To examine the sufficiency of the implemented computational grids, four similar computational grids with different numbers of cells (524,986, 687,438, 863,544 and 1,097,324) were utilized. When an enhanced wall treatment scheme is implemented, the first mesh layer should be placed within the viscous sublayer to obtain accurate results. Therefore, the y+ value should be between one and five. Consequently, the computational grid was refined during the simulation process to keep the near-wall y+ value below 5.
According to the results, in comparison of f and Nu as the output criteria, the grid with 863,544 computational cells proved to be the optimum mesh regarding both computational time and computational error. The variations of computational time, f and Nu are presented in Table 2.

2.6. Computational Considerations

Assuming that the fluid is incompressible, free convection was neglected and the SIMPLE algorithm was used for pressure corrections. Other pressure–velocity correction algorithms (e.g., SIMPLER, SIMPLEC) were also applied in some cases. No significant change in the results and the convergence rate was observed. The fluid turbulence was simulated using a two-equation standard model. An inlet velocity boundary condition was used for the inlet and an outflow boundary condition was used for the fully developed outlet (the tube section without helical tape is continued downstream, which was sufficient to ensure the occurrence of the FD boundary condition). ANSYS Fluent software was implemented for the simulation. An Intel® Xeon® Processor E6540 (18M Cache, 2.00 GHz, 16 GB RAM) on a Windows 10 64-bit operating system was utilized to obtain the computational results. The convergence criteria for all of the governing equations was set to 10−4 for mean relative error, except for the energy equation, for which 10−6 was set as the solution termination condition. Each simulation required an average time of 6 h to converge.

3. Results

3.1. Validation

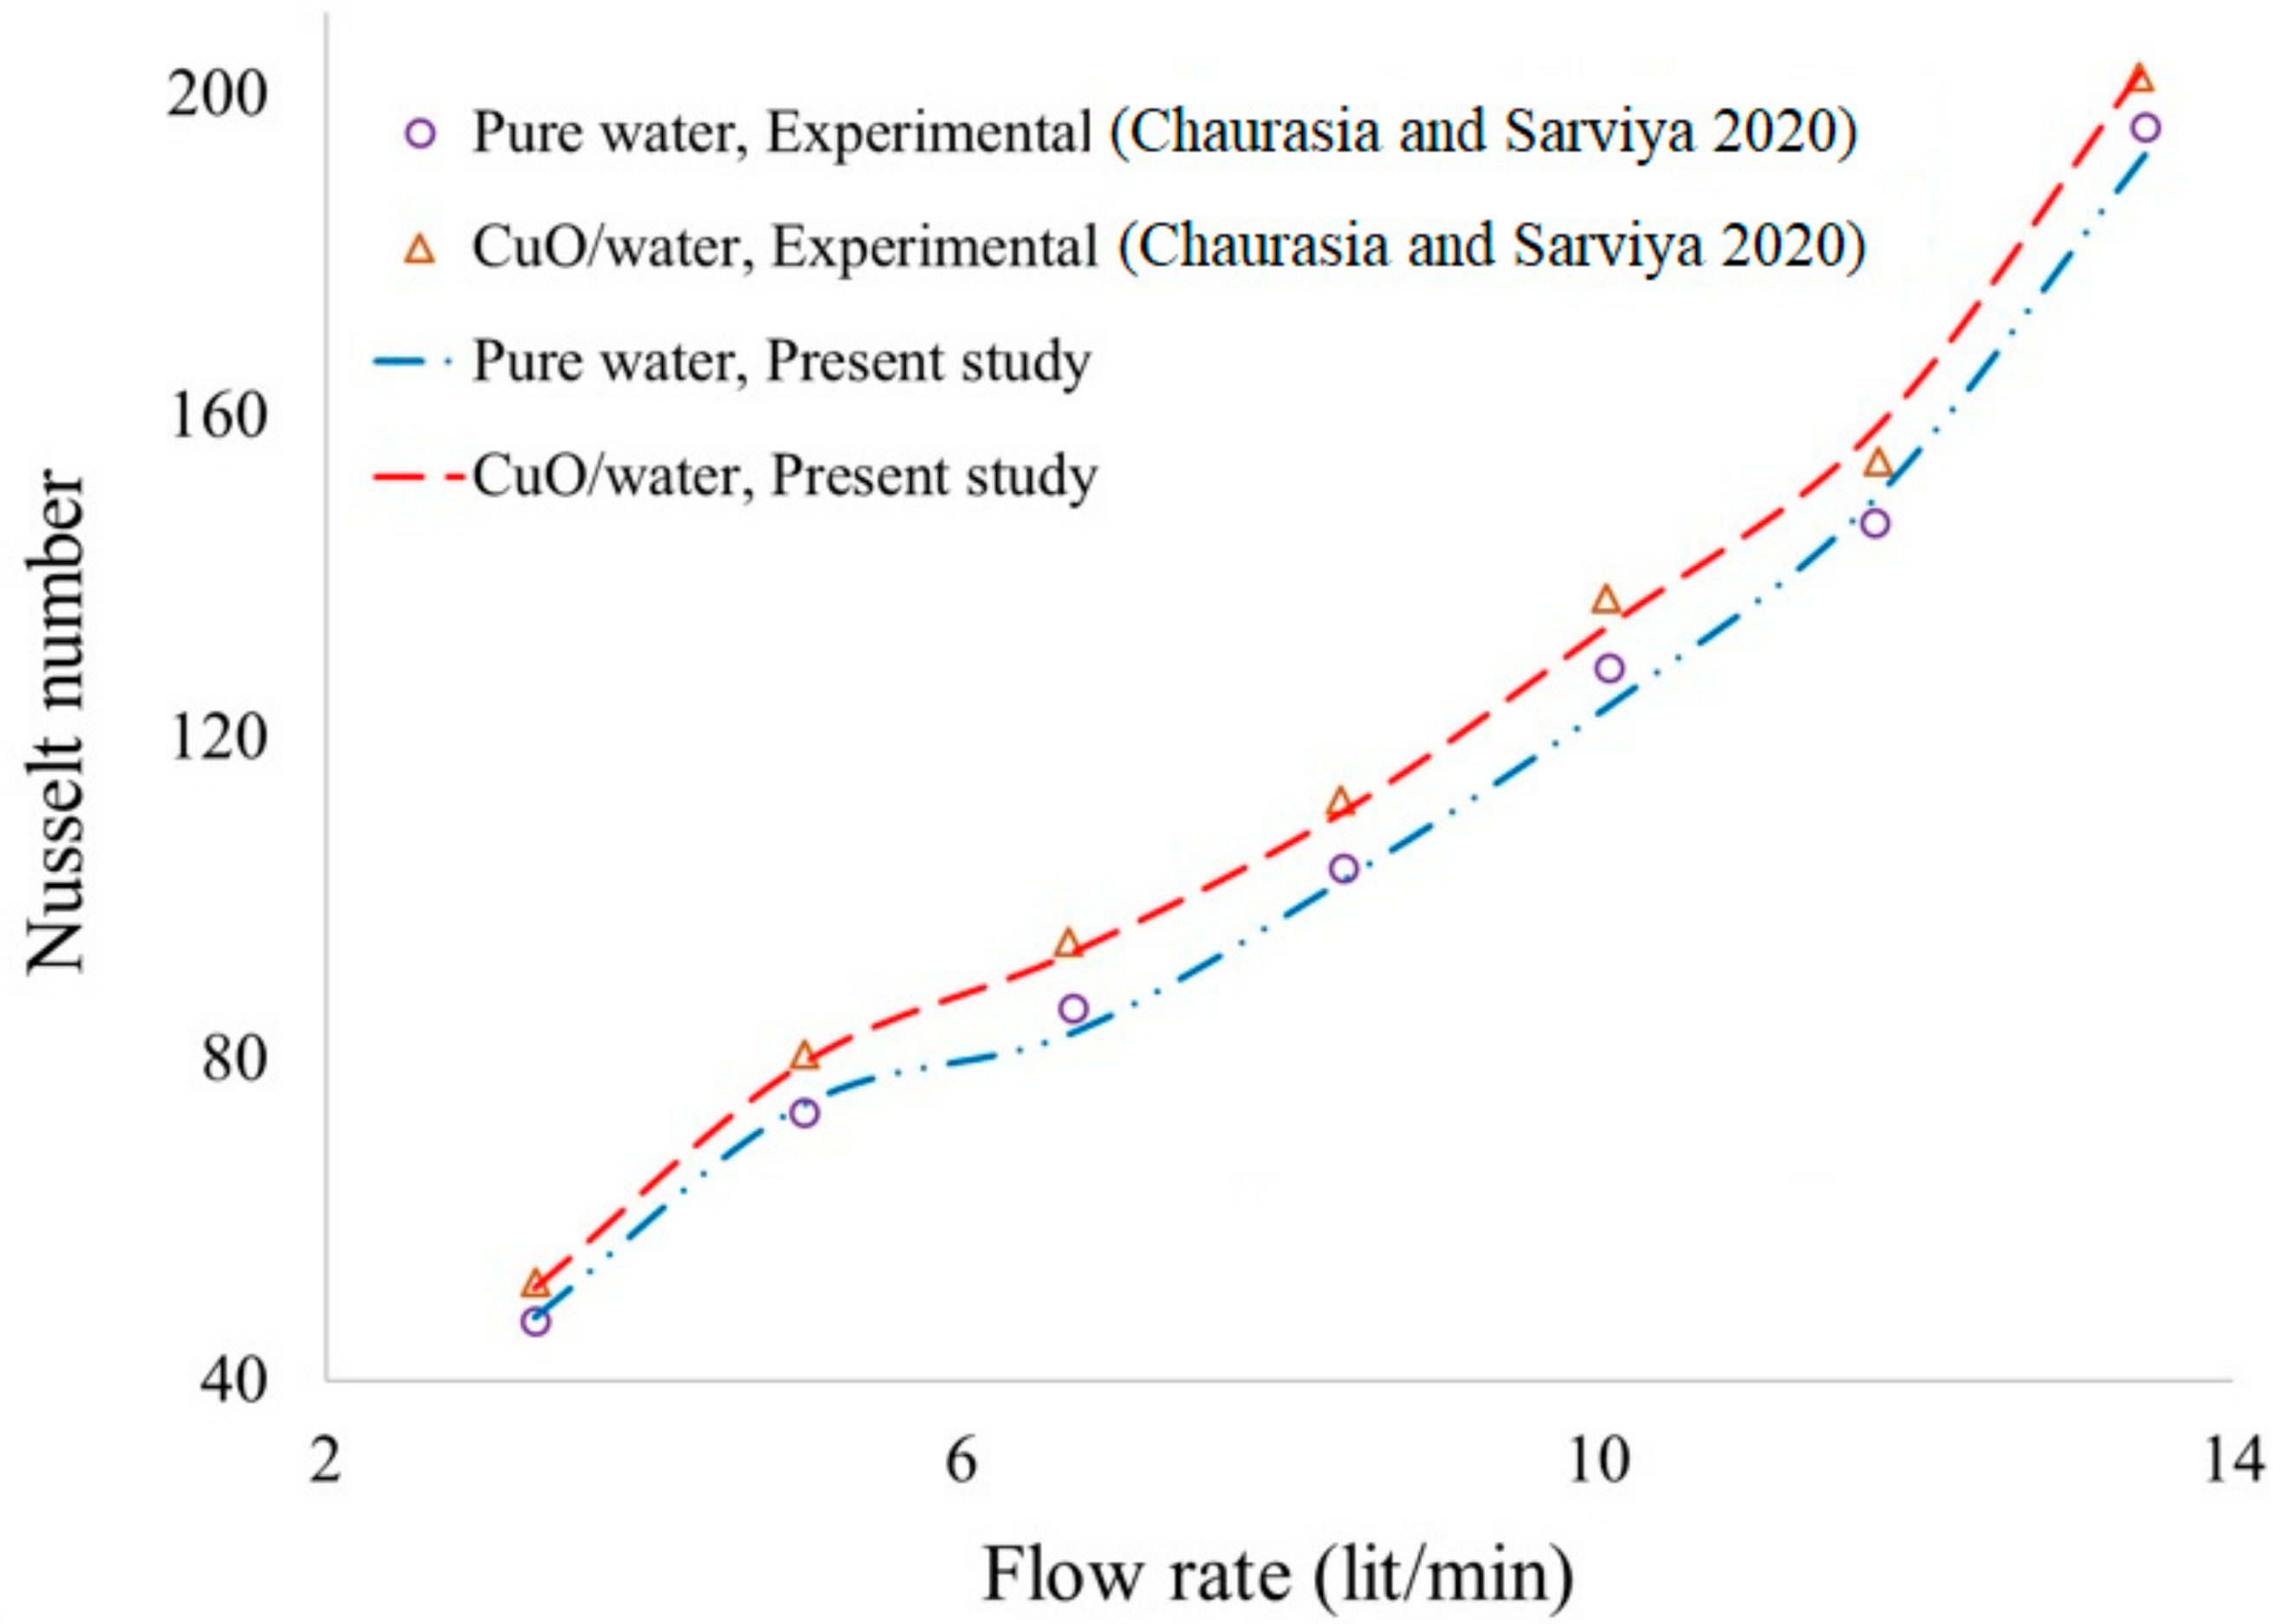
To validate the simulation procedure of the present study, the experimental data of Chaurasia and Sarviya [15] were utilized. The experimental data were measured for CuO/water nanofluid passing through a tube with a single-strip helical screw tape. The twist ratio was taken as 2.5 and the effect of flow rate on Nu was studied. Tubes with internal diameter of 20 mm and a test-section length of 1000 mm were heated with a uniform flux of 1.5 kW at its surface. The single-strip tape was modeled with the dimensions in [15], and the volumetric concentration of the nanoparticles was set to 0.5%. The experimental measurements of [16], in addition to the computational results obtained by the current CFD simulation, are depicted in Figure 4. As can be seen, the computational simulation can predict the thermal performance of the tube with a maximum relative error of 3.88 and 2.39%, respectively, for pure water and water/CuO.

3.2. Base Fluid Simulation

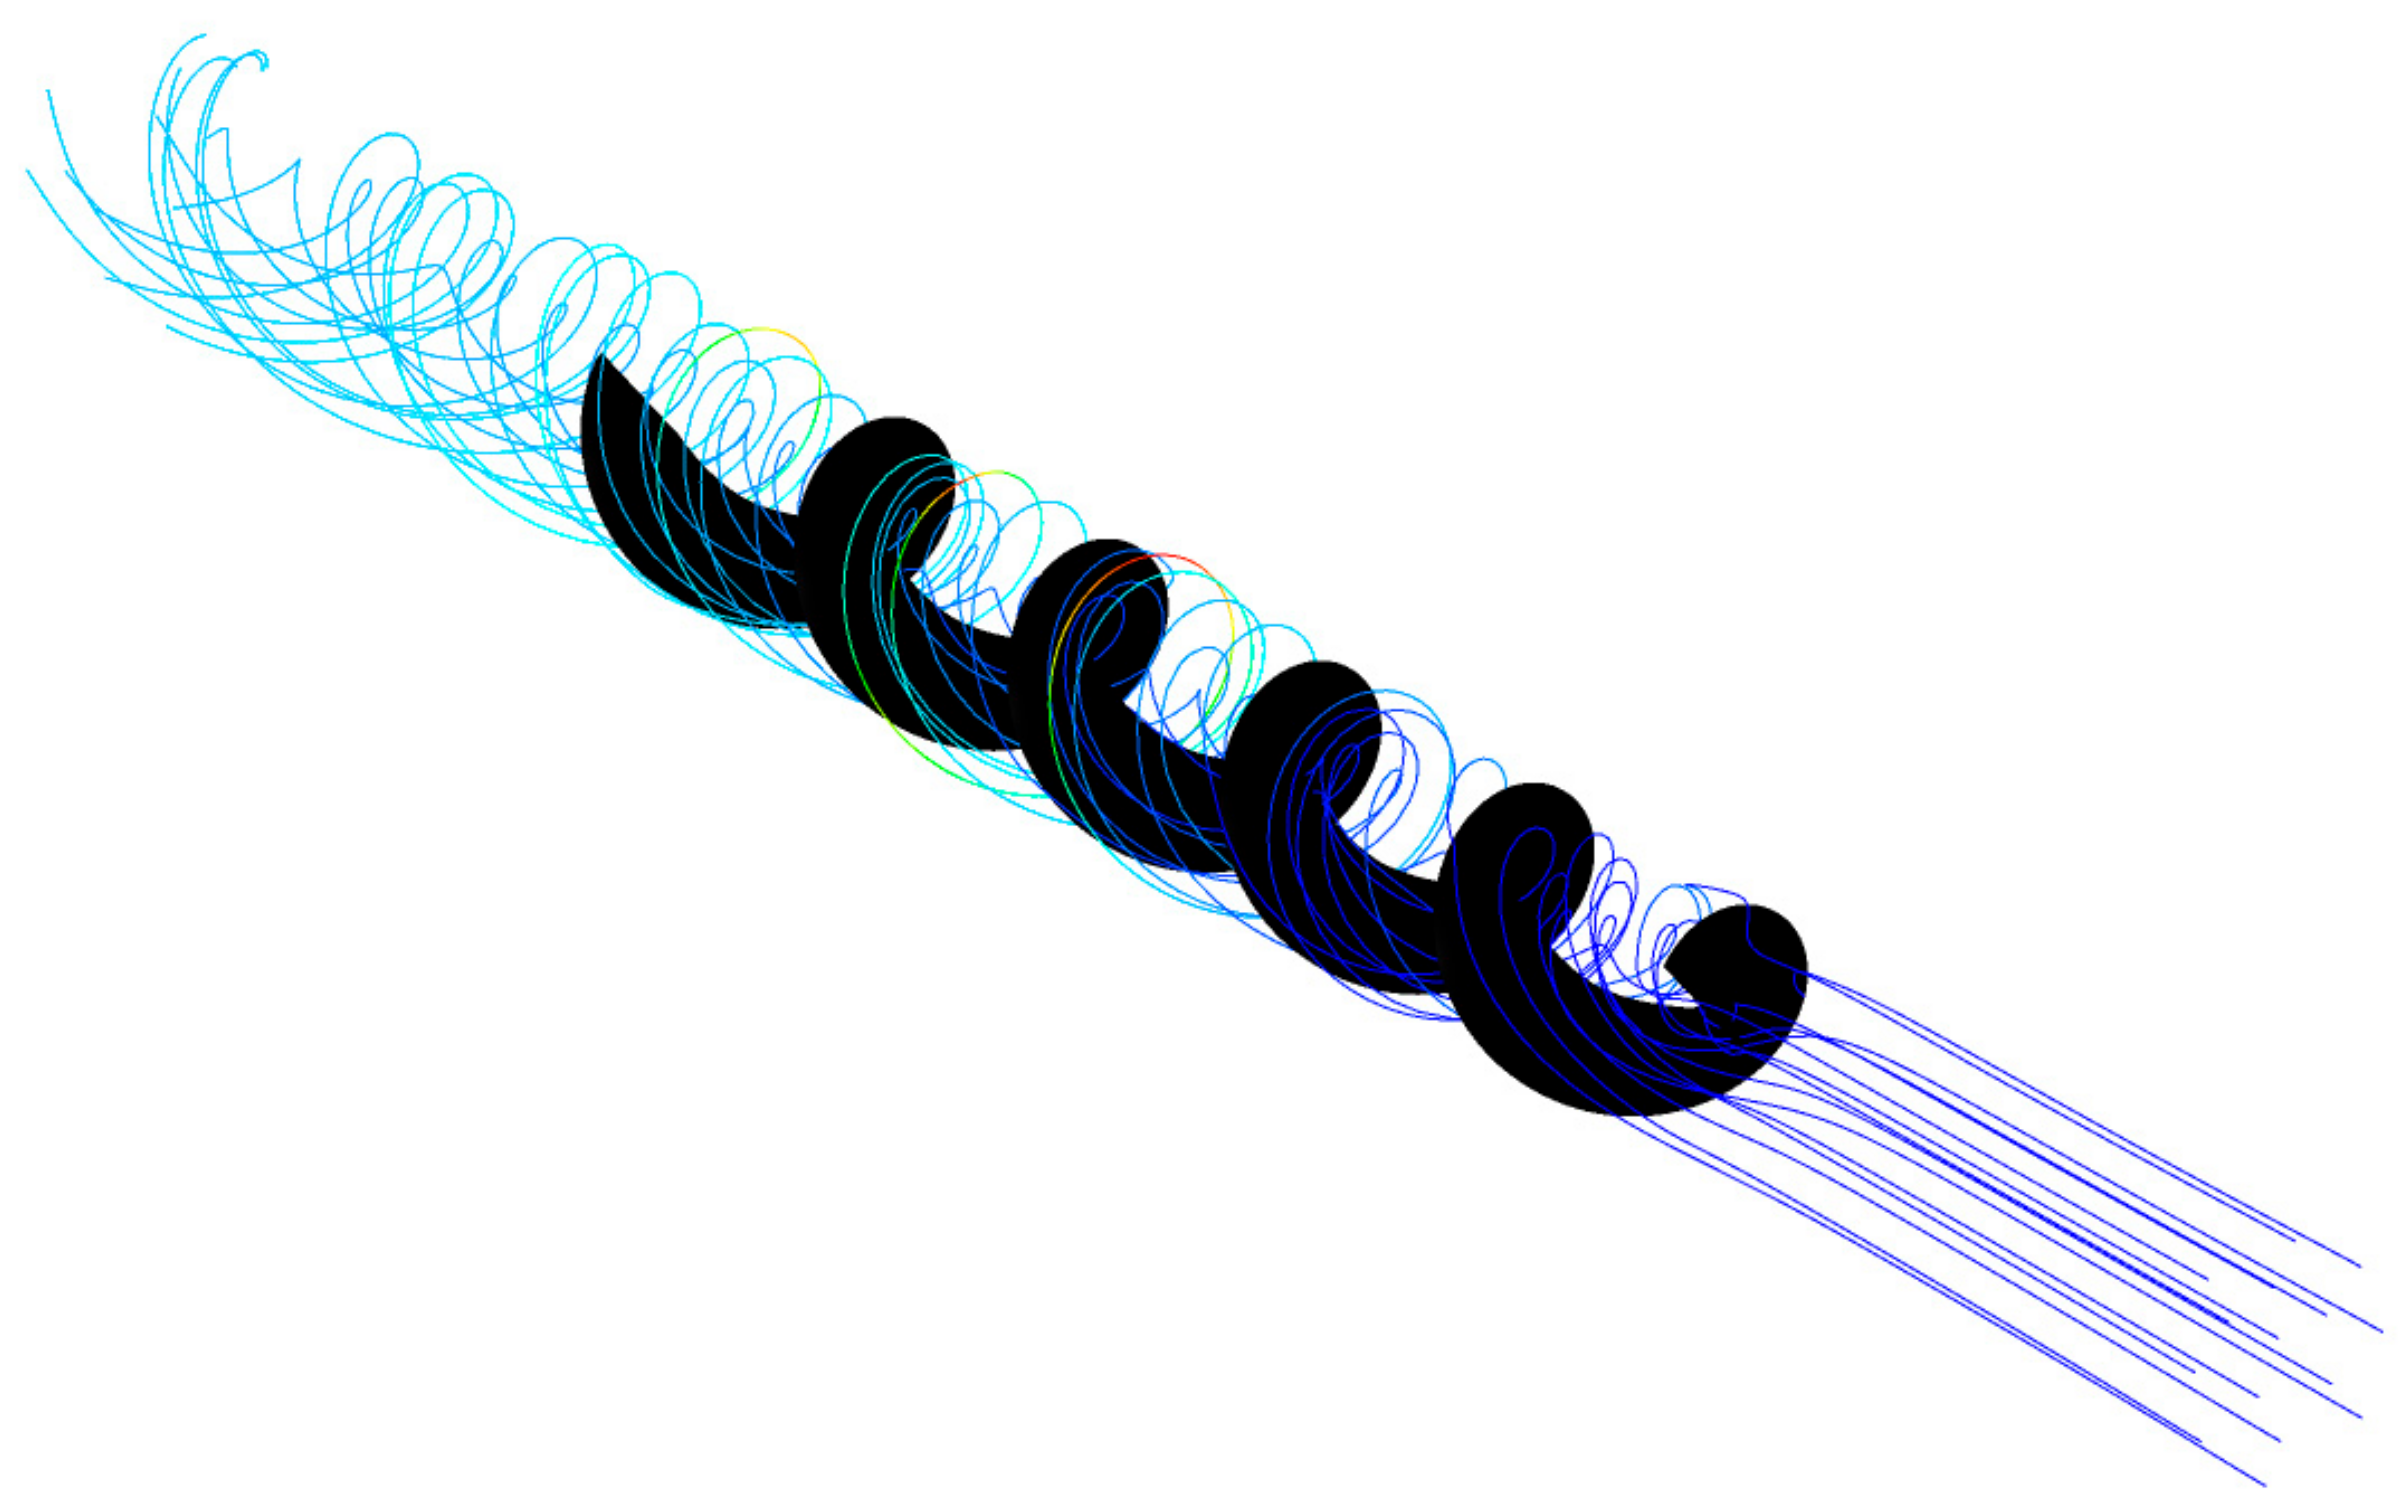
In this section, the hydrothermal behavior of the absorber tube with HST insertion as a function of operational conditions is studied and the results are reported in terms of friction factor, Nusselt number and the PEC parameter. The streamlines initiating from the inlet section for the case with the highest HST width (L = 20 mm) at Re = 6300 are illustrated in Figure 5. The streamline coloring is based on the local temperature. The creation of the rotational flow pattern, as well as fluid mixing to form a uniform temperature at the FD section, can be easily observed in Figure 5.
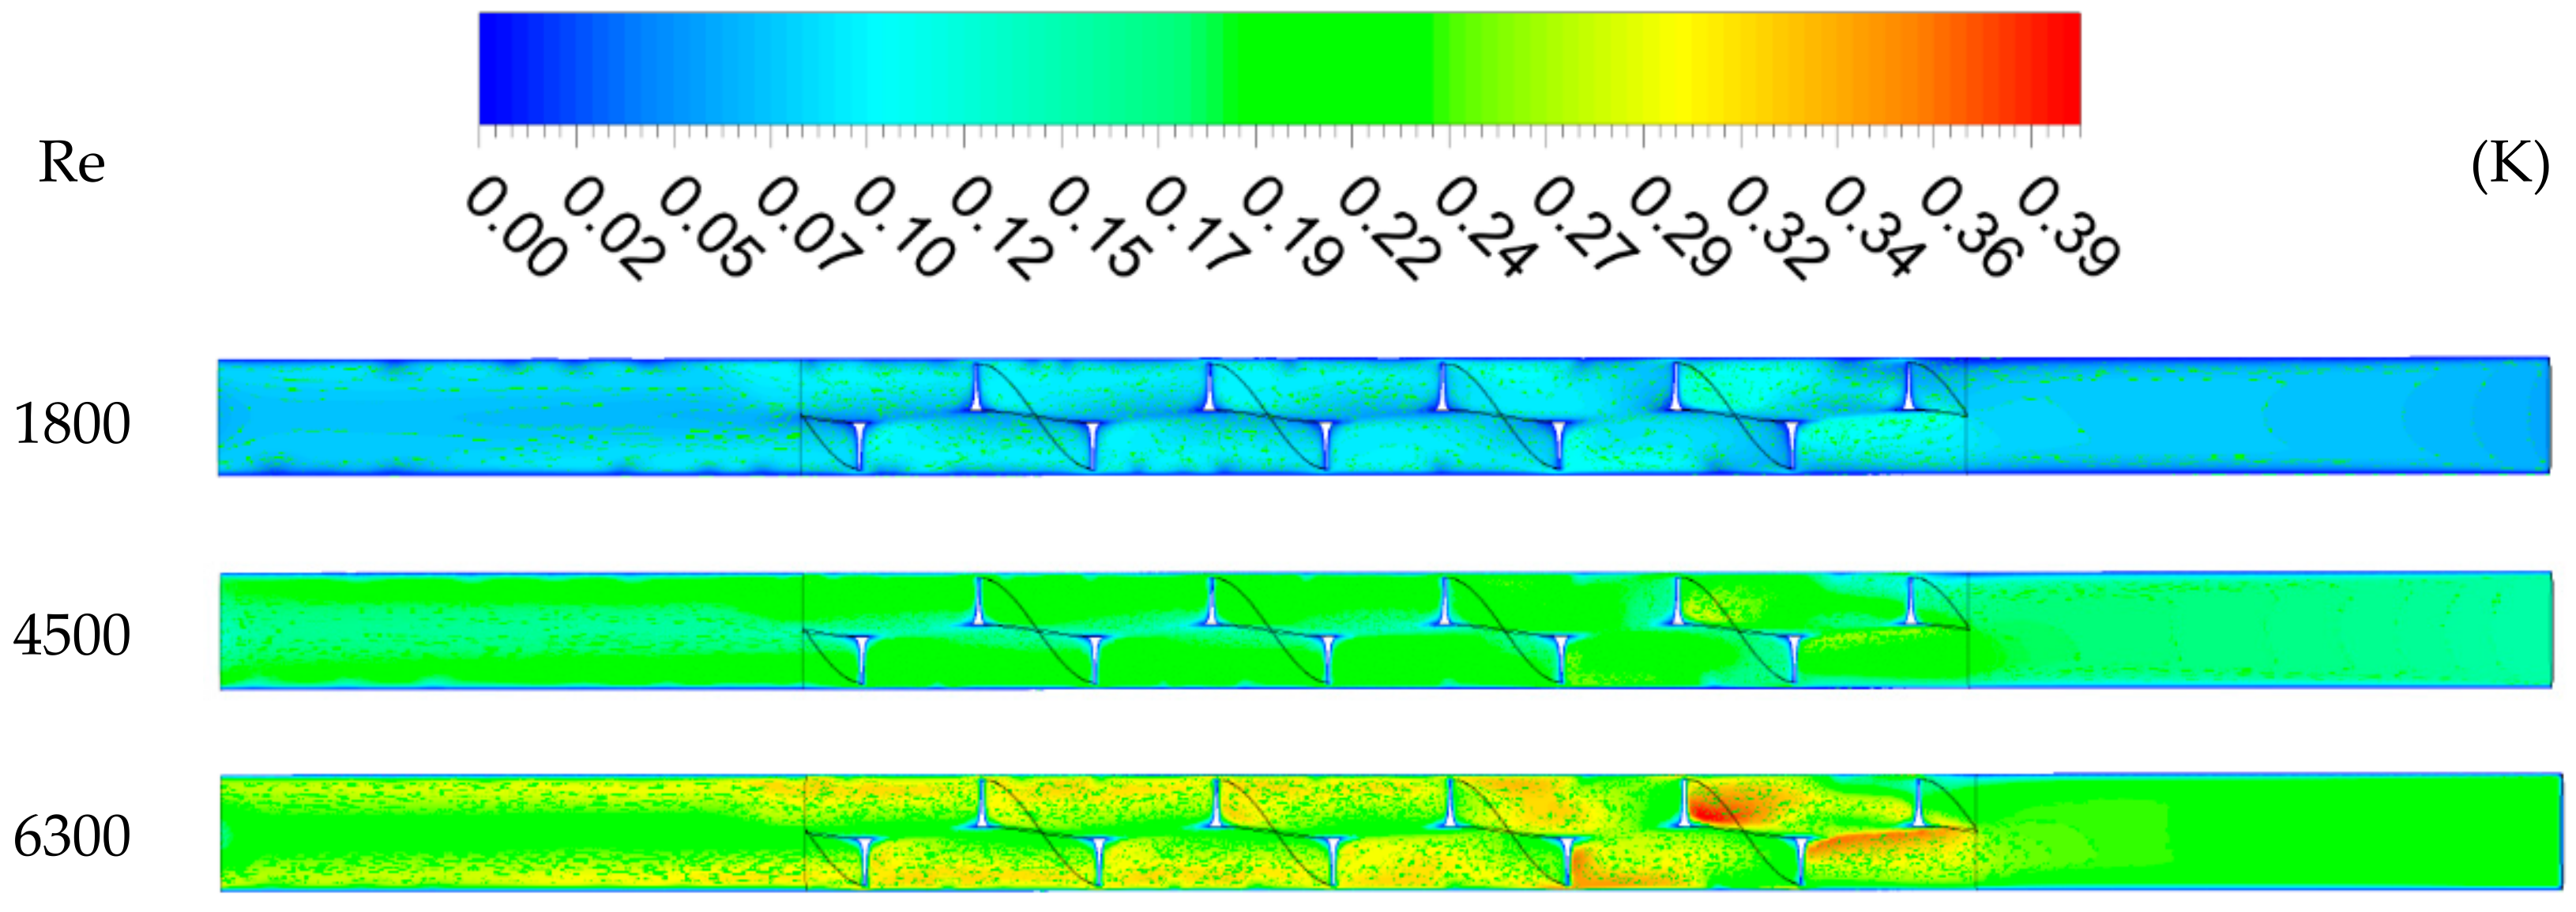
The temperature contours on the helical tape are represented in Figure 6 for L = 20 mm at various values of Re. As the Re number is increased, the nanofluid mass flow increases and the applied solar heat flux causes a minor temperature increase in the absorber section. As the solar energy is absorbed by the working fluid, the tape wall temperature is increased in the flow direction, as is obvious in Figure 6. The maximum tape temperature increases from 317.4 to 361.3 K as Re decreases from 6300 to 1800.
The velocity contours on the straight plane passing through the center of the absorber tube for L = 20 mm at various values of Re are shown in Figure 7. As the flow Re increases, the bulk flow velocity and mass flow rate increase. Furthermore, it can be observed that after several swirls the flow becomes periodic for all the simulated values of Re.
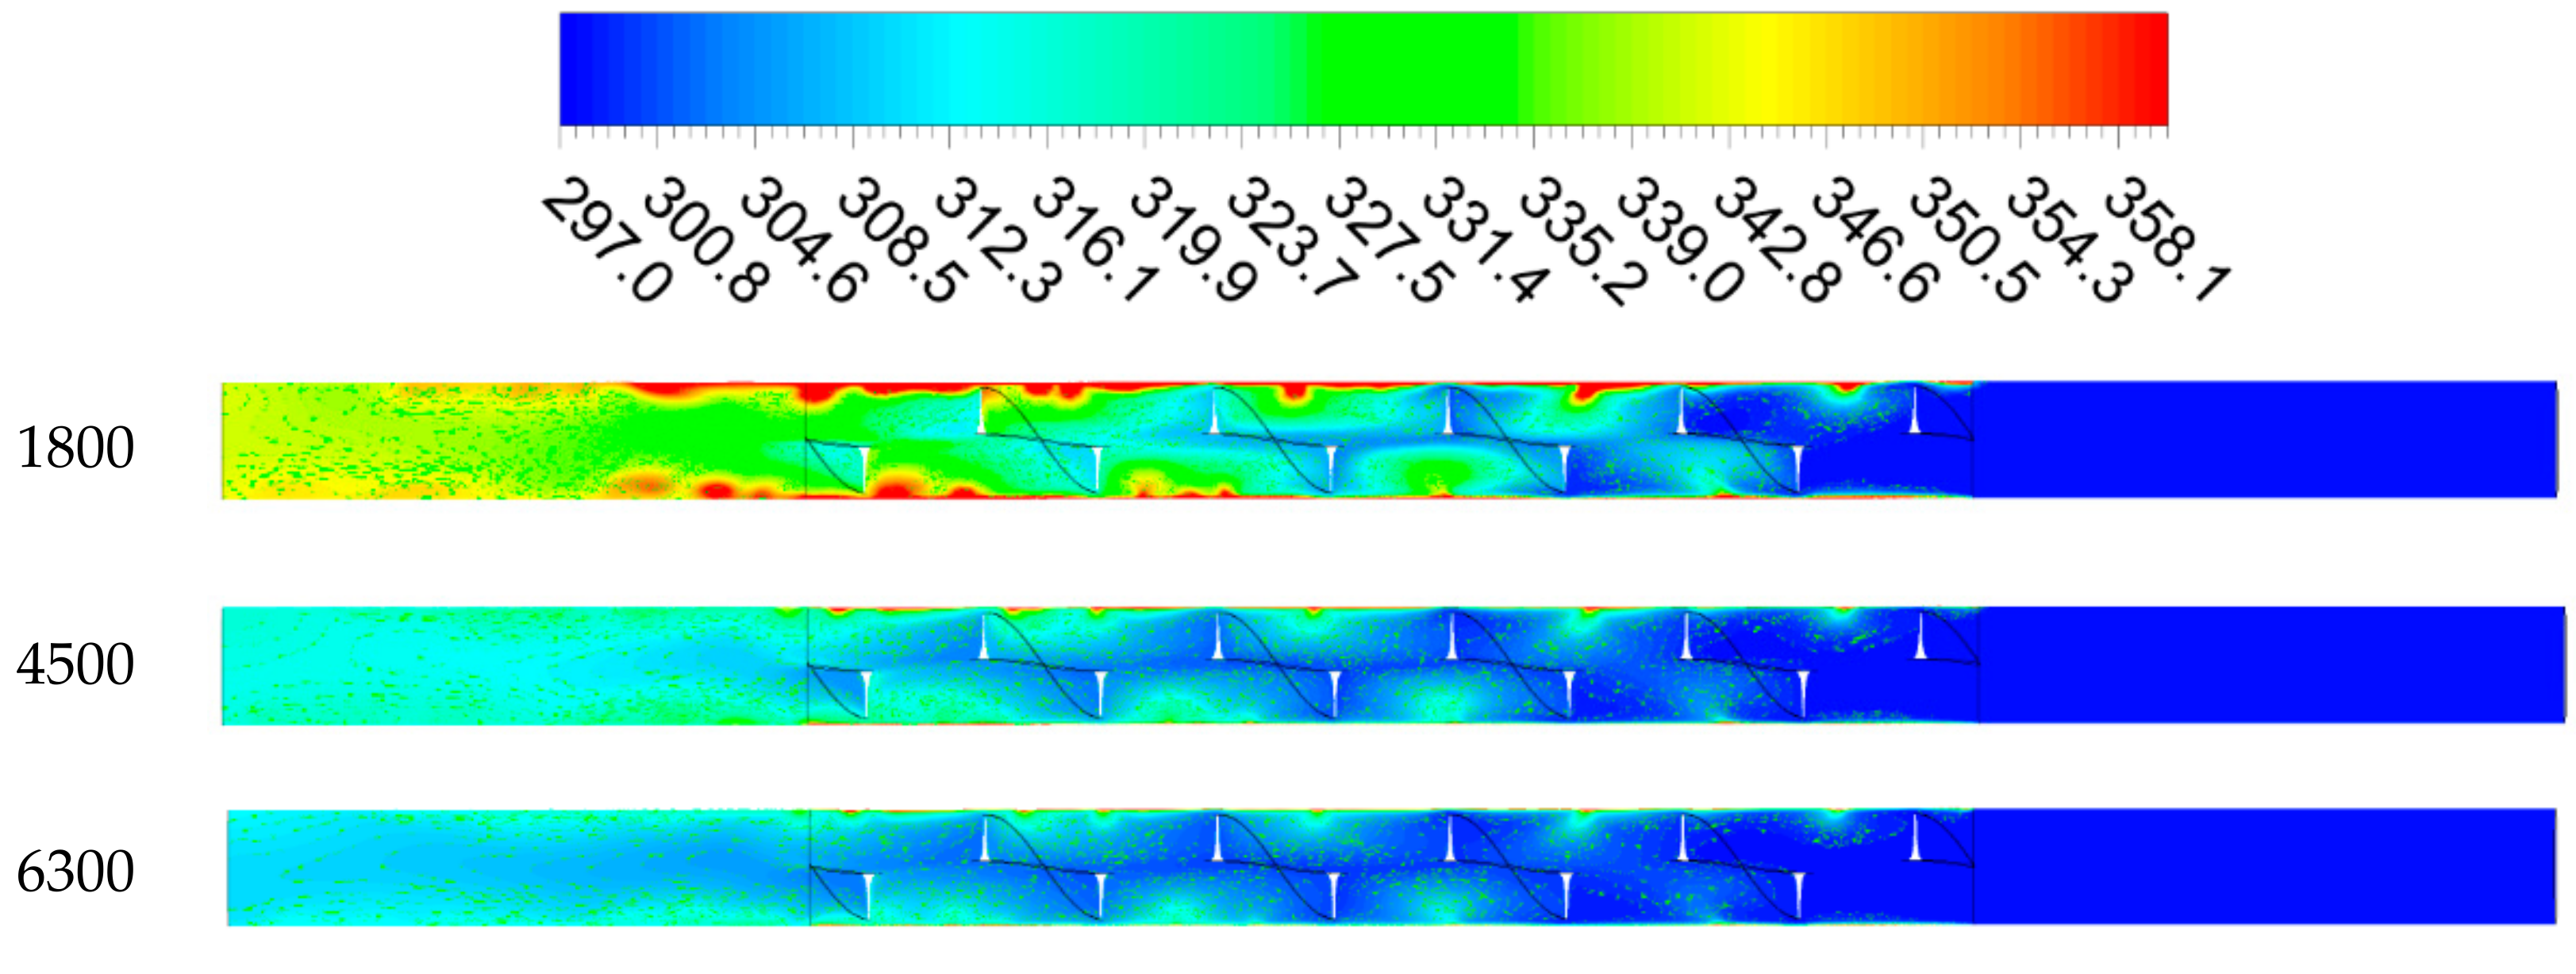
The temperature contours on the straight plane passing through the center of the absorber tube for L = 20 mm at various values of Re are shown in Figure 8. According to the results, as the Re number increases due to the higher cooling effect of the nanofluid, the bulk flow temperature decreases. Moreover, passing through the heating section (subjected to solar heat flux), the fluid temperature gradually increases. The occurrence of hot spots at the peripheral boundaries with the lowest fluid velocity is also recognizable. The same pattern for velocity and temperature fields was reported by [17].
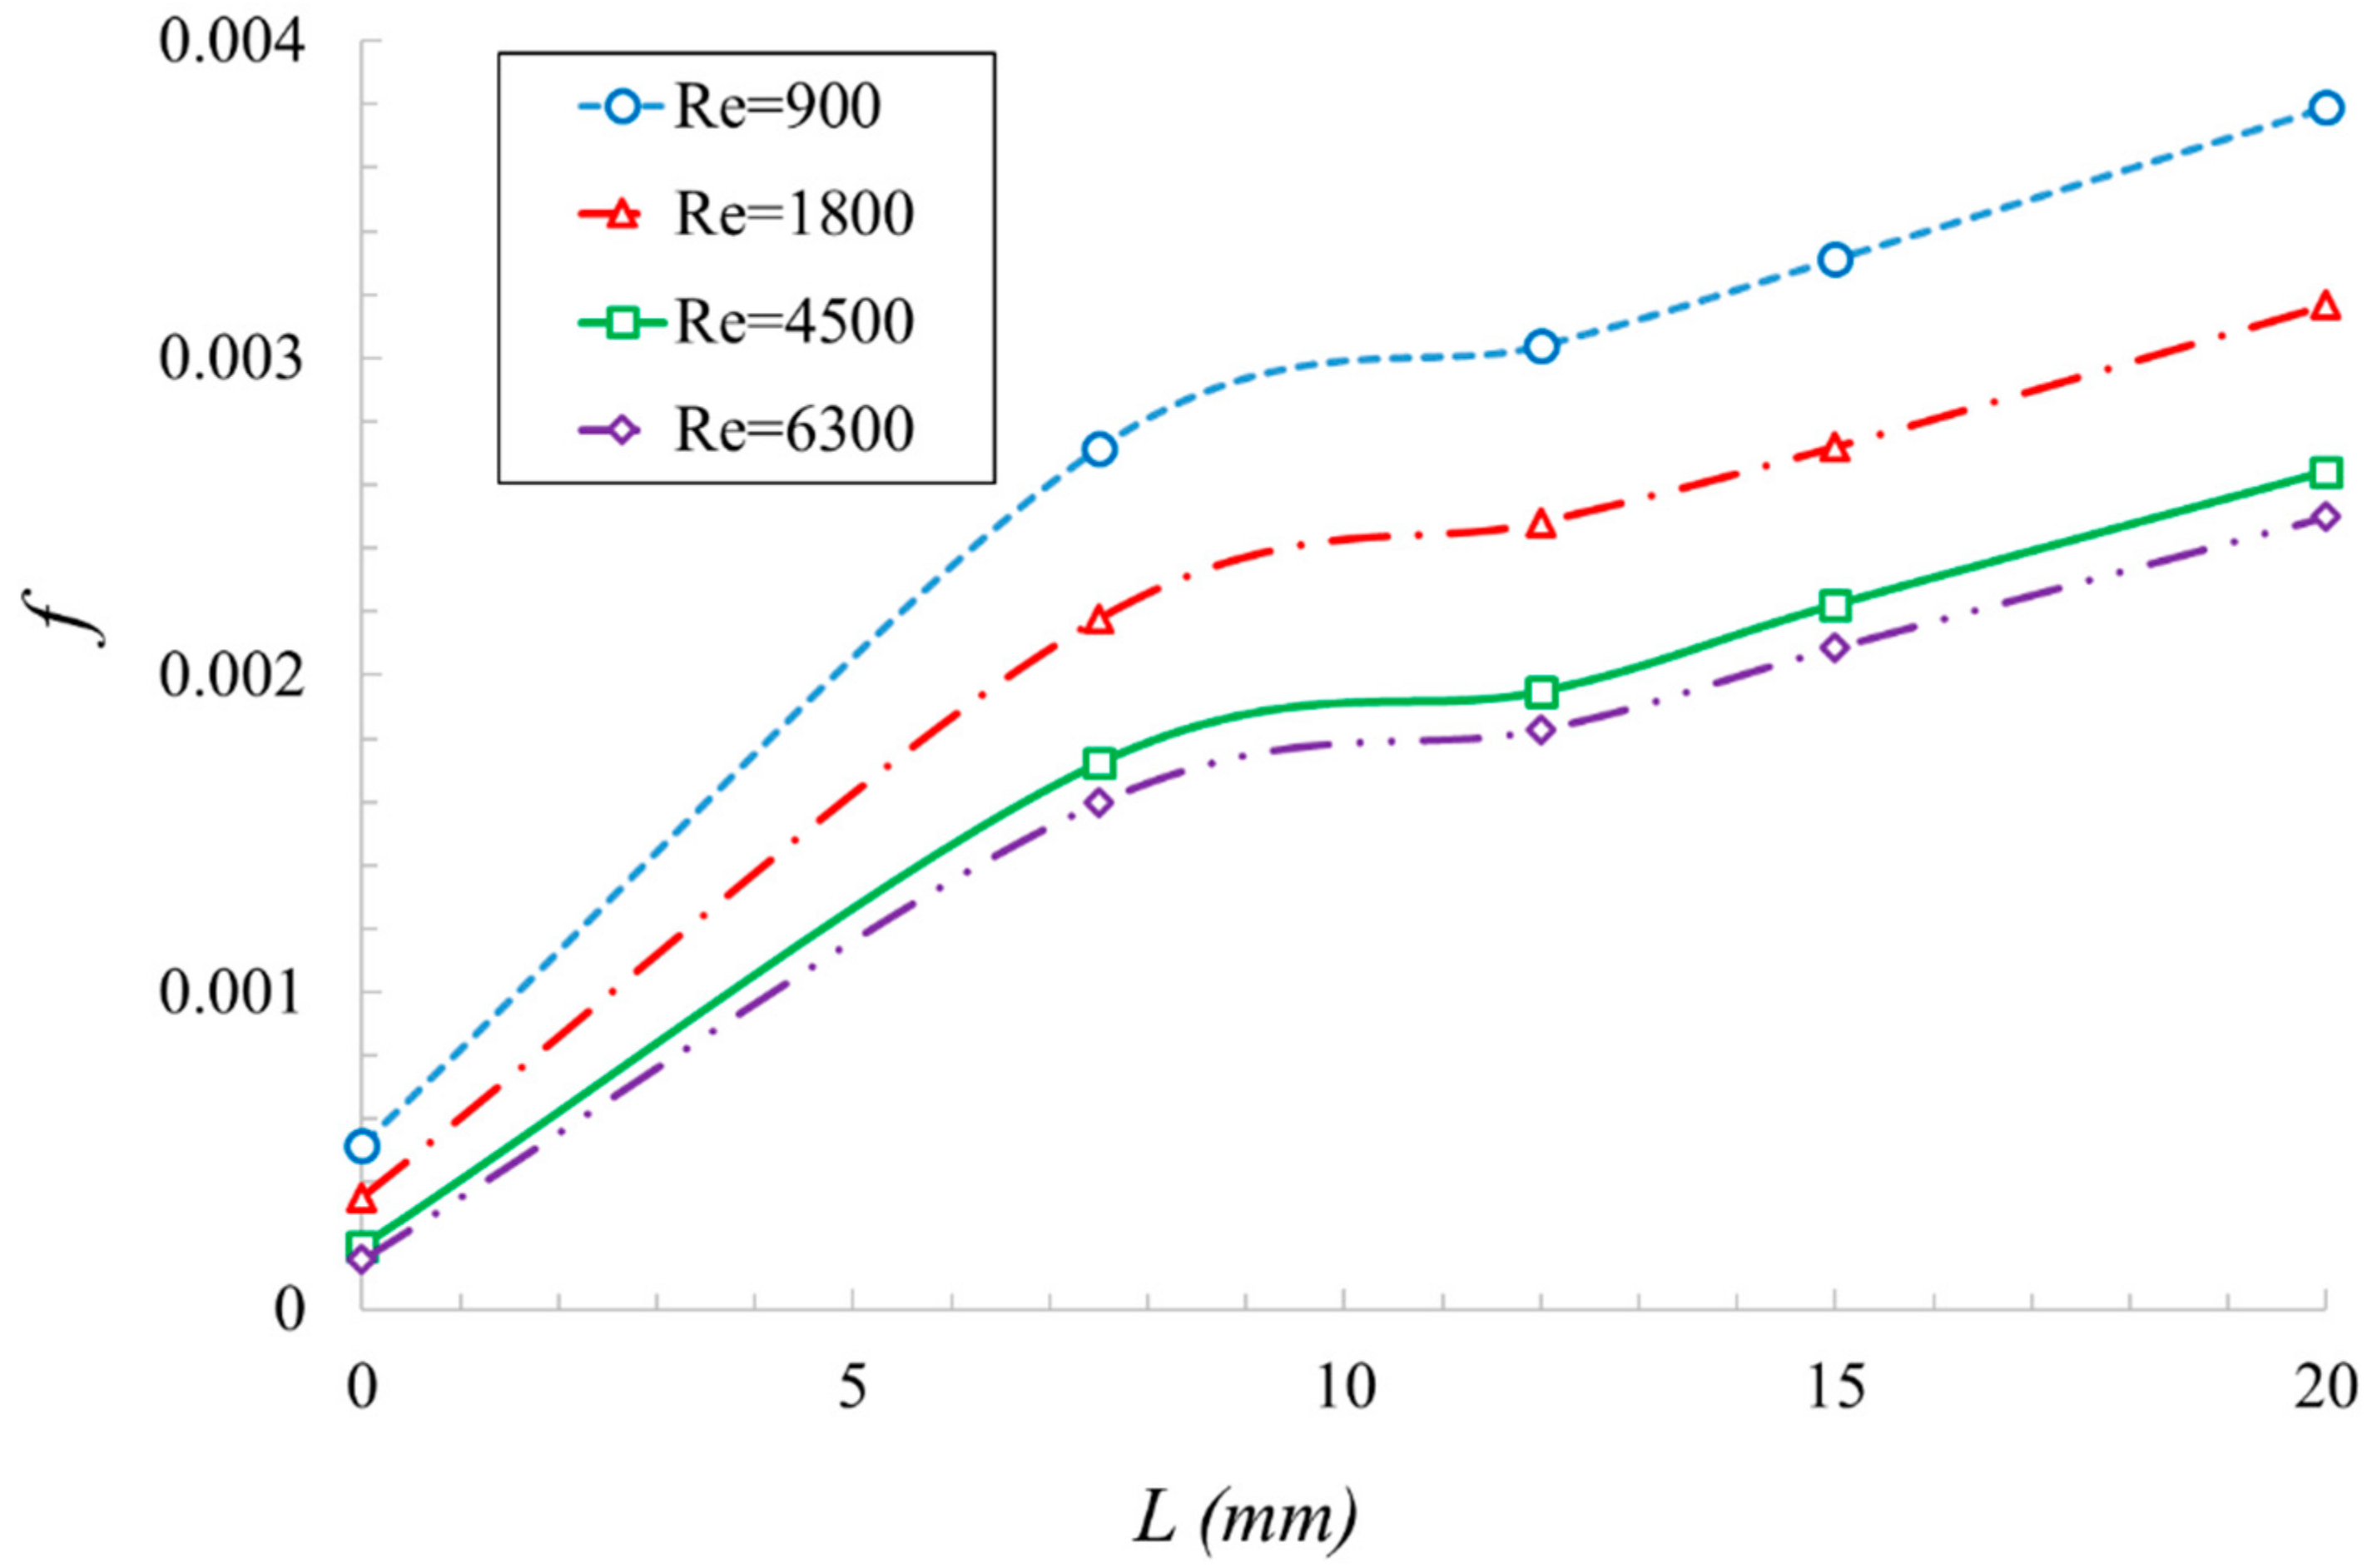
To isolate and examine the effect of the HST on the absorber tube, oil is set as the working fluid for the results presented in this section. As expected, the width of the screw tape has a direct impact on the pressure drop, and consequently the friction factor (Figure 9). Its width determines the portion of the tube that has a blockage effect on the passing fluid. By increasing the L parameter, the area between the tape edge and the tube wall decreases, which results in an increase of the mean velocity in that empty region and consequently leads to the growth of the velocity gradient. Higher velocity gradients enhance the shear stress and friction factor as well. It is observed that by increasing the screw tape width from 7.5 to 20 mm (by 167%), the friction factor increases between 39.5 and 56.4% for Reynolds numbers of 900 and 6300, respectively. Moreover, according to the results, increasing the tape width affects the friction factor almost linearly; however, a drastic jump in the f parameter occurs due to the addition of even the smallest tape (compared to the plain tube).
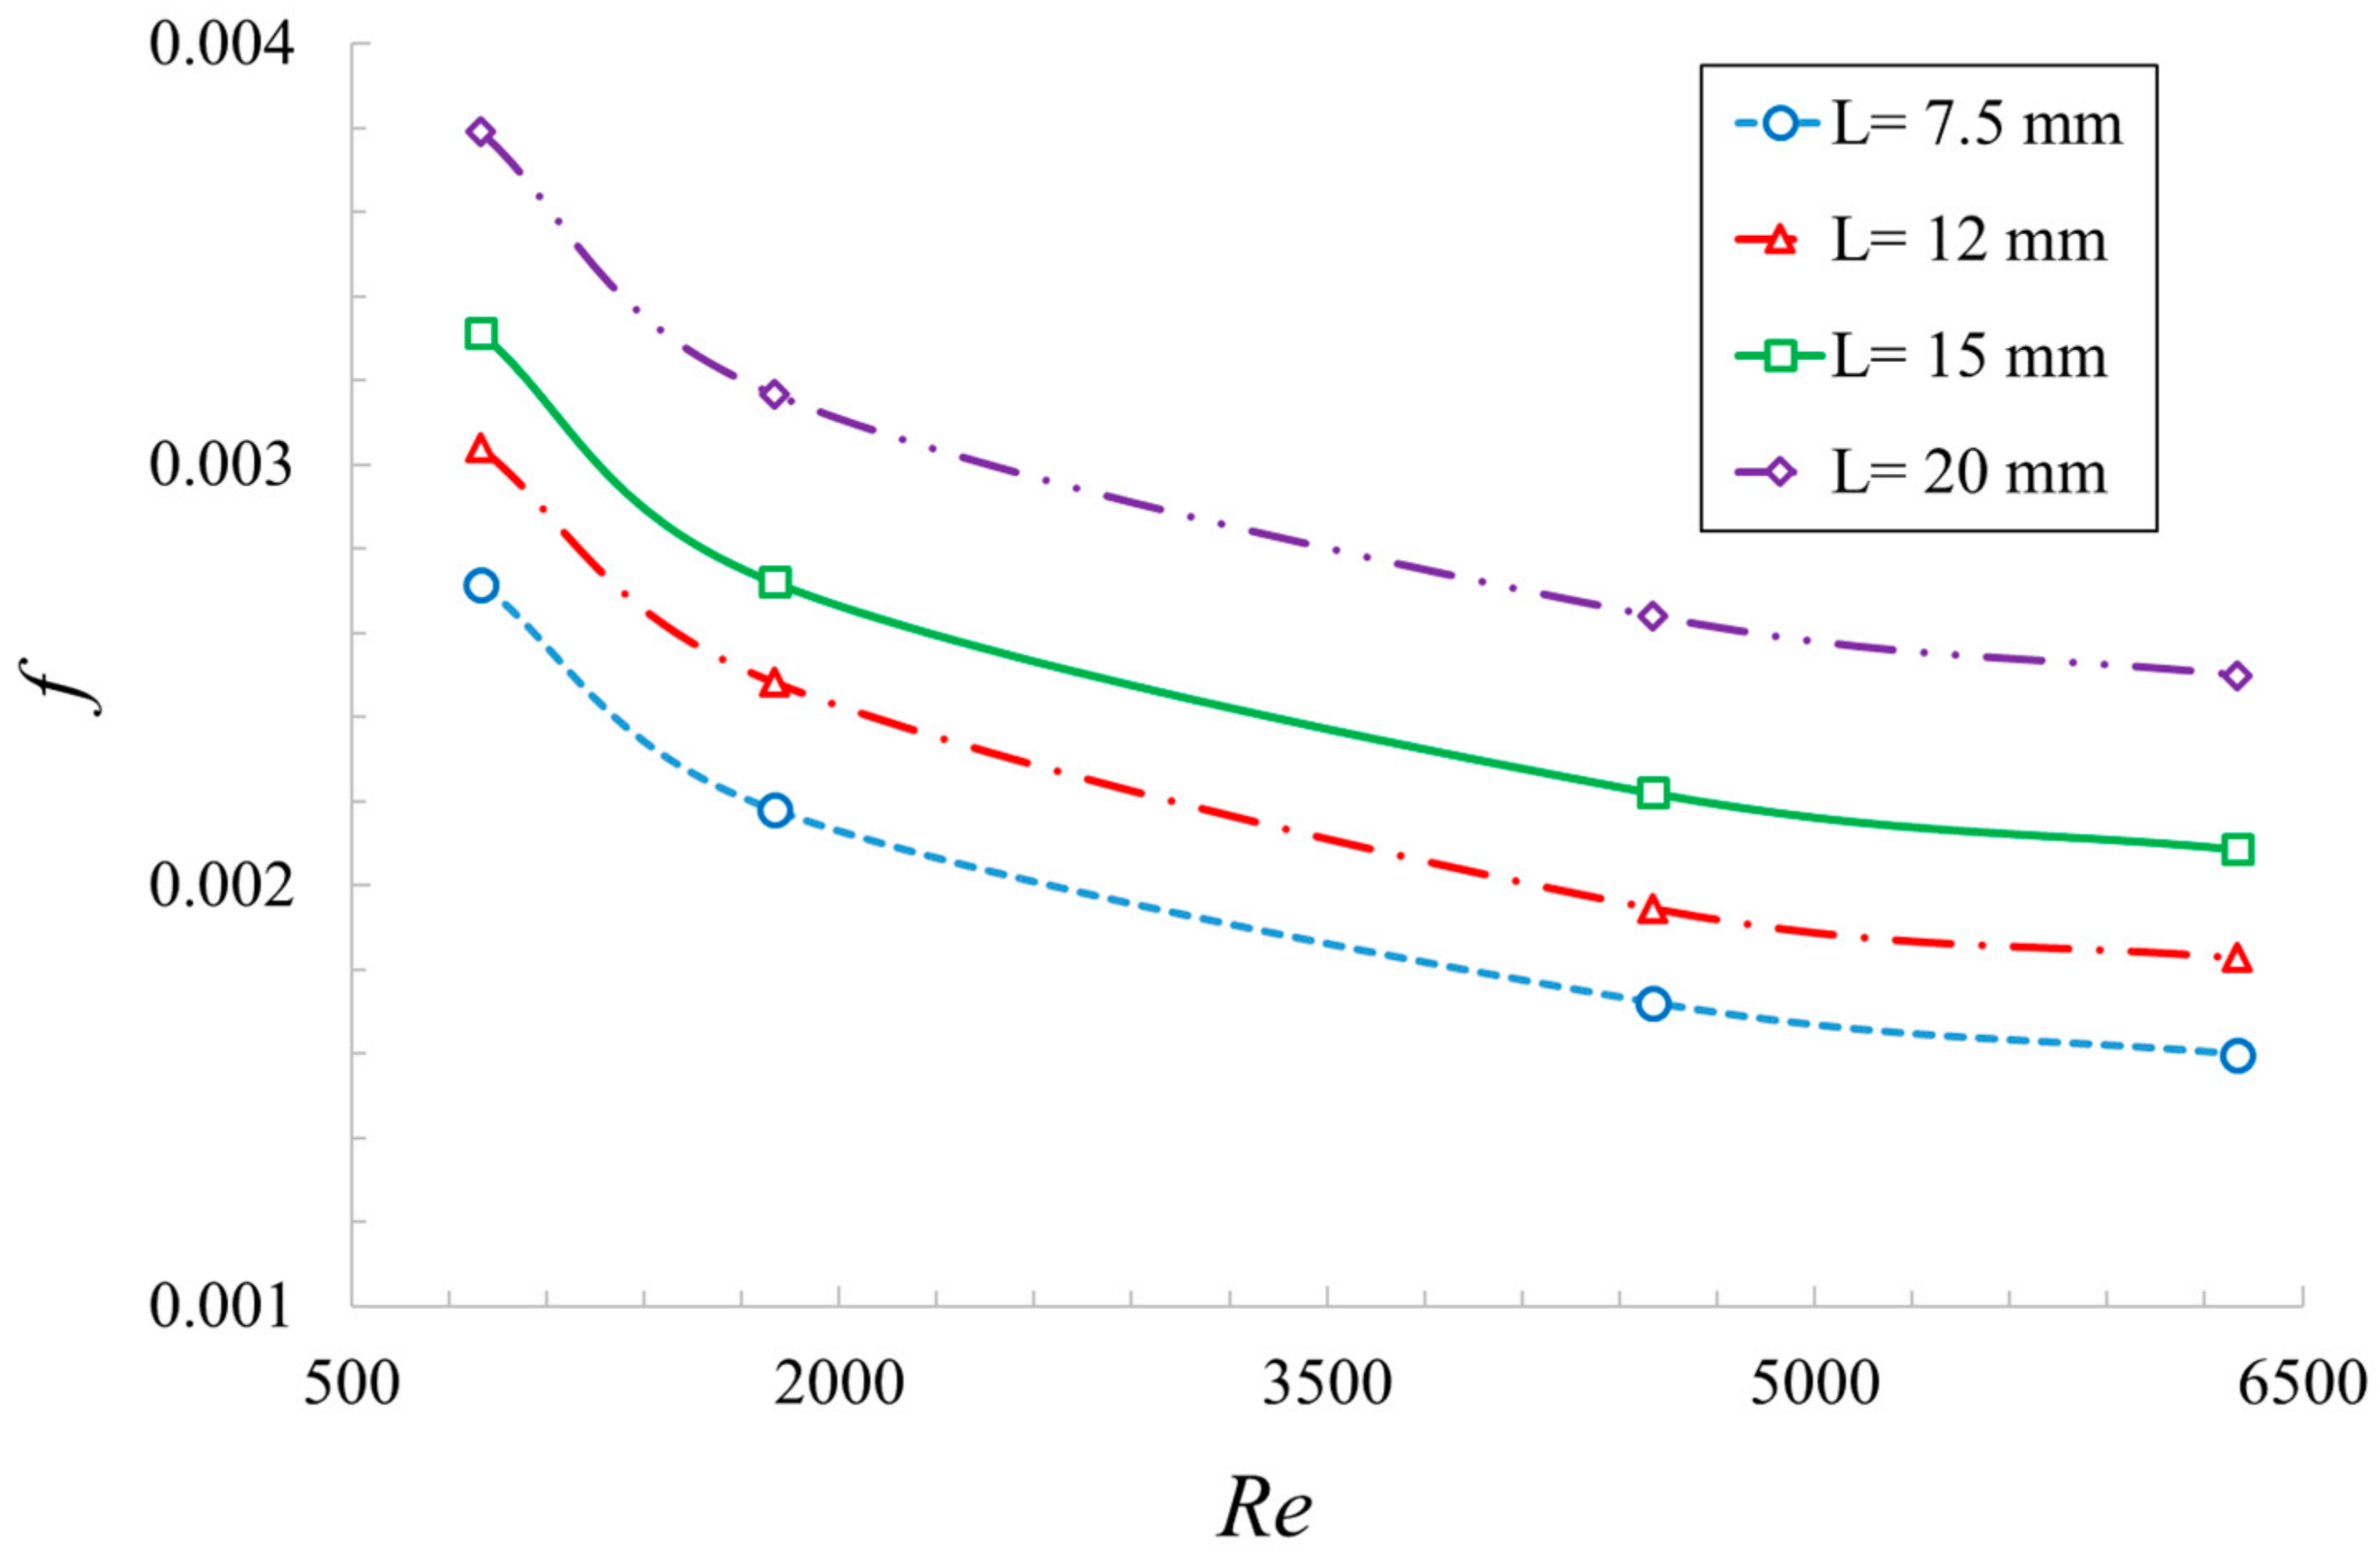
The effect of Re on the friction factor parameter is shown in Figure 10. It is observed that by increasing Re, the friction factor variational trend decreases. The reduction of the friction factor with Re is more rapid at low Re, and reaches asymptotic behavior at higher Re. To be more specific, the friction factor is decreased by about 16.4~19.8% by increasing Re from 900 to 1800, while the same reduction is limited to 5.3~7.1% for an Re increase from 4500 to 6300. Additionally, it should be added that since the pressure drop is related to mean velocity squared, an increasing trend for the pressure drop is also perceptible in Figure 10. A similar trend was also reported by [25].
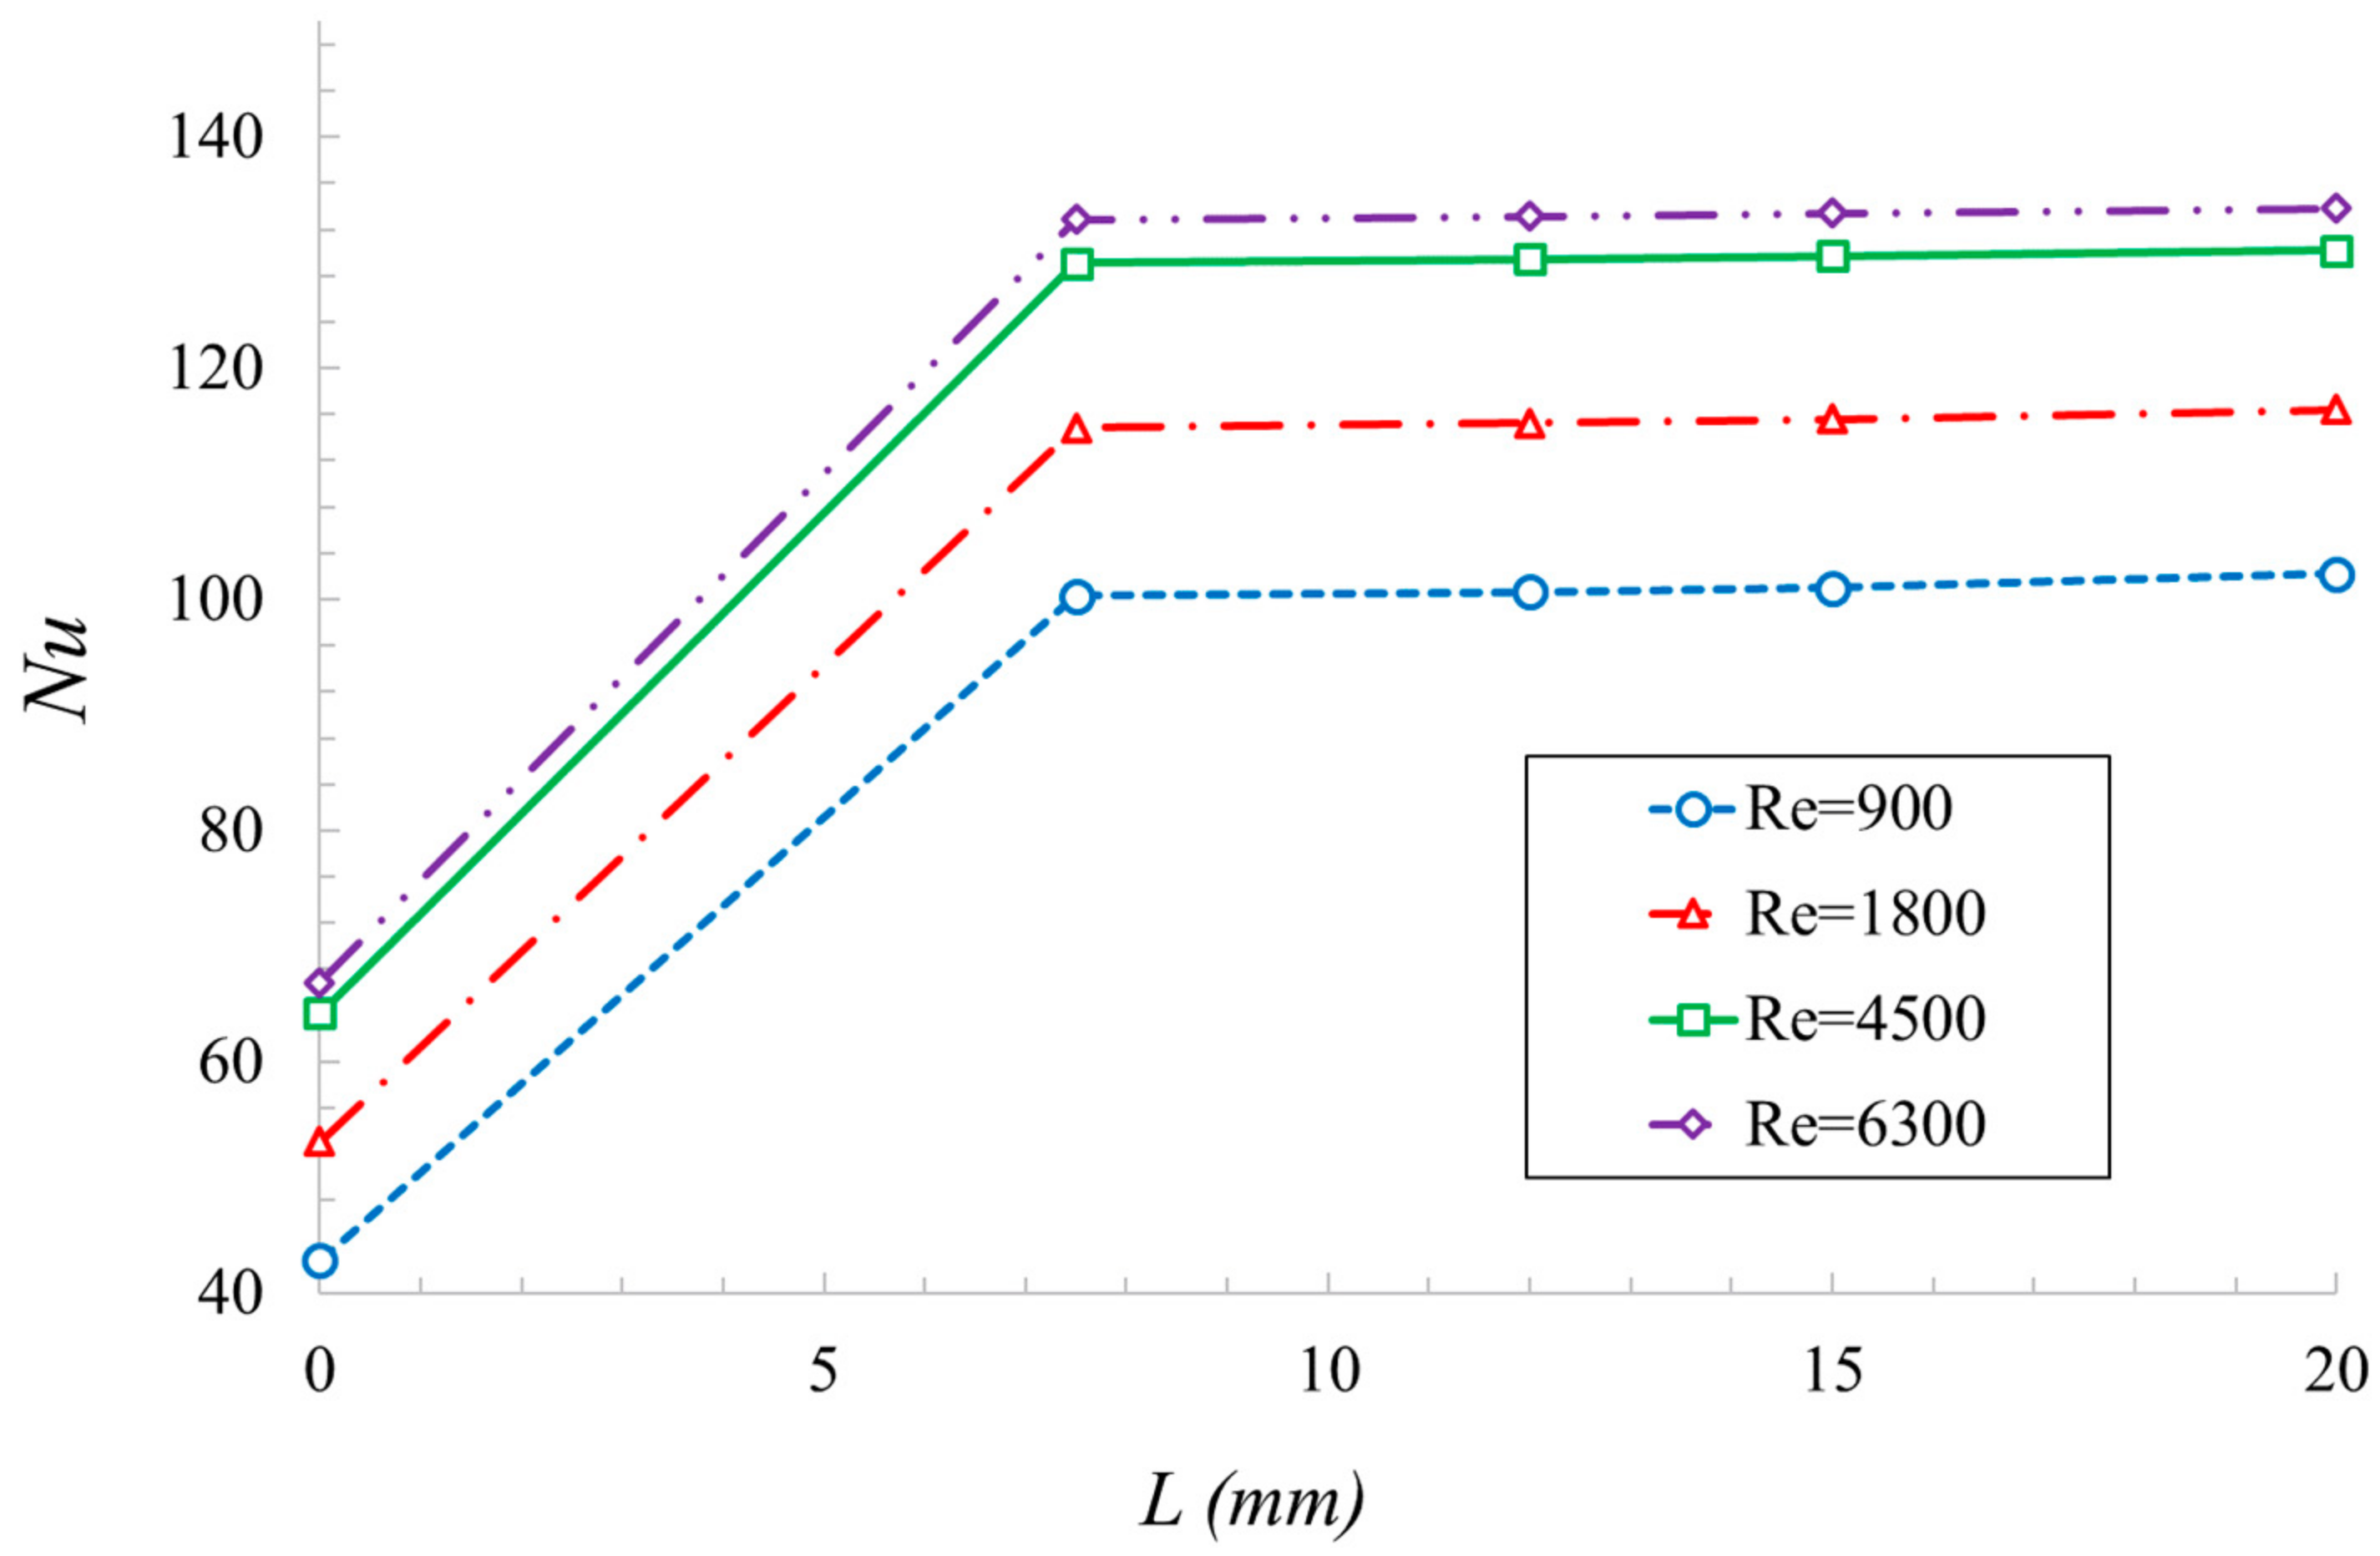
The effect of HST insertion inside the plain tube on Nu variations is shown in Figure 11 as a function of the L parameter. It is observed that regardless of the magnitude of its width, tape insertion significantly increases convection heat transfer. This is due to the swirl created by the tape, which circulates the hot fluid from the irradiation-absorbing side to the other side of the tube and replaces it with the low-temperature fluid. A uniform thermal field is thus obtained within the tube, and the thermal performance of the absorbing tube is improved. Nu is rapidly increased by 100.1~138.5% due to the insertion of a screw tape in comparison to a plain tube. However, it should be noted that the width of the tape has only a minor impact on the thermal performance of the tube (i.e., the maximum improvement of Nu by increasing L from 7.5 mm to 20 mm is only 0.72~1.89%).
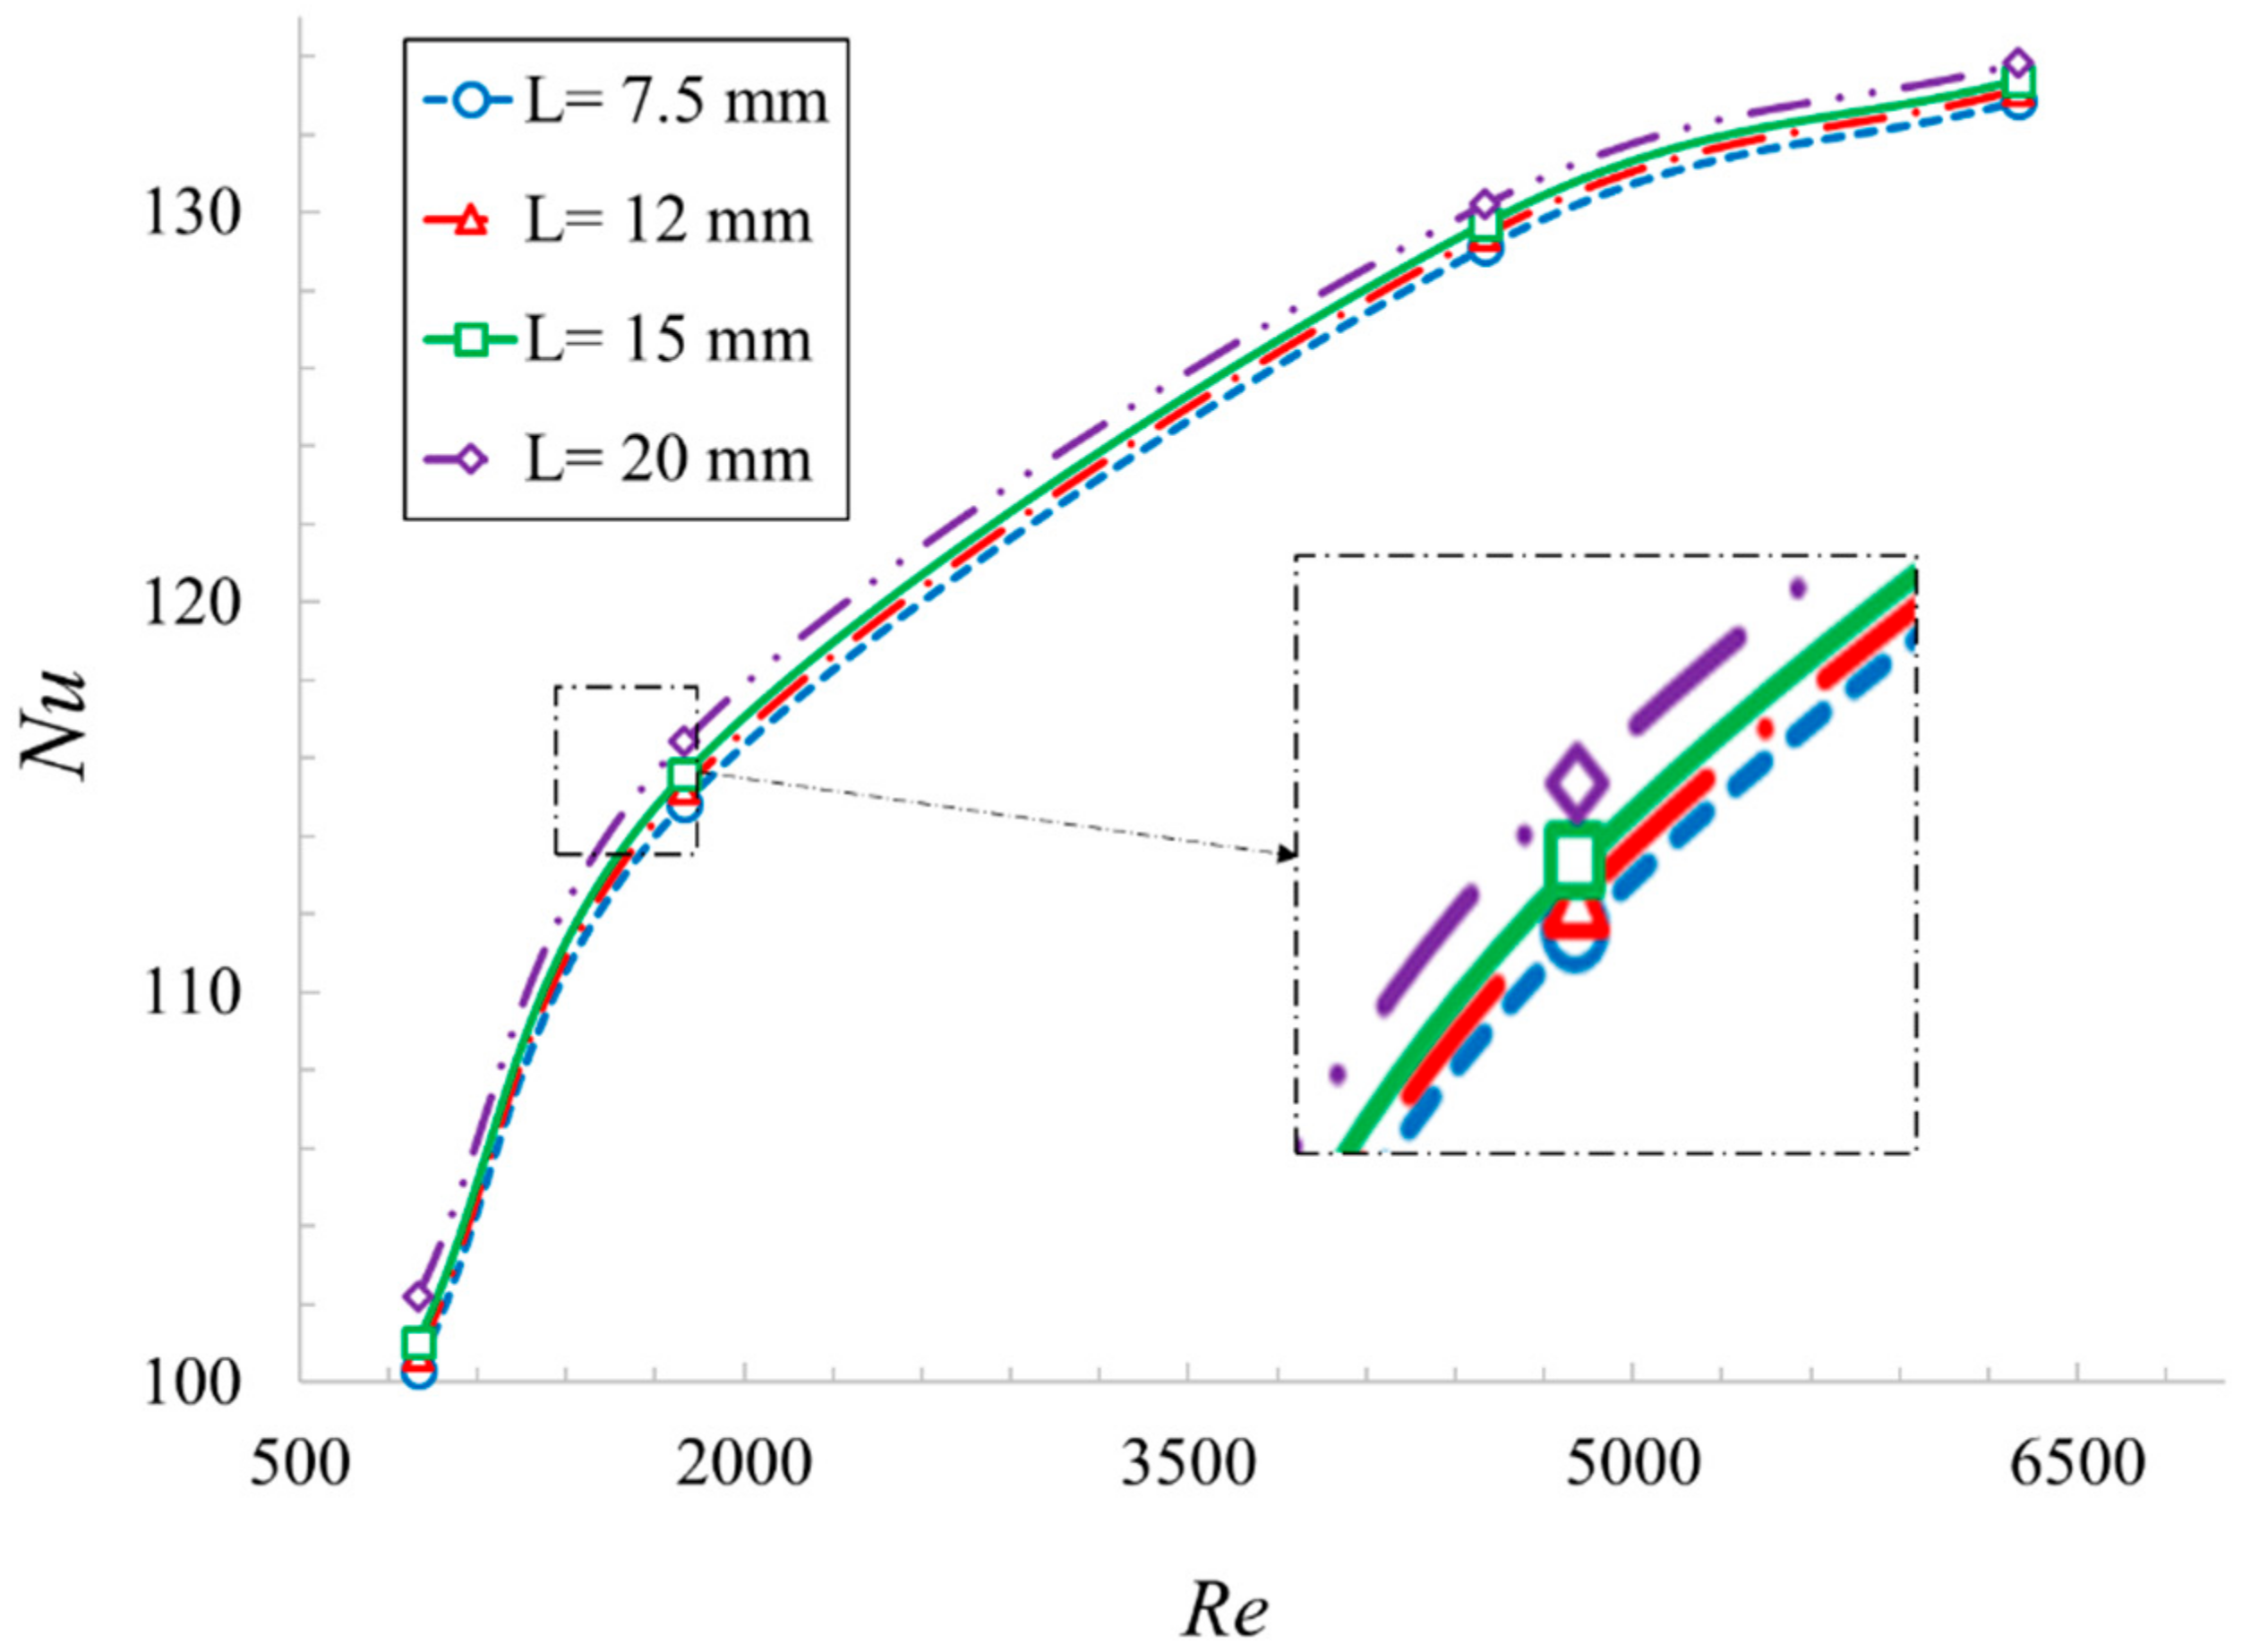
The effect of Re on heat transfer performance is also depicted in Figure 12. It is observed that Nu is directly related to the fluid mean velocity. The enhancement of convective heat transfer by increasing fluid velocity is due to two major reasons, namely, improvement of the flow swirl and turbulence mixing near the hot wall. However, as is obvious, the Nu improvement with Re is not linear, and higher heat transfer enhancement is observed near the low range of Re. Similar behavior was also reported by [26].
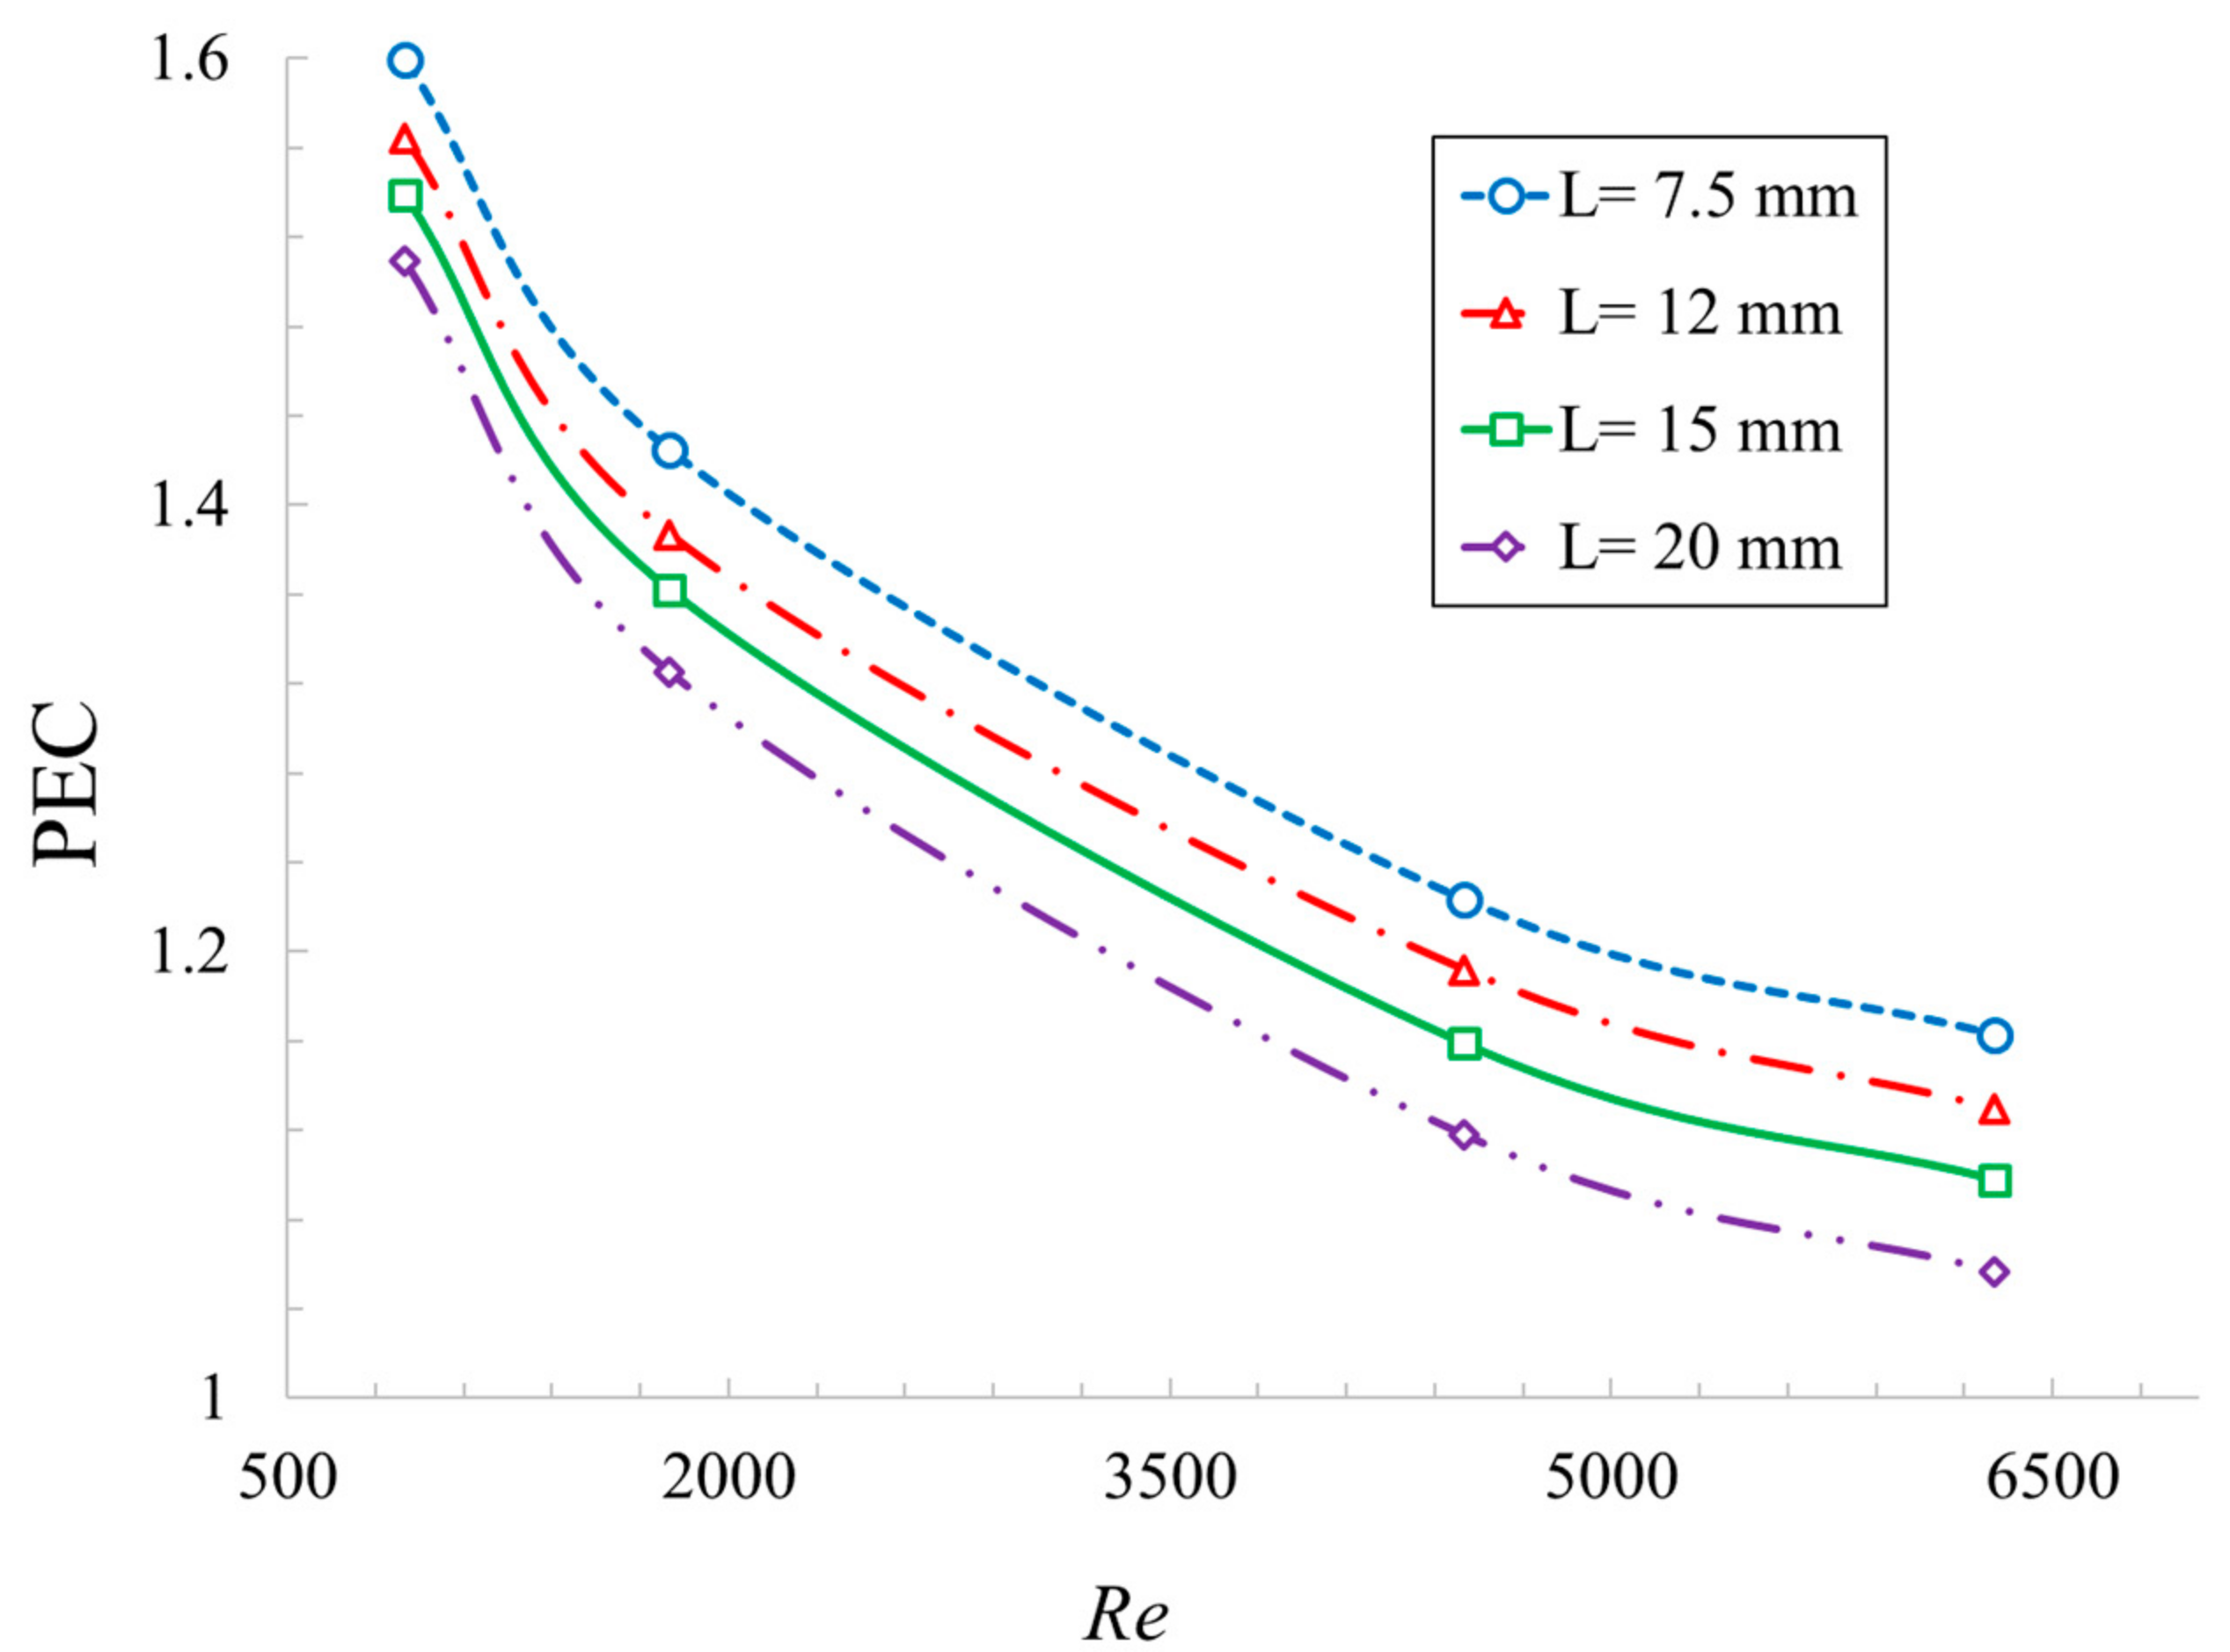
The PEC number can be utilized to combine the inversely related effects of HST insertion (i.e., heat transfer and pressure drop). A higher PEC means a higher heat transfer coefficient in conjunction with lower pressure drops. According to the definition of the PEC, if the screw tape is removed, the PEC reverts to a value of 1. The effect of Re on the PEC is illustrated in Figure 13. It is observed that as the Re number is increased, the PEC is reduced significantly. This is due to the faster growth of the friction factor in comparison to heat transfer by increasing the mass flow rate. In other words, by increasing Re from 900 to 6300, the PEC is reduced 27.2~30.0% for all of the studied widths. It should be added that the reduction rate of PEC due to Re is more significant at lower values of Re and decreases gradually for higher values of Re.
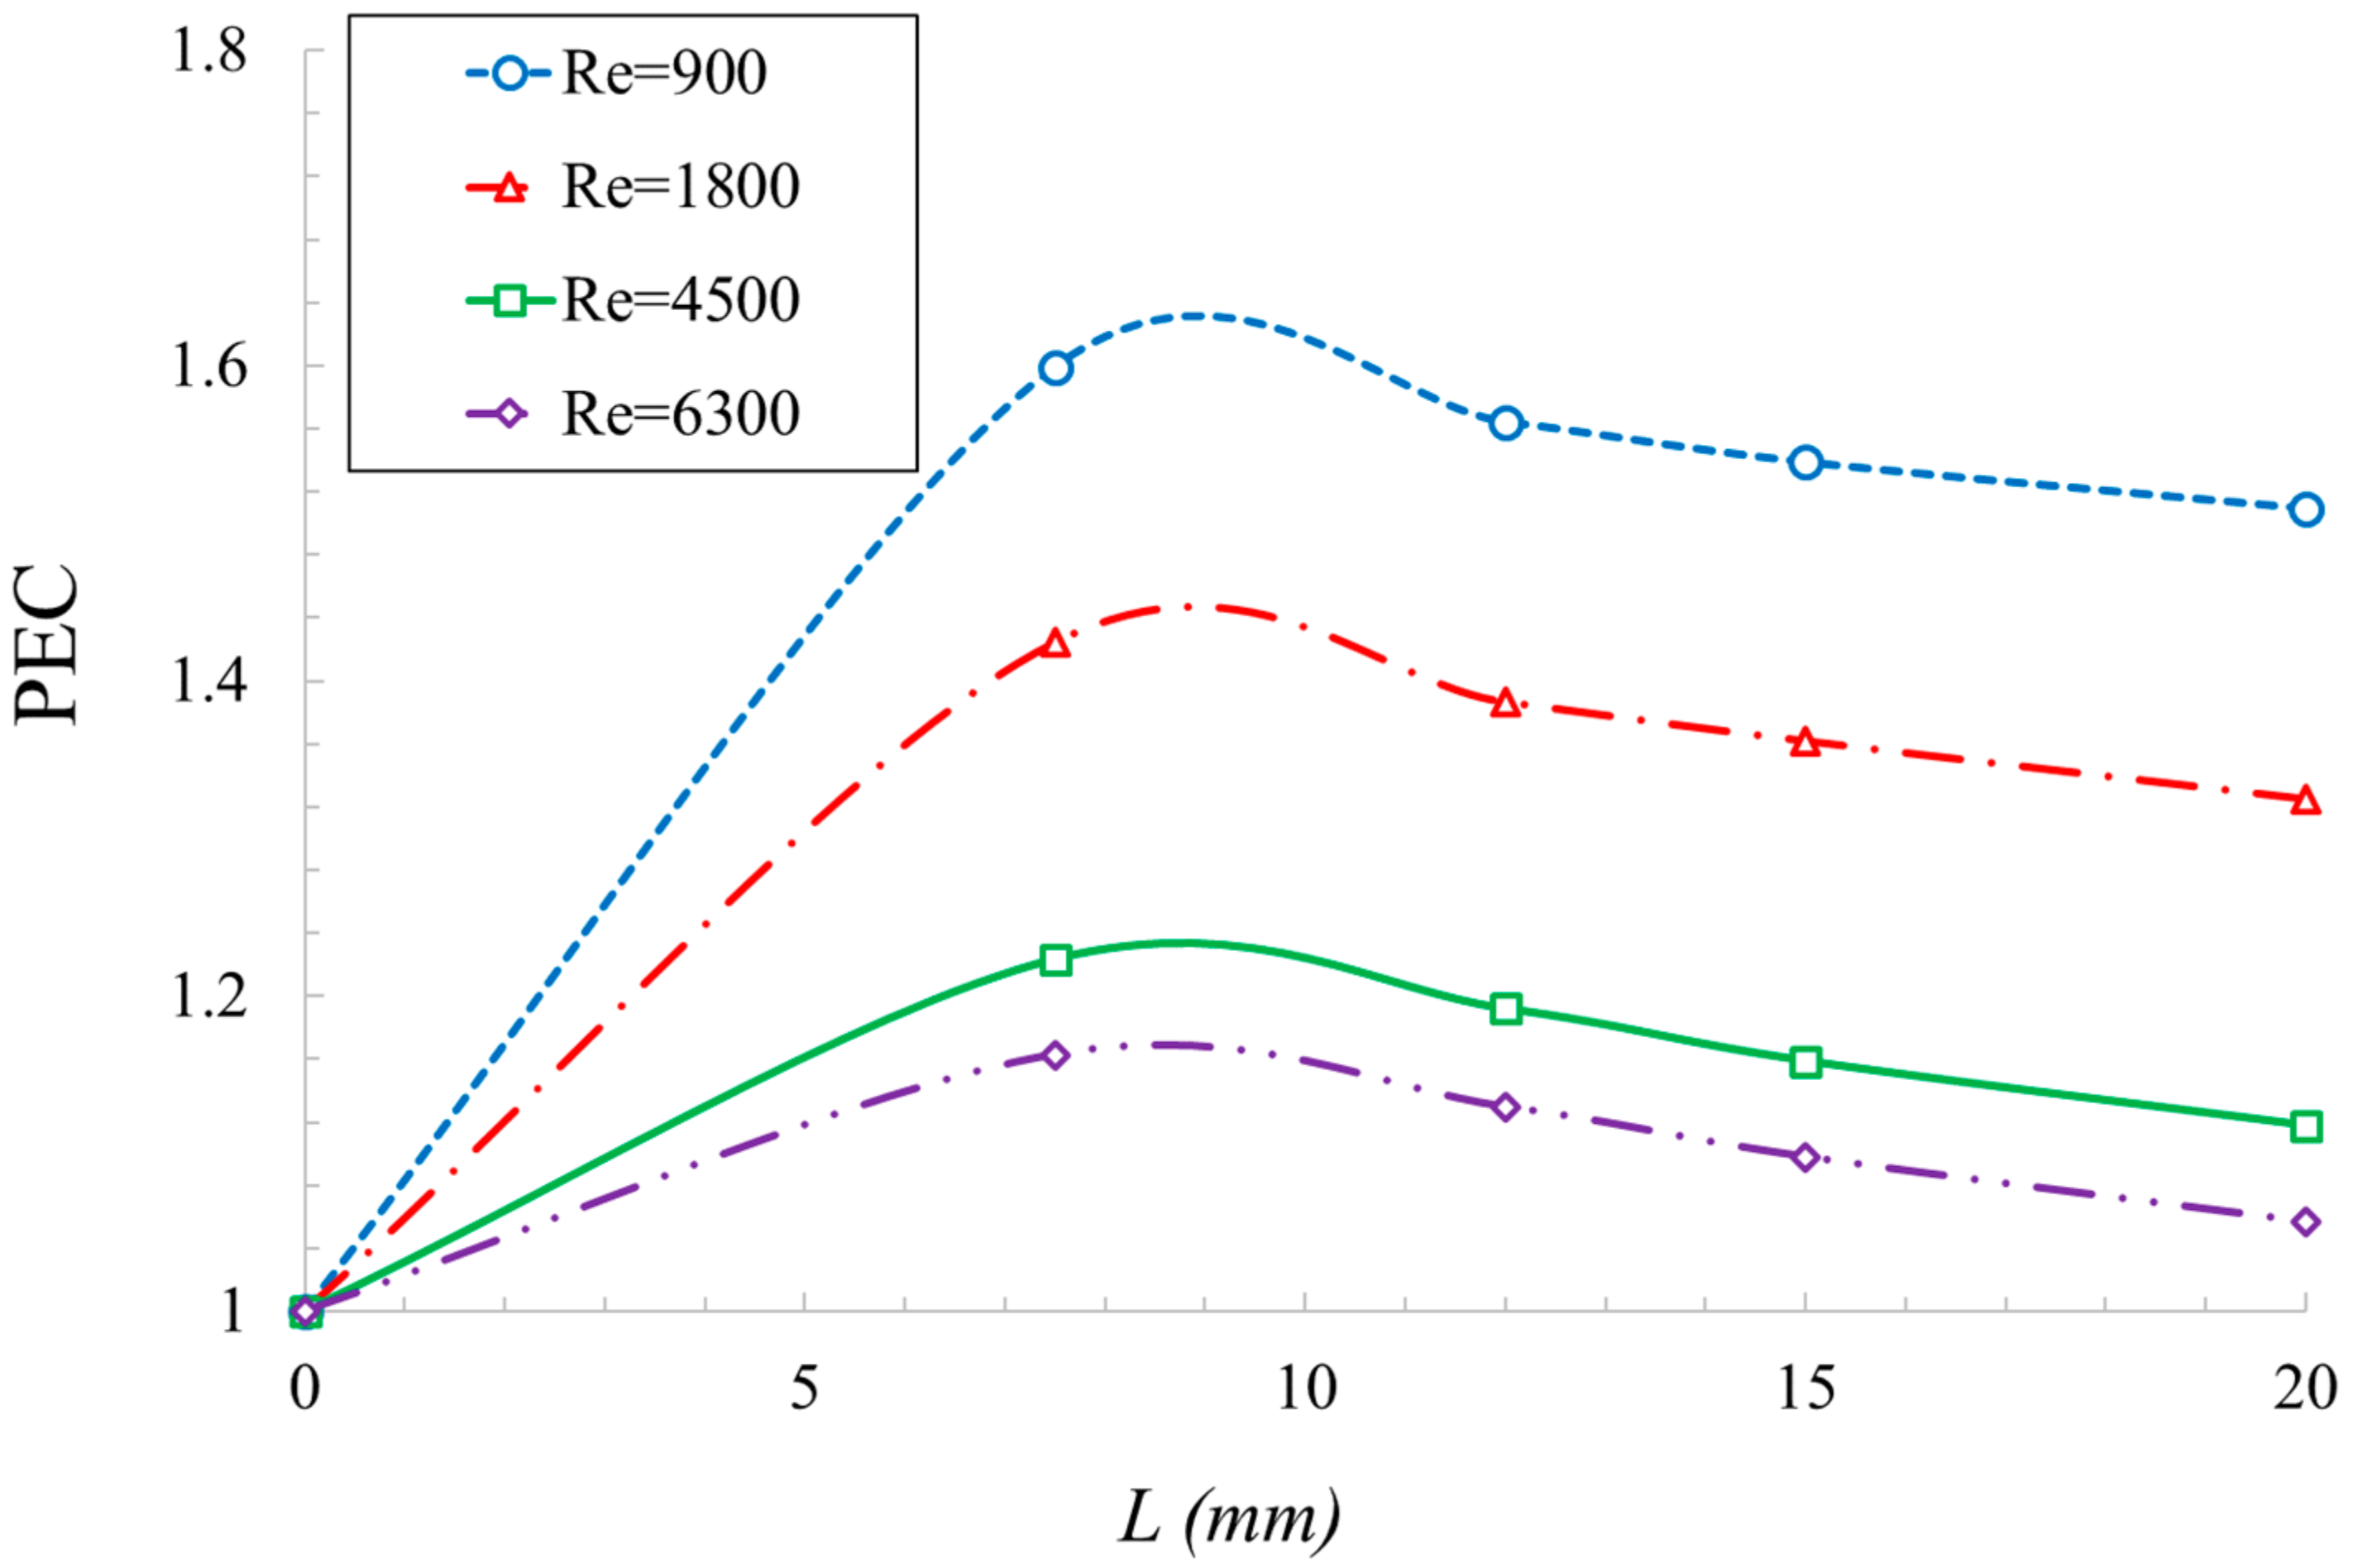
Figure 14 also shows the effect of tape width on the PEC. By increasing the L parameter, the heat transfer is improved slightly; however, its negative impact on the pressure drop along the tube leads to an overall reduction in the PEC number. By utilization of wider tapes within the tube, the PEC is reduced from 5.6 to 9.1% for Re values of 900 and 6300, respectively. Moreover, focusing on the decreasing trend of the PEC with L, it is concluded that increasing L beyond a specific value might result in PEC values below 1, meaning that the insertion of the PEC not only has no improvement effect in comparison to the empty tube, but also reduces performance regarding the combination effect of pressure drop and heat transfer. Therefore, among all the studied cases, it is concluded that the case with Re = 900 and L = 7.5 mm has the best performance considering both heat transfer and pressure drop effects.

3.3. Nanofluid Simulation

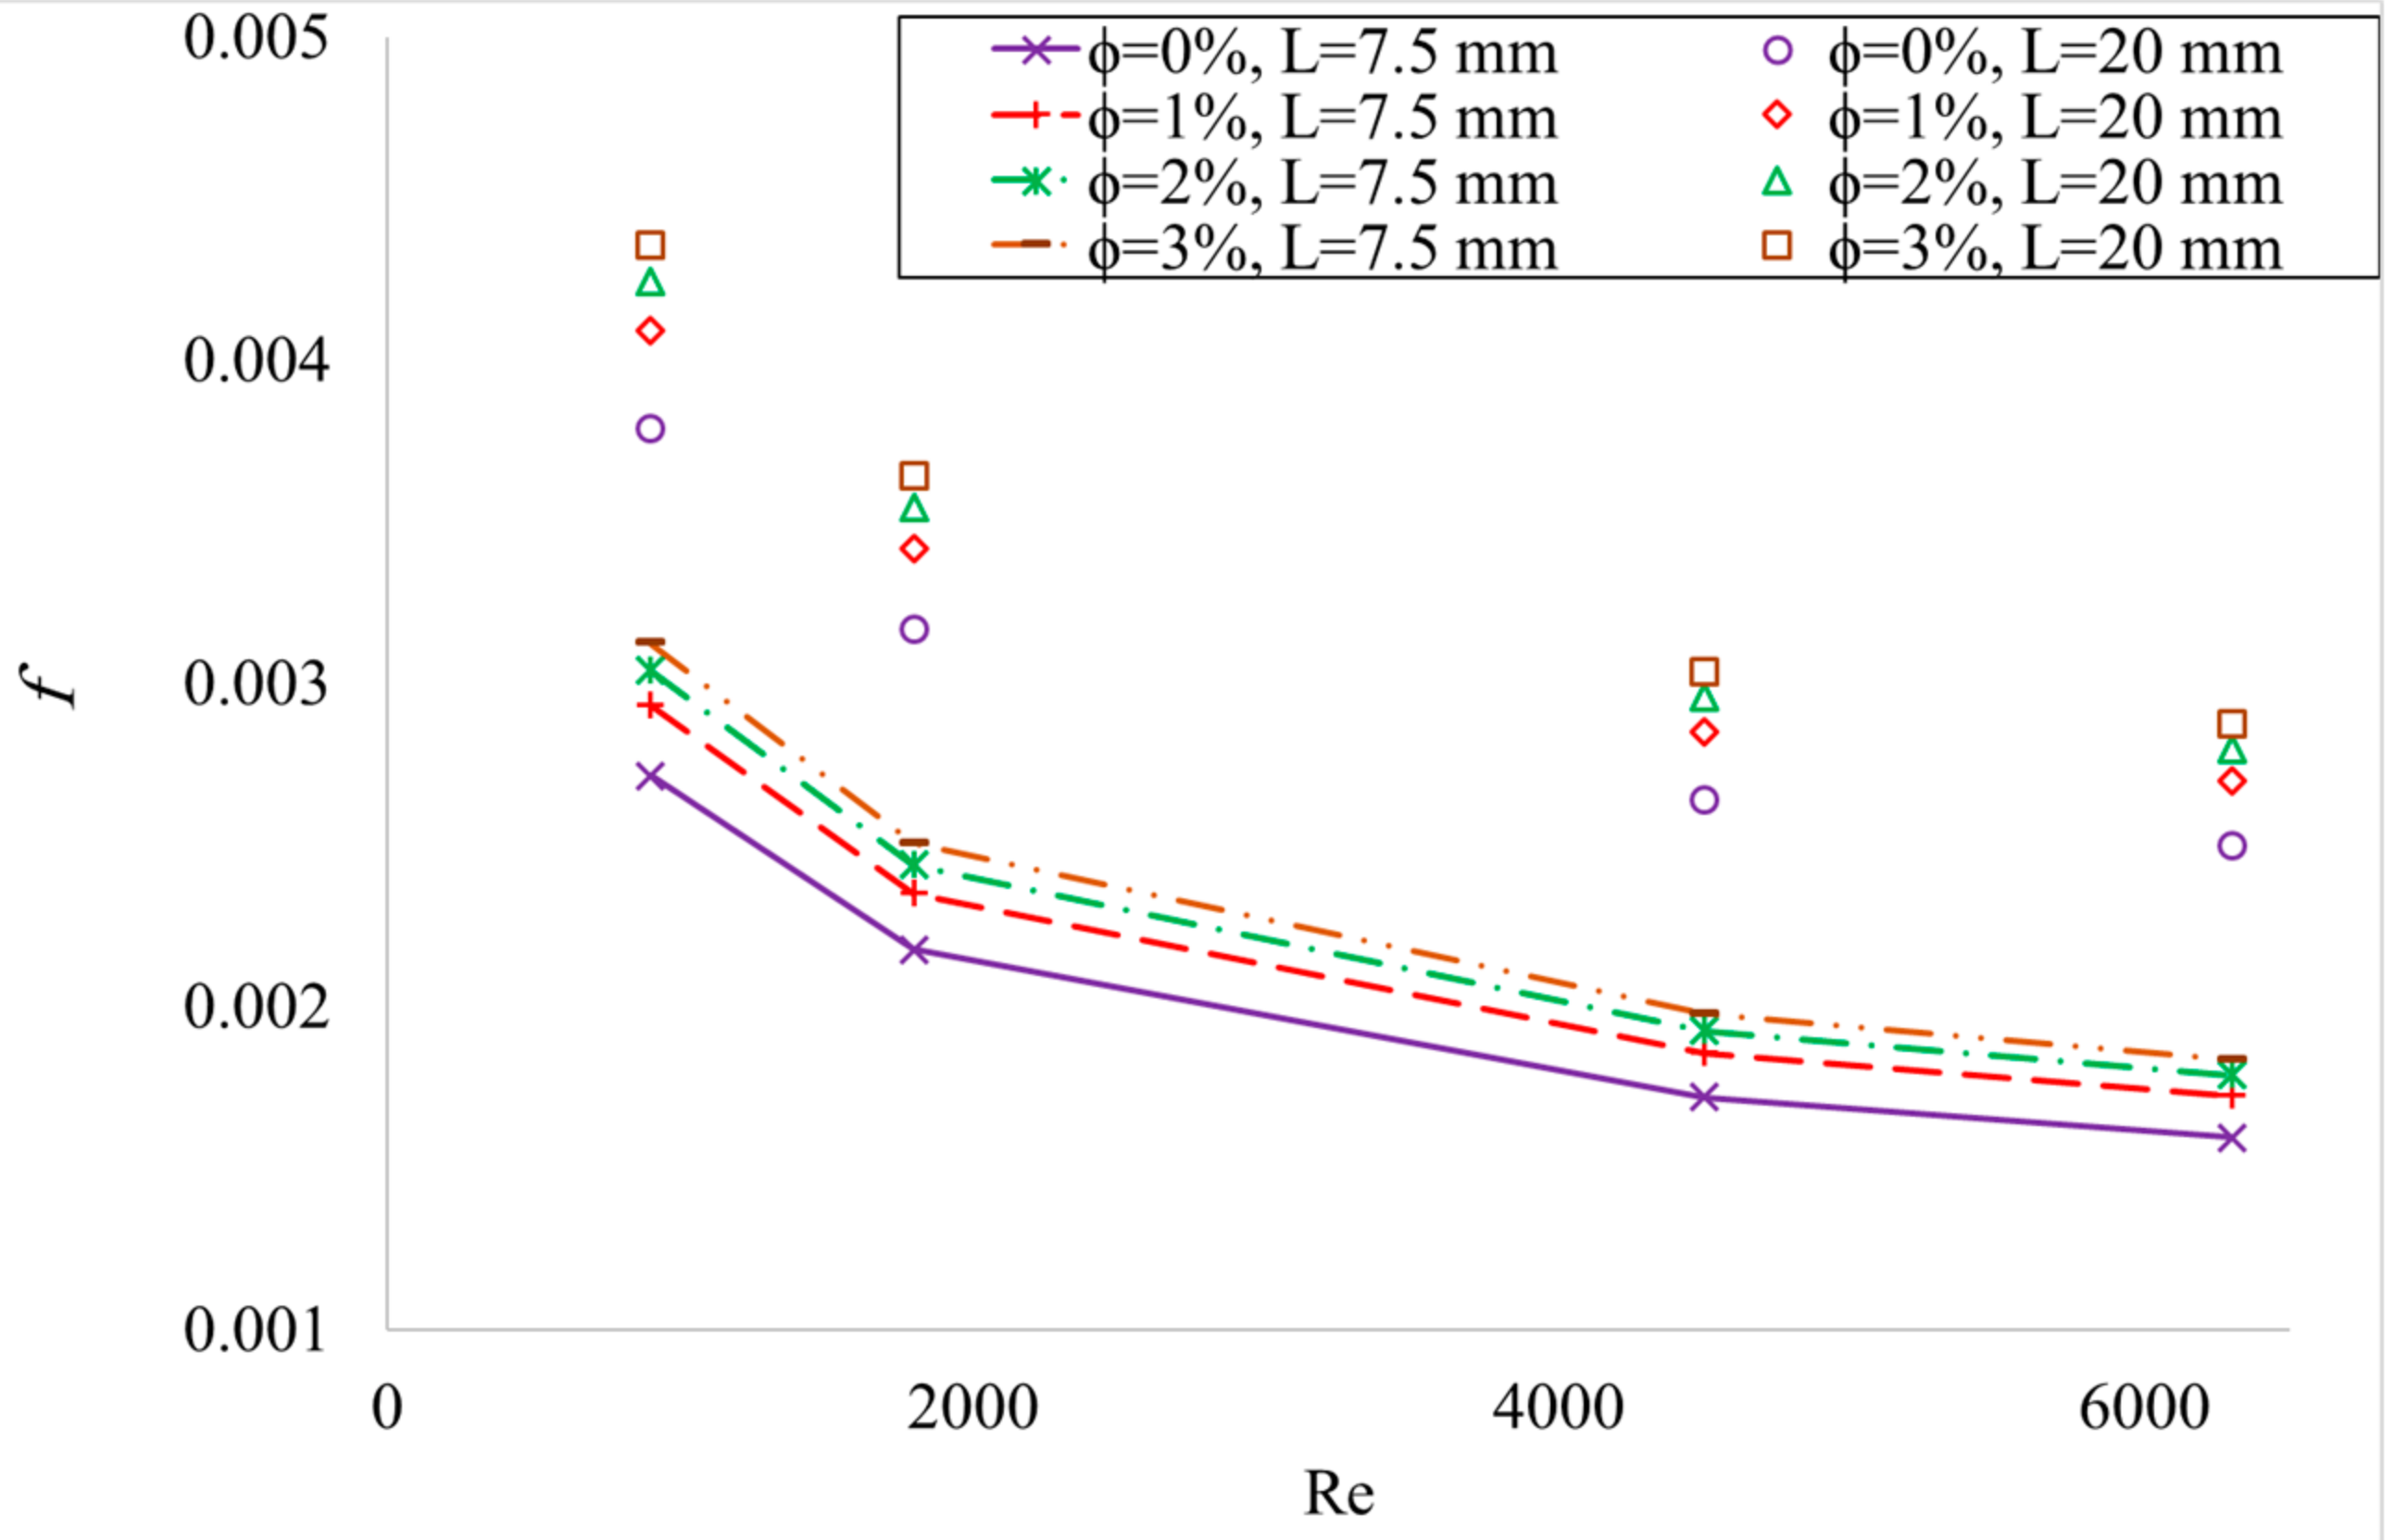
The variation of the friction factor vs. Re for different NP concentrations at two extreme values of tape width (i.e., 7.5 mm and 20 mm) is shown in Figure 15. The volume fraction of nanoparticles is increased from zero (pure oil) to 3%. Similar to the discussed trend of friction factor variations vs. Re for pure oil (Figure 10), a decrease is also observed in the pressure drop in the cases using nanofluid. In addition to the three main reasons for pressure drop in tubes with swirl tape inserts (i.e., reduction of flow passage area, growth of the contact area and velocity swirl), the addition of nanosized particles boosts the pressure drop magnitude. According to the results, the addition of NPs has more impact on the pressure drop at lower Re. The highest friction factor, which occurred for the widest tape at φ = 3%, is 74% more than the lowest f for the same configuration with pure oil. However, the increase in pressure drop and pumping power is not the only effect of the addition of nanoparticles to the working fluid. The improvement in the heat transfer should also be studied.
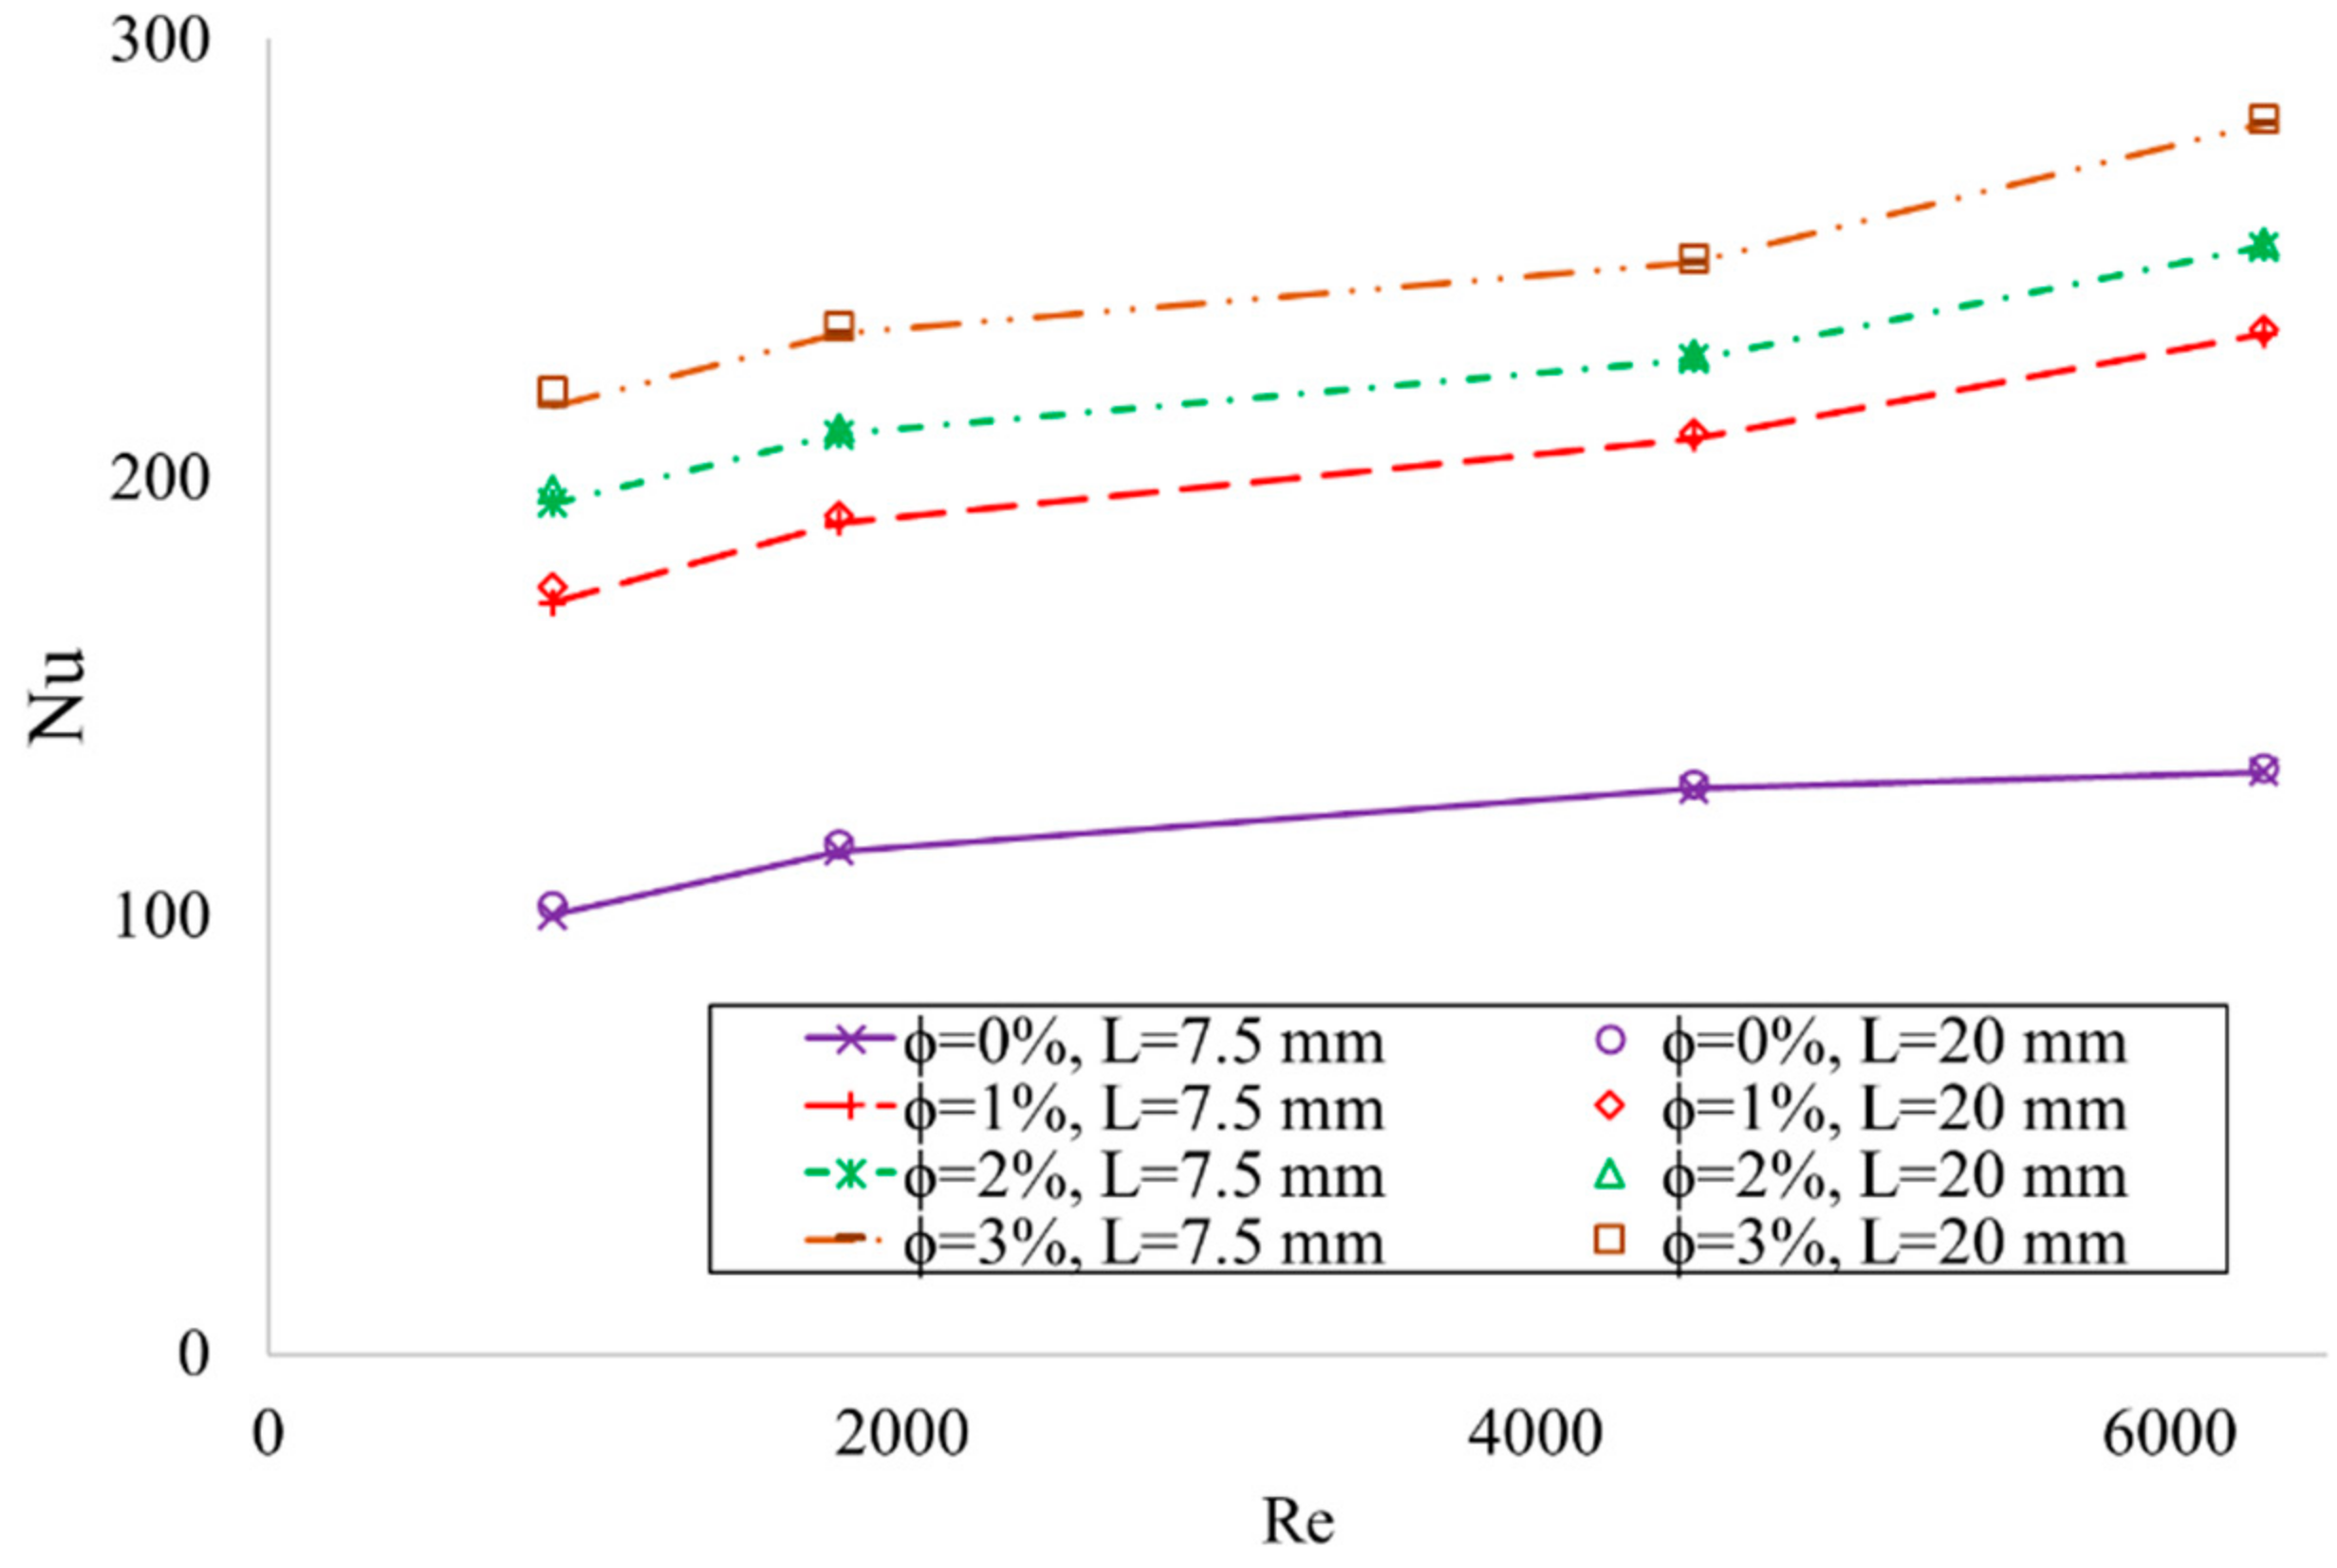
The effect of nanoparticle concentration on Nu at two tape widths for various flow rates is illustrated in Figure 16. It is observed that the addition of nanoparticles can effectively improve the heat transfer properties of the main fluid. In other words, the addition of 3% nanoparticles can increase Nu above 100% for various values of Re. However, similar to the conclusion made based on Figure 11 regarding the effect of tape width on the heat transfer, it is also concluded that no significant Nu improvement is obtained by widening the HST for nanofluids. The variational trend of Nu vs. Re is another principal difference between the pure and nanofluid cases. For pure oil, it is observed that by increasing Re, Nu asymptotes to a constant level, but for the nanofluid, sharp Nu growth is observed for Re values higher than 4500. Therefore, it is concluded that the highly swirled fluid, in combination with the conductive particles, can boost thermal performance.
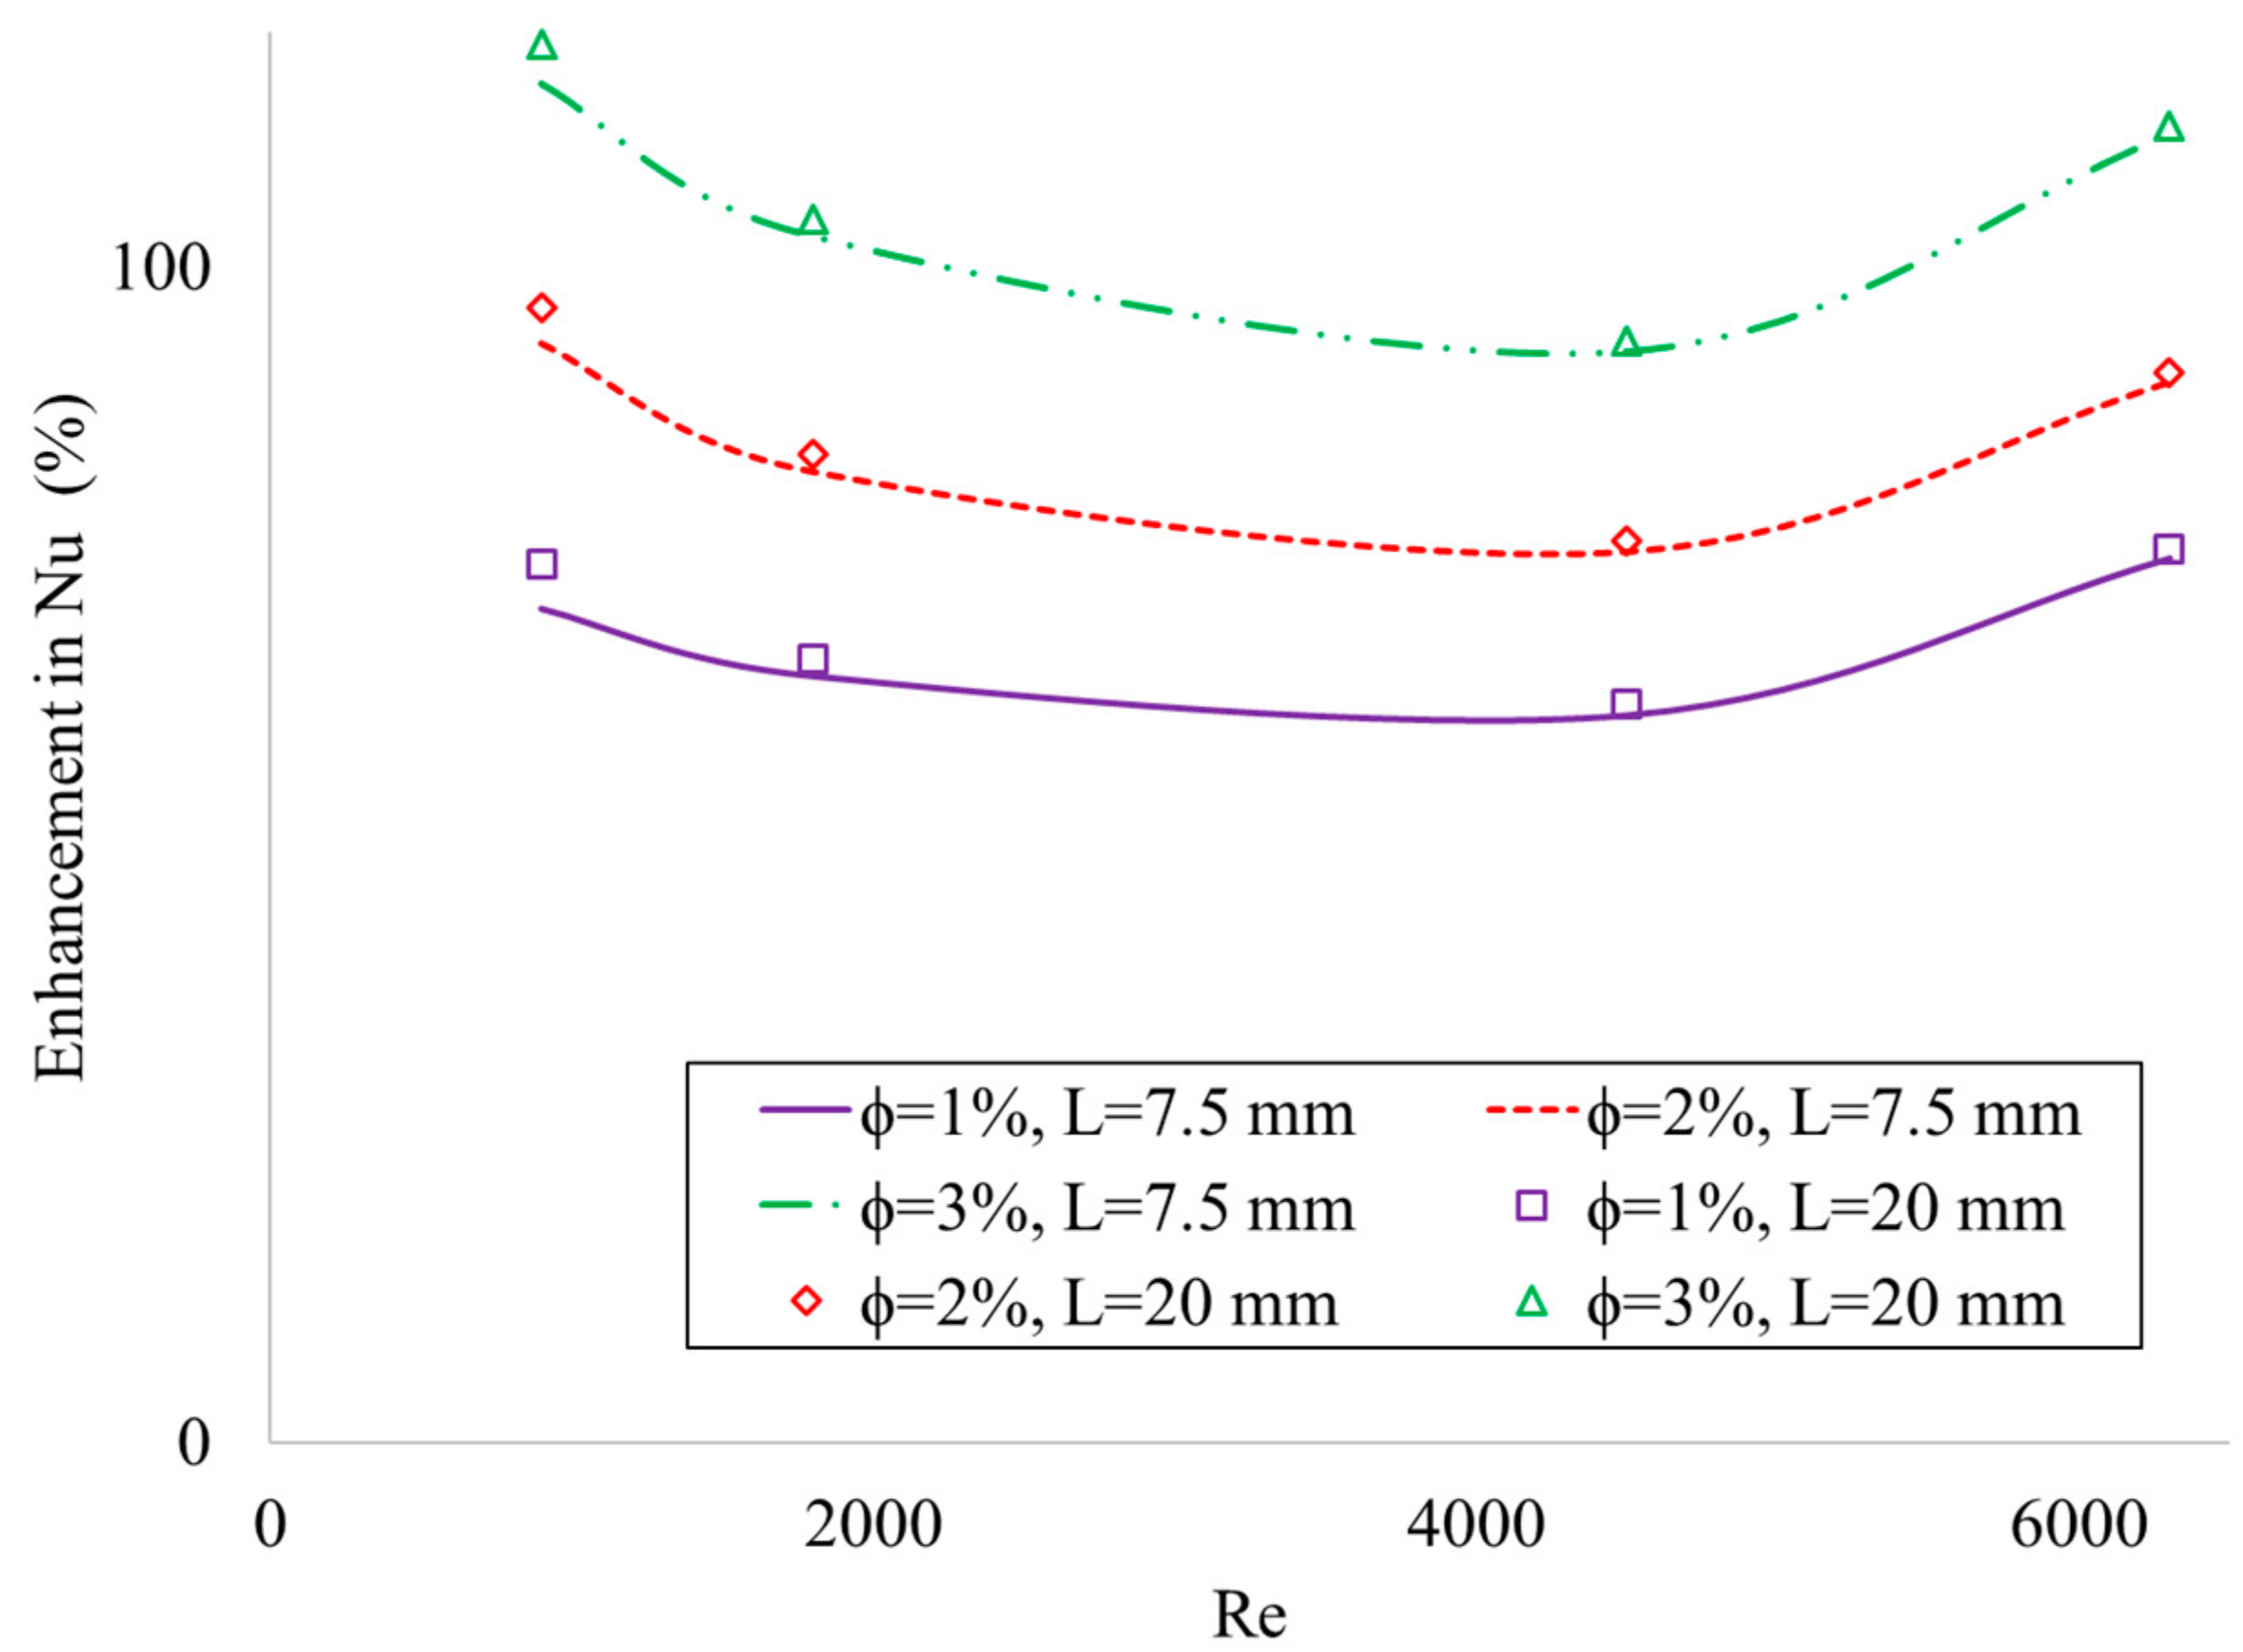
The enhancement of Nu due to the addition of NP to the base fluid is depicted in Figure 17. The improvement is compared to similar cases using pure oil. According to the results, it is concluded that the addition of 1, 2 or 3% of CuO NPs can increase Nu by an average value of 69.2, 86.4 and 106.5%, respectively. Moreover, the Nu enhancement is observed to be a function of flow rate for all NP volume fractions. The heat transfer improvement is more significant at very low and high limits of the studied Re range. Furthermore, the selection of the proper Re can result in significant improvement in thermal performance; for example, when φ = 3%, the difference between the lowest Nu enhancement (at Re = 4500) and its highest value (at Re = 900) is about 19.1%. Additionally, as discussed previously, the width of the swirled tape has little impact on the heat transfer properties of the tube below 1.5%.
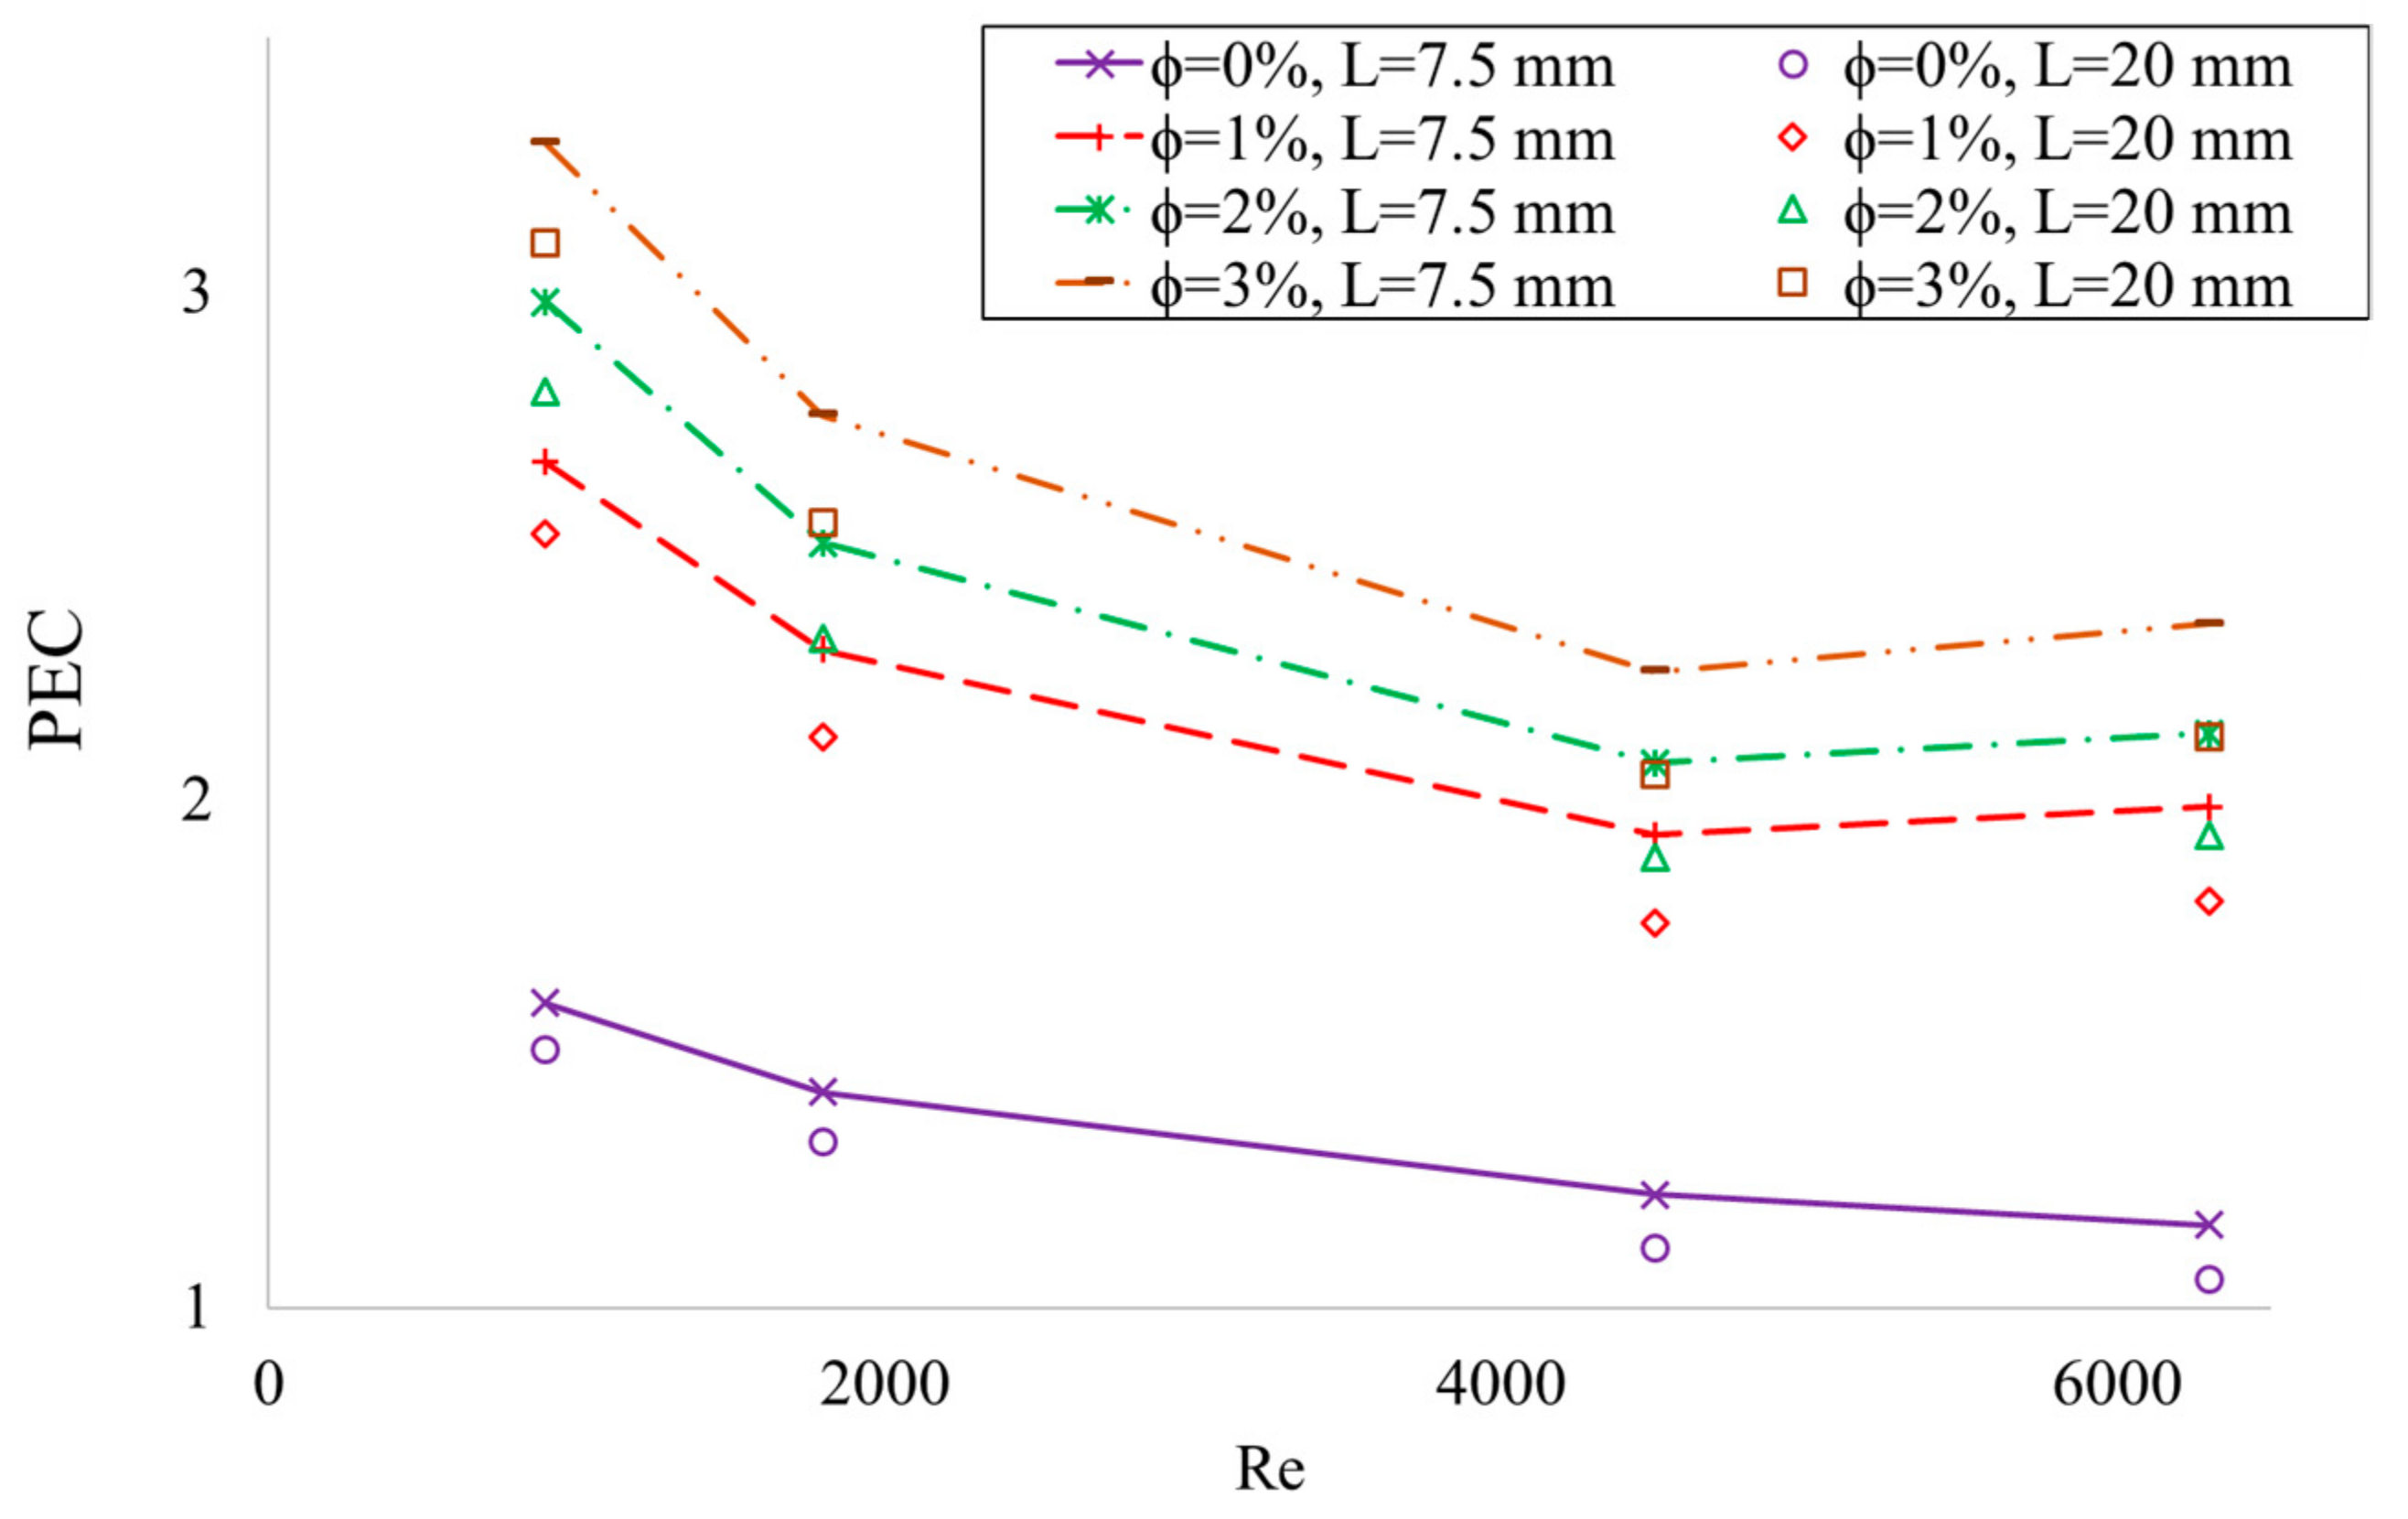
The effect of NP volume fraction on the tube PEC is illustrated in Figure 18 and Figure 19. According to the obtained results, increasing the nanoparticle concentration can boost the overall performance of the tube for all of the studied values of Re. However, the improvement in the PEC is not equal for all values of Re. Since the addition of NP enhances the thermal conductivity of the mixture significantly and the pressure drop growth due to the presence of the NP is limited, the increase in the PEC can be justified, especially based on comparison of φ = 0% and φ = 1%. The highest PEC occurred at Re = 1000 for L = 7.5 mm and φ = 3%, while the lowest value occurred at Re = 6000 for L = 20 mm and φ = 0% (these values are reported for nanofluids).
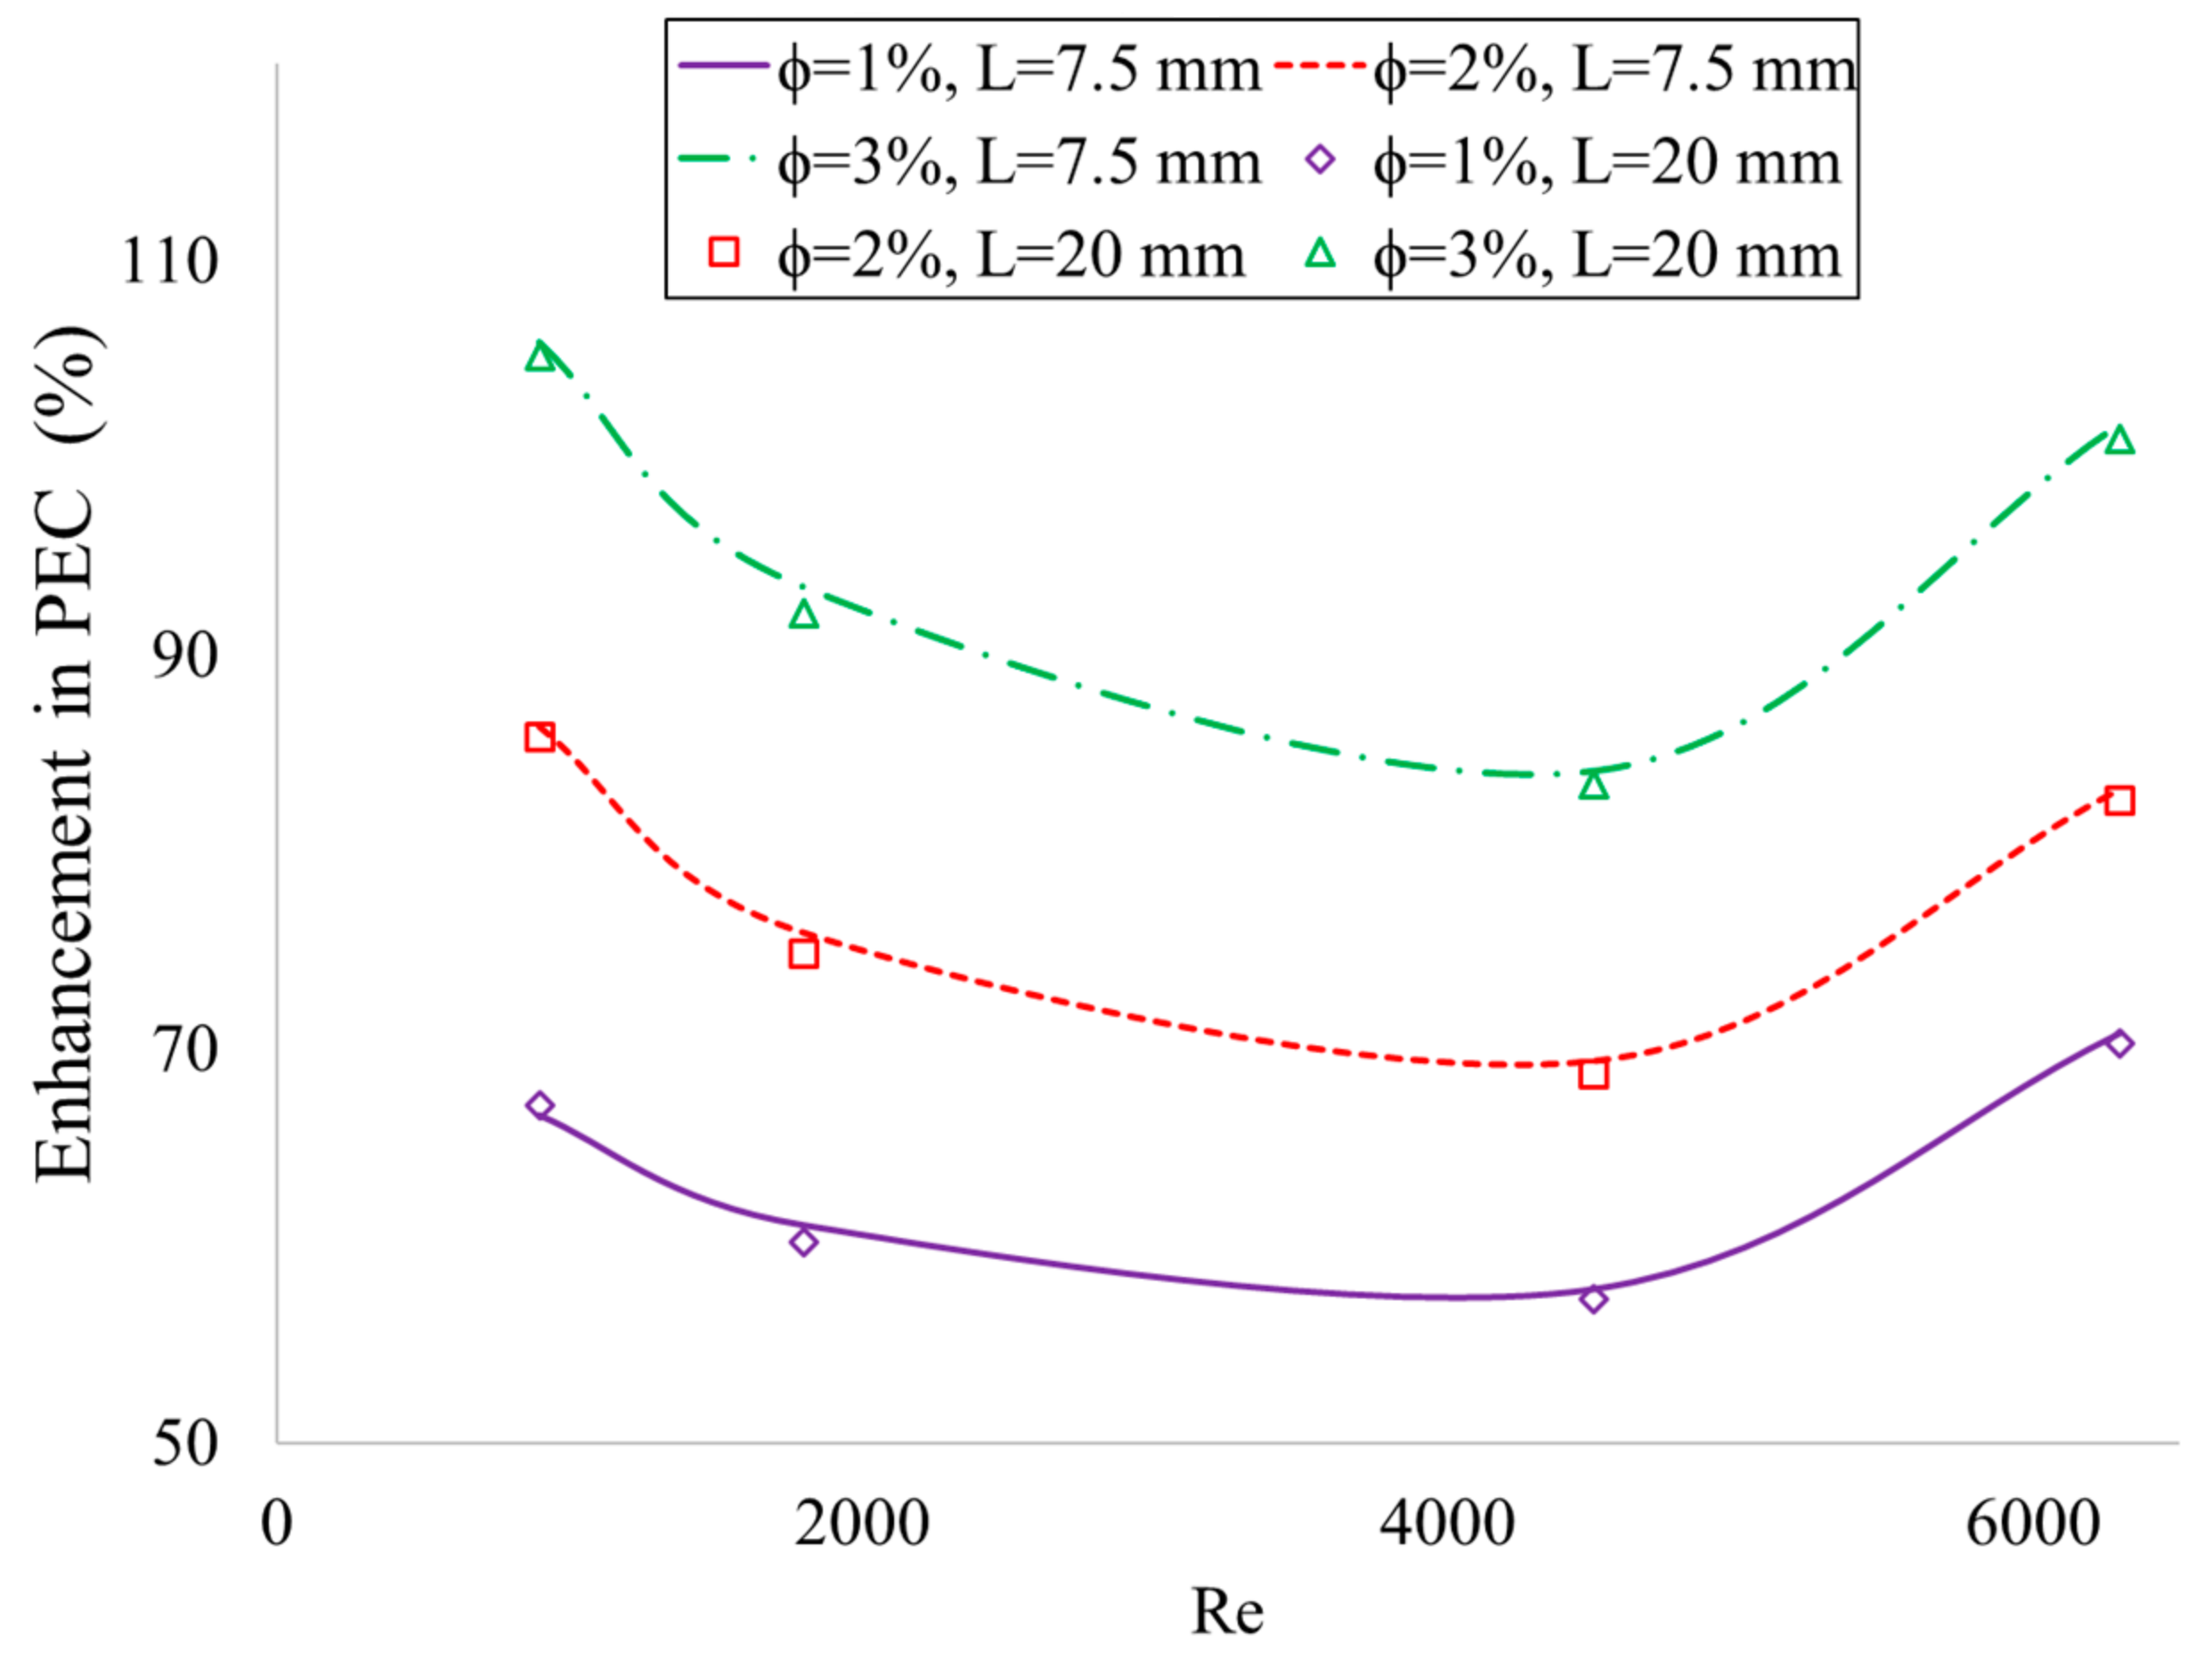
The overall conclusion regarding the effect of NP volume fraction, Re and HST width is shown in Figure 19. The enhancement in the PEC is calculated based on the PEC values obtained for the plain tube with oil as the working fluid. According to these results, despite the fact that the presence of the HST has a significant effect on the thermal performance of the system, its width has almost no impact on PEC variation. The average variation in the PEC by increasing the tape width from 7.5 to 20 mm for an NP volume fraction of 1, 2 or 3% is 0.60, 0.73 and 0.88%, respectively. It is observed that by implementation of CuO NPs, the PEC can be enhanced by 57.3~70.8, 68.7~86.4 and 83.4~105.9% for φ of 1, 2 and 3%, respectively. However, among the studied flow rates, the highest improvement in the PEC can be achieved at Reynolds numbers of 900 and 6300 compared to the other studied values of Re of 1800 and 4500.

4. Conclusions

In the present study, pressure drop and heat transfer for a parabolic solar power plant heat absorber with screw tape inserts are computationally evaluated. The PEC number is determined as a design parameter for various mass flow rates, HST widths and NP volume fractions. The results are reported for two main categories, pure base fluid and nanofluid. According to the results, for the base fluid case, by increasing the screw tape width from 7.5 to 20 mm (by 167%), the friction factor increases between 39.5 to 56.4% for Reynolds numbers of 900 and 6300, respectively. Moreover, Nu is increased by 100.1~138.5% due to the insertion of the screw tape in comparison to the plain tube. However, the Nu improvement with Re is not linear, and higher heat transfer enhancement is observed near the low range of Re. Furthermore, as the Re number is increased, the PEC is reduced significantly. This is due to the faster growth of the friction factor in comparison to heat transfer due to increasing the mass flow rate. In other words, by increasing Re from 900 to 6300, the PEC is reduced by 27.2~30.0% for all studied widths. For the nanofluid case, the highest friction factor occurred for the widest tape at φ = 3%, 74% more than the lowest f for the same configuration with pure oil. For pure oil, it is observed that by increasing Re, Nu asymptotes to a constant level. However, for the nanofluid, sharp Nu growth is observed for Re values higher than 4500. Additionally, it is concluded that addition of 1, 2 or 3% of CuO NPs can increase Nu by 69.2, 86.4 and 106.5, respectively. In brief, it can be stated that by implementation of CuO NPs, the PEC can be enhanced by 57.3~70.8, 68.7~86.4 and 83.4~105.9% for φ of 1, 2 and 3%, respectively.

Author Contributions

Conceptualization, R.R., A.A. and M.A.; methodology, R.R. and A.A.; writing—original draft preparation, R.R.; writing—review and editing, M.J.A. All authors have read and agreed to the published version of the manuscript.

Funding

This research received no external funding.

Institutional Review Board Statement

Not applicable.

Informed Consent Statement

Not applicable.

Data Availability Statement

Data are available in the paper.

Conflicts of Interest

The authors declare no conflict of interest.

References

  1. Bamisile, O.; Huang, Q.; Hu, W.; Dagbasi, M.; Kemena, A.D. Performance analysis of a novel solar PTC integrated system for multi-generation with hydrogen production. Int. J. Hydrogen Energy 2020, 45, 190–206. [Google Scholar] [CrossRef]
  2. Rehmana, N.; Uzair, M.; Asif, M. Evaluating the solar flux distribution uniformity factor for parabolic trough collectors. Renew. Energ 2020, 157, 888–896. [Google Scholar] [CrossRef]
  3. Yang, D.; Khan, T.S.; Al-Hajri, E.; Ayub, Z.H.; Ayub, A.H. Geometric optimization of shell and tube heat exchanger with interstitial twisted tapes outside the tubes applying CFD techniques. Appl. Therm. Eng. 2019, 152, 559–572. [Google Scholar] [CrossRef]
  4. Yaghoubi, M.; Akbarimoosavi, S.M. Three dimensional thermal expansion analysis of an absorber tube in a parabolic trough collector. In Proceedings of the 17th SolarPACES Conference, Granada, Spain, 20–23 September 2011. [Google Scholar]
  5. Yaghoubi, M.; Azizian, K.; Kenary, A. Simulation of Shiraz solar power plant for optimal assessment. Renew. Energ. 2003, 28, 1985–1998. [Google Scholar] [CrossRef]
  6. Golneshan, A.A.; Bandehee, M. The computational analysis of adding c-shape plates inside the linear parabolic trough collectors absorber tube(1). In Proceedings of the Heat and Mass Transfer Conference, Zahedan, Iran, 11 September 2012. [Google Scholar]
  7. Eiamsa-ard, S.; Promvonge, P. Heat transfer characteristics in a tube fitted with helical screw-tape with without core-rod inserts. Int. Commun. Heat Mass Transf. 2007, 34, 176–185. [Google Scholar] [CrossRef]
  8. Zhang, X.; Liu, Z.; Liu, W. Computational studies on heat transfer and friction factor characteristics of a tube fitted with helical screw-tape without core-rod inserts. Int. J. Heat Mass Transf. 2013, 60, 490–498. [Google Scholar] [CrossRef]
  9. Roohi, R.; Emdad, H.; Jafarpur, K. A comprehensive study and optimization of magnetic nanoparticle drug delivery to cancerous tissues via external magnetic field. J Test Eval. 2019, 47, 681–703. [Google Scholar] [CrossRef]
  10. Roohi, R.; Emdad, H.; Jafarpur, K.; Mahmoudi, M.R. Determination of magnetic nanoparticles injection characteristics for optimal hyperthermia treatment of an arbitrary cancerous cells distribution. J Test Eval. 2020, 48, 905–921. [Google Scholar] [CrossRef]
  11. Roohi, R.; Heydari, M.H.; Bavi, O.; Emdad, H. Chebyshev polynomials for generalized Couette flow of fractional Jeffrey nanofluid subjected to several thermochemical effects. Eng Comput. 2021, 37, 579–595. [Google Scholar] [CrossRef]
  12. Roohi, R.; Heydari, M.H.; Sun, H.G. Computational study of unsteady natural convection of variable-order fractional Jeffrey nanofluid over an oscillating plate in a porous medium involved with magnetic, chemical and heat absorption effects using Chebyshev cardinal functions. Eur. Phys. J. Plus. 2019, 134, 535–555. [Google Scholar] [CrossRef]
  13. Suresh, S.; Venkitaraj, K.P.; Selvakumar, P.; Chandrasekar, M. A comparison of thermal characteristics of Al2O3/water and CuO/water nanofluids in transition flow through a straight circular duct fitted with helical screw tape inserts. Exp. Therm. Fluid Sci. 2012, 39, 37–44. [Google Scholar] [CrossRef]
  14. Chougule, S.S.; Sahu, S.K. Heat transfer and friction characteristics of Al2O3/water and CNT/water nanofluids in transition flow using helical screw tape inserts—A comparative study. Chem Eng Process. Process Intensif. 2015, 88, 78–88. [Google Scholar] [CrossRef]
  15. Chaurasia, S.R.; Sarviya, R.M. Thermal performance analysis of CuO/water nanofluid flow in a pipe with single and double strip helical screw tape. Appl. Therm. Eng. 2020, 166, 114631. [Google Scholar] [CrossRef]
  16. Almeshaal, M.; Arunprasad, V.; Palaniappan, M.; Kolsi, L. Experimental study of a solar water heater fitted with spacer at the leading edge of Left-Right screw tapes. Case Stud Therm Eng. 2020, 22, 100777. [Google Scholar] [CrossRef]
  17. Raheem, A.; Siddique, W.; Farooqui, Z.H.; Salameh, T.; Haq, I.; Waheed, K.; Qureshi, K. Performance evaluation of adding Helical-screw Tape Inserts in Parabolic Solar Trough Collectors as a Source of Cleaner Energy Production. J. Cleaner Prod. 2021, 297, 126628. [Google Scholar] [CrossRef]
  18. Webb, R.L. Performance evaluation criteria for use of enhanced heat transfer surfaces in heat exchanger design. Int. J. Heat Mass Transf. 1981, 24, 715–726. [Google Scholar] [CrossRef]
  19. Fan, J.F.; Ding, W.K.; Zhang, J.F.; He, Y.L.; Tao, W.Q. A performance evaluation plot of enhanced heat transfer techniques. Int. J. Heat Mass Transf. 2009, 52, 33–44. [Google Scholar] [CrossRef]
  20. Pak, B.C.; Cho, Y.I. Hydrodynamic and heat transfer study of dispersed fluids with submicron metallic oxide particles. Exp. Heat Transf. 1998, 11, 151–170. [Google Scholar] [CrossRef]
  21. Akhatov, J.S.; Juraev, T.I.; Juraev, T.D. Comparison of Different Empirical Models for Analysing the Thermal Conductivities of Various Materials for Use in Nanofluid Preparation. Appl. Sol. Energy 2022, 58, 76–85. [Google Scholar] [CrossRef]
  22. Topping, J. Investigations on the theory of the Brownian movement. Phys Bull. 1956, 7, 281. [Google Scholar] [CrossRef]
  23. Ghadirijafarbeigloo, S.H.; Zamzamian, A.H.; Yaghoubi, M. 3-D computational simulation of heat transfer and turbulent flow in a receiver tube of solar parabolic trough concentrator with louvered twisted-tape inserts. Energy Procedia 2014, 49, 373–380. [Google Scholar] [CrossRef] [Green Version]
  24. Yaghoubi, M.; Ahmadi, F.; Bandehee, M. Analysis of heat losses of absorber tubes of parabolic through collector of Shiraz (Iran) solar power plant. J. Clean Energy Technol. 2013, 1, 33–37. [Google Scholar] [CrossRef] [Green Version]
  25. Allam, M.; Tawfik, M.; Bekheit, M.; El-Negiry, E. Experimental Investigation on Performance Enhancement of Parabolic Trough Concentrator with Helical Rotating Shaft Insert. Sustainability 2022, 14, 14667. [Google Scholar] [CrossRef]
  26. Khfagi, A.M.; Hunt, G.; Paul, M.C.; Karimi, N. Computational analysis of heat transfer augmentation and thermodynamic irreversibility of hybrid nanofluids in a tube fitted with classical and elliptical-cut twisted tape inserts. J. Therm. Anal. Calorim. 2022, 147, 12093–12110. [Google Scholar] [CrossRef]
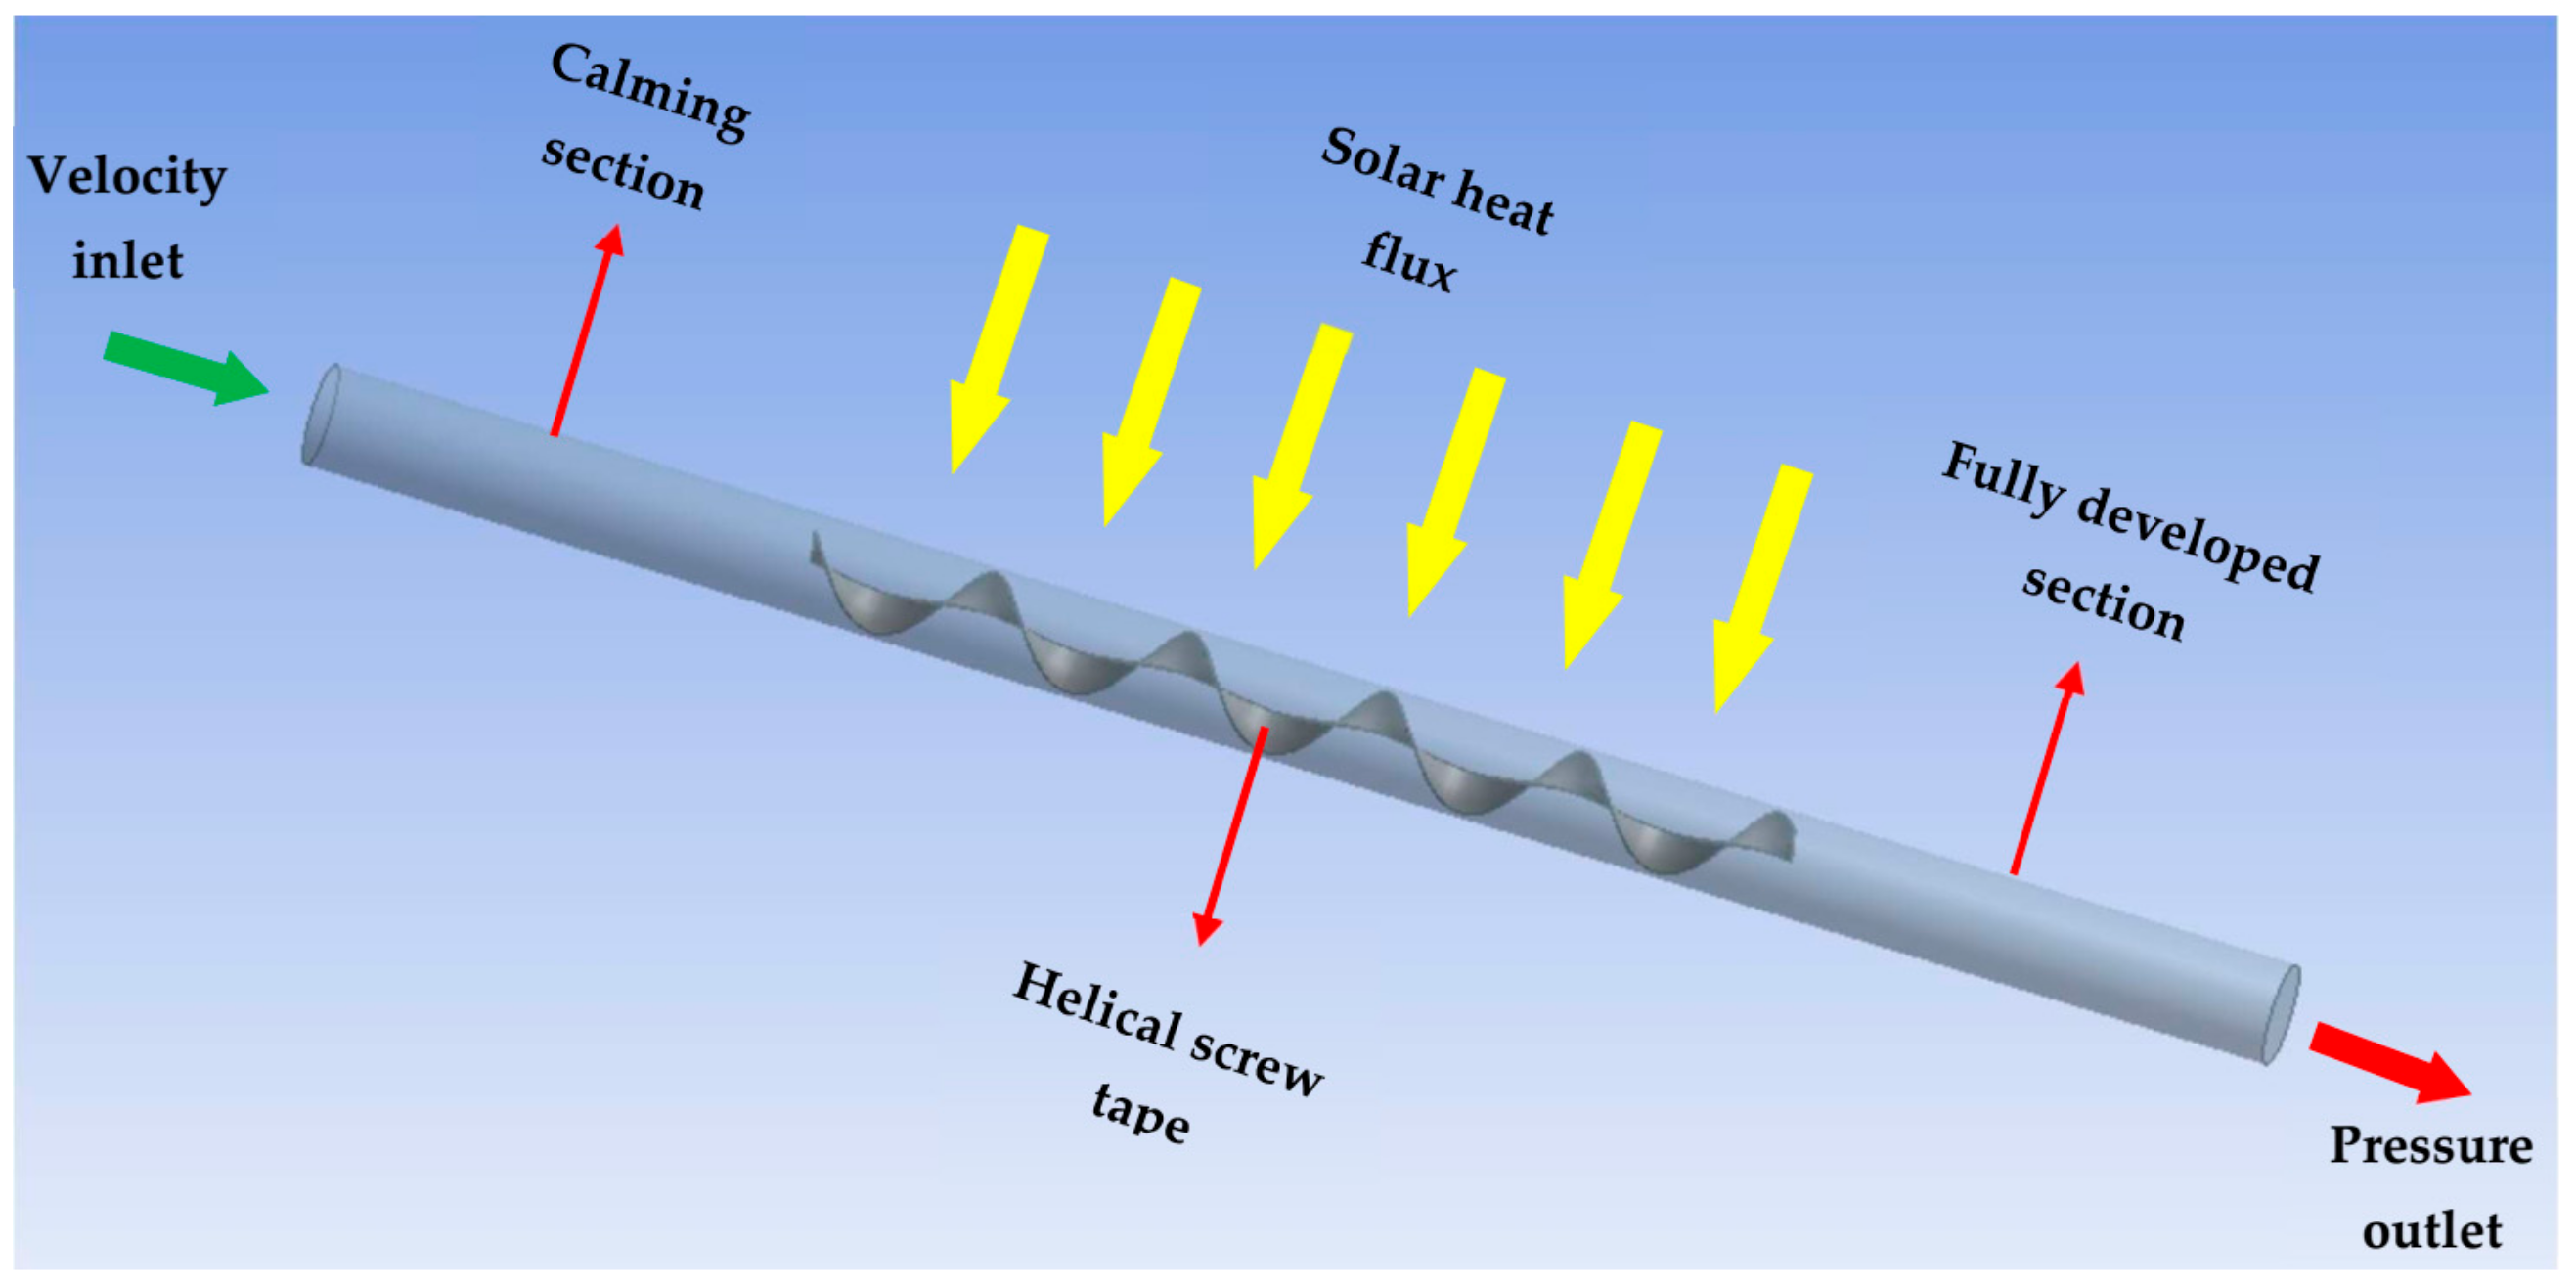
Figure 1. Schematic of the simulated absorber tube with HST.
Sustainability 15 10637 g001
Figure 2. Distribution of the local concentration ratio at the winter and summer solstices and the spring and autumnal equinoxes.
Sustainability 15 10637 g002
Figure 3. Utilized computational grid in sectioned views.
Sustainability 15 10637 g003
Figure 4. Comparison of the experimental data obtained by [15] with the computational data of the present study.
Sustainability 15 10637 g004
Figure 5. Streamlines initiating from the inlet section for the case with the highest HST width (L = 20 mm) at Re = 6300 (φ = 1%).
Sustainability 15 10637 g005
Figure 6. Temperature contours on the helical tape for L = 20 mm at various values of Re (φ = 1%).
Sustainability 15 10637 g006
Figure 7. Velocity contours on the straight plane passing through the center of the absorber tube for L = 20 mm at various values of Re (φ = 1%).
Sustainability 15 10637 g007
Figure 8. Temperature contours on the straight plane passing through the center of the absorber tube for L = 20 mm at various values of Re (φ = 1%).
Sustainability 15 10637 g008
Figure 9. Effect of HST width on the friction factor for base fluid.
Sustainability 15 10637 g009
Figure 10. Effect of Re on the friction factor for base fluid.
Sustainability 15 10637 g010
Figure 11. Effect of HST width (L) on Nu for base fluid.
Sustainability 15 10637 g011
Figure 12. Effect of Re on Nu for base fluid.
Sustainability 15 10637 g012
Figure 13. Effect of Re on PEC for base fluid.
Sustainability 15 10637 g013
Figure 14. Effect of HST width (L) on PEC for base fluid.
Sustainability 15 10637 g014
Figure 15. Effect of HST width (L) and NP volume fraction (φ) on the friction factor for absorber tube with nanofluid.
Sustainability 15 10637 g015
Figure 16. Effect of HST width (L) and NP volume fraction (φ) on heat transfer for absorber tube with nanofluid.
Sustainability 15 10637 g016
Figure 17. Effect of HST width (L) and NP volume fraction (φ) on Nu enhancement for absorber tube with nanofluid.
Sustainability 15 10637 g017
Figure 18. Effect of HST width (L), NP volume fraction (φ) and Re on PEC for absorber tube with nanofluid.
Sustainability 15 10637 g018
Figure 19. Effect of HST width (L) and NP volume fraction (φ) on PEC enhancement for absorber tube with nanofluid.
Sustainability 15 10637 g019
Table 1. Thermophysical properties of the base fluid and the CuO nanoparticles [23].
PropertyBase FluidCuO Nanoparticles
Density (kg/m3)1071−0.72 × (T(K))6350
Thermal conductivity (W/m.K)0.1882−0.00008304 × (T(K))69
Pr(T(K))−7.7127-
Table 2. Relative variations of computational time, f and Nu in relation to the optimum grid, containing 863,544 cells.
Number of CellsComputational Time (min)Relative Variations of f (%)Relative Variations of Nu (%)
524,98631010.611.2
687,4383656.77.1
863,54439011
1,097,3245701.391.43
Disclaimer/Publisher’s Note: The statements, opinions and data contained in all publications are solely those of the individual author(s) and contributor(s) and not of MDPI and/or the editor(s). MDPI and/or the editor(s) disclaim responsibility for any injury to people or property resulting from any ideas, methods, instructions or products referred to in the content.