Article

Does the Construction of High-Speed Rail Change the Development of Regional Finance?

School of Economics and Finance, Xi’an Jiaotong University, Xi’an 710061, China
*
Author to whom correspondence should be addressed.
Sustainability 2023, 15(13), 10641; https://doi.org/10.3390/su151310641
Submission received: 12 May 2023 / Revised: 21 June 2023 / Accepted: 4 July 2023 / Published: 6 July 2023

Abstract

:
This study aims to examine the relationship between the high-speed rail (HSR) and regional financial development, employing 270 prefecture-level cities in China. With the increase in traffic lines, the network effect of the HSR gradually amplifies, and its impact is felt on both the “quality” and “quantity” of financial development. Different from using a single indicator, this paper comprehensively measures urban financial development from the perspectives of financial broadening and deepening based on financial indicators from six dimensions. By constructing a two-way fixed-effect regression model of urban panels, this paper presents that the HSR affects financial broadening. Specifically, the HSR reduces the excessive expansion of financial scale, the degree of financial agglomeration, and the financial risks in cities. Meanwhile, the HSR also promotes financial deepening, meaning the enhancement of urban financial efficiency and financial depth, as well as changes in financial structure. An indirect mechanism analysis demonstrates that population migration caused by the HSR motivates the transformation of financial elements among cities, which has varying degrees of impact on urban financial development. Overall, local governments should seize the opportunity of densifying the HSR network to promote the sustainable development of urban finance, adjust the structure, improve efficiency, reduce risks and gradually support urban finance to become better and stronger.

1. Introduction

The Tokaido Shinkansen, which runs through Tokyo–Nagoya–Kyoto–Osaka, was completed and began operating in 1964, and is considered the world’s first high-speed rail (HSR). Since then, the development of HSR has experienced three waves. As of the end of 2019, China’s HSR has exceeded 10 billion passenger trips, and its operating mileage has reached 35,000 km, accounting for more than two-thirds of the world’s total mileage. The HSRs, with speeds of 250 km/h and 350 km/h, have become the main models, with operating mileages of more than 10,000 km. The completion of the “four vertical and four horizontal” HSR network ahead of schedule indicates that China has become the country with the longest HSR mileage, the highest operational intensity, and the most complex network density in the world. In 2016, the newly revised national “medium and long-term rail network plan” outlined the grand blueprint for the “eight vertical and eight horizontal” HSR network in the new era. The expansion of the HSR network from “four verticals and four horizontals” to “eight verticals and eight horizontals” means that China has fully entered the “high-speed rail era”. Relying on the comprehensive advantages of the HSR, building a “high-speed rail economy” and laying out a traffic economic network have become inevitable requirements for achieving high-quality economic development in China in the new era.
With the increasing density of China’s HSR network, the original spatial pattern has already changed, and the spatiotemporal distances have been greatly reduced [1]. The HSR has had a profound impact on many aspects of regional economic activities by compressing spatial and temporal distances, and its resulting economic growth effects have been confirmed by numerous studies [2]. Finance, as the core of the modern economy [3], plays a crucial role in the processes of contemporary economic and social development, and has become the most active variable in macroeconomic operations [4,5]. The impact of HSR on finance should not be ignored. Unlike economic growth, finance is a special industry that operates with monetary instruments, the essence of which is the flow and financing of funds. The improvement of transportation infrastructure can effectively facilitate the flow of funds [6], which helps to achieve the optimal allocation of funds and thus affects urban financial activities. In fact, the economy and finance are closely related, and the two are complementary, yet not entirely consistent. According to Ma et al., the cross-regional flow of capital brought about by transportation infrastructure is an important channel that contributes to economic growth and regional economic disparities [7]. On one hand, areas with rapid economic development and high output contribution rates are more likely to attract large inflows of financial resources, and are relatively less excluded by finance [8]. On the other hand, financial constraints have a limiting effect on regional economic growth, and regions with better financial development tend to have more dynamic economic activities [9]. As for the enterprises and regions with high financial constraints, their benefits from the decrease in transportation costs will be very limited because they cannot invest and expand their production capacity in a timely manner [10]. Financial development theory argues that financial development lags and financial inhibition are common in developing countries, and firms are unable to receive effective financial support when facing the best investment opportunities, leading to financial mismatch and generating more serious financial constraints [11]. The differences in financial constraints and financing dependence across regions in China, the largest developing country, have created an imbalanced impact of transportation on industrial development [10]. Meanwhile, China’s vast land area allows the spatiotemporal compression effect of HSR to be given full play, and the formation of the HSR network further strengthens its regional accessibility. Therefore, it is of great research value to analyze the impact of China’s HSR construction on the financial market.
The theory of financial geography states that the financial services industry is an economic activity unit with distinct geographical characteristics [12]. However, the continuous advancement of HSR construction has gradually built a network of connectivity between cities, and its accessibility enhancement has greatly changed the original geographical characteristics. With the change of geographical features, the financial landscape inevitably adjusts accordingly, which may affect urban financial development [13]. In fact, a little research has been presented on the possible impact of HSR on capital markets from a fragmented perspective, with studies focusing on a specific area of financial activities, including reducing the risk of stock price crashes [14], leading to an increase in venture capital investment [15], and changing urban financial agglomeration [16]. This reflects, to some extent, the possibility that HSR will affect urban financial development by reshaping the spatiotemporal structure [17]. When the degree of transportation development is weak, resource mismatch is more serious. Factors such as labor, information, and capital struggle to achieve free flow across regions [16]. Transportation infrastructure construction can effectively reduce the transportation costs of factors and products, promote market integration, market competition and the specialized division of labor, and thus enhance the efficiency of resource allocation [18], which helps to achieve a rational allocation of funds [6]. As a constituent entity of financial activities, return and risk are the two core elements that determine flow. On one hand, the opening of HSR shortens the spatiotemporal distance between regions [1] and reduces the cost of capital flow [7], thus increasing the yield of a cross-regional investment and expanding the radiation range of financial institutions in local and surrounding areas. On the other hand, HSR improves the convenience of face-to-face communication between borrowers and lenders, accelerates the transmission of soft information [7], greatly alleviates the information asymmetry between regions, and can effectively reduce the risk of the cross-regional allocation of capital, which in turn results in a rational allocation of capital market resources [14,15]. The accelerated flow of funds improves the effectiveness of the capital market, alleviates regional financial constraints, overcomes local preferences in the financial market [13], and increases the penetration and accessibility of financial services [8], meaning that regional financial development is driven by two dimensions: service scope—financial broadening, and service use—financial deepening.
This paper aims to examine the impact of HSR on regional financial development from the two dimensions of financial broadening and financial deepening. The conclusions further enrich the HSR economics theory, and provide research directions and policy references for reducing urban financing restrictions, alleviating urban financial bubbles, and optimizing urban financial structure from the perspective of transportation infrastructure construction.
The marginal contributions of this paper are as follows: First, the existing studies mainly focus on the impact of HSR on economic growth, regional disparities, and population mobility [16,19,20,21,22,23,24,25]. Little attention has been paid to the impact of HSR construction on the financial markets. In fact, the economy and finance are closely related, and both will be adjusted by the reshaping of the geographical landscape. As such, this study is an attempt to explore the relationship between HSR and finance as the research focus, and constructs urban financial development indicators from different dimensions, which proves that along with economic growth, HSR construction will also promote changes in regional financial development. This will further broaden the research scope of HSR economics by filling the gaps on the relationship between HSR and finance, and provide references for subsequent urban financial development and planning. Second, this paper believes that the measurement of financial development should include both “qualitative” and “quantitative” aspects. Different from the way that most of the existing studies use a single indicator to measure financial development [5,26,27], this paper constructs urban financial indicators from six dimensions, respectively, to reflect different aspects of financial development. On this basis, the indicators are divided into two types—financial broadening and financial deepening—and we then distinguish the impact of the HSR on the “quantity” and “quality” of urban financial development, so as to conduct a comprehensive analysis of urban financial development. Third, the existing literature mostly uses the difference-in-differences (DID) method to evaluate the economic effects of HSR. This analysis mainly focuses on comparing HSR cities with non-HSR cities, while ignoring the heterogeneity between HSR cities and the changes in the construction intensity of HSR cities over time. To a certain extent, this may cause specific differences in the conclusions obtained by different scholars when selecting different regions or periods for research. In order to better capture the sustainable impact of HSR construction, this paper takes the opening intensity of the HSR as the core explanatory variable to study the relationship between HSR construction and urban financial development, rather than a 0–1 variable.
The rest of this study is structured as follows. Section 2 is the literature review. Section 3 introduces the model and the data, constructs indicator variables, and performs descriptive statistics. Section 4 contains the empirical analysis and a series of robustness tests. Section 5 analyzes the heterogeneity, moderation effect, and indirect mechanisms. Section 6 draws the conclusions and recommendations.

2. Materials and Methods

According to Laulajainen, “financial services are economic activities with distinctive geographic characteristics” [12]. Although financial transactions are an increasingly common virtual activity, it still places products and services at specific spatial locations [28]. Space, or location, is important for the development of the financial industry [16]. The development of transportation infrastructure, represented by HSR, has reshaped the geographical pattern, enhanced regional accessibility, changed the spatial structure on which financial development depends, and to some extent influenced urban financial activities.

2.1. Theoretical Analysis

2.1.1. Direct Effects

First, HSR has a value discovery function. After the opening of HSR, along with the improvement of accessibility and connectivity [2], a large number of undervalued investment markets are gradually discovered by investors, attracting capital inflows from all over the world, and the capital improves its yield through re-optimized allocation [29]. Simultaneously, improvements in transportation infrastructure reduce the cost of capital flows [30], creating the conditions for achieving the cross-regional allocation of capital. Agarwal and Hauswald argue that the HSR directly reduces the cost of transportation for banks to visit firms, allowing them to have more frequent access to firms on which credit decisions are based [31]. Ma et al. argue that after HSR reduces the cost of cross-regional investment flows, firms’ off-site investment will follow more industrial clusters and technology spillovers [7].
Second, HSR has an information transfer effect. The face-to-face communication provided by HSR facilitates the transmission of soft information [15]. Therefore, it can alleviate the degree of information asymmetry between regions and reduce financial market risk. Information is considered to be an important factor in the spatial layout of finance [25]. In particular, soft information, which contains uncoded knowledge, is essential in financial services, and despite the widespread use of email, telephone, and videoconferencing, face-to-face communication exchange methods remain irreplaceable [32]. Zhao et al. showed that the high spatial agglomeration of financial activities is based on information sources, and that in order to avoid the effects of information asymmetry, financial firms tend to move closer to information sources in discovering and using non-standardized information [33]. Agarwal and Hauswald found that, influenced by geographical distance, the closer a firm is to a financial institution, the easier it is to transmit its soft information to investors, and thus the easier it is to obtain adequate financial support [31]. However, the networked development of HSR shortens the spatial and temporal distances and increases the frequency of face-to-face communication, which leads to the transfer of a large amount of soft information, thus alleviating the information asymmetry between different regions. Long et al. showed that the HSR helps venture capitalists to obtain “soft information” about entrepreneurs for venture capital investment [15]; Zhao et al. found that the risk of share price crashes of listed companies decreases after the opening of HSR due to the reduction in information asymmetry and regulatory costs [14]; Petersen argued that banks rely more on “soft information” for credit decisions [34]. Before banks grant credit, creditors need to obtain private information about potential borrowers through field research and face-to-face interviews with corporate management to form a subjective evaluation of the creditworthiness of the company, for the sake of identifying better-qualified borrowers. After the credit is granted, creditors need to constantly monitor the borrowing enterprises on site, track their creditworthiness through continuous information communication, and take effective countermeasures in a timely manner [35]. The information asymmetry between banks and enterprises is alleviated by the HSR, which helps enterprises to build transactional credit relationships and obtain favorable credit terms. Enterprises that obtain credit funds seize investment opportunities to invest in valuable investment projects, and the allocation efficiency of credit resources is finally improved [35].
Third, HSR has a structural optimization effect. The completion of the HSR economic network changes the spatial layout of financial activities, promotes competition and cooperation between regions, and expands the market scope of financial institutions, which is conducive to the specialized division of labor, thus overcoming the information friction and “local preference” arising from geographical distance in the process of financial transactions [16]. The supply and demand of funds can be matched more effectively, and it is easier to form cross-regional cooperation relationships, which promotes the rationalization of the financial market structure. Hollander and Verriest found that banks’ credit covenants to firms in distant areas are more restrictive [36]. The opening of HSR facilitates firms’ lending to non-relative and off-site banks, helping them to establish credit relationships with more non-local banks and access credit funds, thus alleviating the credit rationing problem [35]. Long et al. argued that, on one hand, HSR changes the access threshold of the venture capital market in cities along the route, which is conducive to increasing the supply of venture capital and making the market more competitive [15]. On the other hand, the convenience brought about by the HSR network reduces the sensitivity of venture capital to geographical distance, which helps to enhance the understanding between investment and financing parties and promote cooperation; Wang et al. argued that different industrial characteristics and differences in financing preferences are bound to influence the spatial layout of the financial industry [16]. Transportation-led adjustments and upgrading in industrial structure create financing demand, and the financial structure is bound to change accordingly.
In summary, the construction of an HSR network inevitably has an impact on regional financial activities while changing the geographical pattern. The above three effects generated by HSR promote the spillover of urban financial activities, expand urban financial markets, change the regional financial structure, improve capital market efficiency, and thus promote urban financial development. Concurrently, there is regional heterogeneity in the impact of transportation infrastructure [19,21,24]. The imbalance in regional economic development in China coexists with the imbalance in regional financial resource supply. The increase in bank assets, corporate bonds and stocks differs greatly among regions, with the eastern region accounting for 58.7% of the increase in social financing scale nationwide, the middle and western regions accounting for 19% and 18.8%, respectively, and the northeastern region accounting for only 3.5%. The incremental volume of corporate bond financing in the eastern region is 22.03 and 15.71 times higher than that in the middle and western regions, respectively [16]. Ma et al. argued that there is heterogeneity in the impact of HSR on offsite investment in different regions due to the different industrial structures and the differences in the reliance on funds [7]. Chu et al. found that the positive impact of HSR on bank credit conditions is only reflected in the non-capital, non-central city group [35]. In light of this, this paper proposes research Hypotheses 1 and 2.
H1. 
HSR construction contributes to the urban financial development.
H2. 
There is regional heterogeneity in the impact of HSR on financial development.

2.1.2. Indirect Effects

In terms of indirect effects, HSR is a representative of cross-regional passenger transport, and so its network development directly accelerates inter-city population mobility [37,38]. Moreover, the labor shift created by population mobility plays a key role in financial development. Efficient labor input not only enhances the efficiency of financial transactions, but also helps to promote financial innovation, which determines the supply of financial products and thus can change the development pattern of the financial industry [16]. Taylor et al. argued that foreign labor is a major determinant in the creation of international financial centers [39]. The labor force creates financial capital through its unique complex social relationships, knowledge networks, and practices, and becomes a major contributor to the accumulation and transfer of financial knowledge to financial firms [39]. Evidently, population mobility plays an important mediating role in the process of HSR affecting the financial development of cities. Therefore, this paper proposes research Hypothesis 3.
H3. 
HSR indirectly affects urban financial development by promoting population mobility.

2.2. Extended Literature on Financial Development

By including the number of road miles in the empirical analysis, Cheng et al. found that the construction of transportation infrastructure may have an impact on the level of financial development in a province [40]. Joassart-Marcelli and Stephens, Sarma and Pais investigated the factors influencing financial exclusion, and found that improvements in transportation facilities have a significant negative relationship with financial exclusion [41,42]. That is, areas with good infrastructure have relatively lower levels of financial exclusion [41,42]. Wang et al. argued that the development of highways reduces cross-regional transportation costs, and while driving the development of commerce and economy along the routes, it enhances the financial demand of the regions along the routes and reduces the variability of financial agglomeration levels [39]. Chu and Fang pointed out that bank credit, an indirect financing method, occupies an absolute share of social capital allocation in China, and the opening of HSR can help enterprises obtain larger, longer-term, and lower-cost bank credit funds, which improves the allocation efficiency of credit resources [35]. Long et al. and Zhao et al. analyzed from the perspectives of venture capital and the stock market, respectively, and found that the HSR intensifies the competition in the venture capital market [14,15], improves venture capital returns [43], and reduces the stock price crash risk of listed companies [14].
Furthermore, financial development can be measured from two perspectives: broadening and deepening. Wang and Hu analyzed financial development from the perspectives of supply and demand, respectively, and divided financial services into penetration in the geographic dimension and accessibility in the demographic dimension, arguing that the two services—deposit and loans—can basically represent the financial development in China [8]. The permeability of deposits and loans in the geographical dimension is mainly characterized by the range of financial services, namely, financial broadening, which is reflected in the change of financial scale, the degree of financial agglomeration, and financial market risks, representing the “quantitative” aspect of financial development. The availability of deposits and loans in the population dimension is mainly characterized by the use of financial services, namely, financial deepening, which is reflected in the change of financial efficiency, financial depth, and financial structure, representing the “quality” aspect of financial development.
On one hand, the spatial allocation of financial resources in China is unbalanced [16], and HSR accelerates the flow of capital and induces the spatial transfer of capital, which reduces financial market risks by promoting the optimal allocation of financial resources [7]. The improvement of transportation conditions lowers the barriers of capital flow, and promotes the flow of capital from developed regions to undeveloped regions, then narrowing the economic gap between regions. The empirical results show that after the opening of an HSR, the parent company’s off-site investment in another city increases significantly, producing a financial “diffusion effect”. Chu and Fang found that non-relationship banks and off-site banks benefit more from the opening of an HSR, and firms in the opening city are more likely to establish credit relationships with these banks [35]. It can be seen that the construction of an HSR expands the coverage of financial activities. This financial diffusion effect it generates avoids excessive financial agglomeration and scale expansion, and reduces the risks associated with bubbly financial growth. In other words, HSR regulates financial broadening and reduces financial expansion.
On the other hand, financial development theory suggests that financial development lags and financial repression are prevalent in developing countries, and firms are unable to receive effective financial support when they are showing their best investment prospects, leading to financial mismatch; that is, firms face a financing constraint problem [11]. The financial constraints faced by firms are particularly severe for a developing country like China, where the financial system is not yet sound and financial deepening is poor [44,45]. The construction of HSR can alleviate the problem of financial constraints due to information asymmetries and reduce financial exclusion [41,42], making the availability of financial services rise. Thus, improved transportation conditions deepen the depth of financial inclusion [8], and enhance capital market efficiency [6], thus optimizing the financial structure. Allen points out that the financial institutions’ and financial markets’ development needs to be adapted to the characteristics of business needs [46]. The improvement of transportation makes financial demand less concentrated in economically developed areas [16], and the convenience of contact between financial supply and demand is enhanced [8], thus enabling better matching and promoting the better adaptation of financial supply to financial demand. The financial structure gradually changes under the effects of transportation development [16], further improving the use of financial services and promoting the optimal allocation of capital market resources [14,15], avoiding financial bubbles and contributing to financial deepening. This paper further splits research Hypothesis 1 into two perspectives—broadening and deepening:
H1a. 
The HSR construction regulates financial broadening.
H1b. 
The HSR construction promotes financial deepening.

3. Model Setting and Data Analysis

On the basis of the aforementioned studies, this paper uses the opening intensity of HSR as the core explanatory variable to study the relationship between HSR construction and urban financial development from two aspects: financial broadening and financial deepening. This paper considers that the impact of the HSR on finance is not only reflected in the presence or absence of HSR, but also in the intensity level of it. Comparing the effects between HSR cities with those between non-HSR cities, it is meaningful to split this HSR effect further. When the city has only one HSR line running and is setting up stations, the city is mainly affected by increased connectivity. This paper calls this effect the channel effect. When a city has two or more HSR lines passing and setting up stations, this paper describes a network effect, or a hub effect. As China’s HSR construction is in a networked development mode, on one hand, with the HSR network continuing to become more dense, the connectivity brought about by it will increase explosively. Unlike cities with only one line, cities with two or more opening lines form a connected network. Taking the Beijing–Shanghai HSR line as an example, which connects 19 cities, it results in a total of 171 pairs of connections between the two cities ( C 19 2 ).After the opening of the Beijing–Guangzhou HSR, the commuter accessibility of the two cities rose rapidly to 903 ( C 19 + 24 2 ) instead of 447 ( C 19 2 + C 24 2 ). This explosive growth in connectivity comes from the superposition of the HSR lines. As a city where two rail lines meet, Beijing will inevitably become a bridge and a central hub linking cities along different lines, which creates a network effect. Any cross-line connection must be realized through Beijing. This network effect strengthens the impact of the HSR on Beijing. It can be seen that only by utilizing a hub city to achieve the intersection of different HSR lines can this network effect be manifested. In other words, the emergence of the network effect will inevitably be accompanied by the emergence of hub cities, and the strengthening of this effect will be reflected in the increase in HSR intensity in connecting nodes. This network effect is more likely to affect local financial development. On the other hand, the transition from the channel effect (single line) to the network effect (multiple lines) imposes selectivity upon the flow of funds, which is different from passively choosing to flow along the city’s only HSR line. The networking of HSR helps to realize the distribution and allocation of funds in a wider range. At the same time, as a connection center, node cities can better enjoy the hub economy brought about by HSR when elements flow across the lines. As of 2018, Zhengzhou, Wuhan, and Guangzhou had the highest HSR intensities in China, with scores of 7. However, 82 prefecture-level cities have no HSR traffic. This shows that the gap in the HSR traffic in cities is relatively large. If the DID method is used for analysis, it is difficult to measure the rapid growth of the network effect with the enhancement in the HSR intensity. Thus, this paper analyzes the number of HSR lines in the city as an intensity indicator. It not only reflects the impact of whether the city has HSR on financial development, but also reflects the difference in the impacts of the different levels of HSR intensity, which can better capture the internal relationship between HSR construction and urban financial development. Nevertheless, this paper still uses the DID method to conduct a robust test of the empirical results. The different division methods of hub cities all reflect the consistency of the research conclusions, and further verify the existence of the network effect. This increasing return to scale effect brought about by the network effect demonstrates the importance of the layout of the “eight vertical and eight horizontal” HSR traffic economic network in China’s “Fourteenth Five-Year Plan” period.

3.1. Model Setting

This paper uses the number of HSR lines opened in each city from 2008 to 2018 as the core explanatory variable, and constructs a two-way fixed effects model to examine the impact of its construction on financial development. The data on the HSR are from the China Railway website: https://www.12306.cn/index/, accessed on 1 November 2020. HSR lines completed and operating in the first half of the year are considered to be opened in the current year, while those opened in the second half are considered to be opened in the next year. The data of other control variables are all derived from China City Statistical Yearbook (2009–2019). This paper uses the model below, as adopted from the work Zhao et al. [47].
Y i , t = α + β H S R i , t 1 + φ X i , t 1 + T t + μ i + ε i , t
Y i , t represents the financial development level of city  i in year t ; H S R i , t 1 is the variable of the opening intensity, representing the number of HSR lines opened in the city i in year t 1 . X i , t 1 is other control variables; T t is year fixed effect; μ i   is an urban fixed effect; Ɛ i , t is the random disturbance term. Since the opening of the HSR may have a time lag effect [15], and to better control the endogeneity, this paper treats all explanatory variables with a one-period lag.

3.2. Variable Definitions

The data processing software used in this paper is Stata 16. By removing some cities that are more severely lacking in original data, the panel data of 270 prefecture-level cities were finally obtained.

3.2.1. Dependent Variables

Financial development level—the development of finance should pay attention to both quantitative accumulation and qualitative improvement. On one hand, the expansion of financial volume can stimulate economic growth and inject vitality into economic and social development. On the other hand, finance is fragile. While the financial industry is booming, financial risks are also deepening. In view of this, this paper comprehensively analyzes urban financial development from the two aspects of financial broadening and financial deepening, using six dimensions to select indicators [47]. (It should be noted that the concept of “financial deepening” mentioned in this paper is not the same as financial deepening or financial liberalization in the traditional sense. This paper uses it more as an indicator of the quality of financial development, and compares it with the indicator of “financial broadening”, which measures the quantity.)
In terms of financial broadening, this paper uses the sum of deposit (S) and loan balances (L) of the financial institutions at the end of the year in each prefecture-level city in proportion to the urban GDP, that is, the financial correlation rate. The financial correlation rate is one of the most commonly used indicators to reflect the level of financial development. It reflects the proportion of economic development represented by financial industry development, which can better measure the scale of urban finance (FS) [4]. Location entropy index, as an effective index to measure the degree of agglomeration, has been widely adopted in academic circles. In this paper, urban and rural residents’ savings (D) location entropy is used to measure the level of urban financial agglomeration (FA) [48,49]. The ratio of the loan balance (L) to deposit balance (S) of financial institutions is adopted to reflect urban financial leverage (FL), which reflects the strength of supporting loans with urban deposits. The higher the value, the greater the risk. In terms of financial deepening, the ratio of GDP to the financial institution’s loan balance, per capita loans, and the ratio of financial institution deposit balance to urban and rural residents’ savings are used to reflect the financial efficiency (FE), financial depth (FD) and financial structure (FC). Peng et al. believe that financial efficiency reflects the supporting role of the financial system in economic and social development [48]. This paper adopts loan balance as an indicator of financial input and urban GDP as an indicator of output of financial use. The input–output ratio represents financial efficiency, which reflects the efficiency of financial loans to promote economic development. The loans per capita in each city indicate the coverability of the financial system for different regional social groups, and the increase in loans per capita reflects the level of funds available per capita, which is called financial depth. This indicator highlights the level of financial inclusiveness in China. In addition, this paper uses the proportion of urban and rural residents’ savings in financial institutions’ deposits to reflect the financial structure of each city. The specific indicators are explained in Table 1.

3.2.2. Independent Variables

This paper uses the number of high-speed rail lines in prefecture-level cities to measure the HSR opening intensity, and uses it as the core independent variable (HSR) for regression. Taking the intensity of Beijing in 2018 as an example, in that year, there were three lines, namely, the Beijing–Tianjin Intercity Rail, the Beijing–Shanghai HSR, and the Beijing–Zhengzhou Section of the Beijing–Guangzhou HSR. The number of established platforms in Beijing, that is, the opening intensity of Beijing HSR in 2018, is three. The measurement methods of other cities are the same, and the range of variables is 0 to 7. Table 2 shows the definitions of HSR and other control variables.
The values of absolute level variables fluctuate widely among individuals and may be influenced by the units of values taken, resulting in an unstable variance of the regression model. This paper refers to most of the literatures and takes the natural logarithm for all absolute level variables to avoid the problem of heteroskedasticity, which causes the model’s assumptions to be unmet.

4. Analysis of the Impact of HSR Construction on Financial Development

4.1. Regression Results

4.1.1. Results

To analyze the degree of impact of HSR construction on urban financial development, according to the models established by Equation (1), first, the HSR opening intensity variable (HSR) is regressed, before adding other control variables to perform panel data regression again. In order, regressions (1)–(12) are the results of regressions using the financial scale (FS), financial agglomeration (FA), financial leverage (FL), financial efficiency (FE), financial depth (FD), and financial structure (FC) as dependent variables. The odd-numbered columns are the results without the control variables, and the even-numbered columns are the results after adding control variables. Regressions (1)–(6) reflect the broadening of financial development, and regressions (7)–(12) reflect the deepening of financial development. Table 3 shows the regression results.
Table 3 shows that, except for regression (11), the coefficients of the HSR intensity variables are very significant. After adding the control variables, the significance level of all regression coefficients rises to 1%. This shows that the HSR construction has a significant impact on China’s urban financial development. The HSR shortens the spatiotemporal distance and accelerates the migration of people, logistics, capital, and information. The existing literature mainly focuses on the impact of HSR on the regional economy and the flow of talent. From the above table, we can see that the impact on urban finance is also very significant. The relationship between the HSR and regional financial development should also not be ignored.

4.1.2. Discussions

In terms of financial broadening, the regression coefficients of the HSR are all significantly negative, and they are still stable after adding the control variables. HSR construction improves regional accessibility [8], which in turn expands the range of financial services, makes the flow of funds more decentralized, regulates financial broadening, and reduces financial expansion. Hypothesis 1a is verified. Specifically, on one hand, the increase in the intensity of the HSR brings about a decline in the scale of urban finance and the degree of financial agglomeration. Further, it also reduces urban financial leverage. From regressions (2) and (4), it is clear that a one-unit addition of HSR intensity is associated with decreases of 0.2347 and 0.0693 in the financial scale and financial agglomeration of the city, respectively, which are approximately 9% and 7%. The spatiotemporal compression effect of the HSR reduces transaction costs and accelerates capital flow, thereby reducing the degree of capital agglomeration. By continuously exploring undervalued areas and promoting financial spillovers, the accumulation of financial bubbles is effectively alleviated, and the excessive expansion of financial scale is avoided to a certain extent, which is conducive to achieving a balanced regional development of finance. Meanwhile, the HSR expands the scope of capital overflow by reducing information asymmetry. With the drop in the cost of on-site research by analysts and supervisors, the ability to control financial risks has been enhanced, which can effectively curb the continuous deepening of financial leverage. As shown in regression (6), a one-unit addition of HSR intensity decreases the financial leverage of the city by about 4.3%. In terms of financial deepening, the increase in HSR lines promotes financial deepening. Hypothesis 1b is verified. The extended range of financial services facilitated by HSR (which means broadening) alleviates financial constraints and improves the availability of financial services, which in turn improves the financial efficiency of the city, enhances the financial depth, and changes the financial structure. The regression shows that a unit addition in the intensity of HSR increases the financial efficiency and depth of the city by 7.6% and 20.8%, respectively. The average change in financial structure is 2%. A comprehensive comparison of regressions (5), (6), (9) and (10) shows that the construction of the HSR reduces the loan balance of unit deposits on one hand, and significantly increases the loan balance of the unit population on the other hand. This shows that the connectivity of the HSR effectively changes the regional loan structure, promotes the transition of finance development from expansion to deepening, enables financial services to better meet the needs of the people, and enhances financial inclusiveness. Besides this, reductions in transaction costs and communication costs can improve the efficiency of the use of funds. At the same time, more perfect and convenient information access and regional connectivity can promote the rational allocation of financial resources, which not only effectively improves the urban financial efficiency, but also contributes to strengthening financial inclusion, that is, increasing financial depth. As a result, Hypothesis 1 is verified. The HSR construction promotes urban financial development.
In terms of control variables, the GDP growth rate is significant in all regressions, which is consistent with the previous analysis, indicating that the level of economic development has a significant effect on the six dimensions of financial development. Overall, the rise in urban GDP growth rate both increases financial expansion and promotes financial deepening. That is, it promotes financial development in terms of both quantitative expansion and qualitative enhancement. This result is consistent with the relevant literature [40,50]. Regions with faster economic development have relatively higher returns to capital, which can attract a large inflow of funds and promote the expansion of financial scale and agglomeration. Meanwhile, it promotes the efficiency of capital use and facilitates financial deepening. Different from the results of Cheng et al. [35], the coefficient of industrialization level is not significant in all regressions. It shows that the degree of correlation between industrial development and financial development is not obvious. One possible explanation is that the centers of manufacturing and financial industry are different; the development of each follows its own laws, and the overall development is not synchronized [49]. The coefficient of the variable PAS is heterogeneous in the regression of financial broadening and deepening. The increase in highway passenger traffic has significantly increased the scale and agglomeration of urban finance, but it has a negative effect on financial efficiency and financial depth. The increase in highway passenger traffic brings more labor resources to the city. The concentration of these laborers, especially high-quality financial talents, can promote the intensive development of the financial industry [39]. However, due to the changes in the spatial pattern and the different labor groups served by the HSR, the promotion of financial development by highways is more concentrated in financial broadening. In contrast, the population growth rate is negatively correlated with all three indicators of financial broadening, and positively correlated with financial efficiency. When the population growth rate increases, the scale of the city expands, the speed of capital absorption and transformation is improved, and the city’s capacity to accommodate increases, alleviating the excessively inflated financial volume, making the urban financial scale and the degree of agglomeration relatively decline, and thus controlling financial risks and improving financial efficiency. The impact of human capital on financial development is mainly concentrated in financial deepening, and has little effect on financial broadening. With the deepening of the education degree of the labor force, the quality of financial development is improved. Regression (2) and regression (6) show that the increase in government expenditure increases the scale of urban finance on the hand, and also reduces the financial leverage of the city on the other hand. Due to their own characteristics, local governments often see their expenditures as both stimulating and regulating social development. The government should give full play to the guiding effect of expenditures on society, and reduce financial risks while realizing the multiplier effect [51]. The increase in the level of openness not only changes the financial structure, but also reduces financial agglomeration, helping to regulate financial broadening. Liu believes that China’s existing “two ends outside” trade mode inhibits the financial development of different regions [50].

4.2. Robustness Test

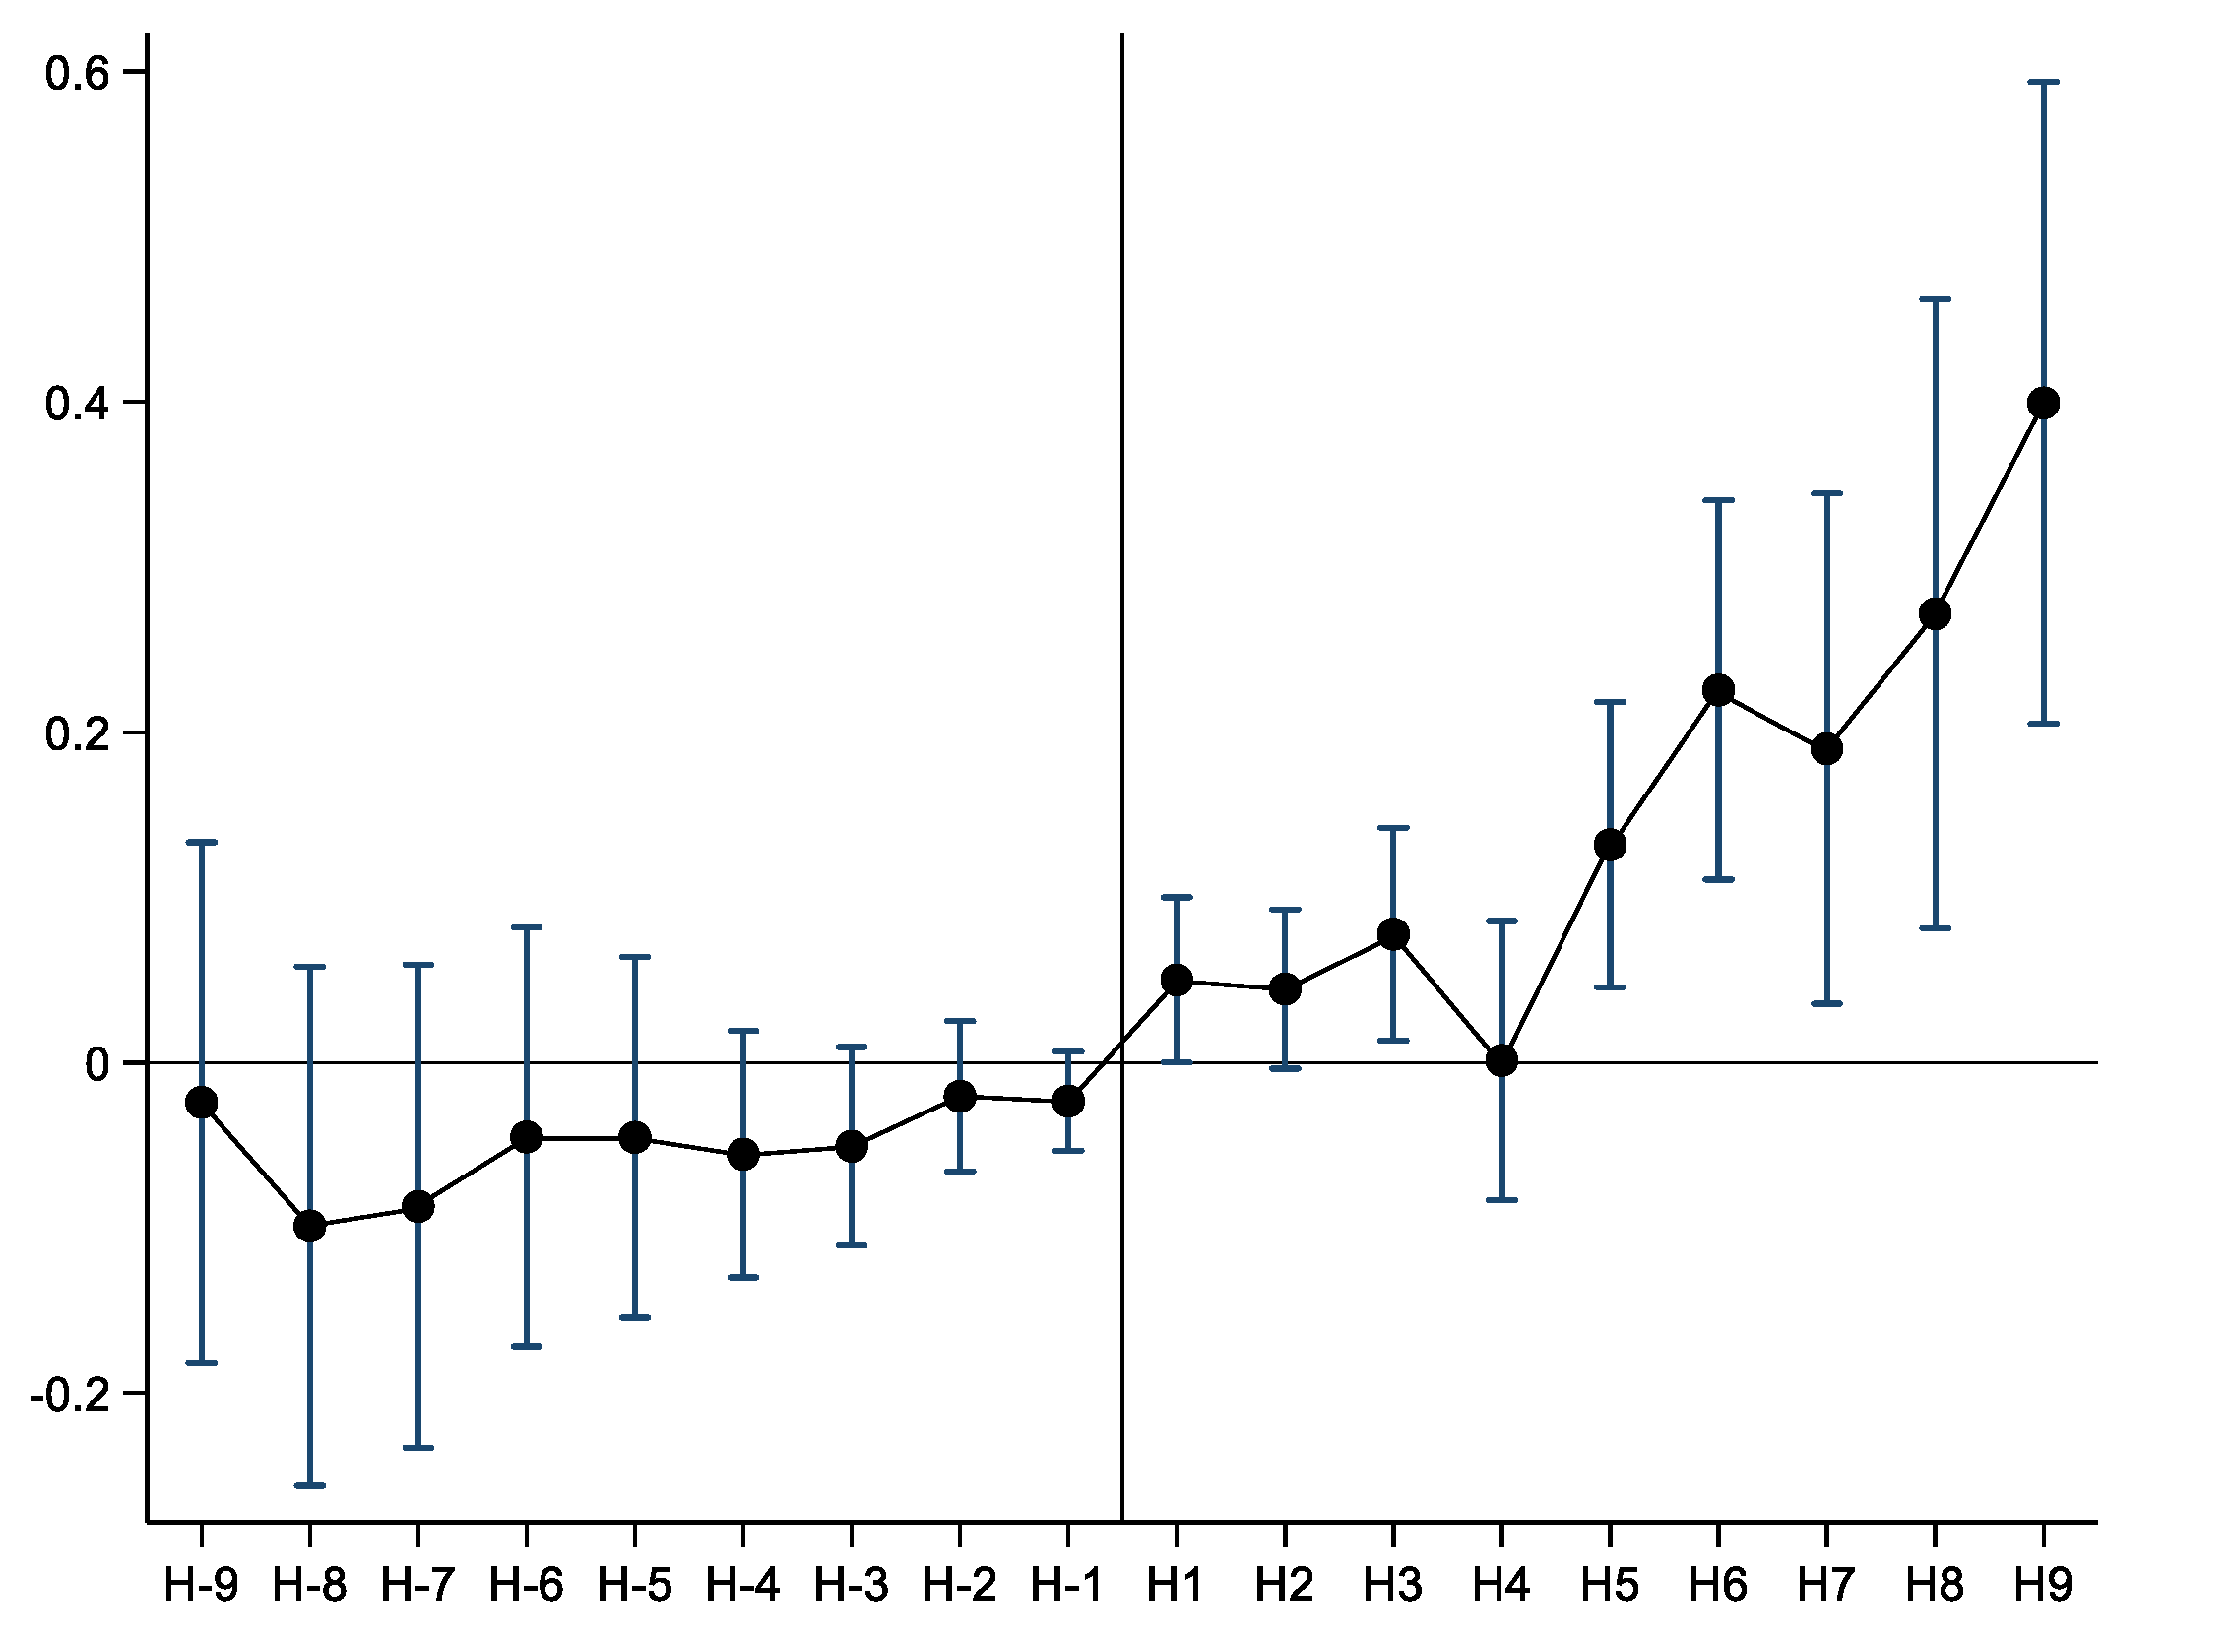
4.2.1. Parallel Trend Test

The premise of estimating the impact of HSR is that before the opening of HSR, cities with HSR and non-HSR should have the same change characteristics, that is, have parallel trends. With reference to the multi-period DID test method, this paper also sets the cities with the HSR as the treatment group and the cities without HSR as the control group during the sample period. Equation (2) is constructed to test the parallel trend of the sample to further increase the robustness of the conclusion.
Y i , t = α + β 1 H 9 i , t + + β 9 H 1 i , t + β 10 H 1 i , t + + β 18 H 9 i , t + φ X i , t 1 + T t + μ i + ε i , t
In Equation (2), Y i , t is the urban financial development indicators constructed in the previous section. H 1 to H 9 are dummy variables from 1 to 9 years before the opening of the HSR, the variable H i  takes the value of 1 in the  i t h year before the opening of the HSR, and it is 0 in the rest of the year. H 1 to H 9 are dummy variables 1 to 9 years after the opening of the HSR, and the value is also 0 or 1. Since there were few new HSR cities in 2008 and 2018, both in single digits, they were merged into variables H 9 and H 9 , respectively, that is, H 9 means 9 years before the opening of the HSR and earlier, and H 9 means after the opening of the HSR 9 years and later. As shown in Figure 1, regardless of financial broadening or financial deepening regression, the advance term coefficients β 1 to β 9 are all 0, indicating that there is no significant difference between the treatment group and the control group before the HSR is opened, that is, the parallel trend is satisfied. One year after the opening of the HSR, the difference between the two groups gradually becomes apparent, and over time, the difference gradually expands, reflecting the persistence of the HSR’s impact. With the passage of time, the opening intensity of urban HSR has gradually increased, and the network effect has had a stronger impact on urban financial development.

4.2.2. Regression of Non-Provincial Capitals and Non-Central Cities

As provincial capitals and non-provincial cities have significant differences in many aspects, provincial capitals and central cities, as the political, economic, and cultural centers of their regions, often more easily obtain a large number of policies and resource preferences. Whether it becomes the provincial capital and central city may affect the country’s HSR planning for the region [2]. Therefore, to reduce the impact of this on the regression results, this paper uses a sample that excludes provincial capitals and central cities for re-regression to enhance the robustness of the aforementioned conclusions. Table 4 shows the results. Regressions (13)–(18) show that the core variable HSR has a significant and negative impact on the three indicators of financial broadening. In terms of financial deepening, the HSR increases the financial efficiency and financial depth of non-provincial capitals and non-central cities (hereinafter referred to as non-provincial capital cities), and promotes the transformation of financial structure. It can be seen that after excluding provincial capitals and central cities, the aforementioned conclusion remains unchanged.

4.2.3. Propensity Score Matching Test

Propensity score matching (PSM) can alleviate the interference of other factors on the results. Considering that there may be obvious characteristic differences between cities with HSR (treatment group) and cities without HSR (control group), this paper uses the PSM method to select the control group with similar characteristics to the treatment group for regression. As shown in Table 5 and Table 6, the results find that the regression results are unchanged in both the full sample and non-provincial capital cities, indicating that the conclusion is very robust. The construction of the HSR affects financial development from both qualitative and quantitative aspects. Specifically, the increase in the intensity of the HSR reduces the scale and concentration of urban finance, which is conducive to financial deleveraging, while improving the efficiency and depth of urban finance, and changing the financial structure. This will further promote the transition of financial development from expansion to deepening.

4.2.4. Placebo Test

In order to prevent other unobservable factors from affecting the regression results, this paper puts the urban HSR opening intensity variable forward one period and uses the new HSR variable to perform regression according to Equation (1), that is, a placebo test. Table 7 shows the sample regression results. According to the results in Table 7, after one year in advance, the regression coefficient β of the full sample and non-provincial capital cities are both small and insignificant, which further enhances the robustness of the conclusions of this paper. Besides this, this paper also constructs a placebo test for the two groups of sample cities on the HSR intensity 2 and 3 years in advance, and the regression results show that the conclusion is still robust.

4.2.5. Difference-in-Differences Regression

Hub Cities

This paper finds that the use of the HSR opening intensity analysis can simultaneously reflect the effects of whether the HSR is opened and the number of open lines on the city’s financial development, making the evaluation results more comprehensive. However, considering the natural advantages of the difference-in-differences (DID) model in policy effect evaluation, for the convenience of comparison, based on the above tests, this paper replaces the measurement method of the core explanatory variable HSR in Equation (1). The DID model is mainly used in sociology to evaluate policy effects. The rationale is based on a counterfactual framework for assessing the change of dependent variable both in cases where policy occurs and in those where it does not occur. Considering the asymptotic nature of HSR opening, this paper constructs a multi-period DID model for regression. In this case, the variable HSR in Equation (1) is a DID term, that is, a 0–1 dummy variable. Because the network effect will only appear when the city becomes an HSR hub city, that is, when different lines are connected, the corresponding HSR opening intensity of the city should be equal to or greater than 2. Therefore, when a city has more than two HSR lines in the year, the variable HSR is 1, indicating that the city has become a hub. Otherwise, it is 0, indicating that the city is not an HSR hub city, and there is no network effect at this time. If the coefficient β is positive, it indicates that the opening of the HSR promotes financial development, and this promotion is reflected by the network effect after becoming a hub city. The remaining control variables in the model remain unchanged. Consistent with the above, all explanatory variables of the model are treated with a one-period lag. The specific regression results are shown in Table 8.
In Table 8, regressions (43)–(48) show that regardless of whether it is financial broadening or financial deepening, the coefficients of the variable HSR are significant, and the signs are the same as those in Table 3. The analysis results of the six dimensions all reflect the obvious impact of the HSR on urban financial development, and the conclusions obtained are consistent with the previous analysis. Meanwhile, the DID results verify the existence of network effects. That is, compared with non-hub cities, the financial development of the hub cities is more strongly influenced by HSR. As the hub city is the intersection of the flow of elements, the opening of different HSR lines has brought about multiple growths in local connectivity. This network effect of the HSR has amplified the changes in the spatial pattern of transportation infrastructure, making different elements flowing through the network dependent on hub cities. Financial resources are more likely to be integrated into hub cities, which in turn changes the development of urban finance. Furthermore, this paper also performs PSM processing on the samples before regression, and the regression results after PSM are shown in (49)–(54). It can be seen from the above table that after matching, the significance level of the HSR has risen, and the sign remains unchanged, which reflects the robustness of the conclusion.

Median Division

It can be seen from the above that when a city has more than two HSR lines, as a connection node, the city will inevitably become an HSR hub city. To further examine the network effects of hub cities, and to enhance the robustness of the foregoing conclusions, this paper adjusts the setting of core variables again. According to the value range of China’s HSR opening intensity, this paper divides it by the median. Considering that there are only three cities with the highest intensity of 7, this paper selects the median (3) between 0 and 6 to divide all the sample cities, and sets the 0-1 dummy variable. Specifically, for cities with more than three HSR lines open to traffic in a year, the variable HSR takes the value 1, and the variable HSR takes the value 0 if it does not reach 3. The adjusted DID results are shown in Table 9. All the regression coefficients are very significant, the signs remain unchanged compared with Table 8, and the absolute value has increased.
In addition, considering the gradualness of policy implementation in multi-period DID, this paper also refers to the processing methods of the related literature, and conducts a PSM test with a year-by-year matching method. The conclusion is also the same. Similarly, this paper also adopts the same analysis for non-provincial capital cities, including DID regression with two different settings, PSM-DID regression and DID regression with matching by year. All regression results enhance the robustness of the aforementioned conclusions.

4.3. Endogenous Test

A series of robustness tests verify the promotion effect of HSR on urban financial development. However, urban financial development may also affect HSR construction. Although this paper has treated the HSR variable with a one-period lag in the regression, this still cannot completely avoid the possible two-way causality. Meanwhile, considering the omitted variable problem with limited control variables and the measurement error, this paper constructs instrumental variables for two-stage least square regression (2SLS) to avoid the model’s possible endogeneity problem. The geographical slope reflects the topographical conditions of each city, which indirectly affects the cost of HSR construction and thus correlates with the HSR opening intensity. In addition, the construction of HSR in China is based on the historical railroad infrastructure, and the historical railroad network indirectly influences the HSR layout. In this paper, the 1984 urban railroad passenger volume is used as the urban historical railroad data, which also has a certain degree of correlation with the HSR opening intensity. Obviously, both geographical slope and historical railway data are exogenous. Since the two indicators do not change over the sample period, this paper multiplies them with the year dummy variable for instrumental variables regression.
The F-value of the first stage regression is larger than 10, and significant at the 1% level. The 2SLS regression results show that the core explanatory variable HSR is significant in all regressions, with no change either positive or negative. The absolute values of the coefficients all increase compared to Table 3. This still shows that HSR construction reduces financial expansion and promotes financial deepening. In other words, the HSR promotes financial development, and the previous conclusion remains unchanged. The results are shown in Table 10.

5. Further Analysis

5.1. Heterogeneity Analysis

The HSR shortens the spatiotemporal distance and changes the spatial pattern. The spatiotemporal compression of the “shrinking continent” brought about by HSR will further affect economic geography. The improvement of transportation facilities can promote the balanced development of the economy [52]. Li et al. further concluded that the opening of the HSR promotes economic agglomeration in the western region, which is conducive to economic equilibrium [53]. This phenomenon of the development of underdeveloped regions driven by the spillover of factors such as knowledge or technology is called the “spillover effect”. However, some scholars believe that the improvement of transportation facilities will lead to the transfer of factor resources to regional central cities [54,55]. The opening of the HSR strengthened the status of central cities while marginalizing peripheral cities [56]. This is called the “siphon effect”.
To further discuss the heterogeneous impact of HSR construction on the financial development in different regions and based on relevant research, this paper classifies the samples according to China’s four major economic regions and constructs region dummy variables (Middle, West and Northeast). If the city belongs to one of the regions, the corresponding dummy variable takes the value of 1, otherwise it is 0. If the city belongs to the eastern region, the three variables are all equal to 0. The interaction items between them and HSR are added in the regression, and the results are shown in Table 11.
It can be seen from Table 11 that the HSR mainly reduces financial agglomeration in the eastern region, and this effect is weakened in the middle and the northeastern regions (and even increases the financial scale in the northeastern region). In terms of financial deepening, with the network construction of the HSR, the financial efficiency and financial depth of the eastern region have been significantly improved, and the financial structure has changed. Compared with the inland areas, the financial development in the eastern coastal areas of China is relatively high, and the agglomeration is serious. The increase in transportation convenience reduces the cost of capital flow, promotes financial diffusion in the eastern region, and avoids the asset bubble formed by excessive capital concentration to some extent, which is conducive to the improvement of its financial efficiency.
HSR also reduces the financial scale and increases financial efficiency and financial depth in the middle region (although not as strong as compared to the eastern region), but the impact on financial agglomeration is really weak (the sum of the coefficients is very small). This may be due to this region being in the middle of China’s territory. Both the spillover and siphon effects are relatively strong, so the agglomeration effect of the opening of the HSR is uncertain in the short term. In terms of financial deepening, the opening of the HSR has promoted the improvement of financial efficiency and depth in the middle region. The middle region is located in the transportation hub of China’s “eight vertical and eight horizontal” HSR corridors. The effect of improving the liquidity of factors such as goods, funds and information is more obvious after the opening of the HSR.
Compared with the eastern region, the degrees of agglomeration and efficiency improvement in the western and northeast regions are more obvious. The HSR speeds up the regional competition by reducing transportation costs, and this competitive effect tends to have a greater impact on underdeveloped areas [5]. The intensification of competition injects vitality into the regional financial development and forces the continuous transformation of the local financial structure, thus improving the financial efficiency.
Alternatively, the level of economic development can be used to distinguish different regions. In China, the eastern region is relatively developed, followed by the middle region, and the economic development level of the western and northeastern regions is relatively backward. Given this, this paper further includes the regional economic development (per capita GDP) as a region proxy variable in regression analysis, and thus verifies whether the reduction in financial expansion really demonstrates a broadening characteristic, and whether the level of economic development can affect the promotional effect of HSR on financial development. This paper adds the interaction variable (HSR×PGDP) between the HSR opening intensity (HSR) and urban GDP per capita (PGDP) (unit: CNY 1000) to model (1) for regression, and the results are shown in Table 12.
The results are highly consistent with those in Table 11. Specifically, the coefficient of the interaction variable (HSR×PGDP) shows that, in terms of financial broadening, the negative effect of HSR on urban financial scale and agglomeration gradually increases with the rise in GDP per capita. In the aspect of financial leverage, the moderation effect is not significant. Combined with the coefficients of the variable HSR, it is clear that when the city is at a low level of economic development or at an undeveloped stage, the decreasing effect of HSR on financial expansion is not strong, and it even promotes urban financial expansion. The effect of HSR on financial expansion turns from positive to negative when the level of economic development of the city is high. Furthermore, the higher the level of the economy, the stronger the effect of HSR on the reduction in financial expansion. Regressions (7) and (8) show that the critical values for the positive-to-negative change of financial scale and financial agglomeration in cities are CNY 45.43 thousand and CNY 44.87 thousand, respectively. In other words, when the annual per capita GDP of cities is below CNY 45.43 thousand or 44.87 thousand, HSR construction has a positive effect on urban financial scale and financial agglomeration, and a negative effect when it exceeds these (the mean value of per capita GDP of 270 prefecture-level cities is CNY 43.53 thousand, and the median value is CNY 34.10 thousand). This indicates that HSR construction promotes the diffusion of financial services from developed to less developed regions. While reducing the excessive financial scale and agglomeration in developed regions, HSR also enhances the financial scale and agglomeration in less developed regions, which means that the HSR regulates financial broadening.
In terms of financial deepening, the economic level has a positive moderation effect. The more developed the economy is, the higher the increase in financial efficiency and financial depth by HSR, and the lower the share of residents’ savings out of financial institutions’ deposits. This is probably due to the excessive financial concentration in developed regions. The higher the level of economic development, the more serious the financial bubble in the city, and redundant funds bring about inefficient use. HSR construction is conducive to promoting the rationalization of capital distribution, and the financial broadening it creates reduces the excessive financial expansion in developed regions and enhances financial efficiency. In contrast, due to the more serious financial constraints in less developed regions, the efficiency improvement brought about by HSR is relatively limited [30]. Meanwhile, in addition to promoting capital diffusion, HSR also helps achieve the cross-regional transfer of labor in developed regions, leading to a more pronounced impact on financial depth and resident savings in developed regions. The results in Table 12 further reflect the heterogeneous impact of HSR on financial development between developed and less developed regions.

5.2. Indirect Mechanism Analysis

According to the regression results of the fourth part, the HSR has a significant impact on urban financial development, and its opening promotes financial deepening and reduces financial expansion. As the cost of residents’ travel has been reduced, the connections of cities have become closer, and people’s movements become more and more frequent. For example, China’s passenger volume reached 2.29 billion in 2019. Especially for hub cities, as connection nodes between HSR cities, the role of the HSR in promoting population mobility is particularly obvious. With the acceleration of population migration, capital and information flow will also shift. Therefore, to further test the indirect mechanism of the effect of HSR on financial development, this paper takes the total year-end population (TP) of each prefecture-level city as the mediating variable to rebuild the mediating effect regression model (3), and carries out regression on the data to study whether the HSR has an impact on urban financial development by promoting population mobility.
Y i , t = α + β H S R i . , t 1 + φ X i , t 1 + T t + μ i + ε i , t T P i , t = α + β H S R i . , t + φ X i , t + T t + μ i + ε i , t Y i , t = α + β H S R i . , t 1 + γ T P i , t 1 + φ X i , t 1 + T t + μ i + ε i , t
In model (3), HSR is the variable of the HSR opening intensity, T P is the population of each prefecture-level city as a mediator, and γ is the financial development variable of each prefecture-level city, including six dimensions. The regression results of the first equation are the same as those in Table 3 and will not be reported here. The regression (25) in Table 12 is the regression result of the second equation in model (3). Regressions (26)–(31) are the regression results of the third equation. The regression shows that the construction of the HSR has promoted population mobility and increased the population of hub cities, and this result is significant at the 1% level. Specifically, the HSR brings about population transfer among cities. As opening intensity has increased, a large number of laborers have gathered in hub cities. The increase in labor reduces the relative scale, agglomeration, and risks of the city’s financial development. To a certain extent, the occurrence of financial bubbles can be avoided. At the same time, the HSR promotes urban financial efficiency and financial depth by facilitating population mobility, forcing changes in financial structure. It can be seen from Table 13 that in all regressions after adding the variable TP, the absolute values of the HSR coefficient decrease compared with Table 3, and the signs remain unchanged. This verifies Hypothesis H3, that HSR indirectly affects urban financial development by promoting population mobility.

6. Conclusions and Policy Recommendations

6.1. Conclusions

This paper examines the impact of HSR on regional financial development from the two dimensions of financial broadening and financial deepening. Specifically, this paper use the data of 270 cities in China from 2008 to 2018 as a sample to explore the relationship between HSR construction and financial development. The study indicates that HSR promotes financial development and significantly contributes to both financial broadening and deepening. The HSR reduces the scale and agglomeration of the city’s excessively inflated finance, lowers financial risks, and to a certain extent, avoids the financial bubbles caused by excessive financial concentration. It is beneficial in regulating broadening and achieving balanced regional development. Besides this, it also improves the cities’ financial efficiency and financial depth, and changes the financial structure. The heterogeneity analysis shows that because the high traffic accessibility of the middle region and the network effect is strong, HSR construction has the most obvious impact on the middle region. With the increasingly dense network of the HSR, the urban financial scale and financial leverage have declined, while the financial depth and efficiency have increased significantly. The HSR network reduces the financial agglomeration in the eastern region to a certain extent, but at the same time increases urban financial deepening. The promotion of the western region is mainly reflected in financial efficiency. In addition, the effect of HSR on the reduction of financial expansion and the enhancement of financial deepening is stronger in more economically developed regions. The indirect mechanism analysis indicates that the HSR can affect financial development by promoting the migration of population among cities. With the increase in the opening intensity of the HSR, a large number of laborers have gathered in hub cities. Labor mobility reduces the relative scale and agglomeration of urban financial development, mitigates financial risks, and then avoids the generation of financial bubbles. Meanwhile, the HSR increases urban financial efficiency and financial depth by promoting population mobility, and facilitates a change in the financial structure, which means that the quality of the urban financial development is enhanced. The enlightenments yielded are as follows.

6.2. Practical Implications

First, this paper is expected to attract attention to the impact of transportation conditions on financial markets. The impact of HSR construction on economic growth and balanced regional development has been the focus of academic debates. However, few studies concern the relationship between HSR and finance. As the core of the modern economy [16], the financial service industry has obvious geographical characteristics [12]. Studies show that the value discovery brought about by HSR, the soft information transfer formed, and the structural adjustments generated have led to profound changes in urban financial activities. The network effects of HSR gradually reshape the geographic patterns on which financial activities depend, facilitating the widening of the scope and use penetration of financial services, and consequently promoting urban financial development. The conclusions of this paper further enrich the theory of HSR economics and the theory of financial geography, and provide theoretical references for regional financial development. Accordingly, government departments should continue to improve the interconnection of transportation infrastructure within city clusters to promote the efficient flow and allocation of resources. Meanwhile, the financial system should be reformed to reduce the administrative intervention of local governments in the financial system, and make the cross-regional flow of capital more flexible. On one hand, the government could broaden the scope of financial services and improve the availability of funds. On the other hand, it could guarantee the use of financial services and enhance capital use efficiency. To complement the cross-regional flow of capital, it should also promote the cross-regional flow of labor, information, technology, and other factors of production that are complementary to capital simultaneously. The governments in China and other developing countries should further liberalize the household registration system so that labor can follow capital and move more freely, which will enhance the efficiency of factor allocation while allowing labor to obtain more employment opportunities and enjoy more equitable public services.
Second, financial development should not only focus on the accumulation of quantity, but also on the improvement of quality. This paper analyzes the financial effects of HSR construction in terms of financial broadening and deepening. The results demonstrate that the networked development of HSR regulates financial broadening and promotes urban financial deepening. That said, HSR helps promote the shift in finance from quantitative development that simply pursues volume expansion to high-quality development that focuses more on quality. Specifically, along with financial broadening, the scale and agglomeration of urban finance both decrease, bringing about a reduction in financial leverage. Concurrently, financial deepening indicators, measured by both financial efficiency and financial inclusion (that is, financial depth), significantly improve, and the financial structure of the city changes. The regression results of different indicators are of importance for strengthening financial deleveraging, adjusting the structure of regional financial development, and achieving high-quality financial development. Therefore, on the one hand, governments in developing countries should take into account the actual situation in constructing HSR so that it can adapt to the needs of social and economic development. They should avoid over-investment, which leads to construction speeds beyond the inherent tolerance of the society, thus crowding out the development space of related industries. They should promote the networked development of HSR in a planned manner, making an overall consideration, avoiding excessive over- or lagging construction, and thus promoting the sustainable development of urban finance and economy. On the other hand, local governments should seize the opportunity of densifying the HSR network to maintain growth, adjust structure, improve efficiency and reduce risks in financial development, thus gradually helping urban finance to become better and stronger.
Finally, according to local conditions, the path of the mechanism by which HSR influences urban financial development should be reinforced. Further analysis results indicate that the impact of HSR on financial development in different regions is heterogeneous. Therefore, the developing countries should take into account their own situation, adapt to local conditions, give full play to their own advantages, increase the training of financial talents, strengthen the exchange of financial talents, and attract the inflow of financial talents. Their governments should improve the financial service system, enhance the industrial supporting capacity, further promote the interconnection of regional cities, and avoid the widening of the gap, while strengthening openness to achieve integrated regional development.

6.3. Limitations and Future Research

It should be noted that the impact of HSR construction on urban financial development concluded in this paper is only one aspect of the many impacts, and the importance of HSR construction cannot be simply and unilaterally evaluated. On one hand, the economy and finance are interrelated. In addition to examining the role of HSR on finance, it is also important to study the role of HSR on other economic activities. For example, Du and Peng found that the opening of the HSR promoted the inflow of high-level talents from non-state-owned, listed companies [57]. Feng et al. believe that the construction of the HSR improves the productivity of non-central cities [58]. The HSR has many effects on other aspects of economic life [59], which are still to be explored by subsequent scholars. The significance of this paper is to supplement and expand the study of HSR economics by analyzing financial development. On the other hand, the impacts of the HSR on financial development coexist in the long and short term, and its effects may be different. The new school of economic geography implies that due to the reduction in transportation costs brought about by the opening of the HSR, central cities experience more obvious agglomeration effects in the short term, and peripheral cities will benefit more from diffusion effects in the long term [60]. In this paper, due to the limited scope of the sample interval, the analysis results are mainly short-term effects. However, Liu and Zhao believe that labor mobility and migration are relatively long-term choices, and the analysis of long-term effects should be emphasized [61]. This paper uses the short-term analysis of HSR construction to act as a preliminary guide for long-term financial development, so as to better guide long-term research.

Author Contributions

Conceptualization, D.L.; Methodology, R.J.; Software, Z.L.; Validation, S.S.; Formal analysis, L.W. All authors have read and agreed to the published version of the manuscript.

Funding

This research was funded by [National Natural Science Foundation of China] grant number [71874138].

Institutional Review Board Statement

Not applicable.

Informed Consent Statement

Not applicable.

Data Availability Statement

No new data were created.

Conflicts of Interest

The authors declare no conflict of interest.

References

  1. Lu, J.; Song, J.T.; Liang, Y.S.; Xu, J. The simulation of spatial distribution patterns of China’s HSR-economic zones based on the 2D time-space map. Acta Geogr. Sin. 2013, 68, 147–158. [Google Scholar]
  2. Liu, Y.Z.; Li, Y. High-speed rails and city economic growth in China. J. Financ. Res. 2017, 11, 18–33. [Google Scholar]
  3. Wang, C.; Meng, W.; Hou, X. The impact of high-speed rails on urban economy: An investigation using night lighting data of Chinese cities. Res. Transp. Econ. 2020, 80, 100819. [Google Scholar] [CrossRef]
  4. Goldsmith, R.W.; Raymond, W. Financial Structure and Development; Yale University Press: New Haven, CT, USA, 1969; Volume 2, pp. 193–194. [Google Scholar]
  5. Guiso, L.; Sapienza, P.; Zingales, L. Does Local Financial Development Matter? Q. J. Econ. 2004, 119, 929–969. [Google Scholar] [CrossRef]
  6. Banerjee, A.; Duflo, E.; Qian, N. On the road: Access to transportation infrastructure and economic growth in China. J. Dev. Econ. 2020, 145, 102442. [Google Scholar] [CrossRef] [Green Version]
  7. Ma, G.R.; Cheng, X.M.; Yang, E.Y. How does transportation infrastructure affect capital flows—A study from high-speed rail and cross-region investment of listed companies. China Ind. Econ. 2020, 6, 5–23. [Google Scholar]
  8. Wang, J.; Hu, G.H. The Evaluation of the Development of China’s Inclusive Finance and the Analysis of Factors. Financ. Forum 2013, 18, 31–36. [Google Scholar]
  9. Rajan, R.G.; Zingales, L. Financial Dependence and Growth. Am. Econ. Rev. 1998, 88, 559–586. [Google Scholar]
  10. Liu, C.; Liu, C.R.; Sun, T. Transportation infrastructure, financial constraint and county industry development: Evidence from China’s national trunk highway system. Manag. World 2019, 35, 78–88. [Google Scholar]
  11. Mckinnon, R. Money and Capital in Economic Development; Brookings Institution: Washington, DC, USA, 2010. [Google Scholar]
  12. Laulajainen, R. Financial Geography: A Banker’s View; Routledge: New York, USA, 2003. [Google Scholar]
  13. Wangtu, A.X.; Jiangping, Z.; Linchuan, Y.; Ling, L. The implications of high-speed rail for Chinese cities: Connectivity and accessibility. Transp. Res. Part A 2018, 116, 308–326. [Google Scholar]
  14. Zhao, J.; Huang, J.C. China high-speed railways and stock price crash risk. Manag. World 2018, 34, 157–168+192. [Google Scholar]
  15. Long, Y.; Zhao, H.L.; Zhang, X.D.; Li, Y. High-speed railway and venture capital investment. Econ. Res. J. 2017, 52, 195–208. [Google Scholar]
  16. Wang, Z.L.; Lin, X.Y.; Gao, H.W. A study on the impact of transportation infrastructure on financial agglomeration: An evidence based on railways and highways. Macroeconomics 2020, 12, 47–61+120. [Google Scholar]
  17. De Ureña, J.M. (Ed.) Territorial Implications of High Speed Rail: A Spanish Perspective; Routledge: New York, USA, 2016. [Google Scholar]
  18. Redding, S.J.; Turner, M.A. Transportation costs and the spatial organization of economic activity. Handb. Reg. Urban Econ. 2015, 5, 1339–1398. [Google Scholar]
  19. Chen, C.L.; Hall, P. The wider spatial-economic impacts of high-speed trains: A comparative case study of Manchester and Lille sub-regions. J. Transp. Geogr. 2012, 24, 89–110. [Google Scholar] [CrossRef]
  20. Heuermann, D.F.; Schmieder, J.F. The effect of infrastructure on worker mobility: Evidence from high-speed rail expansion in Germany. J. Econ. Geogr. 2019, 19, 335–372. [Google Scholar] [CrossRef]
  21. Ke, X.; Chen, H.; Hong, Y.; Hsiao, C. Do China’s high-speed-rail projects promote local economy?—New evidence from a panel data approach. China Econ. Rev. 2017, 44, 203–226. [Google Scholar] [CrossRef]
  22. Liu, S.; Wan, Y.; Zhang, A. Does China’s high-speed rail development lead to regional disparities? A network perspective. Transp. Res. Part A Policy Pract. 2020, 138, 299–321. [Google Scholar] [CrossRef]
  23. Li, X.; Wu, Z.; Zhao, X. Economic effect and its disparity of high speed rail in China: A study of mechanism based on synthesis control method. Transp. Policy 2020, 99, 262–274. [Google Scholar] [CrossRef]
  24. Meng, X.; Lin, S.; Zhu, X. The resource redistribution effect of high-speed rail stations on the economic growth of neighbouring regions: Evidence from China. Transp. Policy 2018, 68, 178–191. [Google Scholar] [CrossRef]
  25. Zhang, F.; Yang, Z.; Jiao, J.; Liu, W.; Wu, W. The effects of high-speed rail development on regional equity in China. Transp. Res. Part A Policy Pract. 2020, 141, 180–202. [Google Scholar] [CrossRef]
  26. Claessens, S.; Laeven, L. Financial development, property rights, and growth. J. Financ. 2003, 58, 2401–2436. [Google Scholar] [CrossRef] [Green Version]
  27. Madsen, J.B.; Islam, M.R.; Doucouliagos, H. Inequality, financial development and economic growth in the OECD, 1870–2011. Eur. Econ. Rev. 2018, 101, 605–624. [Google Scholar] [CrossRef]
  28. Clark, G.L. London in the European financial services industry: Locational advantage and product Complementarities. J. Econ. Geogr. 2002, 2, 433–453. [Google Scholar] [CrossRef]
  29. De Rus, G. Economic Analysis of High Speed Rail in Europe, Fundacion BBVA/BBVA Foundation. 2012. Available online: https://econpapers.repec.org/bookchap/fbbreport/2012126.htm (accessed on 30 June 2012).
  30. Bian, Y.C.; Wu, L.H.; Bai, J.H. Does high-speed rail improve regional innovation in China? J. Financ. Res. 2019, 6, 132–149. [Google Scholar]
  31. Agarwal, S.; Hauswald, R. Distance and private information in lending. Rev. Financ. Stud. 2010, 23, 2757–2788. [Google Scholar] [CrossRef]
  32. Cook, G.A.S.; Pandit, N.R.; Beaverstock, J.V.; Taylor, P.J.; Pain, K. The role of location in knowledge creation and diffusion: Evidence of centripetal and centrifugal forces in the City of London financial services agglomeration. Environ. Plan. A-Econ. Space 2007, 39, 1325–1345. [Google Scholar] [CrossRef]
  33. Zhao, S.X.B.; Zhang, L.; Wang, D.T. Determining factors of the development of a national financial center: The case of China. Geoforum 2004, 35, 577–592. [Google Scholar] [CrossRef] [Green Version]
  34. Liberti, J.M.; Petersen, M.A. Information: Hard and soft. Rev. Corp. Financ. Stud. 2019, 8, 1–41. [Google Scholar] [CrossRef] [Green Version]
  35. Chu, J.; Fang, J.X. Improvement of transport infrastructure and bank loan decision: Based on a quasi—Natural experiment of high-speed railway in China. Account. Econ. Res. 2019, 33, 38–60. [Google Scholar]
  36. Hollander, S.; Verriest, A. Bridging the gap: The design of bank loan contracts and distance. J. Financ. Econ. 2016, 119, 399–419. [Google Scholar] [CrossRef]
  37. Coto-Millán, P.; Inglada, V.; Rey, B. Effects of network economies in high-speed rail: The Spanish case. Ann. Reg. Sci. 2007, 41, 911–925. [Google Scholar] [CrossRef]
  38. Dong, Y.M.; Zhu, Y.M. Can high-speed rail construction reshape the layout of China’s economic space—Based on the perspective of regional heterogeneity of employment, wage and economic. China Ind. Econ. 2016, 10, 92–108. [Google Scholar]
  39. Taylor, A.; Beaverstock, J.V.; Cook, G.; Pandit, N.; Pain, K. Financial Services Clustering and Its Significance for London; Corporation of London: London, UK, 2003. [Google Scholar]
  40. Cheng, X.; Wang, M.Y.; Tian, X.; Kang, M.M. Spatial dynamic differences and influencing factors of China’s financial development level. Financ. Forum 2018, 23, 43–54. [Google Scholar]
  41. Joassart-Marcelli, P.; Stephens, P. Immigrant banking and financial exclusion in greater boston. J. Econ. Geogr. 2010, 10, 883–912. [Google Scholar] [CrossRef]
  42. Sarma, M.; Pais, J. Financial inclusion and development. J. Int. Dev. 2011, 23, 613–628. [Google Scholar] [CrossRef]
  43. Lu, J.; Jin, X.J. China’s regional financial development: Geographical environment and economic policy—An empirical analysis based on the perspective of financial geography. Financ. Theory Pract. 2007, 6, 7–9. [Google Scholar]
  44. Poncet, S.; Steingress, W.; Vandenbussche, H. Financial Constraints in China: Firm-Level Evidence. China Econ. Rev. 2010, 21, 411–422. [Google Scholar] [CrossRef] [Green Version]
  45. Song, Z.; Storesletten, K.; Zilibotti, F. Growing Like China. Am. Econ. Rev. 2009, 101, 196–233. [Google Scholar] [CrossRef] [Green Version]
  46. Allen, F.; Bartiloro, L.; Gu, X.; Kowalewski, O. Does economic structure determine financial structure? J. Int. Econ. 2018, 114, 389–409. [Google Scholar] [CrossRef]
  47. Zhao, Z.; Zheng, Y.; Chen, Y.; Ye, C.; He, Z. Research on the Impact of Innovative City Construction on Financial Development: Evidence from China. Discret. Dyn. Nat. Soc. 2021, 2021, 7541690. [Google Scholar] [CrossRef]
  48. Peng, Y.C.; Huang, X.J.; Shen, J. Real estate investment and financial efficiency: Regional variation in shifting financial resouces from real to fictitious sector. J. Financ. Res. 2018, 8, 51–68. [Google Scholar]
  49. Yu, Y.Z.; Xuan, Y.; Shen, Y.Y. The spatial spillover effect of financial agglomeration on the improvement of industrial efficiency. J. World Econ. 2013, 36, 93–116. [Google Scholar]
  50. Liu, T.S. A spatial panel econometric analysis of influencing factors in regional financial development. J. Financ. Econ. 2011, 7, 33–35. [Google Scholar]
  51. Russo, F. Which High-Speed Rail? LARG Approach between Plan and Design. Future Transp. 2021, 1, 202–226. [Google Scholar] [CrossRef]
  52. Behrens, K.; Lamorgese, A.R.; Ottaviano, G.I.; Tabuchi, T. Changes in transport and non-transport costs: Local vs global impacts in a spatial network. Reg. Sci. Urban Econ. 2007, 37, 625–648. [Google Scholar] [CrossRef] [Green Version]
  53. Li, H.C.; Tjia, L.; Hu, S.X. Agglomeration and equalization effect of high speed railway on cities in China. J. Quant. Tech. Econ. 2016, 33, 127–143. [Google Scholar]
  54. Faber, B. Trade integration, market size, and industrialization: Evidence from China’s National Trunk Highway System. Rev. Econ. Stud. 2014, 81, 1046–1070. [Google Scholar] [CrossRef] [Green Version]
  55. Qin, Y. ‘No county left behind?’ The distributional impact of high-speed rail upgrades in China. J. Econ. Geogr. 2017, 17, 489–520. [Google Scholar] [CrossRef] [Green Version]
  56. Wang, Y.F.; Ni, P.F. Economic growth spillover and spatial optimization of high-speed railway. China Ind. Econ. 2016, 2, 21–36. [Google Scholar]
  57. Du, X.Q.; Wei, P.M. Do high-speed trains motivate the flow of corporate highly educated talents? Bus. Manag. J. 2017, 39, 89–107. [Google Scholar]
  58. Feng, S.; Fan, H.Z.; Zhang, Y.H. Influences of high-speed railway on urban productivity. Urban Probl. 2018, 6, 14–19. [Google Scholar]
  59. Chen, Z.; Xue, J.; Rose, A.; Haynes, E.H. The impact of high-speed rail investment on economic and environmental change in China: A dynamic CGE analysis. Transp. Res. Part A Policy Pract. 2016, 92, 232–245. [Google Scholar] [CrossRef]
  60. Combes, P.P.; Mayer, T.; Thisse, J.F. Economic Geography: The Integration of Regions and Nations; Princeton University Press: Princeton, NJ, USA, 2008. [Google Scholar]
  61. Liu, J.F.; Zhao, Y. Can the high-speed rail construction promote the spatial equilibrium develpoment of urbanization? An analysis based on 163 prefectural level data of China’s middle west region. Urban Probl. 2018, 5, 15–25. [Google Scholar]
Figure 1. Parallel trend test (This figure is drawn according to the variable FE, the results of the other variables remain unchanged).
Sustainability 15 10641 g001
Table 1. Dependent variables selection.
Dependent VariablesMeasurement
F S i , t The financial scale of city i in year t is measured by the financial correlation rate. The calculation formula is: F s = ( S + L ) / G D P .
F A i , t The financial agglomeration of city i in year t is measured by the location entropy of residents’ deposits. Calculation formula is: F A = ( D / P ) / ( D / P ) . P represents the total population of the city at the end of the year.
F L i , t The financial leverage of city i in year t is measured by the ratio of the loan balance of the financial institution to the deposit balance. The calculation formula is: F L = L / S .
F E i , t The financial efficiency of city i in year t is measured by the ratio of GDP to the loan balance of financial institutions. The calculation formula is: F E = G D P / L .
F D i , t The financial depth of city i in year t is measured by per capita loans. The calculation formula is: F D = L / P . P represents the total population of the city at the end of the year.
F C i , t The financial structure of city i in year t is measured by the proportion of deposits of urban and rural residents in deposits of financial institutions. The calculation formula is: F C = D / S .
Table 2. Independent variables selection.
Independent VariablesMeasurement
H S R i , t The opening intensity of HSR in city i in year t is measured by the number of HSR lines, with a range of 0–7.
G D P G R 1 , t GDP growth rate of city i in year t .
I N D i , t Percentage of the gross industrial output value above designated size in the annual GDP of city i in year t .
P A S i , t Highway passenger traffic of city i in year t .
N P G R i , t The natural population growth rate of city i year t .
E D U i , t The proportion of the number of students in ordinary colleges and universities in the total population of city i in year t .
G O V E i , t Percentage of fiscal expenditure in GDP of city i in year t after deducting expenditure on science and education.
F O R E i , t The actual amount of foreign investment used in city i in year t .
Table 3. Basic regression results.
VariablesFinancial BroadeningFinancial Deepening
Financial Scale (FS)Financial Agglomeration (FA)Financial Leverage (FL)Financial Efficiency (FE)Financial Depth (FD)Financial Structure (FC)
Regression
(1)
Regression
(2)
Regression
(3)
Regression
(4)
Regression
(5)
Regression
(6)
Regression
(7)
Regression
(8)
Regression
(9)
Regression
(10)
Regression
(11)
Regression
(12)
HSR−0.2435 ***
(−3.94)
−0.2347 ***
(−3.40)
−0.0418 **
(−2.12)
−0.0693 ***
(−3.12)
−0.0392 ***
(−4.05)
−0.0314 ***
(−3.62)
0.1317 ***
(8.22)
0.1044 ***
(6.36)
1.6672 ***
(6.09)
1.1428 ***
(4.87)
−0.0026
(−0.71)
−0.0109 ***
(−3.27)
GDPGR 0.7084 **
(2.50)
0.7977 ***
(7.84)
−0.2835 **
(−2.20)
0.4237 ***
(4.24)
9.9743 ***
(3.02)
0.3697 ***
(9.60)
IND −0.0298
(−0.40)
0.0444
(1.21)
−0.0136
(−0.84)
−0.0141
(−0.78)
−0.5292
(−1.49)
−0.0013
(−0.44)
PAS 0.1938 ***
(3.32)
0.0851 **
(2.11)
0.0118
(1.15)
−0.0564 **
(−2.52)
−0.9453 *
(−1.86)
0.0028
(0.53)
NPGR −0.0169 ***
(−3.31)
−0.0024 *
(−1.78)
−0.0039 **
(−2.14)
0.0051 ***
(3.19)
0.0023
(0.07)
−0.0004
(−0.97)
EDU −4.0486
(−0.50)
−0.2141
(−0.06)
1.4252
(1.25)
6.1749 ***
(3.34)
120.8834 ***
(2.87)
−0.5766
(−1.49)
GOVE 2.1424 *
(1.87)
0.1219
(1.39)
−0.3915 **
(−2.25)
−0.0617
(−0.21)
−0.3952
(−0.23)
−0.0324
(−0.72)
FORE −0.0399
(−0.70)
−0.0203 **
(−2.21)
−0.0027
(−0.28)
−0.0050
(−0.39)
−0.0466
(−0.45)
−0.0085 ***
(−3.22)
_cons2.0308 ***
(61.97)
0.5741
(0.74)
0.9875 ***
(75.14)
0.2353
(0.65)
0.6091 ***
(96.96)
0.6555 ***
(5.12)
1.6412 ***
(107.19)
1.9748 ***
(8.22)
2.8579 ***
(14.95)
8.1750 *
(1.88)
0.5827 ***
(200.24)
0.5804 ***
(11.38)
City effectYesYesYesYesYesYesYesYesYesYesYesYes
Time effectYesYesYesYesYesYesYesYesYesYesYesYes
Observations269525632689256026982566269425622697256526902561
Cities270270270270270270270270270270270270
Note: robust t-statistics in parentheses (cluster at the city level); * means significance at the level of 10% (p < 0.1), ** means significance at the level of 5% (p < 0.05), *** indicates significance at the level of 1% (p < 0.01).
Table 4. Regression of non-provincial capitals and non-central cities.
VariablesFinancial BroadeningFinancial Deepening
Financial Scale (FS)Financial Agglomeration (FA)Financial Leverage (FL)Financial Efficiency (FE)Financial Depth (FD)Financial Structure (FC)
Regression (13)Regression (14)Regression (15)Regression (16)Regression (17)Regression (18)
HSR−0.1784 *
(−1.92)
−0.0749 ***
(−2.70)
−0.0222 **
(−2.06)
0.0778 ***
(3.60)
0.6578 **
(2.23)
−0.0110 **
(−2.45)
Control
variables
YesYesYesYesYesYes
_cons−0.1228
(−0.14)
0.0168
(0.05)
0.5624 ***
(4.58)
2.3217 ***
(8.85)
11.9622 ***
(2.82)
0.5863 ***
(10.21)
City effectYesYesYesYesYesYes
Time effectYesYesYesYesYesYes
Observations227222702274227122732271
Cities240240240240240240
Note: robust t-statistics in parentheses (cluster at the city level); * means significance at the level of 10% (p < 0.1), ** means significance at the level of 5% (p < 0.05), *** indicates significance at the level of 1% (p < 0.01).
Table 5. Full sample PSM.
VariablesFinancial BroadeningFinancial Deepening
Financial Scale (FS)Financial Agglomeration (FA)Financial Leverage (FL)Financial Efficiency (FE)Financial Depth (FD)Financial Structure (FC)
Regression (19)Regression (20)Regression (21)Regression (22)Regression (23)Regression (24)
HSR−0.1882 **
(−2.05)
−0.0527 ***
(−3.48)
−0.0259 **
(−2.50)
0.0773 ***
(3.49)
0.3238 **
(1.99)
−0.0100 **
(−2.36)
Control
variables
YesYesYesYesYesYes
_cons0.0360
(0.04)
0.3195 **
(1.99)
0.5366 ***
(4.59)
2.1738 ***
(7.91)
6.7893 ***
(3.53)
0.6144 ***
(11.22)
City effectYesYesYesYesYesYes
Time effectYesYesYesYesYesYes
Observations226022572263225922622258
Cities253252254253254252
Note: robust t-statistics in parentheses (cluster at the city level); ** means significance at the level of 5% (p < 0.05), *** indicates significance at the level of 1% (p < 0.01).
Table 6. Non-provincial capitals and non-central cities PSM.
VariablesFinancial BroadeningFinancial Deepening
Financial Scale (FS)Financial Agglomeration (FA)Financial Leverage (FL)Financial Efficiency (FE)Financial Depth (FD)Financial Structure (FC)
Regression (25)Regression (26)Regression (27)Regression (28)Regression (29)Regression (30)
HSR−0.1757 *
(−1.81)
−0.0422 ***
(−3.26)
−0.0259 **
(−2.49)
0.0723 ***
(3.18)
0.2737 *
(1.90)
−0.0096 **
(−2.14)
Control
variables
YesYesYesYesYesYes
_cons−0.2817
(−0.33)
0.2675 *
(1.66)
0.4751 ***
(4.21)
2.3217 ***
(8.47)
7.6263 ***
(4.14)
0.6152 ***
(11.16)
City effectYesYesYesYesYesYes
Time effectYesYesYesYesYesYes
Observations219721952199219621982196
Cities237237237237237237
Note: robust t-statistics in parentheses (cluster at the city level); * means significance at the level of 10% (p < 0.1), ** means significance at the level of 5% (p < 0.05), *** indicates significance at the level of 1% (p < 0.01).
Table 7. Placebo test.
VariablesFull SampleNon-Provincial Capitals and Non-Central Cities
Financial BroadeningFinancial DeepeningFinancial BroadeningFinancial Deepening
Financial
Scale
(FS)
Financial
Agglomeration
(FA)
Financial
Leverage
(FL)
Financial
Efficiency
(FE)
Financial
Depth
(FD)
Financial
Structure
(FC)
Financial
Scale
(FS)
Financial
Agglomeration
(FA)
Financial
Leverage
(FL)
Financial
Efficiency
(FE)
Financial
Depth
(FD)
Financial
Structure
(FC)
Regression
(31)
Regression
(32)
Regression
(33)
Regression
(34)
Regression
(35)
Regression
(36)
Regression
(37)
Regression
(38)
Regression
(39)
Regression
(40)
Regression
(41)
Regression
(42)
HSR0.0059
(0.05)
0.0026
(0.12)
0.0104
(0.66)
−0.0034
(−0.10)
−0.3218
(−1.24)
0.0008
(0.21)
−0.0639
(−0.54)
−0.0114
(−0.56)
0.0041
(0.24)
0.0220
(0.61)
−0.0601
(−0.30)
−0.0006
(−0.15)
Control
variables
YesYesYesYesYesYesYesYesYesYesYesYes
_cons0.7997
(0.91)
0.3639
(0.93)
0.6705 ***
(5.83)
1.8585 ***
(7.70)
9.5839 ***
(2.68)
0.6275 ***
(16.60)
−0.2810
(−0.29)
−0.0210
(−0.05)
0.6783 ***
(5.96)
2.2194 ***
(8.50)
12.0395 ***
(3.44)
0.6425 ***
(15.44)
City effectYesYesYesYesYesYesYesYesYesYesYesYes
Time effectYesYesYesYesYesYesYesYesYesYesYesYes
Observations235423532357235323562354208620842088208520872085
Cities270270270270270270240240240240240240
Note: robust t-statistics in parentheses (cluster at the city level); *** indicates significance at the level of 1% (p < 0.01).
Table 8. DID regression.
VariablesDIDPSM-DID
Financial BroadeningFinancial DeepeningFinancial BroadeningFinancial Deepening
Financial
Scale
(FS)
Financial
Agglomeration
(FA)
Financial
Leverage
(FL)
Financial
Efficiency
(FE)
Financial
Depth
(FD)
Financial
Structure
(FC)
Financial
Scale
(FS)
Financial
Agglomeration
(FA)
Financial
Leverage
(FL)
Financial
Efficiency
(FE)
Financial
Depth
(FD)
Financial
Structure
(FC)
Regression
(43)
Regression
(44)
Regression
(45)
Regression
(46)
Regression
(47)
Regression
(48)
Regression
(49)
Regression
(50)
Regression
(51)
Regression
(52)
Regression
(53)
Regression
(54)
HSR−0.3044 *
(−1.79)
−0.1432 **
(−2.40)
−0.0615 ***
(−3.08)
0.2187 ***
(5.52)
2.5855 ***
(3.53)
−0.0231 ***
(−3.02)
−0.2341 ***
(−3.07)
−0.0619 ***
(−2.71)
−0.0327 ***
(−3.45)
0.1038 ***
(5.73)
0.9504 ***
(4.29)
−0.0099 ***
(−2.76)
Control
variables
YesYesYesYesYesYesYesYesYesYesYesYes
_cons0.7042
(0.91)
0.2780
(0.79)
0.6752 ***
(5.36)
1.9114 ***
(8.12)
7.4438 *
(1.76)
0.5874 ***
(11.64)
0.6571
(0.82)
0.1974
(0.53)
0.6522 ***
(4.97)
2.0033 ***
(8.04)
9.6914 **
(2.23)
0.5707 ***
(10.93)
City effectYesYesYesYesYesYesYesYesYesYesYesYes
Time effectYesYesYesYesYesYesYesYesYesYesYesYes
Observations256325602566256225652561252925262532252825312527
Cities270270270270270270269269269269269269
Note: robust t-statistics in parentheses (cluster at the city level); * means significance at the level of 10% (p < 0.1), ** means significance at the level of 5% (p < 0.05), *** indicates significance at the level of 1% (p < 0.01).
Table 9. DID re-regression.
VariablesDIDPSM-DID
Financial BroadeningFinancial DeepeningFinancial BroadeningFinancial Deepening
Financial
Scale
(FS)
Financial
Agglomeration
(FA)
Financial
Leverage
(FL)
Financial
Efficiency
(FE)
Financial
Depth
(FD)
Financial
Structure
(FC)
Financial
Scale
(FS)
Financial
Agglomeration
(FA)
Financial
Leverage
(FL)
Financial
Efficiency
(FE)
Financial
Depth
(FD)
Financial
Structure
(FC)
Regression
(55)
Regression
(56)
Regression
(57)
Regression
(58)
Regression
(59)
Regression
(60)
Regression
(61)
Regression
(62)
Regression
(63)
Regression
(64)
Regression
(65)
Regression
(66)
HSR−0.9092 ***
(−5.85)
−0.1823 ***
(−2.74)
−0.1061 ***
(−2.78)
0.3739 ***
(8.50)
4.3697 ***
(3.36)
−0.0302 ***
(−3.41)
−0.9307 ***
(−5.28)
−0.1544 **
(−2.30)
−0.0914 **
(−2.32)
0.3526 ***
(7.19)
3.3278 ***
(2.64)
−0.0200 **
(−2.23)
Control
variables
YesYesYesYesYesYesYesYesYesYesYesYes
_cons0.6444
(0.85)
0.2572
(0.71)
0.6651 ***
(5.25)
1.9437 ***
(8.18)
7.8376 *
(1.75)
0.5837 ***
(11.30)
0.8603
(0.99)
0.1835
(0.43)
0.5896 ***
(4.45)
2.0689 ***
(7.68)
9.7348 *
(1.89)
0.5949 ***
(10.95)
City effectYesYesYesYesYesYesYesYesYesYesYesYes
Time effectYesYesYesYesYesYesYesYesYesYesYesYes
Observations256325602566256225652561235123482354235023532349
Cities270270270270270270267267267267267267
Note: robust t-statistics in parentheses (cluster at the city level); * means significance at the level of 10% (p < 0.1), ** means significance at the level of 5% (p < 0.05), *** indicates significance at the level of 1% (p < 0.01).
Table 10. Instrumental variable regression.
VariablesFinancial BroadeningFinancial Deepening
Financial
Scale
(FS)
Financial
Agglomeration
(FA)
Financial
Leverage
(FL)
Financial
Efficiency
(FE)
Financial
Depth
(FD)
Financial
Structure
(FC)
Regression (67)Regression (68)Regression (69)Regression (70)Regression (71)Regression (72)
HSR−0.6145 **
(−2.25)
−0.1226 **
(−2.57)
−0.0643 **
(−2.39)
0.1668 ***
(2.68)
2.0674 **
(2.51)
−0.0132 *
(−1.67)
Control
variables
YesYesYesYesYesYes
City effectYesYesYesYesYesYes
Time effectYesYesYesYesYesYes
Observations163916351640163816391636
K-P LM statistic76.099 ***75.468 ***75.222 ***76.666 ***74.981 ***75.710 ***
Note: robust t-statistics in parentheses (cluster at the city level); * means significance at the level of 10% (p < 0.1), ** means significance at the level of 5% (p < 0.05), *** indicates significance at the level of 1% (p < 0.01).
Table 11. Heterogeneity regression.
VariablesFinancial BroadeningFinancial Deepening
Financial
Scale
(FS)
Financial
Agglomeration
(FA)
Financial
Leverage
(FL)
Financial
Efficiency
(FE)
Financial
Depth
(FD)
Financial
Structure
(FC)
Regression (7)Regression (8)Regression (9)Regression (10)Regression (11)Regression (12)
HSR−0.3286 ***
(−4.12)
−0.1507 ***
(−4.29)
−0.0229 **
(−2.27)
0.1415 ***
(7.11)
2.1798 ***
(4.90)
−0.0162 ***
(−3.84)
HSR×Middle0.2150 **
(2.07)
0.1517 ***
(4.20)
−0.0091
(−0.62)
−0.0895 ***
(−2.89)
−1.9135 ***
(−3.35)
0.0045
(0.83)
HSR×West−0.0328
(−0.32)
0.1238 ***
(3.49)
−0.0198
(−1.01)
−0.0158
(−0.47)
−2.0581 ***
(−3.55)
0.0104 *
(1.87)
HSR×Northeast0.5671 *
(1.80)
0.1940 ***
(4.54)
−0.0337
(−1.26)
−0.1051
(−1.00)
−0.8276 *
(−1.90)
0.0352 ***
(2.83)
Control
variables
YesYesYesYesYesYes
_cons0.6646
(0.88)
0.3917
(1.21)
0.6470 ***
(5.00)
1.8995 ***
(7.85)
5.7261
(1.42)
0.5811 ***
(11.44)
City effectYesYesYesYesYesYes
Time effectYesYesYesYesYesYes
Observations256325602566256225652561
Cities270270270270270270
Note: robust t-statistics in parentheses (cluster at the city level); * means significance at the level of 10% (p < 0.1), ** means significance at the level of 5% (p < 0.05), *** indicates significance at the level of 1% (p < 0.01).
Table 12. Moderation effect regression.
VariablesFinancial BroadeningFinancial Deepening
Financial
Scale
(FS)
Financial
Agglomeration
(FA)
Financial
Leverage
(FL)
Financial
Efficiency
(FE)
Financial
Depth
(FD)
Financial
Structure
(FC)
Regression (7)Regression (8)Regression (9)Regression (10)Regression (11)Regression (12)
HSR0.2226 *
(1.83)
0.0673 *
(1.68)
−0.0191
(−1.50)
−0.0095
(−0.35)
−0.8363 **
(−2.56)
−0.0048
(−1.11)
HSR×PGDP−0.0049 ***
(−5.21)
−0.0015 **
(−2.51)
−0.0001
(−1.31)
0.0012 ***
(4.55)
0.0216 ***
(4.64)
−0.0001 **
(−2.29)
Control
variables
YesYesYesYesYesYes
_cons−0.1228
(−0.14)
0.0168
(0.05)
0.5624 ***
(4.58)
2.3217 ***
(8.85)
11.9622 ***
(2.82)
0.5863 ***
(10.21)
City effectYesYesYesYesYesYes
Time effectYesYesYesYesYesYes
Observations255825532558255725582553
Cities270270270270270270
Note: robust t-statistics in parentheses (cluster at the city level); * means significance at the level of 10% (p < 0.1), ** means significance at the level of 5% (p < 0.05), *** indicates significance at the level of 1% (p < 0.01).
Table 13. Mediating effect regression.
VariablesTotal
Population
(TP)
Financial
Scale
(FS)
Financial
Agglomeration
(FA)
Financial
Leverage
(FL)
Financial
Efficiency
(FE)
Financial
Depth
(FD)
Financial
Structure
(FC)
Regression
(25)
Regression
(26)
Regression
(27)
Regression
(28)
Regression
(29)
Regression
(30)
Regression
(31)
HSR6.8648 ***
(3.78)
−0.2189 ***
(−3.23)
−0.0582 ***
(−3.23)
−0.0288 ***
(−3.29)
0.0960 ***
(5.84)
1.0031 ***
(5.15)
−0.0093 ***
(−2.94)
TP −0.0030 *
(−1.90)
−0.0021 **
(−2.32)
−0.0005 **
(−2.08)
0.0016 ***
(3.53)
0.0252 *
(1.77)
−0.0003 ***
(−2.70)
Control
variables
YesYesYesYesYesYesYes
_cons442.8642 ***
(24.11)
1.8684 *
(1.73)
1.1536 ***
(3.95)
0.8591 ***
(5.91)
1.2884 ***
(3.99)
−2.9095
(−0.56)
0.7184 ***
(10.74)
City effectYesYesYesYesYesYesYes
Time effectYesYesYesYesYesYesYes
Note: robust t-statistics in parentheses (cluster at the city level); * means significance at the level of 10% (p < 0.1), ** means significance at the level of 5% (p < 0.05), *** indicates significance at the level of 1% (p < 0.01).
Disclaimer/Publisher’s Note: The statements, opinions and data contained in all publications are solely those of the individual author(s) and contributor(s) and not of MDPI and/or the editor(s). MDPI and/or the editor(s) disclaim responsibility for any injury to people or property resulting from any ideas, methods, instructions or products referred to in the content.

