Article

Replacing Mineral Fertilizer with Nitrified Human Urine in Hydroponic Lettuce (Lactuca sativa L.) Production

1
Division Biosystems Engineering, Albrecht Daniel Thaer-Institute of Agricultural and Horticultural Sciences, Humboldt-Universität zu Berlin, Albrecht-Thaer-Weg 3, 14195 Berlin, Germany
2
Division Urban Plant Ecophysiology, Albrecht Daniel Thaer-Institute of Agricultural and Horticultural Sciences, Humboldt-Universität zu Berlin, Lentzeallee 55/57, 14195 Berlin, Germany
*
Author to whom correspondence should be addressed.
Sustainability 2023, 15(13), 10684; https://doi.org/10.3390/su151310684
Submission received: 17 May 2023 / Revised: 27 June 2023 / Accepted: 3 July 2023 / Published: 6 July 2023
(This article belongs to the Section Sustainable Agriculture)

Abstract

:
Source-separated, nitrified, and decontaminated human urine constitutes a promising plant fertilizer that contains a large share of the nitrogen and phosphorus in household wastewater, and other plant nutrients. However, human urine contains high levels of sodium and chloride that can affect salt-sensitive greenhouse crops. Replacing mineral fertilizer with nitrified urine fertilizer could reduce the environmental impact of lettuce production in hydroponic systems, if marketable yield, appearance, and produce quality are not affected. In the present study, a treatment combination of a nitrified urine fertilizer and mineral fertilizers was used to grow lettuce through the nutrient film technique. This was compared to a conventionally fertilized control treatment. No significant differences were observed regarding yield, phenotype, and contents of nitrate, heavy metals, phenolic acids, and chlorophyll in leaf tissue. Calcium content was significantly reduced and sodium was elevated in nitrified urine treatment. For the elements nitrogen, phosphorous, and potassium, a saving of 48%, 13%, and 15% was calculated, respectively. The calculated carbon footprint from the total fertilizer production was reduced by 34.25%, caused by the nitrified urine treatment. Based on these results, a nutrient solution composed of nitrified urine fertilizer combined with mineral fertilizer may be a promising alternative for growers to produce lettuce with a reduced environmental impact without loss of plant quantity and quality.

1. Introduction

Recycling nutrients in agricultural production becomes ever more crucial. Source-separating urine and using it as a fertilizer could reduce energy consumption for fertilizer production, emissions of greenhouse gases, and the depletion of phosphate rock [1]. The production of synthetic nitrogen fertilizers with the Haber-Bosch process uses large amounts of fossil energy, mainly natural gas, releasing the equivalent of approximately 465 million tons of CO2 into the atmosphere each year [2]. European countries in particular, which are dependent on the import of phosphate fertilizers, could benefit from self-subsistence regarding this compound [3,4]. In addition, fertilizer from rock phosphate contains heavy metals [5] that can reduce the nutritional quality of produce. Secondly, human urine is the main contributor of nutrients to domestic wastewater. It accounts for 80% of the nitrogen, 50% of the phosphorus, and 60% of the potassium, but only 1% of the total volume [6,7] and contains only low levels of heavy metals [8]. Fresh urine measured in one study contained between 1190–4140 mg N/L, 854–1470 mg K/L, and 106–242 mg P/L [9]. Removing these nutrients from wastewater by aeration and precipitation to prevent the eutrophication of water bodies is also energy-consuming [10]. A number of physicochemical and biological methods for post-processing urine and using it as a fertilizer have been developed in recent years and reviewed by Simha and Ganesapillai [11]. Biological nitrification is one promising method that allows for the near complete recovery of nitrogen [12,13]. This treatment stabilizes the volatile ammonium/ammonia (NH4+/NH3) fraction in stored urine and preserves other potential plant nutrients such as potassium, phosphorus, and others. Additional treatment steps could include distillation to inactivate pathogens and reduce volume [9] or only pasteurization to achieve the former, and/or activated carbon filtration to remove pharmaceuticals and hormones [14].
Plant experiments have been conducted in soil with unprocessed human urine [15,16,17], with nitrified synthetic urine [18], and in hydroponic systems with nitrified synthetic urine [19], as well as with nitrified human urine to grow lettuce [20,21], tomato plants [22], and cucumber plants [23]. Human urine, also after nitrification, contains concentrations of sodium and chloride higher than those usually found in nutrient solutions (e.g., 0.3 mol Na+ and 0.4 mol Cl per mol dissolved nitrogen) [9]. This can pose a problem for salt-sensitive vegetable crops because almost all cultivated vegetable crops are sensitive to high salt concentrations in the nutrient solution in varying degrees [24]. It can also be problematic in recirculating hydroponic systems due to salt build-up [25].
Salt stress manifests in plants due to osmotic stress or ion toxicity [26]. With lettuce, which is characterized as a moderately salt-sensitive crop regarding its tolerance for the electrical conductivity (EC) of the nutrient solution [27], osmotic stress has a known influence on water content and thus on marketable yield. Regarding ion toxicity, the results of Tas et al. [28] show that NaCl salinity is less well-tolerated by romaine lettuce than other forms of salinity.
Considering that nutrient solutions are often composed of fertilizer salts that contain nitrate as an anion, the high nitrogen-to-calcium and nitrogen-to-potassium ratios and a high level of ammonium nitrogen in the nitrified urine fertilizer can further complicate the replacement of respective fertilizers.
A previous study with the nitrified urine fertilizer Aurin (Vuna GmbH, Dübendorf, Switzerland) showed that a threshold concentration of 38% of nitrogen supplied by nitrified urine in the initial mix did not cause yield losses and salt stress symptoms to Lactuca sativa L. cv. 79–54 RZ [21]. The study tested four different Aurin concentrations in a greenhouse during the winter season and lettuce plants were grown up to 60% of the expected head size reached (stage 46 on BBCH-scale). Butterhead lettuce (Lactuca sativa subsp. capitata L.) was examined because of its economic relevance. The cultivar Lactuca sativa L. cv. 79–154 RZ was chosen due to its suitability for hydroponic systems.
The objective of the present study was to apply the developed nitrified urine fertilizing strategy to spring greenhouse lettuce in a nutrient film technique system and investigate the treatment’s impact on mineral fertilizer savings and carbon footprint (CF). The new fertilizer strategy was compared to a conventionally fertilized control treatment by evaluating plant development and contents of mineral elements, heavy metals, and secondary plant compounds. Mineral fertilizer savings were calculated to demonstrate that the application of mineral fertilizer can be reduced. To assess environmental impact, CFs of the production of the employed mineral and nitrified urine fertilizers and the (fictional) wastewater treatment of the applied urine were compared.

2. Materials and Methods

2.1. Experimental Set-Up, Plant Material, and Growing Conditions

The experimental set-up in a Venlo-type greenhouse consisted of six nutrient film technique (NFT) systems covered with opaque foil and their respective nutrient solution tanks (200 L). Nutrient solution was circulated via pumps (Universal 600, Eheim, Deizisau, Germany) at a flow rate of 2.6 L/min. Lettuce seeds (Lactuca sativa var. capitata cv. 79–154 RZ, Rijk Zwaan, De Lier, The Netherlands) were sown on 3 April 2018, in rock wool cubes (Cultilene Plug, 25 × 25 × 40 mm SBS 25/150, Saint-Gobain Cultilene, Rijen, The Netherlands) and pre-soaked with tap water in a growing chamber (24 °C and 63% relative humidity). After the unfolding of the first true leaf, seedlings were watered with a nutrient solution with an EC of 1.5 dS/m and pH 5.6. After 15 days, plants with 3 to 5 true unfolded leaves were transplanted into pre-weighed rock wool cubes (Cultilene HR, 100 × 100 mm 28/35) in the experimental setup (24 plants per NFT system). Mean air temperature in the greenhouse was 23.5 °C during the day and 15.9 °C at night and the mean relative humidity was 52% for the total duration of the experiment. Ventilation was opened above 19 °C and heating set points were 12 °C and 9 °C during the day and night, respectively.

2.2. Nutrient Solution Treatments

A nutrient solution recipe for lettuce according to Göhler and Molitor [29] served as the control treatment with three tanks as replications (n = 3) and 24 lettuce plants per replication. A nutrient solution EC of 2.0 dS/m is usually used by commercial producers of hydroponic lettuce, to avoid excess salinity [30] and calcium deficiency in leaves which causes tip burn and reduces the market quality of the produce [31]. Concentrations in the recipe were thus diluted to ensure an EC of 2.0 dS/m in the control treatment when using local tap water and relative calcium concentration was increased to prevent tip burn [31]. The nutrient concentrations in the tap water used for the experiment are stated in the Supplementary Materials (Table S1). Target concentrations for the nutrient solution in both treatments were 168.1 mg/L N, 41.3 mg/L P, 286.7 mg/L K, 147.0 mg/L Ca, 24.3 mg/L Mg, 1.5 mg/L Fe, 360.3 µg/L B, 174.4 µg/L Zn, 31.8 µg/L Cu, 183.1 µg/L Mn, and 32.0 µg/L Mo. The tested nitrified urine fertilizer, Aurin, is nitrified up to the equilibrium ratio of nitrate nitrogen to ammonium nitrogen (1:1), activated carbon filtrated, and then distilled by Vuna GmbH (Dübendorf, Switzerland) [9,32] (nutrient composition: Table 1). There is inherent variability in the product and the values shown apply to the batch used in the experiment.
In the nitrified urine treatment, ‘Aurin + mf’ (n = 3), nitrate salts, and other mineral fertilizers (mf) were substituted with varying concentrations of the nitrified urine fertilizer to obtain the same total N, P, K, Ca, Mg, Fe, and B concentrations as in the control treatment. In the initial mix, 38% of total nitrogen was supplied by nitrified urine, according to a previous study [21]. Due to the high concentration of ammonium in Aurin (50% of total nitrogen according to the manufacturer, 45% according to our own analysis after storage, sampling, and dilution of samples), the control treatment was adjusted to contain a similar ammonium concentration and 24% of total nitrogen was supplied in the form of ammonium in all treatments. Nutrient concentrations in each tank were analyzed at the start of the experiment and three weeks later, and then weekly afterward. Three days after taking the nutrient solution samples, nutrients were added to each tank in the form of mineral fertilizer or mineral fertilizer and Aurin, respectively. Values of pH and EC were measured daily with a hand-held device (HI9811-5, Hanna Instruments, Vöhringen, Germany). The pH was adjusted with phosphoric acid and potassium hydroxide to a value between 6.0 and 6.8 with no greater difference than 0.3 between the treatments. Total fertilizer used during the experiment is specified in Table 2. The chloride (Cl) concentration in the nutrient solutions was determined on three occasions with a hand-held photometer (Pocket Colorimeter II, Hach Lange, Düsseldorf/Berlin, Germany). The analysis was repeated three times and a mean value was calculated.

2.3. Nutrient Solution Analyses

Nutrient solution analyses were performed regularly to ensure the accuracy of treatments. This was at the start of the experiment and three weeks later, then weekly afterwards. Two samples of each nutrient solution tank were taken and filtered with filter paper (595 ½, Whatman, GE Healthcare, Buckinghamshire, UK). Nutrient concentrations (B, Ca, Cu, Fe; K, Mg, Mn, Mo, Na, S, P, Zn) were analyzed via inductively coupled plasma-optical emission spectrometry (ICP-OES) using an ICP Emission Spectrometer (iCAP 6300 Duo MFC, Thermo Fisher Scientific, Waltham, MA, USA). The method was performed according to the application note of Thermo Fisher Scientific with modifications described by Dannehl et al. [33] with the following adaptions: nebulizer gas flow was 0.5 L/min and calibration curves were generated with the reference solutions listed in the Supplementary Materials (see Table S3). Dissolved nitrogen concentrations (NO3-N and NH4-N) in the water samples were analyzed using continuous flow analysis (CFA) (San++, SKALAR, Breda, Netherlands) according to VDLUFA [34] and modified by Suhl et al. [35] with the following adaptions: the used reference solutions were 2.336 mg/L NH4+ (Ammonium standard solution, Merck, Darmstadt, Germany) and 2.26 mg/L NO3 (Nitrate standard solution, Merck, Darmstadt, Germany) (see Table S4 in the Supplementary Materials for standard curve).

2.4. Calculation of Fertilizer Savings and Carbon Footprints

Fertilizer savings were calculated for each fertilizer salt, comparing the mean amounts used in both treatments given in Table 2. This was done for each nutrient contained in the N, P, and K fertilizers and for each fertilizer salt. Assuming a production of 830,000 heads per hectare [36] in [37], savings were expressed as kg ha−1. From these results, the saving potential of CO2 equivalent [kg CO2-eq ha−1] was calculated according to the results of Brentrup et al. [38] for CaNO3 (0.64 kg CO2-eq kg CaNO3) and KAS (0.95 kg CO2-eq kg KAS), and Umweltbundesamt [39] for KH2PO4 (1.26 kg CO2-eq kg KH2PO4) and KNO3 (1.2 kg CO2-eq kg KNO3).
The CF of the production of the nitrified urine fertilizer Aurin was calculated from the amount of kg N from Aurin used in the experiment according to Faust et al. [40]. An operational CF of 9.2 kg CO2-eq kg N−1 was assumed to apply after implementation of the proposed NO2 mitigation strategies. For the control treatment, a fictional CF (9.78 kg CO2-eq kg N) of the wastewater treatment of the urine applied in the Aurin + mf treatment was calculated according to Maurer et al. [10]. For calculations of the Aurin production CF as well as the wastewater treatment CF, a European electricity mix of 230 g CO2-eq kWh−1 was used for calculations [40], as we assume this to be comparable to the CFs for mineral fertilizer production.

2.5. Yield and Product Quality Parameters

Immediately before harvest, plant diameters of every plant were measured at the broadest expansion of the head, and leaves were counted. Plants were harvested after 35 days, on 23 May 2018. Fresh weights were taken of all lettuce heads after removing non-marketable leaves that showed initial signs of rot or senescence. The remaining rootstocks in rock wool cubes were dried at 105 °C until constant weight and then weighed. After measuring the leaf area of eight lettuce heads per NFT system, these samples were dried at 105 °C until constant weight to determine the head dry weight.
For mineral content, nitrate, and secondary compound analysis, three pooled samples per NFT system were taken and frozen in liquid nitrogen, using one-quarter of four lettuce heads. Samples were freeze-dried and ground to a fine powder (Retsch, Haan, Germany) and used in all analyses described as follows: For Ca, Cd, Cu, Fe, K, Mg, Na, Ni, P, Pb, S, and Zn analysis, 0.25 g of each sample was digested in a microwave (MARS Xpress MD-8216, CEM, Matthews, NC, USA) according to DIN EN ISO 19747:2009 [41] as described by Dannehl et al. [33]. The analysis of the elements in the digestion solution was conducted via ICP-OES as described above, except that 10 mL HNO3 (65%) and 6 mL H2O2 (30%) were added to 100 mL of all reference solutions. Reference solution concentrations and measurement specifics are given in the Supplementary Materials (see Table S5). Carbon and nitrogen content in lettuce was analyzed using an elemental analyzer (vario MAX cube, Elementar Analysensysteme, Langenselbold, Germany) according to DIN EN 15936:2012 [42] and DIN EN 16168:2012 [43]. The analysis was performed twice. Carbon and nitrogen contents were calculated using glutamic acid as the reference standard and expressed in percent. Nitrate content of the samples was determined with an RQFlex 20 reflectometer and Reflectoquant test strips for nitrate (Merck, Darmstadt, Germany).
Chlorophylls and carotenoids were extracted according to Taylor et al. [44] with the following modifications: 0.5 mL of MeOH THF solution (1:1 v:v, three times) was added to 10 mg of freeze-dried and ground samples, shaken at 24 °C and 500 rpm for 5 min and centrifuged at 20 °C and 4.500 rpm for 5 min. The pellet was re-extracted twice. The supernatant was transferred to a glass vial and dried under a nitrogen stream. Samples were dissolved with 0.1 mL dichloromethane and 0.3 mL isopropanol and thoroughly mixed, filtered (SpinX filters, 0.22 µm), and transferred to HPLC vials. Extracts were analyzed on a Thermo Scientific HPLC system consisting of an UltiMate 3000 autosampler, pump, photodiode array detector, and a thermostated column compartment (Thermo Fisher Scientific, Waltham, MA, USA). Ultra-high performance liquid chromatography analysis was performed according to Baldermann et al. (2013) with slight modifications: eluent was used without ammonium acetate, gradient mode: 0–10 min 0% B, 10–40 min 0–100% B, 40–42 min 100% B, 42–45 min 100–0% B, 45–55 min 0% B. Samples were separated on a YMC-C30 column (2.1 × 100 mm, 3 μm) at 25 °C oven temperature and a flow of 0.2 mL/min. Carotenoids were detected at 456 nm and identified by retention times and specific UV spectra using reference compounds (trans-β-carotene, cis-β-carotene, lutein, neoxanthin, chlorophyll a, and chlorophyll b). Amounts of compounds (in micrograms per gram of dry weight) were calculated based on the peak area relative to the related external standard curve, including their specific response factors.
Phenolic acids and flavonoids were analyzed from 20 mg of freeze-dried and ground samples based on an HPLC method described by Mewis et al. [45] and modified by Förster et al. [46]. In summary, the method consists of extraction with 70% methanol in an ultrasonic bath. Samples were analyzed by HPLC using a C16 column (AcclaimPA, 3 μm, Dionex, Sunnyvale, CA, USA). Compounds were quantified at 290 nm against the internal standard, 4-methoxycinnamic acid (1 mM, Sigma Aldrich, St. Louis, MO, USA). Commercially available standards of single compounds with a similar chemical structure to the identified ingredients were used as references (caffeic acid, 4-caffeoylquinic acid, caffeoyl malic acid, quercetin-7-O-glucoside). Relative response factors were used to correct for absorbance difference. Qualitative identification was carried out by retention time, specific UV spectra, and mass spectrometry.

2.6. Statistical Analysis

Data were analyzed with SAS 9.4 software for Windows (SAS Institute Inc., Cary, NC, USA). As the study focuses on nutrients, one hydroponic system with 24 lettuce plants was counted as statistical replication. The statistical model for analysis of variances comprised nutrient solution as a fixed treatment factor with three replications (n = 3) and the random variation between tanks. For the treatments, homogeneous variances were assumed (as this is not testable for n = 3). According to the Central Limit Theorem, the normal distribution of the tank mean values can be assumed irrespective of the initial distribution of the individual values. For each trait, least squares means and standard errors of the means were estimated, and comparisons between control and Aurin + mf treatments were performed using the Student’s t-test (p ≤ 0.05).

3. Results

3.1. Nutrient Solution Salinity and Fertilizer Savings

Sodium levels in the nutrient solution accumulated to 101 mg/L Na+ in the control treatment and 150 mg/L Na+ in the Aurin + mf treatment by the end of the experiment. Similarly, chloride levels reached 113 mg/L and 210 mg/L, respectively. Electrical conductivity at harvest was 2.4 dS/m in the control treatment and 2.6 dS/m for nitrified urine.
Fertilizer applications resulted in a calculated total nitrogen application of 52.96 g to the control treatment and 52.85 g to the Aurin + mf treatment. Based on nutrients contained in nitrified urine (Aurin) fertilizer, it was calculated that mineral fertilizer contribution was reduced (by mass) relative to the control by 48% of N, 15% of K, and 13% of P in the Aurin + mf treatment (see Table S6 in Supplementary Materials). The nutrient use efficiencies (NUEs) for nitrogen, potassium, and phosphorus were calculated for each tank to verify the actual impact of the aforementioned fertilizer savings (Table 3). The NUE of the Aurin + mf treatment for nitrogen was 258 (±9) compared to 268 (±31) for the control, 252.3 (±26.6) compared to 236 (±16.2) for potassium, and 759.5 (±55.4) compared to 784.9 (±136.4) for phosphorus.

3.2. Carbon Footprint of Fertilizer Production and Wastewater Treatment

The calculated CFs for the difference in amounts of mineral fertilizers used in the two treatments are shown in Table 4. The CF for the Aurin + mf treatment was 8003.1 kg CO2-eq ha−1 compared to 12,763.85 kg CO2-eq ha−1 for the control treatment, with a resulting difference of 4371 kg CO2-eq ha−1 or 34.25%.

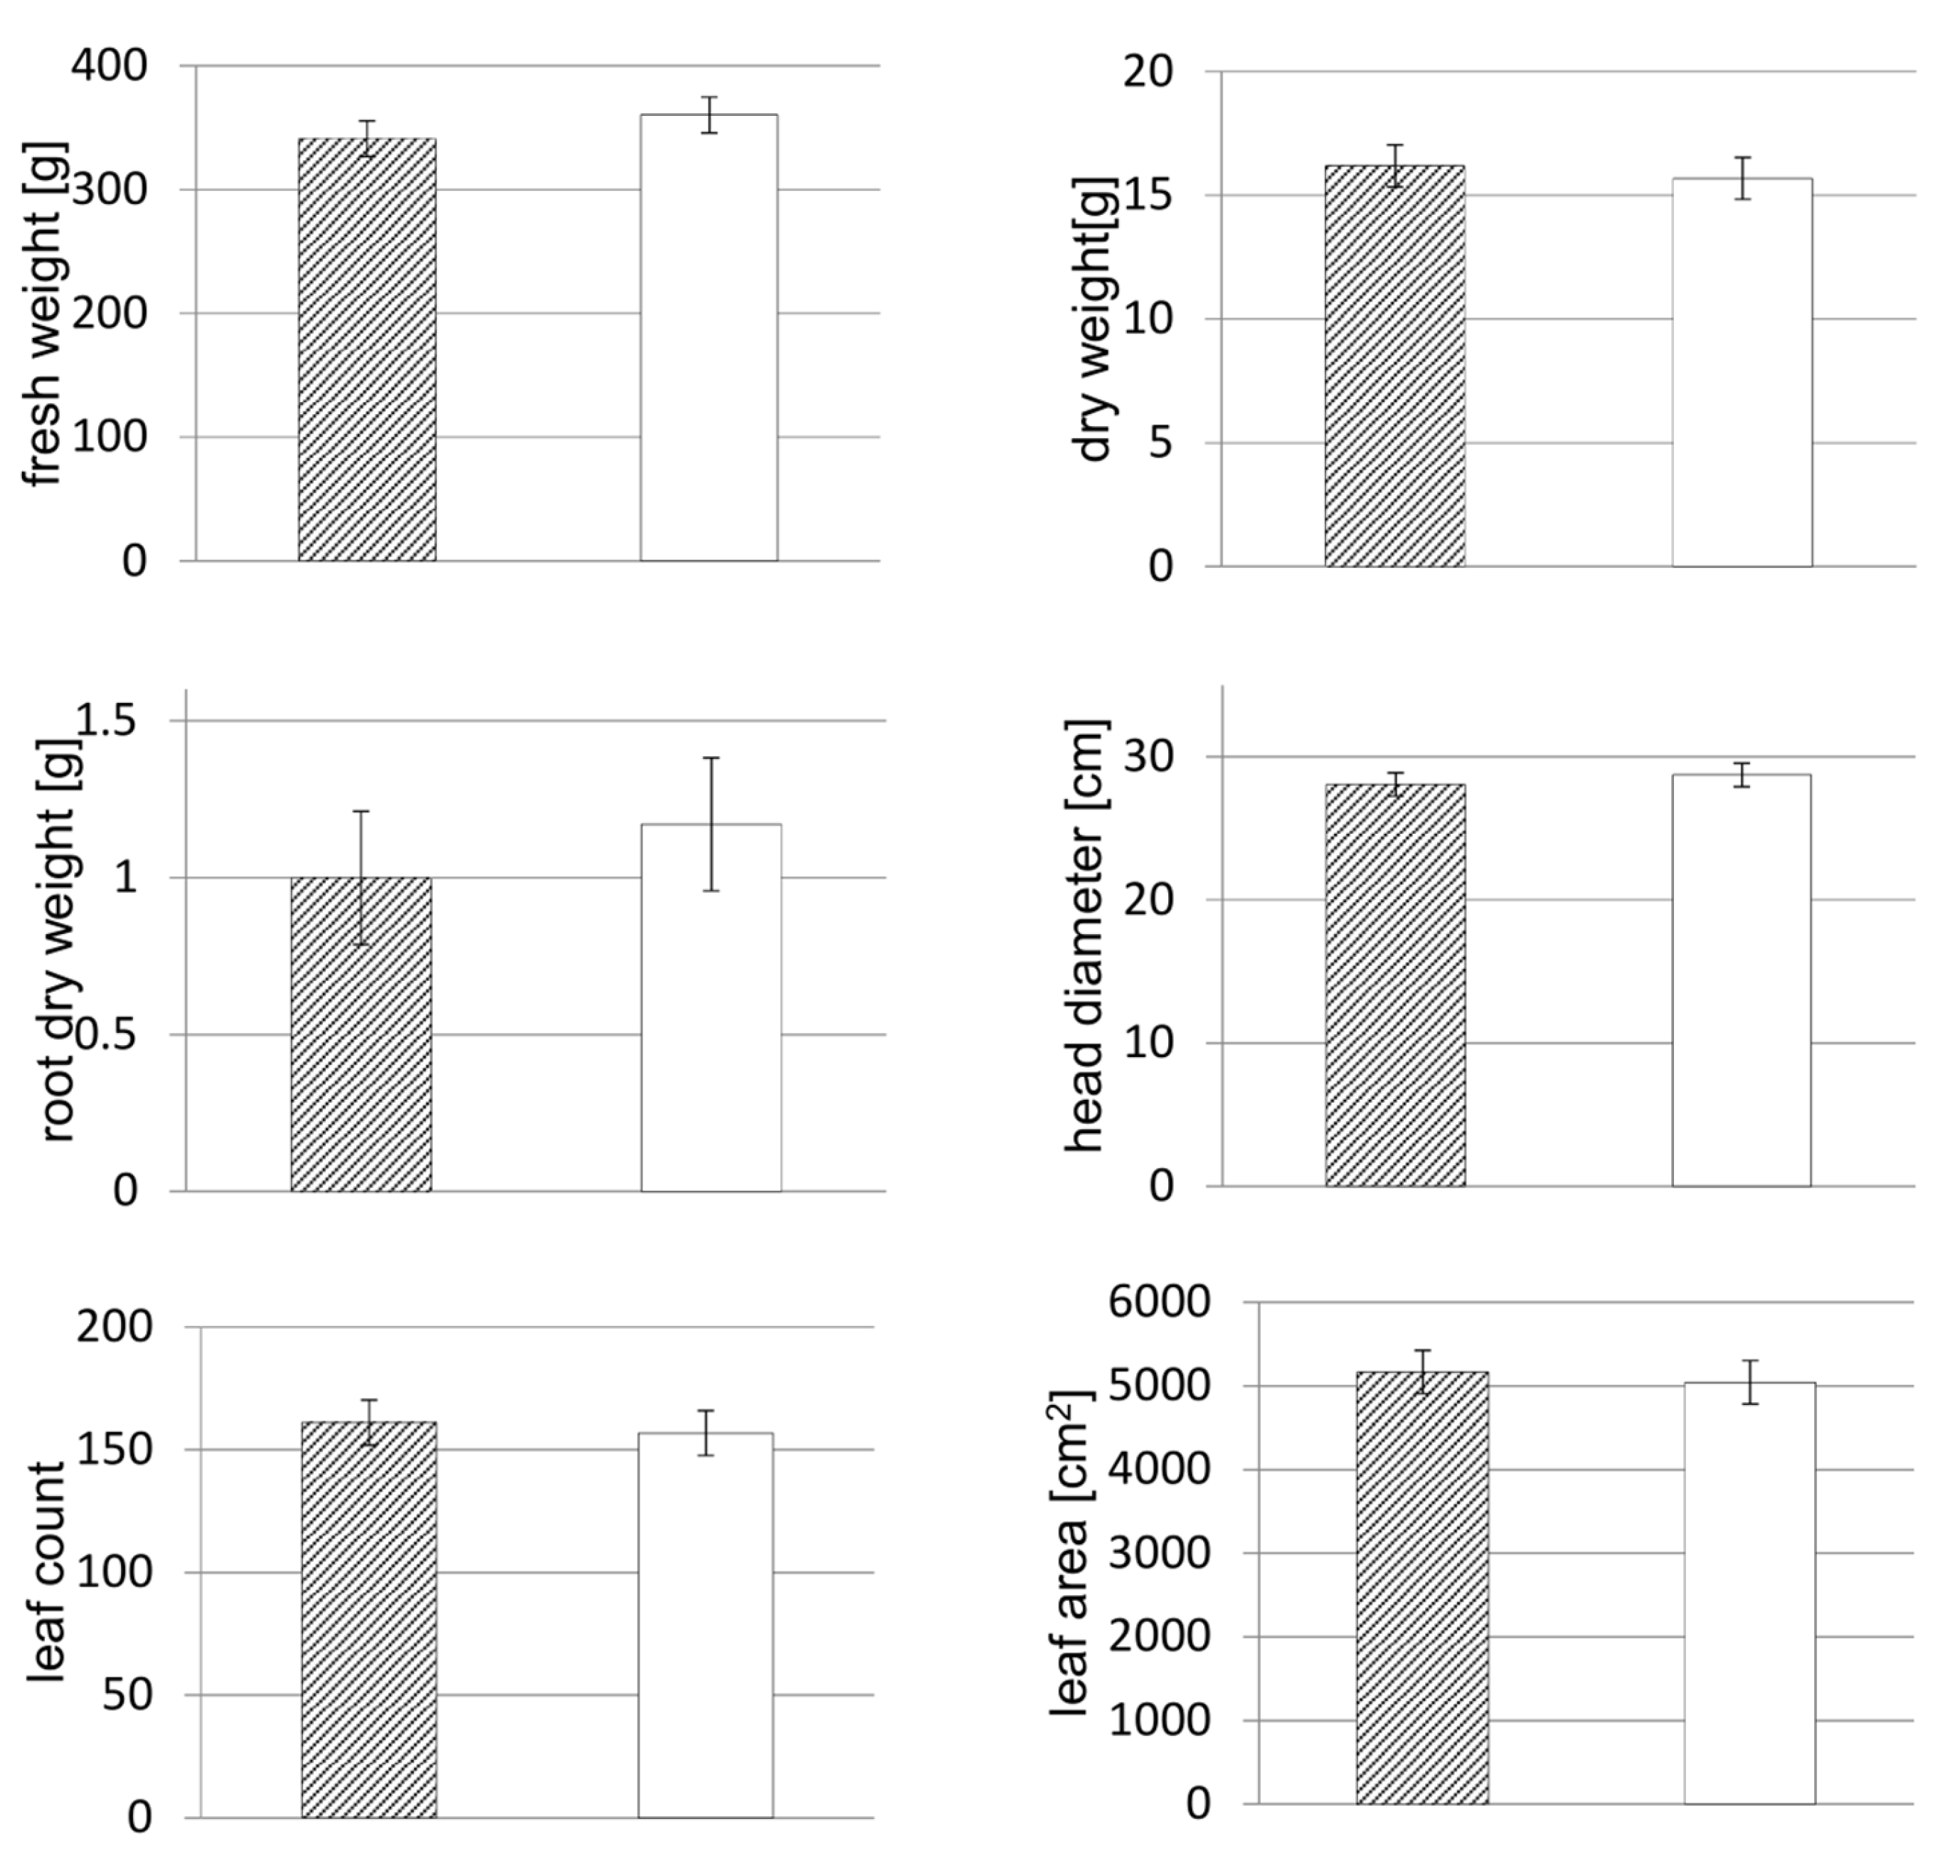
3.3. Yield and Morphological Parameters

No significant differences were found in head fresh and dry weight, head diameter, root dry weight, number of leaves, and leaf area (Figure 1). The average fresh weight of heads was 341 g (±16 g) per head for the Aurin + mf treatment and 360 g (±8 g) per head for the control. The dry weight of heads was 16.19 g (±0.39 g) for the Aurin + mf treatment and 15.68 g (±0.68 g) for the control treatment (see Table S7 in Supplementary Materials for other parameters).

3.4. Product Quality

The sodium content in the leaf tissue of lettuce plants grown in the Aurin + mf treatment was significantly increased by 33% compared to the control; calcium content was significantly decreased by 17% compared to the control, but no tip burn occurred. All other examined minerals showed no significant differences (Figure 2).
Analytic results found cadmium levels to be below the detection limit of 0.1 mg Cd/kg dry weight, and other heavy metals, such as lead, copper, nickel, and zinc were not found to be significantly different between the treatments (see Table S8 in Supplementary Materials). Nitrate accumulation in fresh leaf tissue observed in both treatments did not differ significantly from each other (see Figure S1 in Supplementary Materials). No significant differences were found for carotenoids, chlorophylls, phenolic acids, and flavonoids, whether the lettuce plants were treated with Aurin + mf or the control nutrient solution (Table 5 and Table 6).

4. Discussion

4.1. Yield, Salinity of the Nutrient Solution, and Cations in Plant Tissue

Based on our results, lettuce (Lactuca sativa var. capitata cv. 79–154 RZ) can be grown in a nutrient solution composed of nitrified urine fertilizer and mineral fertilizer with an average electrical conductivity of 2.3 dS/m without loss of yield quantity and secondary plant compounds if the rise in overall salinity is caused by NaCl. Mineral content in leaf tissue such as sodium and calcium, however, were significantly different. These plant responses are in accordance with findings of an earlier experiment [21], and with NaCl and overall salinity thresholds [30,47,48]. However, for the parameter of fresh weight, Andriolo et al. [30] found a threshold of 2.0 dS/m, which was contradicted by our results. The Aurin + mf treatment, with an electrical conductivity at harvest of 2.6 dS/m, did not surpass the overall salinity threshold modelled for the dry weight of lettuce plants by Andriolo et al. [30] and equals the lowest of several thresholds modeled by Sonneveld et al. [48]. However, in our experiment, the target electrical conductivity of the control treatment was already close to the mentioned salinity thresholds (2.0 dS/m target and 2.4 dS/m actual average value).
The accumulated levels of sodium and chloride in the nutrient solution are far below the tolerable concentration of 40 mM NaCl for lettuce described by Tzortzakis et al. [49]. Still, sodium ions in the nutrient solution interfere with potassium and calcium uptake, and calcium content is also influenced by the osmotic potential of the nutrient solution [50]. This explains why detected calcium levels in the leaf tissue of the Aurin + mf treatment were lower than those caused by the control treatment, just above the sufficiency minimum of 11 mg/kg dry weight [51]. The calcium sufficiency is supported by the absence of tip burn on lettuce plants. Surprisingly, Table 2 shows that more CaNO3 fertilizer had to be applied over the course of the experiment to sustain equal concentrations of Ca in the nutrient solution. This might be due to the precipitation of Ca salts in the Aurin + mf treatment. In a study where the nitrified urine fertilizer was manually applied, calcium levels were higher than in the control treatment [20]. High levels of ammonium usually also interfere with calcium and potassium uptake [50], but this was avoided in the given experiment by adjusting ammonium levels in the control nutrient solution. Our results suggest that when using nitrified urine in lettuce production, it is not sodium toxicity but the overall salinity of the nutrient solution that is a limiting factor. In future experiments aiming to increase the nutrient recycling ratio from nitrified urine fertilizers with low calcium content, such as Aurin, a reduced overall salinity of the nutrient solution should be evaluated in control treatments to avoid calcium deficiency and ensure product quality.

4.2. Fertilizer Savings and Carbon Footprint

In this experiment, 48% of N, 15% of K, and 13% of P were contributed by nitrified urine fertilizer Aurin instead of mineral fertilizer. The corresponding nutrient use efficiencies found for nitrogen, potassium and phosphorus were not equal, but comparable and thus support the calculated nutrient savings. Halbert-Howard et al. [22] found these ratios to be 80%, 17%, and 32%, respectively, for tomato. An even higher rate was achieved with a nitrified urine fertilizer with a higher share of nitrate nitrogen and added calcium [12]. A question that remains to be answered in further experiments is whether yields comparable to the control treatment could also be attained by supplying a higher share of nitrogen from nitrified urine while reducing other ion concentrations in favor of a low overall salinity.
With the calculated CFs for both treatments, a total saving of 34.25% (12,763.85 CO2-eq ha−1 vs. 8391.94 CO2-eq ha−1) of greenhouse gas emissions was possible due to the Aurin + mf treatment. It has to be considered that this applies to a distilled nitrified urine fertilizer with reduced volume for transport. On-site production of the fertilizer, in an urban farming context with pasteurization instead of distillation and with the possible use of green energy, would reduce the carbon footprint much more [40].

4.3. Product Quality

Cadmium (Cd) and lead (Pb) contents in food products produced in Europe are subject to Regulation (EC) No 1881/2006 [52]. Analytic results found cadmium levels to be below the detection limit and lead content far below the maximum level of 0.3 mg Pb/kg fresh weight. As described, no significant differences in heavy metal content were detected between treatments. Consequently, the hypothesis that the replacement of mineral fertilizers with nitrified urine could reduce heavy metal content in leaf tissue must be rejected for the given experimental conditions.
The detected nitrate accumulation in fresh leaf tissue was below the European maximum level for summer greenhouse lettuce of 4000 mg/kg fresh weight [52]. Ammonium levels in both treatments were elevated. The same effect was found by Gunes et al. [53], who showed reduced nitrate accumulation in lettuce when nitrogen in the nutrient solution was partly from ammonium-rich nitrogen sources such as urea and proteinate.
Chlorophyll, carotenoid, phenolic acid, and flavonoid content can be influenced among other factors by the cultivar [54,55]. There is no reference data for the selected lettuce cultivar. However, the contents of the detected compounds in the present study were comparable to the studies referred to above. Previous studies found that romaine lettuce plants exposed to 5 mM NaCl respond with an increase in carotenoid contents and, depending on the salt sensitivity of the plants, with a decrease in phenolic acids [56]. The same effect was observed for extremely high NaCl concentrations (100 mM) [57]. However, no influences of the higher sodium concentrations caused by Aurin + mf treatment (4.37 mM Na+) on these secondary metabolites were found. It might be possible that the differences in sodium concentrations were not high enough to trigger such metabolic responses in the specific cultivar.

5. Conclusions

The proposed fertigation strategy for lettuce (Lactuca sativa var. capitata) with the nitrified urine fertilizer Aurin resulted in the reduced consumption of mineral fertilizers relative to the control (48% of N, 15% of K, and 13% of P) with comparable nutrient use efficiencies between treatments, and thus in a saving of greenhouse gas emissions (34.25%). In addition to this environmentally friendly production, equal yields were achieved with equal accumulations of valuable secondary plant compounds. Calcium levels in leaf tissue were reduced to almost sufficiency minimum, while sodium levels were increased by the fertigation strategy. The greenhouse gas emission savings may be further increased by on-site fertilizer production because it eliminates the need for energy-intensive distillation to reduce volume. Further experiments are required to explore the application of more nitrogen from nitrified urine while reducing other ion concentrations to minimize overall salinity. Additionally, it is necessary to investigate the detectability of pharmaceutical and hormone residues in plant tissue, even if these compounds had been removed below the analytic detection level in the examined nitrified urine fertilizer.

Supplementary Materials

The following supporting information can be downloaded at: https://www.mdpi.com/article/10.3390/su151310684/s1, Table S1: Nutrient concentrations in tap water used during experiment; Table S2: Composition of the micro element stock solution; Table S3: Reference solutions and measurement specifics for ICP-OES of nutrient solution samples; Table S4: Standard curve for Continuous Flow Analysis; Table S5: Reference solutions and measurement specifics for ICP-OES of leaf tissue samples; Table S6: Nutrients (N, P, K) supplied by each fertilizer in both treatments; Table S7: Treatment means of yield and physiological parameters; Table S8: Treatment means heavy metal content in leaf tissue; Figure S1: Nitrate content in fresh leaf tissue of both fertilizer treatments.

Author Contributions

Conceptualization, M.M., T.R. and D.D.; methodology, M.M., T.R., I.S., N.F. and I.M.; formal analysis, M.M., N.F. and I.M.; investigation M.M., writing—original draft preparation and visualization, M.M.; writing—review and editing, M.M., T.R., D.D., I.S., I.M., N.F., C.U., U.S.; visualization, M.M., supervision, T.R., D.D., U.S., I.M., N.F.; project administration, M.M., U.S. and C.U.; funding acquisition, M.M., U.S., I.S., C.U. All authors have read and agreed to the published version of the manuscript.

Funding

Mareike Mauerer was supported for this study by funds of the Elsa-Neumann scholarship of the city of Berlin.

Institutional Review Board Statement

Not applicable.

Informed Consent Statement

Not applicable.

Data Availability Statement

The data presented in this study are available in the article and Supplementary Materials.

Acknowledgments

The authors are grateful to Bastian Etter and Kai Udert of VUNA GmbH (Dübendorf, Switzerland) for friendly cooperation and the supply of Aurin fertilizer. Lettuce seeds were kindly provided by Rijk Zwaan Welver GmbH (Welver, Germany). The experimental procedures were carried out with friendly support of Manuela Alt, Sabine Altmann, Dirk Behnke, Gregor Grom, Robert Huth, Virginia Marten, Susanne Meier, Sibylle Nöther, Gabriele Sommer, Wolfgang Pfeifer and Renate Wolfer. We want to thank Michael Hoffmann of Rijk Zwaan Welver GmbH for his expert advice on hydroponic lettuce production.

Conflicts of Interest

The authors declare no conflict of interest. The funders had no role in the design of the study; in the collection, analyses, or interpretation of data; in the writing of the manuscript; or in the decision to publish the results.

References

  1. Spangberg, J.; Tidaker, P.; Jönsson, H. Environmental Impact of Recycling Nutrients in Human Excreta to Agriculture Compared with Enhanced Wastewater Treatment. Sci. Total Environ. 2014, 493, 209–219. [Google Scholar] [CrossRef] [Green Version]
  2. International Fertilizer Industry Association. Fertilizers, Climate Change and Enhancing Agricultural Productivity Sustainably; International Fertilizer Industry Association: Paris, France, 2009. [Google Scholar]
  3. Cordell, D.; Drangert, J.-O.; White, S. The Story of Phosphorus: Global Food Security and Food for Thought. Glob. Environ. Chang. 2009, 19, 292–305. [Google Scholar] [CrossRef]
  4. Desmidt, E.; Ghyselbrecht, K.; Zhang, Y.; Pinoy, L.; van der Bruggen, B.; Verstraete, W.; Rabaey, K.; Meesschaert, B. Global Phosphorus Scarcity and Full-Scale P-Recovery Techniques: A Review. Crit. Rev. Environ. Sci. Technol. 2015, 45, 336–384. [Google Scholar] [CrossRef]
  5. Nziguheba, G.; Smolders, E. Inputs of Trace Elements in Agricultural Soils via Phosphate Fertilizers in European Countries. Sci. Total Environ. 2008, 390, 53–57. [Google Scholar] [CrossRef] [PubMed]
  6. Larsen, T.A.; Gujer, W. Separate Management of Anthropogenic Nutrient Solutions (Human Urine). Water Sci. Technol. 1996, 34, 87–94. [Google Scholar] [CrossRef]
  7. STOWA. Separate Urine Collection and Treatment: Options for Sustainable Wastewater Systems and Mineral Recovery. In STOWA Report 2001.39; Wilsenach, J., van Loosdrecht, M., Eds.; STOWA: Utrecht, The Netherlands, 2001. [Google Scholar]
  8. Jönsson, H.; Stenström, T.-A.; Svensson, J.; Sundin, A. Source Separated Urine-Nutrient and Heavy Metal Content, Water Saving and Faecal Contamination. Water Sci. Technol. 1997, 35, 145–152. [Google Scholar] [CrossRef]
  9. Fumasoli, A.; Etter, B.; Sterkele, B.; Morgenroth, E.; Udert, K.M. Operating a Pilot-Scale Nitrification/Distillation Plant for Complete Nutrient Recovery from Urine. Water Sci. Technol. 2016, 73, 215–222. [Google Scholar] [CrossRef] [PubMed] [Green Version]
  10. Maurer, M.; Schwegler, P.; Larsen, T.A. Nutrients in Urine: Energetic Aspects of Removal and Recovery. Water Sci. Technol. 2003, 48, 37–46. [Google Scholar] [CrossRef] [PubMed] [Green Version]
  11. Simha, P.; Ganesapillai, M. Ecological Sanitation and Nutrient Recovery from Human Urine: How Far Have We Come? A Review. Sustain. Environ. Res. 2017, 27, 107–116. [Google Scholar] [CrossRef]
  12. Bornemann, G.; Waßer, K.; Hauslage, J. The Influence of Nitrogen Concentration and Precipitation on Fertilizer Production from Urine Using a Trickling Filter. Life Sci. Space Res. 2018, 18, 12–20. [Google Scholar] [CrossRef]
  13. Udert, K.M.; Wächter, M. Complete Nutrient Recovery from Source-Separated Urine by Nitrification and Distillation. Water Res. 2012, 46, 453–464. [Google Scholar] [CrossRef] [PubMed]
  14. Özel Duygan, B.D.; Udert, K.M.; Remmele, A.; McArdell, C.S. Removal of Pharmaceuticals from Human Urine during Storage, Aerobic Biological Treatment, and Activated Carbon Adsorption to Produce a Safe Fertilizer. Resour. Conserv. Recycl. 2021, 166, 105341. [Google Scholar] [CrossRef]
  15. Muskolus, A. Anthropogenic Plant Nutrients as Fertiliser. Ph.D. Thesis, Humboldt-University of Berlin, Berlin, Germany, 2008. [Google Scholar]
  16. Pradhan, S.K.; Holopainen, J.K.; Heinonen-Tanski, H. Stored Human Urine Supplemented with Wood Ash as Fertilizer in Tomato (Solanum lycopersicum) Cultivation and Its Impacts on Fruit Yield and Quality. J. Agric. Food Chem. 2009, 57, 7612–7617. [Google Scholar] [CrossRef] [PubMed]
  17. Pradhan, S.K.; Nerg, A.M.; Sjöblom, A.; Holopainen, J.K.; Heinonen-Tanski, H. Use of Human Urine Fertilizer in Cultivation of Cabbage (Brassica oleracea)—Impacts on Chemical, Microbial, and Flavor Quality. J. Agric. Food Chem. 2007, 55, 8657–8663. [Google Scholar] [CrossRef] [PubMed]
  18. Bonvin, C.; Etter, B.; Udert, K.M.; Frossard, E.; Nanzer, S.; Tamburini, F.; Oberson, A. Plant Uptake of Phosphorus and Nitrogen Recycled from Synthetic Source-Separated Urine. Ambio 2015, 44, 217–227. [Google Scholar] [CrossRef] [Green Version]
  19. Zabel, P.; Bornemann, G.; Tajmar, M.; Schubert, D. Yield of Dwarf Tomatoes Grown with a Nutrient Solution Based on Recycled Synthetic Urine. Life Sci. Space Res. 2019, 20, 62–71. [Google Scholar] [CrossRef]
  20. El-Nakhel, C.; Geelen, D.; De Paepe, J.; Clauwaert, P.; De Pascale, S.; Rouphael, Y. An Appraisal of Urine Derivatives Integrated in the Nitrogen and Phosphorus Inputs of a Lettuce Soilless Cultivation System. Sustainability 2021, 13, 4218. [Google Scholar] [CrossRef]
  21. Mauerer, M.; Rocksch, T.; Dannehl, D.; Schuch, I.; Mewis, I.; Förster, N.; Ulrichs, C.; Schmidt, U. Impact of Different Concentrations of Nitrified Urine in a Recirculating Nutrient Solution on Growth, Yield and Quality of Lettuce. DGG-Proceedings 2018, 8, 1–5. [Google Scholar] [CrossRef]
  22. Halbert-Howard, A.; Häfner, F.; Karlowsky, S.; Schwarz, D.; Krause, A. Evaluating Recycling Fertilizers for Tomato Cultivation in Hydroponics, and Their Impact on Greenhouse Gas Emissions. Environ. Sci. Pollut. Res. 2021, 28, 59284–59303. [Google Scholar] [CrossRef]
  23. Wdowikowska, A.; Reda, M.; Kabała, K.; Chohura, P.; Jurga, A.; Janiak, K.; Janicka, M. Water and Nutrient Recovery for Cucumber Hydroponic Cultivation in Simultaneous Biological Treatment of Urine and Grey Water. Plants 2023, 12, 1286. [Google Scholar] [CrossRef]
  24. Shannon, M.C.; Grieve, C.M. Tolerance of Vegetable Crops to Salinity. Sci. Hortic. 1999, 78, 5–38. [Google Scholar] [CrossRef]
  25. Silberbush, M.; Ben-Asher, J.; Ephrath, J.E. A Model for Nutrient and Water Flow and Their Uptake by Plants Grown in a Soilless Culture. Plant Soil 2005, 271, 309–319. [Google Scholar] [CrossRef]
  26. Hasegawa, P.M.; Bressan, R.A.; Zhu, J.-K.; Bohnert, H.J. Plant Cellular and Molecular Responses to High Salinity. Annu. Rev. Plant Biol. 2000, 51, 463–499. [Google Scholar] [CrossRef] [Green Version]
  27. Maas, E.V.; Hoffmann, G.J. Crop Salt Tolerance—Current Assessment. J. Irrig. Drain. Div. 1977, 103, 115–134. [Google Scholar] [CrossRef]
  28. Tas, G.; Papadandonakis, N.; Savvas, D. Responses of Lettuce (Lactuca sativa L. var. longifolia) Grown in a Closed Hydroponic System to NaCl- or CaCl2-Salinity. J. Appl. Bot. Food Qual. 2005, 79, 136–140. [Google Scholar]
  29. Göhler, F.; Molitor, H.-D. Kopfsalat. In Erdelose Kulturverfahren im Gartenbau; Göhler, F., Molitor, H.-D., Eds.; Eugen Ulmer: Stuttgart, Germany, 2002; pp. 227–231. ISBN 3-8001-5053-0. [Google Scholar]
  30. Andriolo, J.L.; da Luz, G.L.; Witter, M.H.; Godoi, R.d.S.; Barros, G.T.; Bortolotto, O.C. Growth and Yield of Lettuce Plants under Salinity. Hortic. Bras. 2005, 23, 931–934. [Google Scholar] [CrossRef] [Green Version]
  31. Collier, G.F.; Tibbitts, T.W. Tipburn of Lettuce. In Horticultural Reviews; John Wiley & Sons, Inc.: Hoboken, NJ, USA, 1982; Volume 4, pp. 49–65. [Google Scholar]
  32. Köpping, I.; McArdell, C.S.; Borowska, E.; Böhler, M.A.; Udert, K.M. Removal of Pharmaceuticals from Nitrified Urine by Adsorption on Granular Activated Carbon. Water Res. X 2020, 9, 100057. [Google Scholar] [CrossRef]
  33. Dannehl, D.; Huyskens-Keil, S.; Wendorf, D.; Ulrichs, C.; Schmidt, U. Influence of Intermittent-Direct-Electric-Current (IDC) on Phytochemical Compounds in Garden Cress during Growth. Food Chem. 2012, 131, 239–246. [Google Scholar] [CrossRef]
  34. VDLUFA. Bestimmung von Mineralischem Stickstoff (Nitrat Und Ammonium) in Bodenprofilen A 6.1.4.1. In Band I: Die Untersuchung von Böden, 3. Teillfg; VDLUFA-Verlag: Darmstadt, Germany, 2002; ISBN 978-3-941273-13-9. [Google Scholar]
  35. Suhl, J.; Dannehl, D.; Kloas, W.; Baganz, D.; Jobs, S.; Scheibe, G.; Schmidt, U. Advanced Aquaponics: Evaluation of Intensive Tomato Production in Aquaponics vs. Conventional Hydroponics. Agric. Water Manag. 2016, 178, 335–344. [Google Scholar] [CrossRef]
  36. Raaphorst, M.G.M.; Benninga, J. Kwantitatieve Informatie Voor de Glastuinbou w 2019: Kengetallen Voor Groenten-, Snijbloemen-, Pot-En Perkplanten Teelten; Wageningen UR: Wageningen, The Netherlands, 2019. [Google Scholar]
  37. Blom, T.; Jenkins, A.; Pulselli, R.M.; van den Dobbelsteen, A.A.J.F. The Embodied Carbon Emissions of Lettuce Production in Vertical Farming, Greenhouse Horticulture, and Open-Field Farming in the Netherlands. J. Clean. Prod. 2022, 377, 134443. [Google Scholar] [CrossRef]
  38. Brentrup, F.; Lammel, J.; Stephani, T.; Christensen, B. Updated Carbon Footprint Values for Mineral Fertilizer from Different World Regions. In Proceedings of the 11th International Conference on Life Cycle Assessment of Food 2018 (LCA Food) in Conjunction with the 6th LCA AgriFood Asia and 7th International Conference on Green and Sustainable Innovation (ICGSI) on “Global Food Challenges towards Sustainable Consum”, Bangkok, Thailand, 17–19 October 2018. [Google Scholar]
  39. Umweltbundesamt. Prozessorientierte Basisdaten Für Umweltmanagement-Instrumente (ProBas). Available online: https://www.probas.umweltbundesamt.de/ (accessed on 6 March 2023).
  40. Faust, V.; Gruber, W.; Ganigué, R.; Vlaeminck, S.E.; Udert, K.M. Nitrous Oxide Emissions and Carbon Footprint of Decentralized Urine Fertilizer Production by Nitrification and Distillation. ACS EST Eng. 2022, 2, 1745–1755. [Google Scholar] [CrossRef]
  41. ISO 19747:2009-07; Investigation of Solids—Pre-Treatment, Preparation and Processing of Samples for Chemical, Biological and Physical Investigations. DIN: Berlin, Germany, 2009.
  42. ISO 15936:2012; Sludge, Treated Biowaste, Soil and Waste—Determination of Total Organic Carbon (TOC) by Dry Combustion. DIN: Berlin, Germany, 2012.
  43. ISO 16168:2012-11; Sludge, Treated Biowaste and Soil—Determination of Total Nitrogen Using Dry Combustion Method. DIN: Berlin, Germany, 2012.
  44. Taylor, K.L.; Brackenridge, A.E.; Vivier, M.A.; Oberholster, A. High-Performance Liquid Chromatography Profiling of the Major Carotenoids in Arabidopsis Thaliana Leaf Tissue. J. Chromatogr. A 2006, 1121, 83–91. [Google Scholar] [CrossRef] [PubMed]
  45. Mewis, I.; Smetanska, I.M.; Müller, C.T.; Ulrichs, C. Specific Poly-Phenolic Compounds in Cell Culture of Vitis Vinifera L. Cv. Gamay Fréaux. Appl. Biochem. Biotechnol. 2011, 164, 148–161. [Google Scholar] [CrossRef]
  46. Förster, N.; Ulrichs, C.; Schreiner, M.; Arndt, N.; Schmidt, R.; Mewis, I. Ecotype Variability in Growth and Secondary Metabolite Profile in Moringa Oleifera: Impact of Sulfur and Water Availability. J. Agric. Food Chem. 2015, 63, 2852–2861. [Google Scholar] [CrossRef]
  47. De Pascale, S.; Barbieri, G. Effects of Soil Salinity from Long-Term Irrigation with Saline-Sodic Water on Yield and Quality of Winter Vegetable Crops. Sci. Hortic. 1995, 64, 145–157. [Google Scholar] [CrossRef]
  48. Sonneveld, C.; van den Bos, A.L.; Voogt, W. Modeling Osmotic Salinity Effects on Yield Characteristics of Substrate-Grown Greenhouse Crops. J. Plant Nutr. 2005, 27, 1931–1951. [Google Scholar] [CrossRef]
  49. Tzortzakis, N.G. Influence of NaCl and Calcium Nitrate on Lettuce and Endive Growth Using Nutrient Film Technique. Int. J. Veg. Sci. 2008, 15, 44–56. [Google Scholar] [CrossRef]
  50. Marschner’s Mineral Nutrition of Plants; Rengel, Z.; Cakmak, I.; White, P. (Eds.) Academic Press: Cambridge, MA, USA, 2022; ISBN 9780323853521. [Google Scholar]
  51. Resh, H.M. 3 Nutrient Solution. In Hydroponic Food Production. A Definitive Guidebook for the Advanced Home Gardener; Woodbridge Press: New York, NY, USA, 2013; pp. 31–88. [Google Scholar]
  52. Commission of the European Communities. Commission Regulation (EC) No 118/2006 of 19 December 2006 Setting Maximum Levels for Certain Contaminants in Foodstuffs. Off. J. Eur. Union 2006, L364, 5–24. [Google Scholar]
  53. Gunes, A.; Post, W.N.K.; Kirkby, E.A.; Aktas, M. Influence of Partial Replacement of Nitrate by Amino Acid Nitrogen or Urea in the Nutrient Medium on Nitrate Accumulation in NFT Grown Winter Lettuce. J. Plant Nutr. 1994, 17, 1929–1938. [Google Scholar] [CrossRef]
  54. Caldwell, C.R.; Britz, S.J. Effect of Supplemental Ultraviolet Radiation on the Carotenoid and Chlorophyll Composition of Green House-Grown Leaf Lettuce (Lactuca sativa L.) Cultivars. J. Food Compos. Anal. 2006, 19, 637–644. [Google Scholar] [CrossRef]
  55. Winter, M.; Herrmann, K. Esters and Glucosides of Hydroxycinnamic Acids in Vegetables. J. Agric. Food Chem. 1986, 34, 616–620. [Google Scholar] [CrossRef]
  56. Kim, H.J.; Fonseca, J.M.; Choi, J.H.; Kubota, C.; Dae, Y.K. Salt in Irrigation Water Affects the Nutritional and Visual Properties of Romaine Lettuce (Lactuca sativa L.). J. Agric. Food Chem. 2008, 56, 3772–3776. [Google Scholar] [CrossRef] [PubMed]
  57. Mahmoudi, H.; Huang, J.; Gruber, M.Y.; Kaddour, R.; Lachaâl, M.; Ouerghi, Z.; Hannoufa, A. The Impact of Genotype and Salinity on Physiological Function, Secondary Metabolite Accumulation, and Antioxidative Responses in Lettuce. J. Agric. Food Chem. 2010, 58, 5122–5130. [Google Scholar] [CrossRef] [PubMed]
Figure 1. Effects of different fertilizer treatments on lettuce plant development (striped = Aurin + mf; white = Control). Mean ± 1/2 least significant difference (t-test, p ≤ 0.05).
Sustainability 15 10684 g001
Figure 2. Effects of different fertilizer treatments on mineral element content in leaf tissue. Mean ± standard deviation (dw = dry weight). Asterisks indicate significant differences (t-test, p ≤ 0.05). Schemes follow the same formatting.
Sustainability 15 10684 g002
Table 1. Nutrient concentrations in the Aurin fertilizer (Vuna GmbH, Dübendorf, Switzerland) batch that was used for the given experiment according to Continuous Flow Analysis (NH4+-N and NO3-N) and ICP-OES (remaining elements).
ElementUnitConcentration
NH4-N 26.3
NO3-N 31.9
Total N 58.2
P 4.4
K 24.1
Na [g/L]28.1
Cl 36.0
Ca 1.3
Mg 0.2
S 5.7
Fe 3.8
B 42.6
Cu 9.4
Mn [mg/L]0.6
Mo 0.5
Zn 23.2
Table 2. Amount of each fertilizer applied in both treatments is given as a mean of the total experiment per tank. Manufacturers are named in footers.
FertilizerUnitControlAurin + mfProduct
Nitrified urine fertilizer [L]00.432Aurin 1
CaNO3 [g]61.17178.741YaraLiva Calcinit 2
KH2PO4 [g]62.25257.285YaraTera KRISTA MKP 2
KNO3 [g]138.752113.038YaraTera KRISTA K PLUS 2
KAS (76% NH4NO3 + 24% CaCO3) [g]90.6140Triferto KAS 27% 3
Yara Krista MgS [g]28.41228.963Yara Krista MgS 2
Fe-EDTA 13% [g]3.7594.017COMPO Fetrilon 13 4
Microelement stock [L]0.0370.032Premixed stock solution 5
KOH 20% [L]0.0540.059Potash lye 6
H3PO4 2.5% [L]0.2370.205Phosphoric acid 6
1 Vuna GmbH, Dübendorf, Switzerland 2 YARA GmbH & Co KG, Dülmen, Germany. 3 Triferto, Doetinchem, Netherlands. 4 COMPO GmbH, Münster, Germany. 5 (see Table S2 in Supplementary Materials). 6 Carl Roth GmbH & Co KG, Karlsruhe, Germany.
Table 3. Calculation of nutrient use efficiencies for nitrogen, potassium, and phosphorus. Means and standard deviations of yield per tank, nitrogen, potassium, and phosphorus applied per tank and nutrient use efficiencies per tank of both treatments.
ControlAurin + mf
UnitMeanSDMeanSD
Y 1 [g]81883878647195
FN 2 [g]30.83.033.50.9
NUEN 3-268312589
FK 2 [g]34.70.934.53.3
NUEK 3-236.016.2252.326.6
FP 2 [g]10.61.310.90.7
NUEP 3-784.9136.4795.555.4
1 Y = estimated leaf fresh mass for 24 plants per tank, 2 F = mass of respective nutrient per tank applied over the course of the experiment minus discharge at the end of experiment, 3 NUE = Nutrient use efficiency for respective nutrients calculated as NUE = Y/F (partial productivity factor).
Table 4. Calculated carbon footprints (CFs) for fertilizer salts of the two experimental treatments.
UnitControlAurin + mf
Mineral fertilizer extra 1-KAS, KH2PO4, KNO3CaNO3
Mineral fertilizer difference 2 [kg ha−1]3133.72, 171.78, 889.27607.63
CF mineral fertilizers [CO2-eq ha−1]4260.60 388.88
N from Aurin® fertilizer [kg ha−1]-869.90
CF urine fertilizer [CO2-eq ha−1]-8003.1
CF wastewater treatment [CO2-eq ha−1]8503.24-
CF Total [CO2-eq ha−1]12,763.858391.94
1 Amounts used of fertilizers indicated have positive differences to the other treatment, 2 Differences shown are in comparison to the second treatment.
Table 5. Effects of fertilizer strategies on carotenoid and chlorophyll content in leaf tissue.
ControlAurin + mf
[µg/g Dry Weight] 1
Chlorophyll a 4287.68 (±197.50)4206.54 (±626.96)
Chlorophyll b2332.45 (±181.96)2334.73 (±424.07)
Cis-β-carotene16.53 (±2.21)16.26 (±3.14)
Lutein391.48 (±36.67)341.20 (±43.98)
Neoxanthin160.80 (±15.70)154.63 (±30.31)
Trans-β-carotene105.95 (±14.57)102.90 (±20.25)
1 Means ± standard deviation. No significant differences were found according to t-test (p ≤ 0.05).
Table 6. Influence of different fertilizer strategies on phenolic acid content in leaf tissue.
ControlAurin + mf
[nmol/g Dry Weight] 1
Caffeoylmalic acid522.33 (±179.87)535.44 (±233.12)
Caffeoylquinic acid665.81 (±207.43)750.09 (±315.18)
Caffoyltartaric acid414.27 (±105.56)494.97 (±177.46)
Dicaffeoylquinic acid67.74 (±7.77)102.70 (±59.98)
Dicaffeoyltartaric acid2071.25 (±583.11)2441.38 (±971.56)
Quercetin-3-O (6-malonyl) glucoside15.38 (±5.57)16.36 (±6.16)
1 Means ± standard deviation. No significant differences were found according to t-test (p ≤ 0.05).
Disclaimer/Publisher’s Note: The statements, opinions and data contained in all publications are solely those of the individual author(s) and contributor(s) and not of MDPI and/or the editor(s). MDPI and/or the editor(s) disclaim responsibility for any injury to people or property resulting from any ideas, methods, instructions or products referred to in the content.

