1. Introduction
Recycling nutrients in agricultural production becomes ever more crucial. Source-separating urine and using it as a fertilizer could reduce energy consumption for fertilizer production, emissions of greenhouse gases, and the depletion of phosphate rock [
1]. The production of synthetic nitrogen fertilizers with the Haber-Bosch process uses large amounts of fossil energy, mainly natural gas, releasing the equivalent of approximately 465 million tons of CO
2 into the atmosphere each year [
2]. European countries in particular, which are dependent on the import of phosphate fertilizers, could benefit from self-subsistence regarding this compound [
3,
4]. In addition, fertilizer from rock phosphate contains heavy metals [
5] that can reduce the nutritional quality of produce. Secondly, human urine is the main contributor of nutrients to domestic wastewater. It accounts for 80% of the nitrogen, 50% of the phosphorus, and 60% of the potassium, but only 1% of the total volume [
6,
7] and contains only low levels of heavy metals [
8]. Fresh urine measured in one study contained between 1190–4140 mg N/L, 854–1470 mg K/L, and 106–242 mg P/L [
9]. Removing these nutrients from wastewater by aeration and precipitation to prevent the eutrophication of water bodies is also energy-consuming [
10]. A number of physicochemical and biological methods for post-processing urine and using it as a fertilizer have been developed in recent years and reviewed by Simha and Ganesapillai [
11]. Biological nitrification is one promising method that allows for the near complete recovery of nitrogen [
12,
13]. This treatment stabilizes the volatile ammonium/ammonia (NH
4+/NH
3) fraction in stored urine and preserves other potential plant nutrients such as potassium, phosphorus, and others. Additional treatment steps could include distillation to inactivate pathogens and reduce volume [
9] or only pasteurization to achieve the former, and/or activated carbon filtration to remove pharmaceuticals and hormones [
14].
Plant experiments have been conducted in soil with unprocessed human urine [
15,
16,
17], with nitrified synthetic urine [
18], and in hydroponic systems with nitrified synthetic urine [
19], as well as with nitrified human urine to grow lettuce [
20,
21], tomato plants [
22], and cucumber plants [
23]. Human urine, also after nitrification, contains concentrations of sodium and chloride higher than those usually found in nutrient solutions (e.g., 0.3 mol Na
+ and 0.4 mol Cl
− per mol dissolved nitrogen) [
9]. This can pose a problem for salt-sensitive vegetable crops because almost all cultivated vegetable crops are sensitive to high salt concentrations in the nutrient solution in varying degrees [
24]. It can also be problematic in recirculating hydroponic systems due to salt build-up [
25].
Salt stress manifests in plants due to osmotic stress or ion toxicity [
26]. With lettuce, which is characterized as a moderately salt-sensitive crop regarding its tolerance for the electrical conductivity (EC) of the nutrient solution [
27], osmotic stress has a known influence on water content and thus on marketable yield. Regarding ion toxicity, the results of Tas et al. [
28] show that NaCl salinity is less well-tolerated by romaine lettuce than other forms of salinity.
Considering that nutrient solutions are often composed of fertilizer salts that contain nitrate as an anion, the high nitrogen-to-calcium and nitrogen-to-potassium ratios and a high level of ammonium nitrogen in the nitrified urine fertilizer can further complicate the replacement of respective fertilizers.
A previous study with the nitrified urine fertilizer Aurin (Vuna GmbH, Dübendorf, Switzerland) showed that a threshold concentration of 38% of nitrogen supplied by nitrified urine in the initial mix did not cause yield losses and salt stress symptoms to
Lactuca sativa L. cv. 79–54 RZ [
21]. The study tested four different Aurin concentrations in a greenhouse during the winter season and lettuce plants were grown up to 60% of the expected head size reached (stage 46 on BBCH-scale). Butterhead lettuce (
Lactuca sativa subsp.
capitata L.) was examined because of its economic relevance. The cultivar
Lactuca sativa L. cv. 79–154 RZ was chosen due to its suitability for hydroponic systems.
The objective of the present study was to apply the developed nitrified urine fertilizing strategy to spring greenhouse lettuce in a nutrient film technique system and investigate the treatment’s impact on mineral fertilizer savings and carbon footprint (CF). The new fertilizer strategy was compared to a conventionally fertilized control treatment by evaluating plant development and contents of mineral elements, heavy metals, and secondary plant compounds. Mineral fertilizer savings were calculated to demonstrate that the application of mineral fertilizer can be reduced. To assess environmental impact, CFs of the production of the employed mineral and nitrified urine fertilizers and the (fictional) wastewater treatment of the applied urine were compared.
2. Materials and Methods
2.1. Experimental Set-Up, Plant Material, and Growing Conditions
The experimental set-up in a Venlo-type greenhouse consisted of six nutrient film technique (NFT) systems covered with opaque foil and their respective nutrient solution tanks (200 L). Nutrient solution was circulated via pumps (Universal 600, Eheim, Deizisau, Germany) at a flow rate of 2.6 L/min. Lettuce seeds (Lactuca sativa var. capitata cv. 79–154 RZ, Rijk Zwaan, De Lier, The Netherlands) were sown on 3 April 2018, in rock wool cubes (Cultilene Plug, 25 × 25 × 40 mm SBS 25/150, Saint-Gobain Cultilene, Rijen, The Netherlands) and pre-soaked with tap water in a growing chamber (24 °C and 63% relative humidity). After the unfolding of the first true leaf, seedlings were watered with a nutrient solution with an EC of 1.5 dS/m and pH 5.6. After 15 days, plants with 3 to 5 true unfolded leaves were transplanted into pre-weighed rock wool cubes (Cultilene HR, 100 × 100 mm 28/35) in the experimental setup (24 plants per NFT system). Mean air temperature in the greenhouse was 23.5 °C during the day and 15.9 °C at night and the mean relative humidity was 52% for the total duration of the experiment. Ventilation was opened above 19 °C and heating set points were 12 °C and 9 °C during the day and night, respectively.
2.2. Nutrient Solution Treatments
A nutrient solution recipe for lettuce according to Göhler and Molitor [
29] served as the control treatment with three tanks as replications (n = 3) and 24 lettuce plants per replication. A nutrient solution EC of 2.0 dS/m is usually used by commercial producers of hydroponic lettuce, to avoid excess salinity [
30] and calcium deficiency in leaves which causes tip burn and reduces the market quality of the produce [
31]. Concentrations in the recipe were thus diluted to ensure an EC of 2.0 dS/m in the control treatment when using local tap water and relative calcium concentration was increased to prevent tip burn [
31]. The nutrient concentrations in the tap water used for the experiment are stated in the
Supplementary Materials (
Table S1). Target concentrations for the nutrient solution in both treatments were 168.1 mg/L N, 41.3 mg/L P, 286.7 mg/L K, 147.0 mg/L Ca, 24.3 mg/L Mg, 1.5 mg/L Fe, 360.3 µg/L B, 174.4 µg/L Zn, 31.8 µg/L Cu, 183.1 µg/L Mn, and 32.0 µg/L Mo. The tested nitrified urine fertilizer, Aurin, is nitrified up to the equilibrium ratio of nitrate nitrogen to ammonium nitrogen (1:1), activated carbon filtrated, and then distilled by Vuna GmbH (Dübendorf, Switzerland) [
9,
32] (nutrient composition:
Table 1). There is inherent variability in the product and the values shown apply to the batch used in the experiment.
In the nitrified urine treatment, ‘Aurin + mf’ (n = 3), nitrate salts, and other mineral fertilizers (mf) were substituted with varying concentrations of the nitrified urine fertilizer to obtain the same total N, P, K, Ca, Mg, Fe, and B concentrations as in the control treatment. In the initial mix, 38% of total nitrogen was supplied by nitrified urine, according to a previous study [
21]. Due to the high concentration of ammonium in Aurin (50% of total nitrogen according to the manufacturer, 45% according to our own analysis after storage, sampling, and dilution of samples), the control treatment was adjusted to contain a similar ammonium concentration and 24% of total nitrogen was supplied in the form of ammonium in all treatments. Nutrient concentrations in each tank were analyzed at the start of the experiment and three weeks later, and then weekly afterward. Three days after taking the nutrient solution samples, nutrients were added to each tank in the form of mineral fertilizer or mineral fertilizer and Aurin, respectively. Values of pH and EC were measured daily with a hand-held device (HI9811-5, Hanna Instruments, Vöhringen, Germany). The pH was adjusted with phosphoric acid and potassium hydroxide to a value between 6.0 and 6.8 with no greater difference than 0.3 between the treatments. Total fertilizer used during the experiment is specified in
Table 2. The chloride (Cl) concentration in the nutrient solutions was determined on three occasions with a hand-held photometer (Pocket Colorimeter II, Hach Lange, Düsseldorf/Berlin, Germany). The analysis was repeated three times and a mean value was calculated.
2.3. Nutrient Solution Analyses
Nutrient solution analyses were performed regularly to ensure the accuracy of treatments. This was at the start of the experiment and three weeks later, then weekly afterwards. Two samples of each nutrient solution tank were taken and filtered with filter paper (595 ½, Whatman, GE Healthcare, Buckinghamshire, UK). Nutrient concentrations (B, Ca, Cu, Fe; K, Mg, Mn, Mo, Na, S, P, Zn) were analyzed via inductively coupled plasma-optical emission spectrometry (ICP-OES) using an ICP Emission Spectrometer (iCAP 6300 Duo MFC, Thermo Fisher Scientific, Waltham, MA, USA). The method was performed according to the application note of Thermo Fisher Scientific with modifications described by Dannehl et al. [
33] with the following adaptions: nebulizer gas flow was 0.5 L/min and calibration curves were generated with the reference solutions listed in the
Supplementary Materials (see
Table S3). Dissolved nitrogen concentrations (NO
3-N and NH
4-N) in the water samples were analyzed using continuous flow analysis (CFA) (San++, SKALAR, Breda, Netherlands) according to VDLUFA [
34] and modified by Suhl et al. [
35] with the following adaptions: the used reference solutions were 2.336 mg/L NH
4+ (Ammonium standard solution, Merck, Darmstadt, Germany) and 2.26 mg/L NO
3− (Nitrate standard solution, Merck, Darmstadt, Germany) (see
Table S4 in the Supplementary Materials for standard curve).
2.4. Calculation of Fertilizer Savings and Carbon Footprints
Fertilizer savings were calculated for each fertilizer salt, comparing the mean amounts used in both treatments given in
Table 2. This was done for each nutrient contained in the N, P, and K fertilizers and for each fertilizer salt. Assuming a production of 830,000 heads per hectare [
36] in [
37], savings were expressed as kg ha
−1. From these results, the saving potential of CO
2 equivalent [kg CO
2-eq ha
−1] was calculated according to the results of Brentrup et al. [
38] for CaNO
3 (0.64 kg CO
2-eq kg CaNO
3) and KAS (0.95 kg CO
2-eq kg KAS), and Umweltbundesamt [
39] for KH
2PO
4 (1.26 kg CO
2-eq kg KH
2PO
4) and KNO
3 (1.2 kg CO
2-eq kg KNO
3).
The CF of the production of the nitrified urine fertilizer Aurin was calculated from the amount of kg N from Aurin used in the experiment according to Faust et al. [
40]. An operational CF of 9.2 kg CO
2-eq kg N
−1 was assumed to apply after implementation of the proposed NO
2 mitigation strategies. For the control treatment, a fictional CF (9.78 kg CO
2-eq kg N) of the wastewater treatment of the urine applied in the Aurin + mf treatment was calculated according to Maurer et al. [
10]. For calculations of the Aurin production CF as well as the wastewater treatment CF, a European electricity mix of 230 g CO
2-eq kWh
−1 was used for calculations [
40], as we assume this to be comparable to the CFs for mineral fertilizer production.
2.5. Yield and Product Quality Parameters
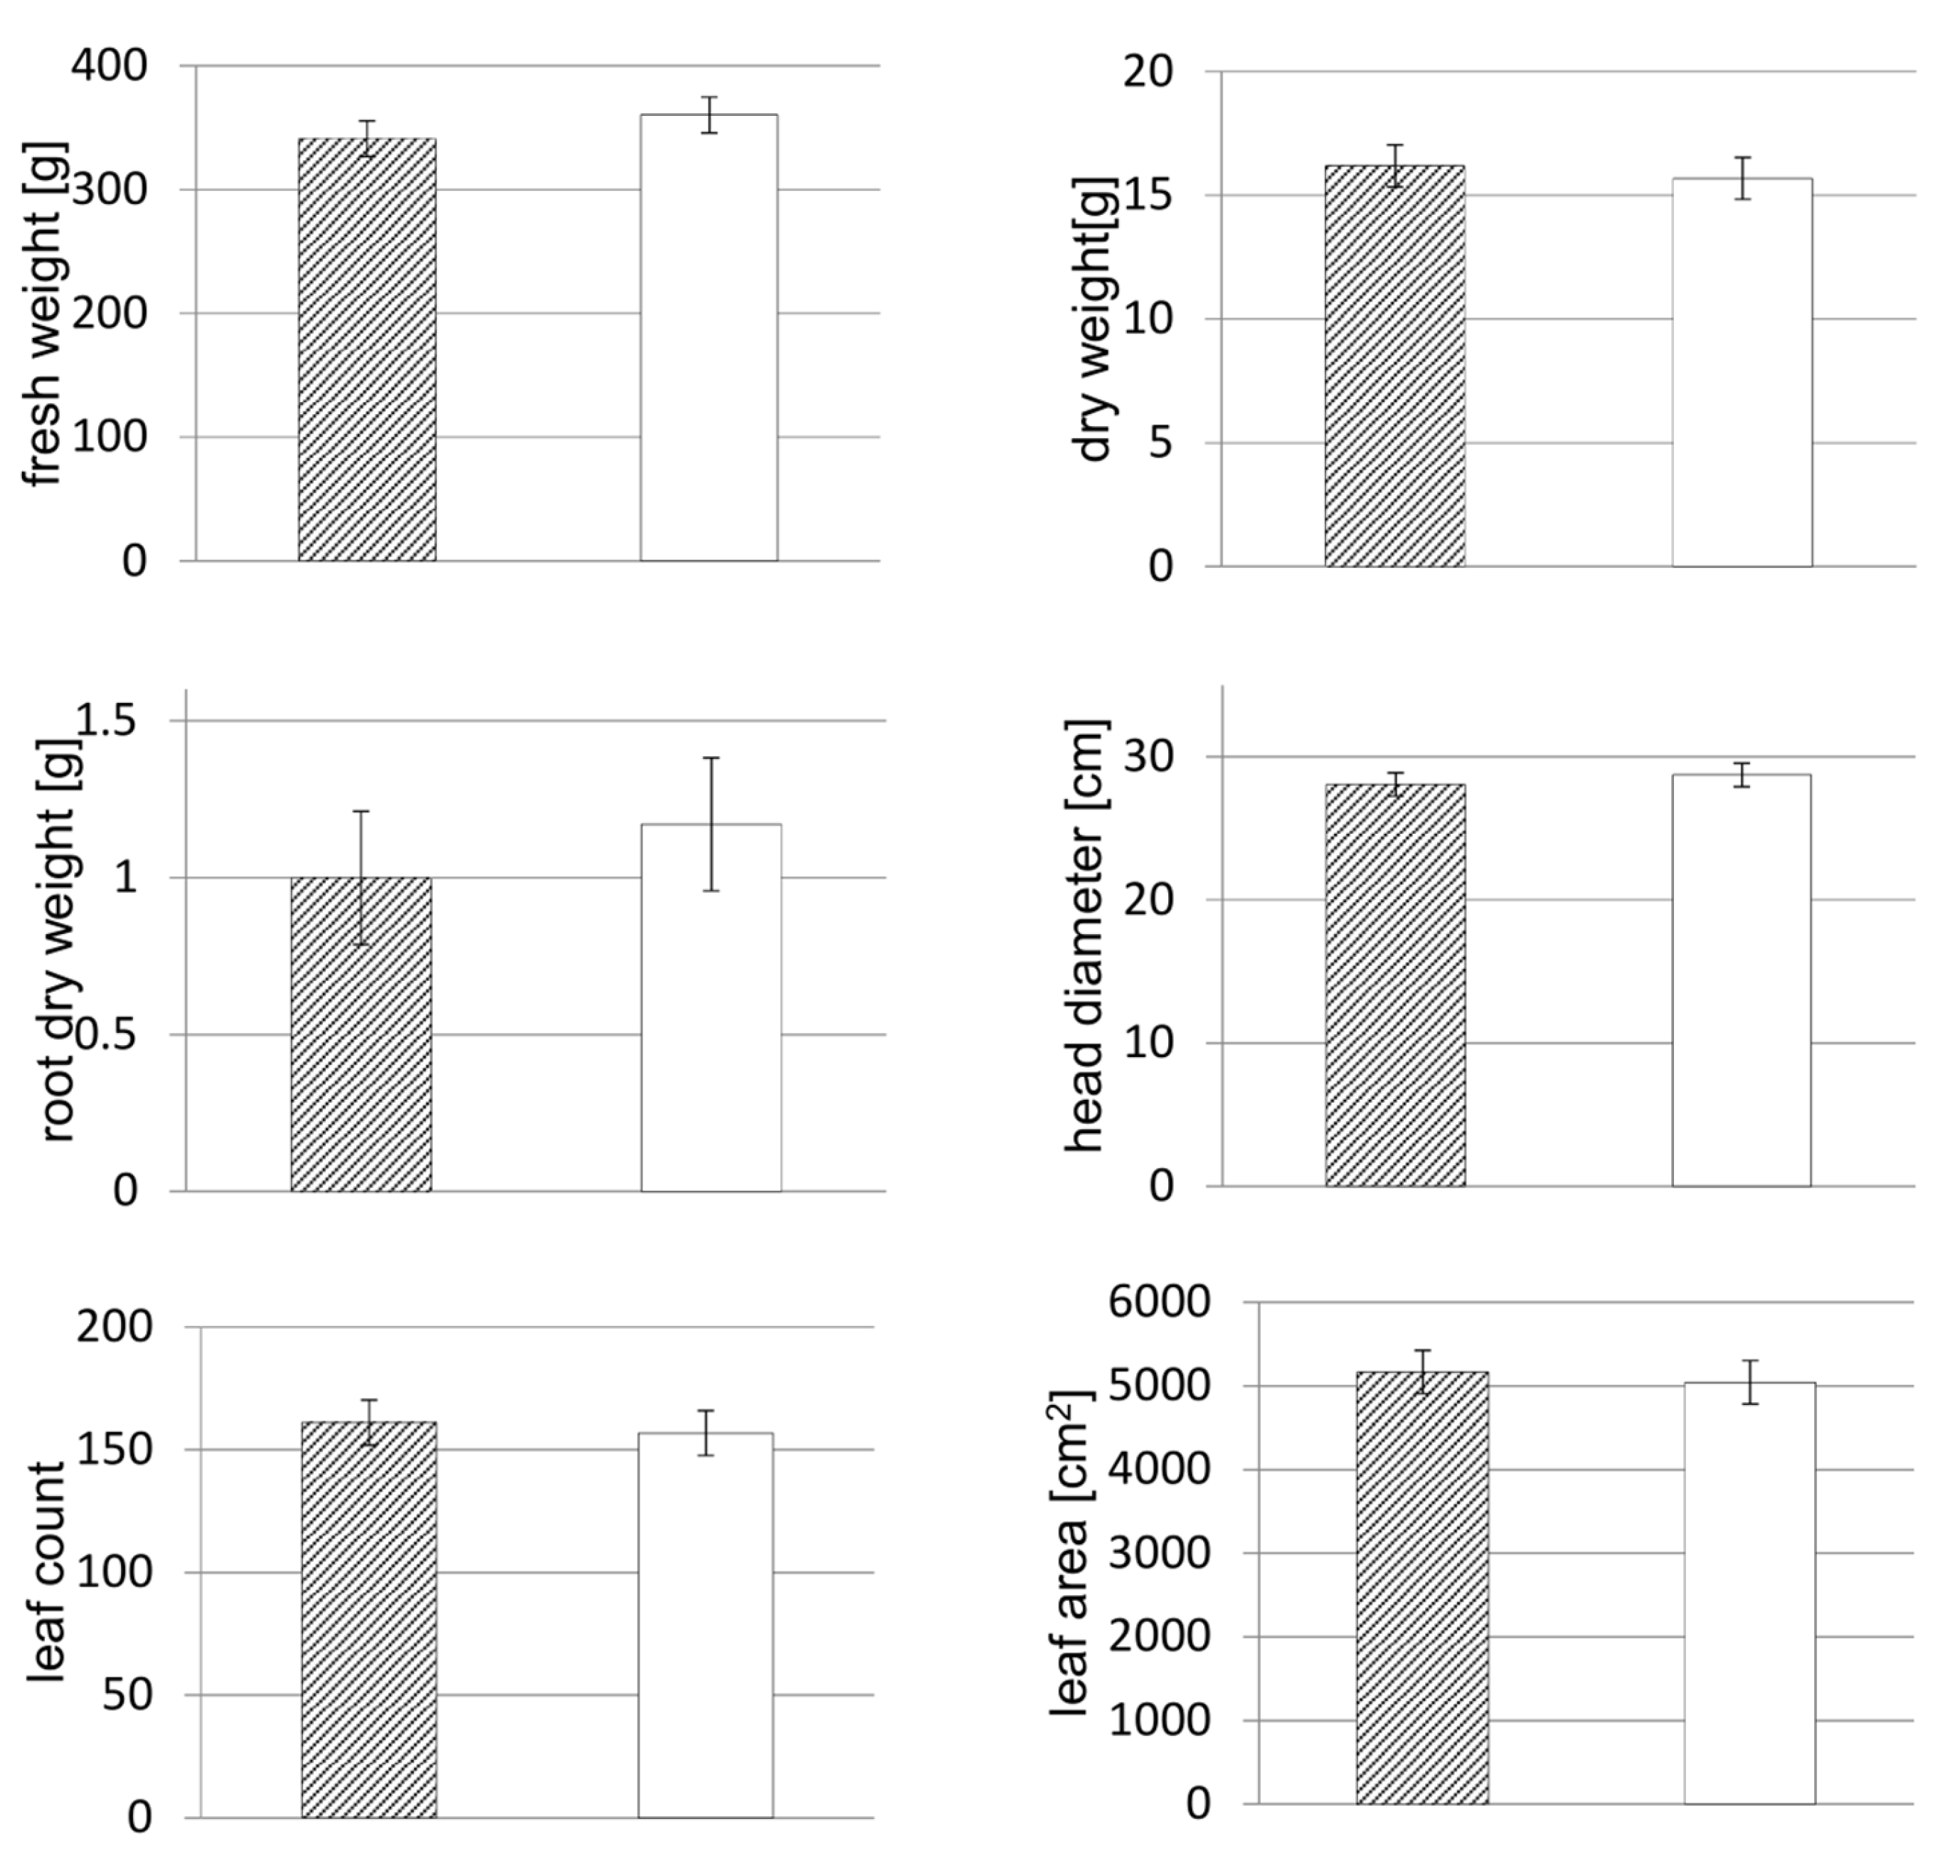
Immediately before harvest, plant diameters of every plant were measured at the broadest expansion of the head, and leaves were counted. Plants were harvested after 35 days, on 23 May 2018. Fresh weights were taken of all lettuce heads after removing non-marketable leaves that showed initial signs of rot or senescence. The remaining rootstocks in rock wool cubes were dried at 105 °C until constant weight and then weighed. After measuring the leaf area of eight lettuce heads per NFT system, these samples were dried at 105 °C until constant weight to determine the head dry weight.
For mineral content, nitrate, and secondary compound analysis, three pooled samples per NFT system were taken and frozen in liquid nitrogen, using one-quarter of four lettuce heads. Samples were freeze-dried and ground to a fine powder (Retsch, Haan, Germany) and used in all analyses described as follows: For Ca, Cd, Cu, Fe, K, Mg, Na, Ni, P, Pb, S, and Zn analysis, 0.25 g of each sample was digested in a microwave (MARS Xpress MD-8216, CEM, Matthews, NC, USA) according to DIN EN ISO 19747:2009 [
41] as described by Dannehl et al. [
33]. The analysis of the elements in the digestion solution was conducted via ICP-OES as described above, except that 10 mL HNO
3 (65%) and 6 mL H
2O
2 (30%) were added to 100 mL of all reference solutions. Reference solution concentrations and measurement specifics are given in the
Supplementary Materials (see
Table S5). Carbon and nitrogen content in lettuce was analyzed using an elemental analyzer (vario MAX cube, Elementar Analysensysteme, Langenselbold, Germany) according to DIN EN 15936:2012 [
42] and DIN EN 16168:2012 [
43]. The analysis was performed twice. Carbon and nitrogen contents were calculated using glutamic acid as the reference standard and expressed in percent. Nitrate content of the samples was determined with an RQFlex 20 reflectometer and Reflectoquant test strips for nitrate (Merck, Darmstadt, Germany).
Chlorophylls and carotenoids were extracted according to Taylor et al. [
44] with the following modifications: 0.5 mL of MeOH THF solution (1:1
v:
v, three times) was added to 10 mg of freeze-dried and ground samples, shaken at 24 °C and 500 rpm for 5 min and centrifuged at 20 °C and 4.500 rpm for 5 min. The pellet was re-extracted twice. The supernatant was transferred to a glass vial and dried under a nitrogen stream. Samples were dissolved with 0.1 mL dichloromethane and 0.3 mL isopropanol and thoroughly mixed, filtered (SpinX filters, 0.22 µm), and transferred to HPLC vials. Extracts were analyzed on a Thermo Scientific HPLC system consisting of an UltiMate 3000 autosampler, pump, photodiode array detector, and a thermostated column compartment (Thermo Fisher Scientific, Waltham, MA, USA). Ultra-high performance liquid chromatography analysis was performed according to Baldermann et al. (2013) with slight modifications: eluent was used without ammonium acetate, gradient mode: 0–10 min 0% B, 10–40 min 0–100% B, 40–42 min 100% B, 42–45 min 100–0% B, 45–55 min 0% B. Samples were separated on a YMC-C30 column (2.1 × 100 mm, 3 μm) at 25 °C oven temperature and a flow of 0.2 mL/min. Carotenoids were detected at 456 nm and identified by retention times and specific UV spectra using reference compounds (trans-β-carotene, cis-β-carotene, lutein, neoxanthin, chlorophyll a, and chlorophyll b). Amounts of compounds (in micrograms per gram of dry weight) were calculated based on the peak area relative to the related external standard curve, including their specific response factors.
Phenolic acids and flavonoids were analyzed from 20 mg of freeze-dried and ground samples based on an HPLC method described by Mewis et al. [
45] and modified by Förster et al. [
46]. In summary, the method consists of extraction with 70% methanol in an ultrasonic bath. Samples were analyzed by HPLC using a C16 column (AcclaimPA, 3 μm, Dionex, Sunnyvale, CA, USA). Compounds were quantified at 290 nm against the internal standard, 4-methoxycinnamic acid (1 mM, Sigma Aldrich, St. Louis, MO, USA). Commercially available standards of single compounds with a similar chemical structure to the identified ingredients were used as references (caffeic acid, 4-caffeoylquinic acid, caffeoyl malic acid, quercetin-7-O-glucoside). Relative response factors were used to correct for absorbance difference. Qualitative identification was carried out by retention time, specific UV spectra, and mass spectrometry.
2.6. Statistical Analysis
Data were analyzed with SAS 9.4 software for Windows (SAS Institute Inc., Cary, NC, USA). As the study focuses on nutrients, one hydroponic system with 24 lettuce plants was counted as statistical replication. The statistical model for analysis of variances comprised nutrient solution as a fixed treatment factor with three replications (n = 3) and the random variation between tanks. For the treatments, homogeneous variances were assumed (as this is not testable for n = 3). According to the Central Limit Theorem, the normal distribution of the tank mean values can be assumed irrespective of the initial distribution of the individual values. For each trait, least squares means and standard errors of the means were estimated, and comparisons between control and Aurin + mf treatments were performed using the Student’s t-test (p ≤ 0.05).


 ,
, 


