Abstract
Hydrogen has the physical and chemical characteristics of being flammable, explosive and prone to leakage, and its safety is the main issue faced by the promotion of hydrogen as an energy source. The most common scene in vehicle application is the longitudinal wind generated by driving, and the original position of hydrogen concentration sensors (HCSs) did not consider the influence of longitudinal wind on the hydrogen leakage trajectory. In this paper, the computational fluid dynamics (CFD) software STAR CCM 2021.1 is used to simulate the hydrogen leakage and diffusion trajectories of fuel cell vehicles (FCVs) at five different leakage locations the longitudinal wind speeds of 0 km/h, 37.18 km/h and 114 km/h, and it is concluded that longitudinal wind prolongs the diffusion time of hydrogen to the headspace and reduces the coverage area of hydrogen in the headspace with a decrease of 81.35%. In order to achieve a good detection effect of fuel cell vehicles within the longitudinal wind scene, based on the simulated hydrogen concentration–time matrix, the scene clustering method based on vector similarity evaluation was used to reduce the leakage scene set by 33%. Then, the layout position of HCSs was optimized according to the proposed multi-scene full coverage response time minimization model, and the response time was reduced from 5 s to 1 s.
1. Introduction
Against the background of the increasingly severe global energy crisis and environmental pollution, hydrogen energy, as a renewable and clean energy source, is regarded as one of high-quality alternatives to fossil fuels, and has attracted widespread attention from various countries and regions [1,2]. Hydrogen, as a storable energy source, can not only help solve the above problems, but also alleviates the problem of uneven spatial and temporal distribution of new energy [3,4]. However, due to the smaller molecular size of hydrogen, it is easy to leak through tiny pores during storage and transportation [5,6]. When the concentration of hydrogen in the air exceeds 4%, it is easy to burn or explode when it meets a fire source [7,8]. The safety of hydrogen use is the main issue faced by the promotion of hydrogen as an energy source [9].
As one of the main application scenes of hydrogen, the protection and monitoring of hydrogen leakage in FCVs have always been the focus of research [10]. In order to explore the influence of environmental factors on hydrogen leakage, researchers have carried out a lot of relevant explorations. Mo et al. [11] studied the diffusion of hydrogen released in a large underground garage with a complex ventilation system. They used a two-stage CFD method and found that the flow trajectory of hydrogen is related to the flow rate, providing a reference for predicting the actual diffusion trajectory of hydrogen leakage in a complex flow field environment. Gu et al. [12] studied the combustion characteristics of hydrogen jet flames in tunnels and simulated hydrogen jet flames using CFD. They found that ventilation in tunnels (longitudinal and transverse) significantly inhibits tunnel temperature raise and hydrogen accumulation in tunnel hydrogen jet fire accidents. Wang et al. [13] studied the volume changes of the flammable area after double-clamp joint leaks, verified the established CFD model through the schlieren method, and applied the calibrated CFD model to pipeline joint leaks. They demonstrated that when the environmental wind speed increased from 0 m/s to 1.5 m/s, the volume of leaked hydrogen combustibles decreased by 85%. When the wind speed exceeded 1.5 m/s, the decrease in the volume of combustibles was not significant, indicating that forced convection environment can change the combustible volume produced by hydrogen leakage. Previous studies have found that ambient wind has a vital influence on hydrogen diffusion, but its research scenes mainly focus on semi-ventilated environments [14] or enclosed spaces [15,16] such as hydrogen refueling stations [17,18] and parking lots [19,20]; the influence of longitudinal wind on hydrogen leakage during the driving of FCVs has not been studied.
In existing hydrogen leakage detection methods of FCVs, the HCS is an unavailable link [21,22]. However, the effect of a hydrogen concentration diagnosis strategy based on HCSs is easily affected by the number and location of the installed sensors [23]. Considering that hydrogen is easy to accumulate at the top of the space under buoyancy [24], the current installation position of HCSs in FCVs is generally installed at high points in space [25]. However, the influence of longitudinal wind on the hydrogen leakage trajectory and accumulation of FCVs may delay the warning time of hydrogen leakage by HCSs, so it is necessary to optimize the layout of HCSs considering the hydrogen leakage scene of longitudinal wind.
In this study, the CFD simulation software STAR CCM 2021.1 was used to simulate hydrogen leakage in FCVs under longitudinal wind scenes, considering the influence of longitudinal wind speed and leakage position. The concentration–time-change matrix of hydrogen in the fuel cell compartment (FCC) and hydrogen storage tank compartment (HSTC) was obtained, and clustering was used to remove duplicate leakage trajectories and optimize the position of HCSs. The main contributions of this study are as follows:
- (1)
- By studying the simulation results of hydrogen leakage under different longitudinal wind speeds and leakage locations, the influence of longitudinal wind on hydrogen leakage and diffusion is found.
- (2)
- A scene clustering method based on vector similarity evaluation is proposed, which eliminates duplicate leakage trajectories and reduces the computational complexity of subsequent sensor position optimization.
- (3)
- Regarding the optimization of the HCS position for FCVs under the longitudinal wind scene, a multi-scene full coverage response time minimization model is proposed.
The rest of this paper is organized as follows: Section 2 describes the hydrogen leakage model and parameter settings under longitudinal wind scenes; Section 3 analyzes the concentration–time-change of hydrogen leakage under longitudinal wind scenes via simulation; Section 4 optimizes the layout of HCSs through the clustering of simulation results; and Section 5 draws conclusions.
2. Hydrogen Leakage Model and Parameter Settings
2.1. Problem Description
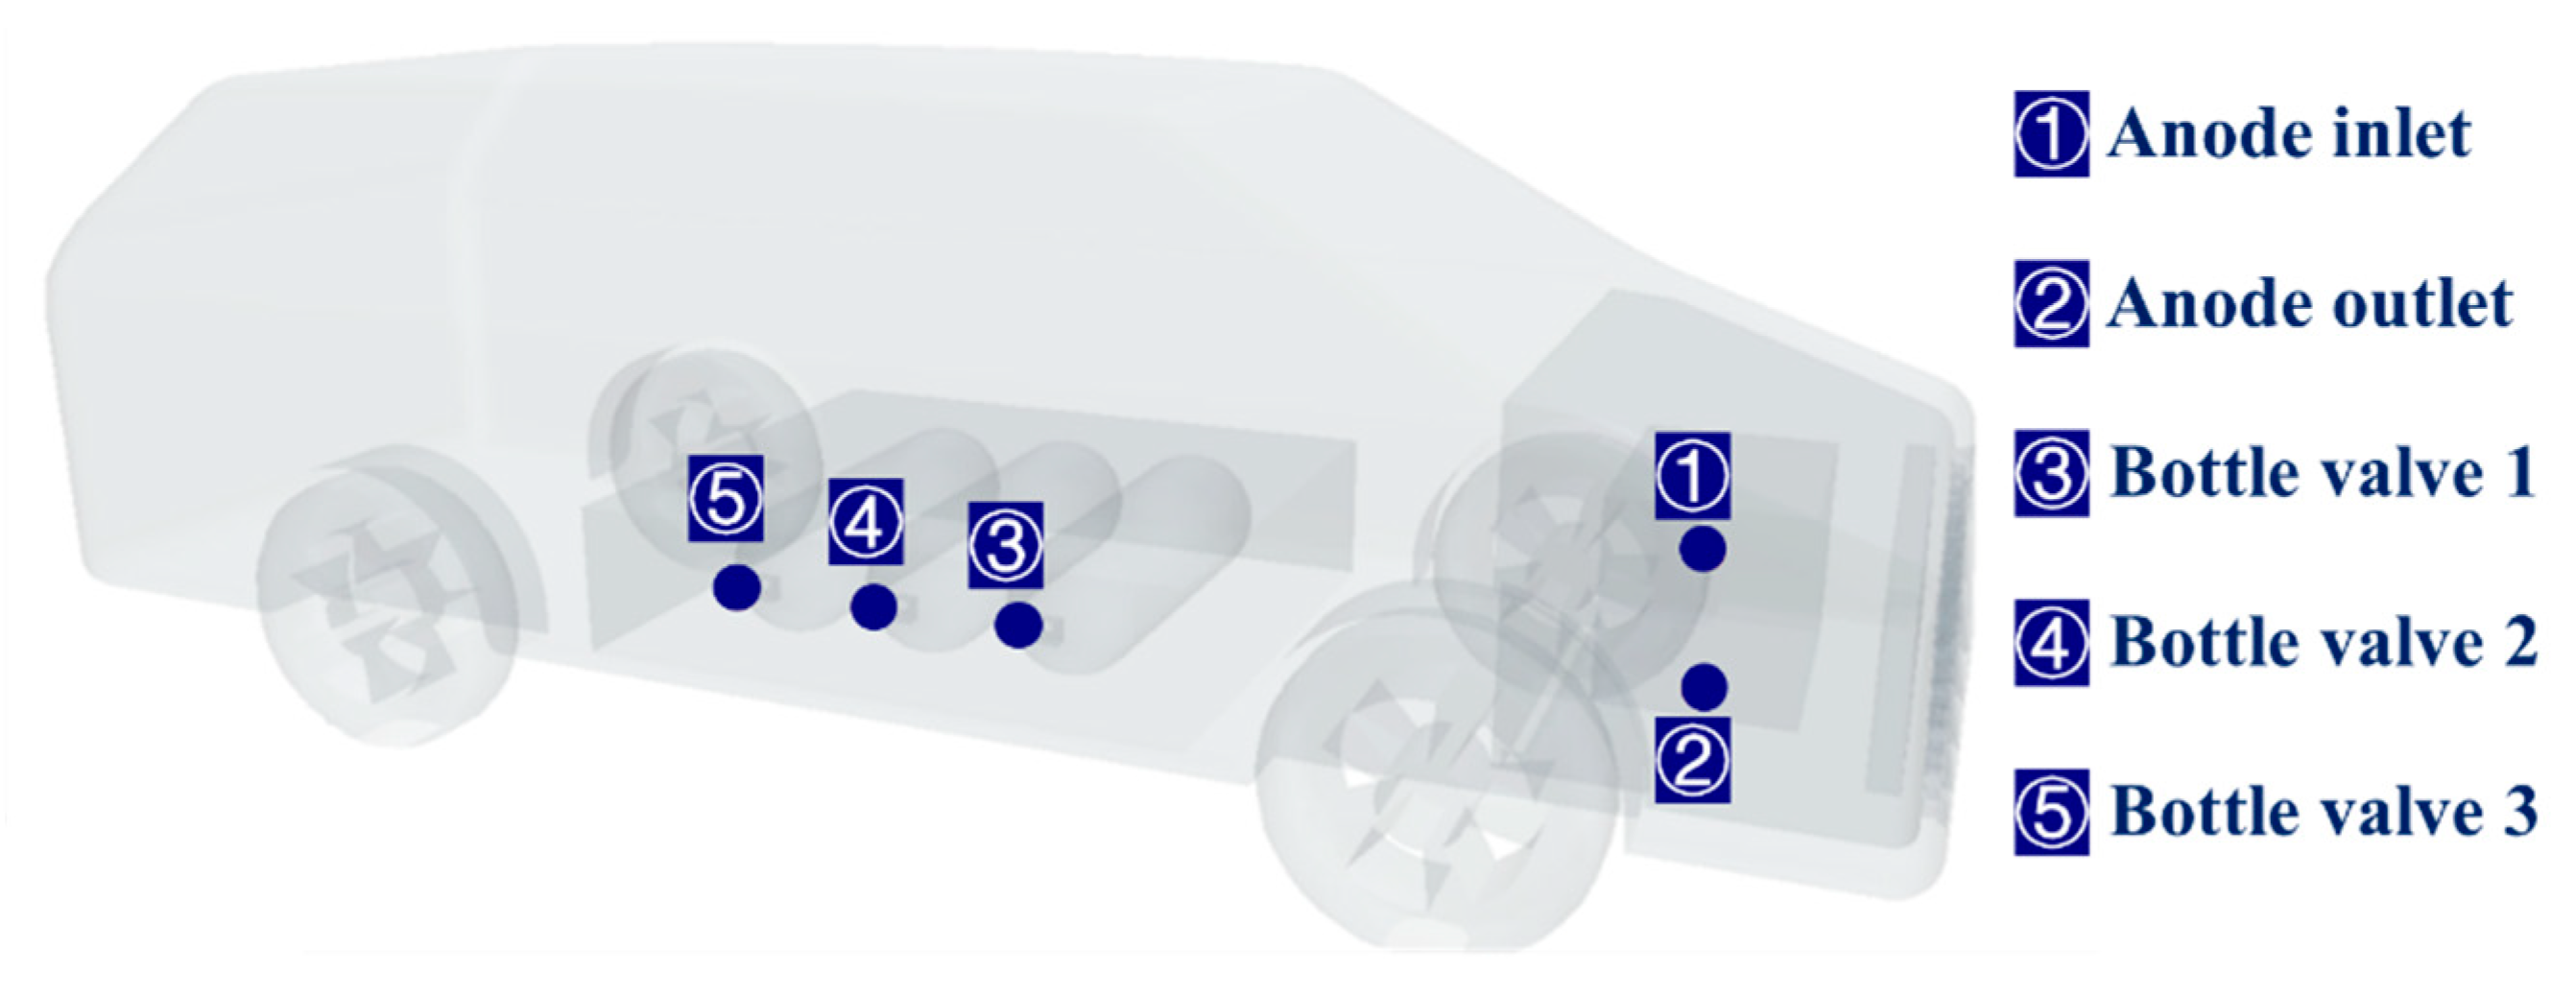
In this paper, the hydrogen leakage and diffusion of FCVs are simulated. In reality, longitudinal wind usually dominates the driving, so it is assumed that all the driving is longitudinal wind, and the direction is that the front of the vehicle points to the rear of the vehicle. The simplified FCV model is adopted in the three-dimensional model, as shown in Figure 1, where the fuel cell stack is located at the front of the vehicle and the hydrogen tank is placed between the front and rear axles. The FCV is 5225 mm long, 1980 mm wide and 1938 mm high. Previous studies have found that the common leakage positions in FCVs are mainly concentrated at the interface of the pipeline [26]. Therefore, the leakage positions selected in this study are the anode inlet and outlet of the fuel cell stack, as well as the bottle valves of hydrogen tanks 1, 2 and 3. The longitudinal wind speed during the FCV operation is selected as the lowest vehicle speed of 0 km/h, the average running speed of 37.18 km/h, and the maximum speed of 114 km/h according to the CLTC-P driving cycle.
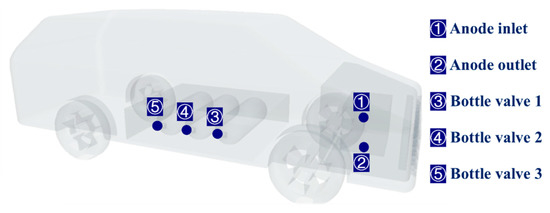
Figure 1.
FCV model and leakage position.
2.2. Simulation Settings and Boundary Conditions
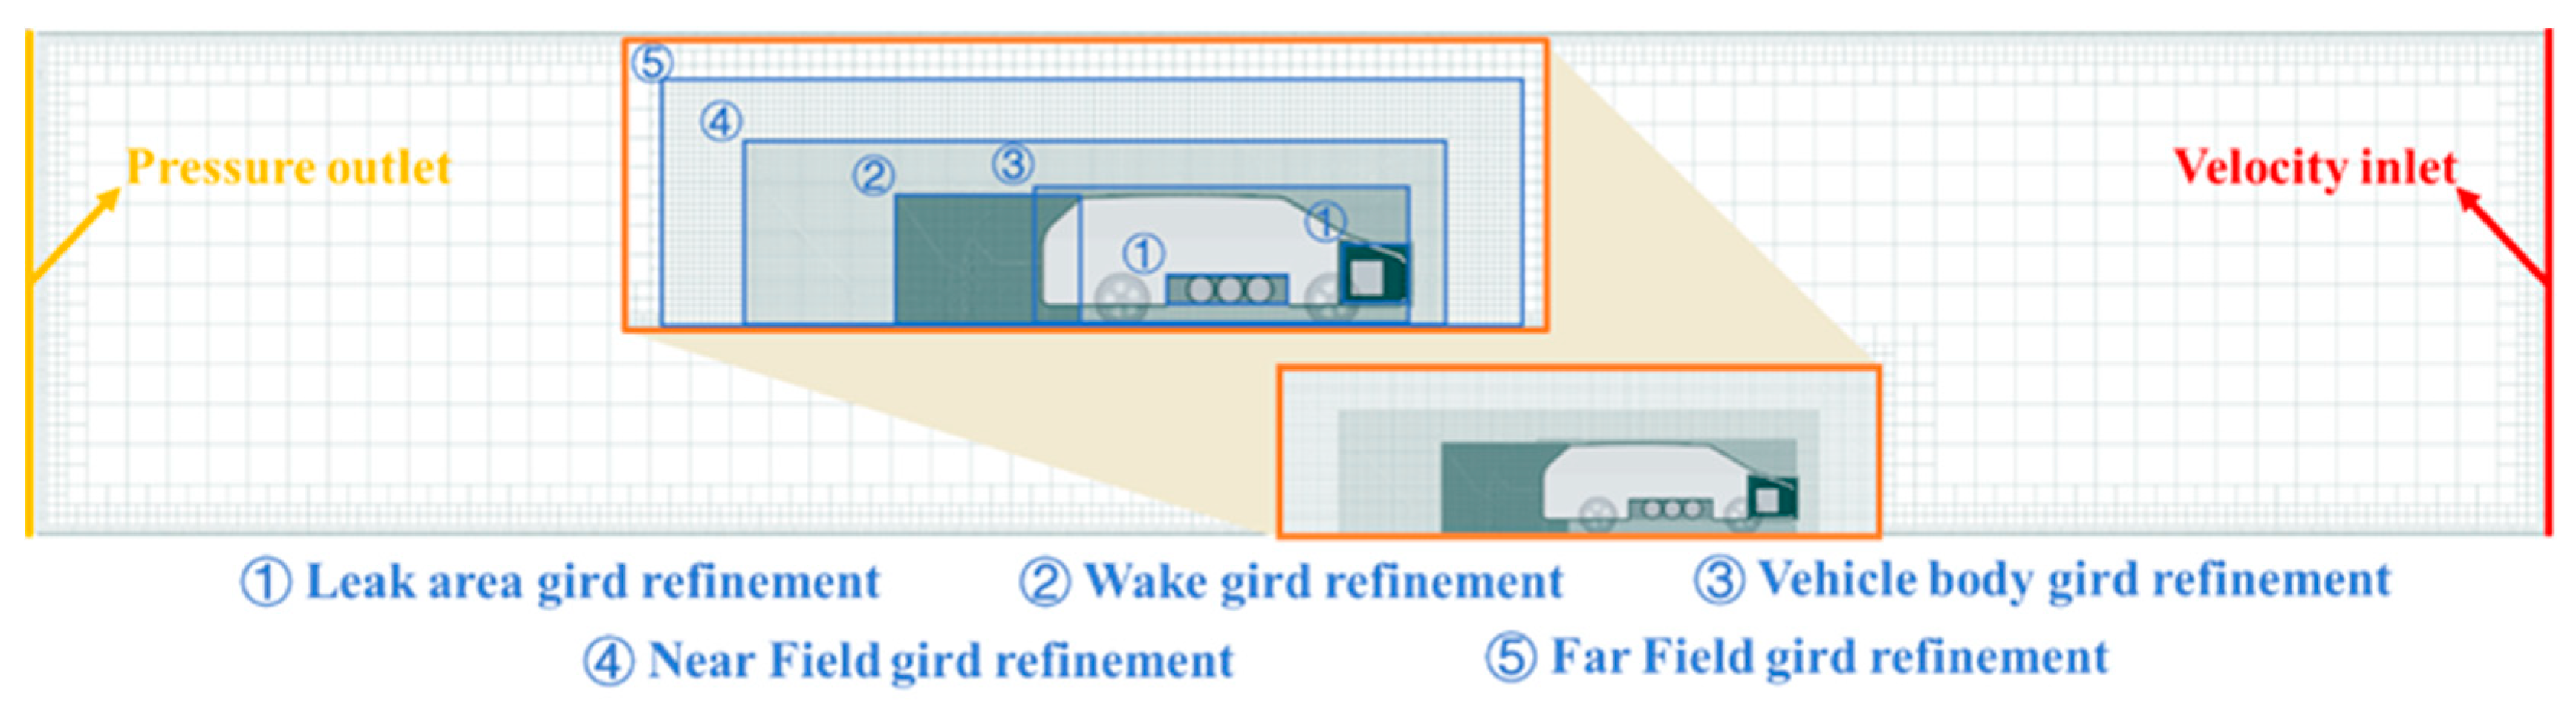
Due to the highly complex geometry of vehicles, small gaps between internal components in the FCC or the connection between tires and the ground can often result in grids with large aspect ratios and high distortion. Low-quality grids can cause the CFD solver to diverge or produce inaccurate results. Adopting a global grid refinement strategy would lead to a dramatic increase in the total number of grids and CPU computation time. Therefore, increasing the number of grids in the required regions appropriately can achieve accurate solutions with appropriate computational time. Grid refinement was performed in areas such as the FCC, HSTC and rear of the vehicle to improve the computational accuracy, as shown in Figure 2.
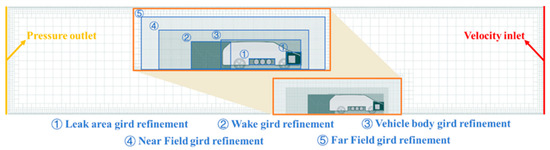
Figure 2.
Grid division and boundary types.
The longitudinal wind space outside the vehicle is 50 m in length, 10 m in height and 10 m in width, with a blockage ratio of approximately 2.67%, which meets the simulation requirements (less than 5%). The FCV is placed 15 m behind the longitudinal wind inlet. The gravity acceleration was set in the negative Z direction to simulate the effects of buoyancy on hydrogen diffusion. The longitudinal wind inlet boundary was set as a velocity inlet, and the outlet boundary was set as a pressure outlet. The tire was set to rotate locally, and the rotation speed was calculated based on the relationship between the vehicle speed and tire rotation speed selected for the simulation. The leakage positions are selected as the mass flow inlet. In reference [27], the leakage rate of the hydrogen leakage experiment at 82 MPa at an ambient temperature was 1.19 g/s, which was converted into the leakage rate at 70 MPa pressure as the boundary condition of simulation, and the leakage rate was about 1 g/s. The steady-state calculation of the longitudinal wind was performed first during the simulation, and then a transient calculation was performed by setting the hydrogen gas leak after the steady-state calculation had converged.
3. Concentration Distribution Simulation
3.1. Simulation Verification
In this paper, previous experiments are simulated using CFD software STAR CCM 2021.1, and the simulation results are compared with the experimental results, which verifies that the CFD simulation software STAR CCM 2021.1 and simulation settings selected in this paper can effectively simulate the diffusion of hydrogen leakage. The experiment of hydrogen leakage in the garage under natural ventilation in [28] gives more detailed experimental parameters and conclusions, and the experimental arrangement is shown in Table 1.

Table 1.
Experimental setup.
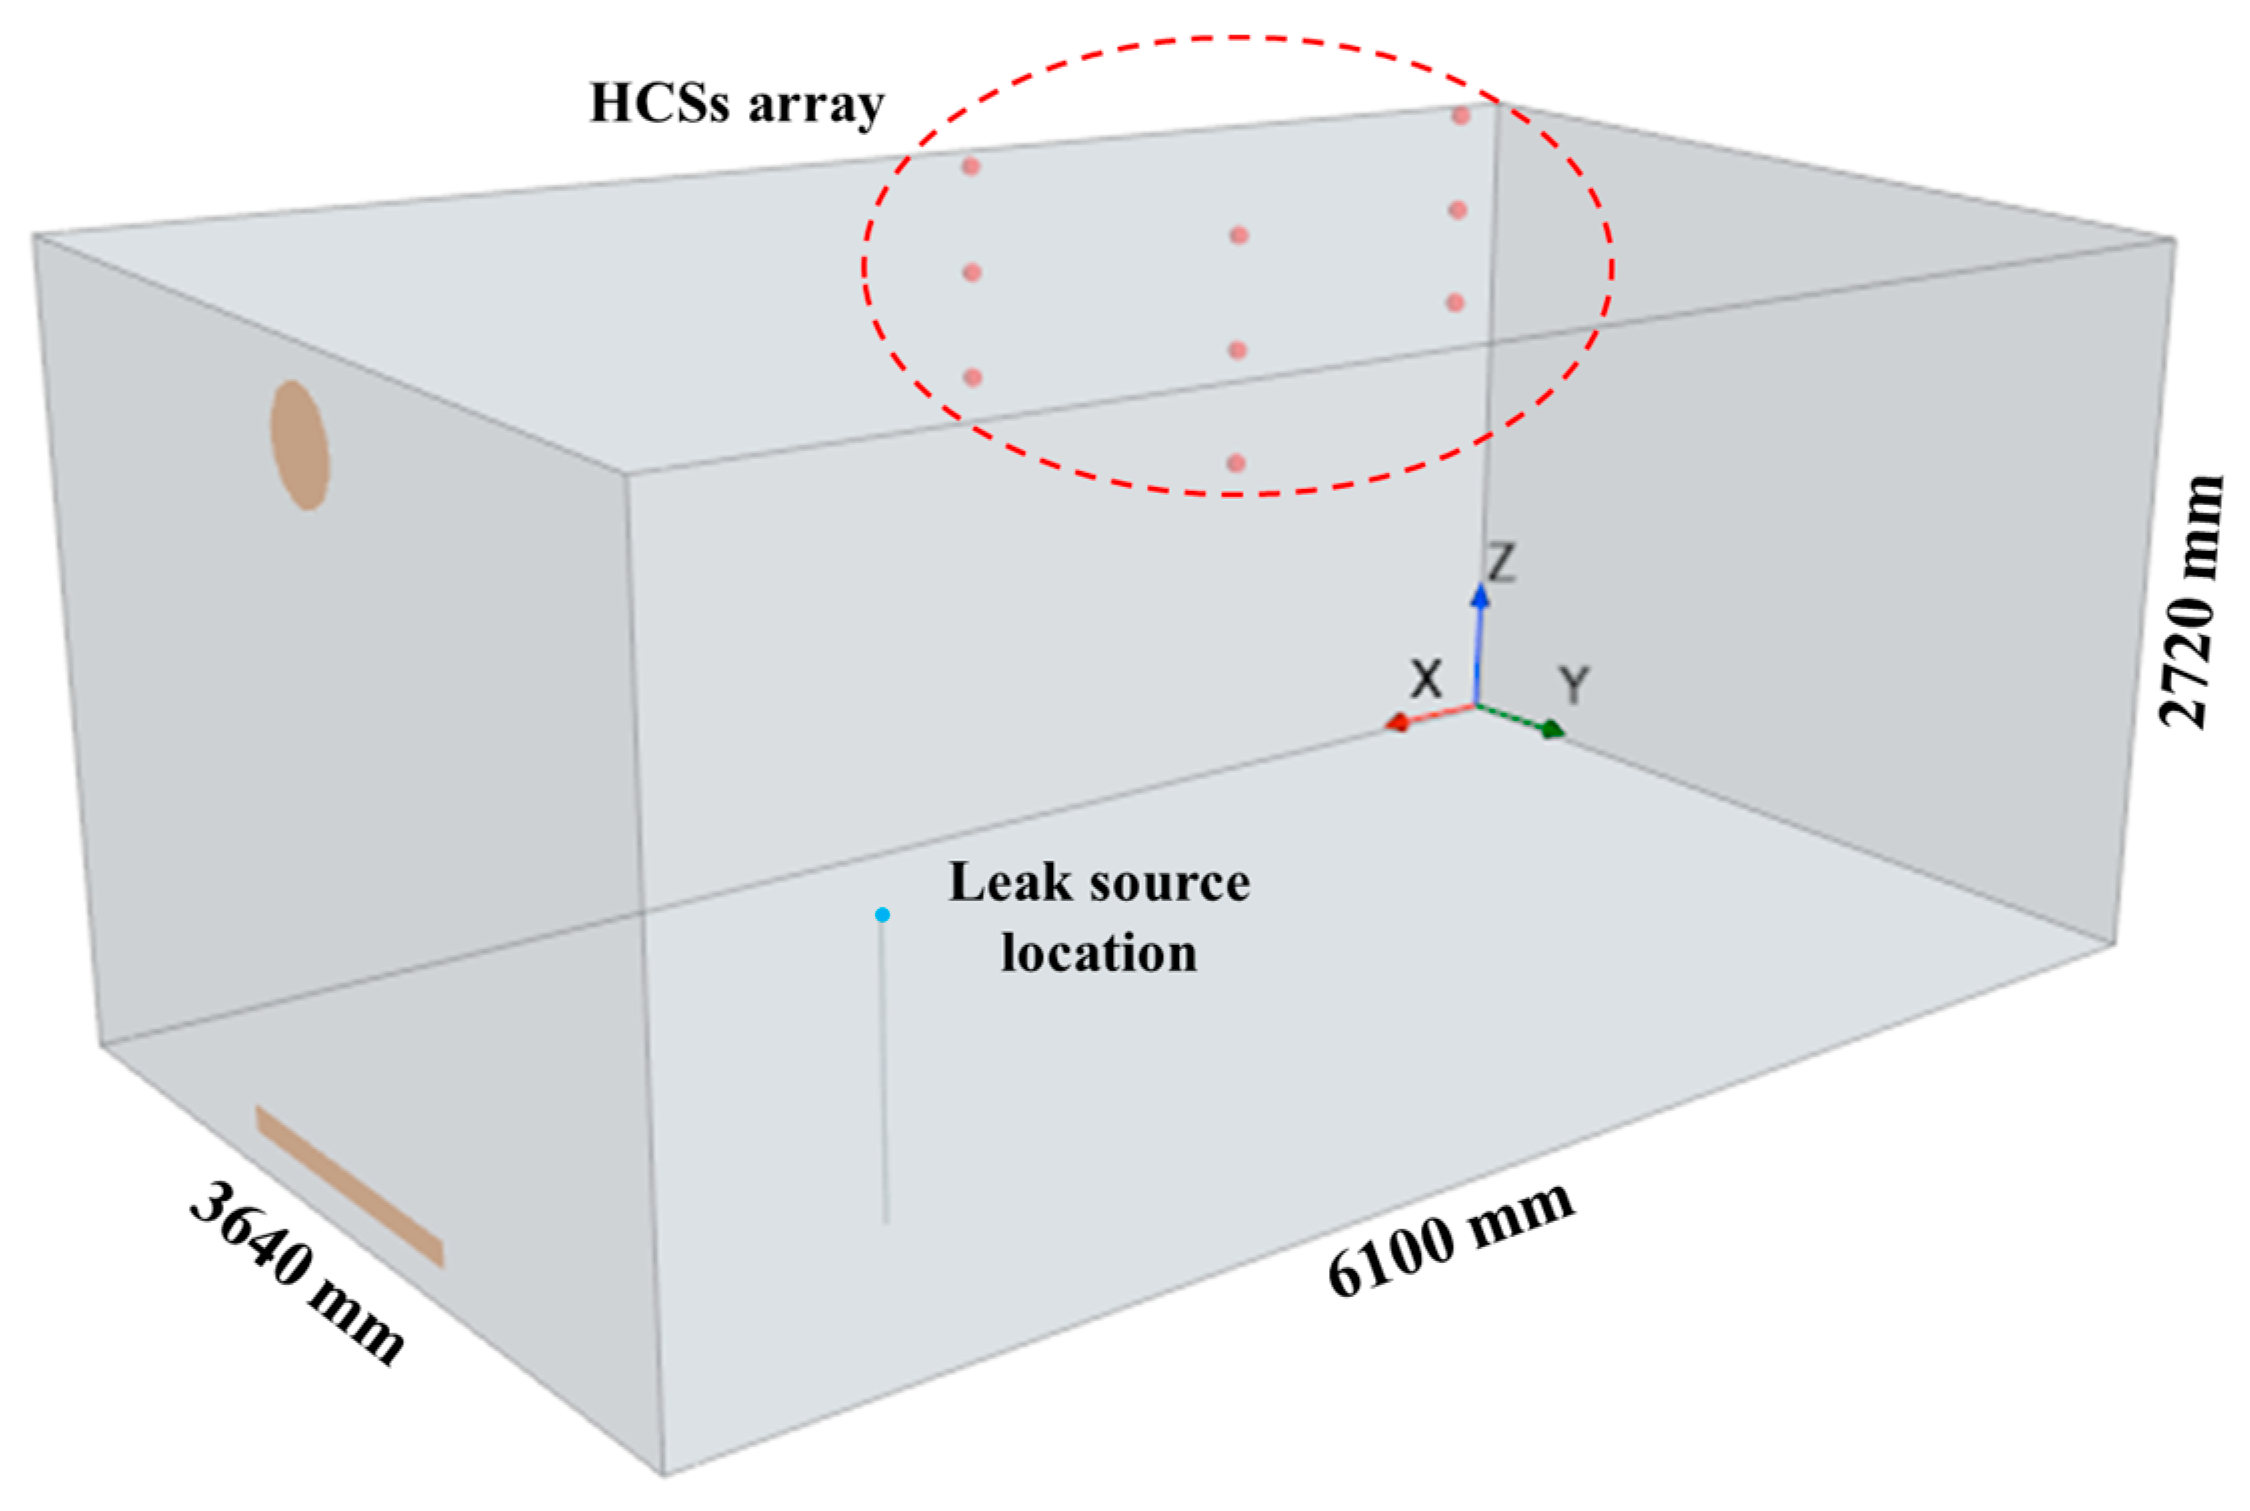
The experimental scene is reproduced using the CFD software STAR CCM 2021.1, and the boundary conditions are adjusted according to its experimental settings. The simulated three-dimensional model is shown in Figure 3.
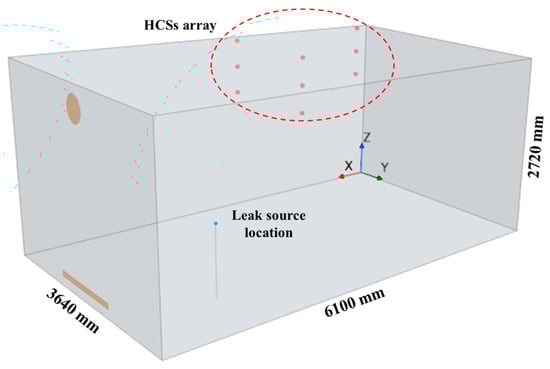
Figure 3.
Experimental scene simulation.
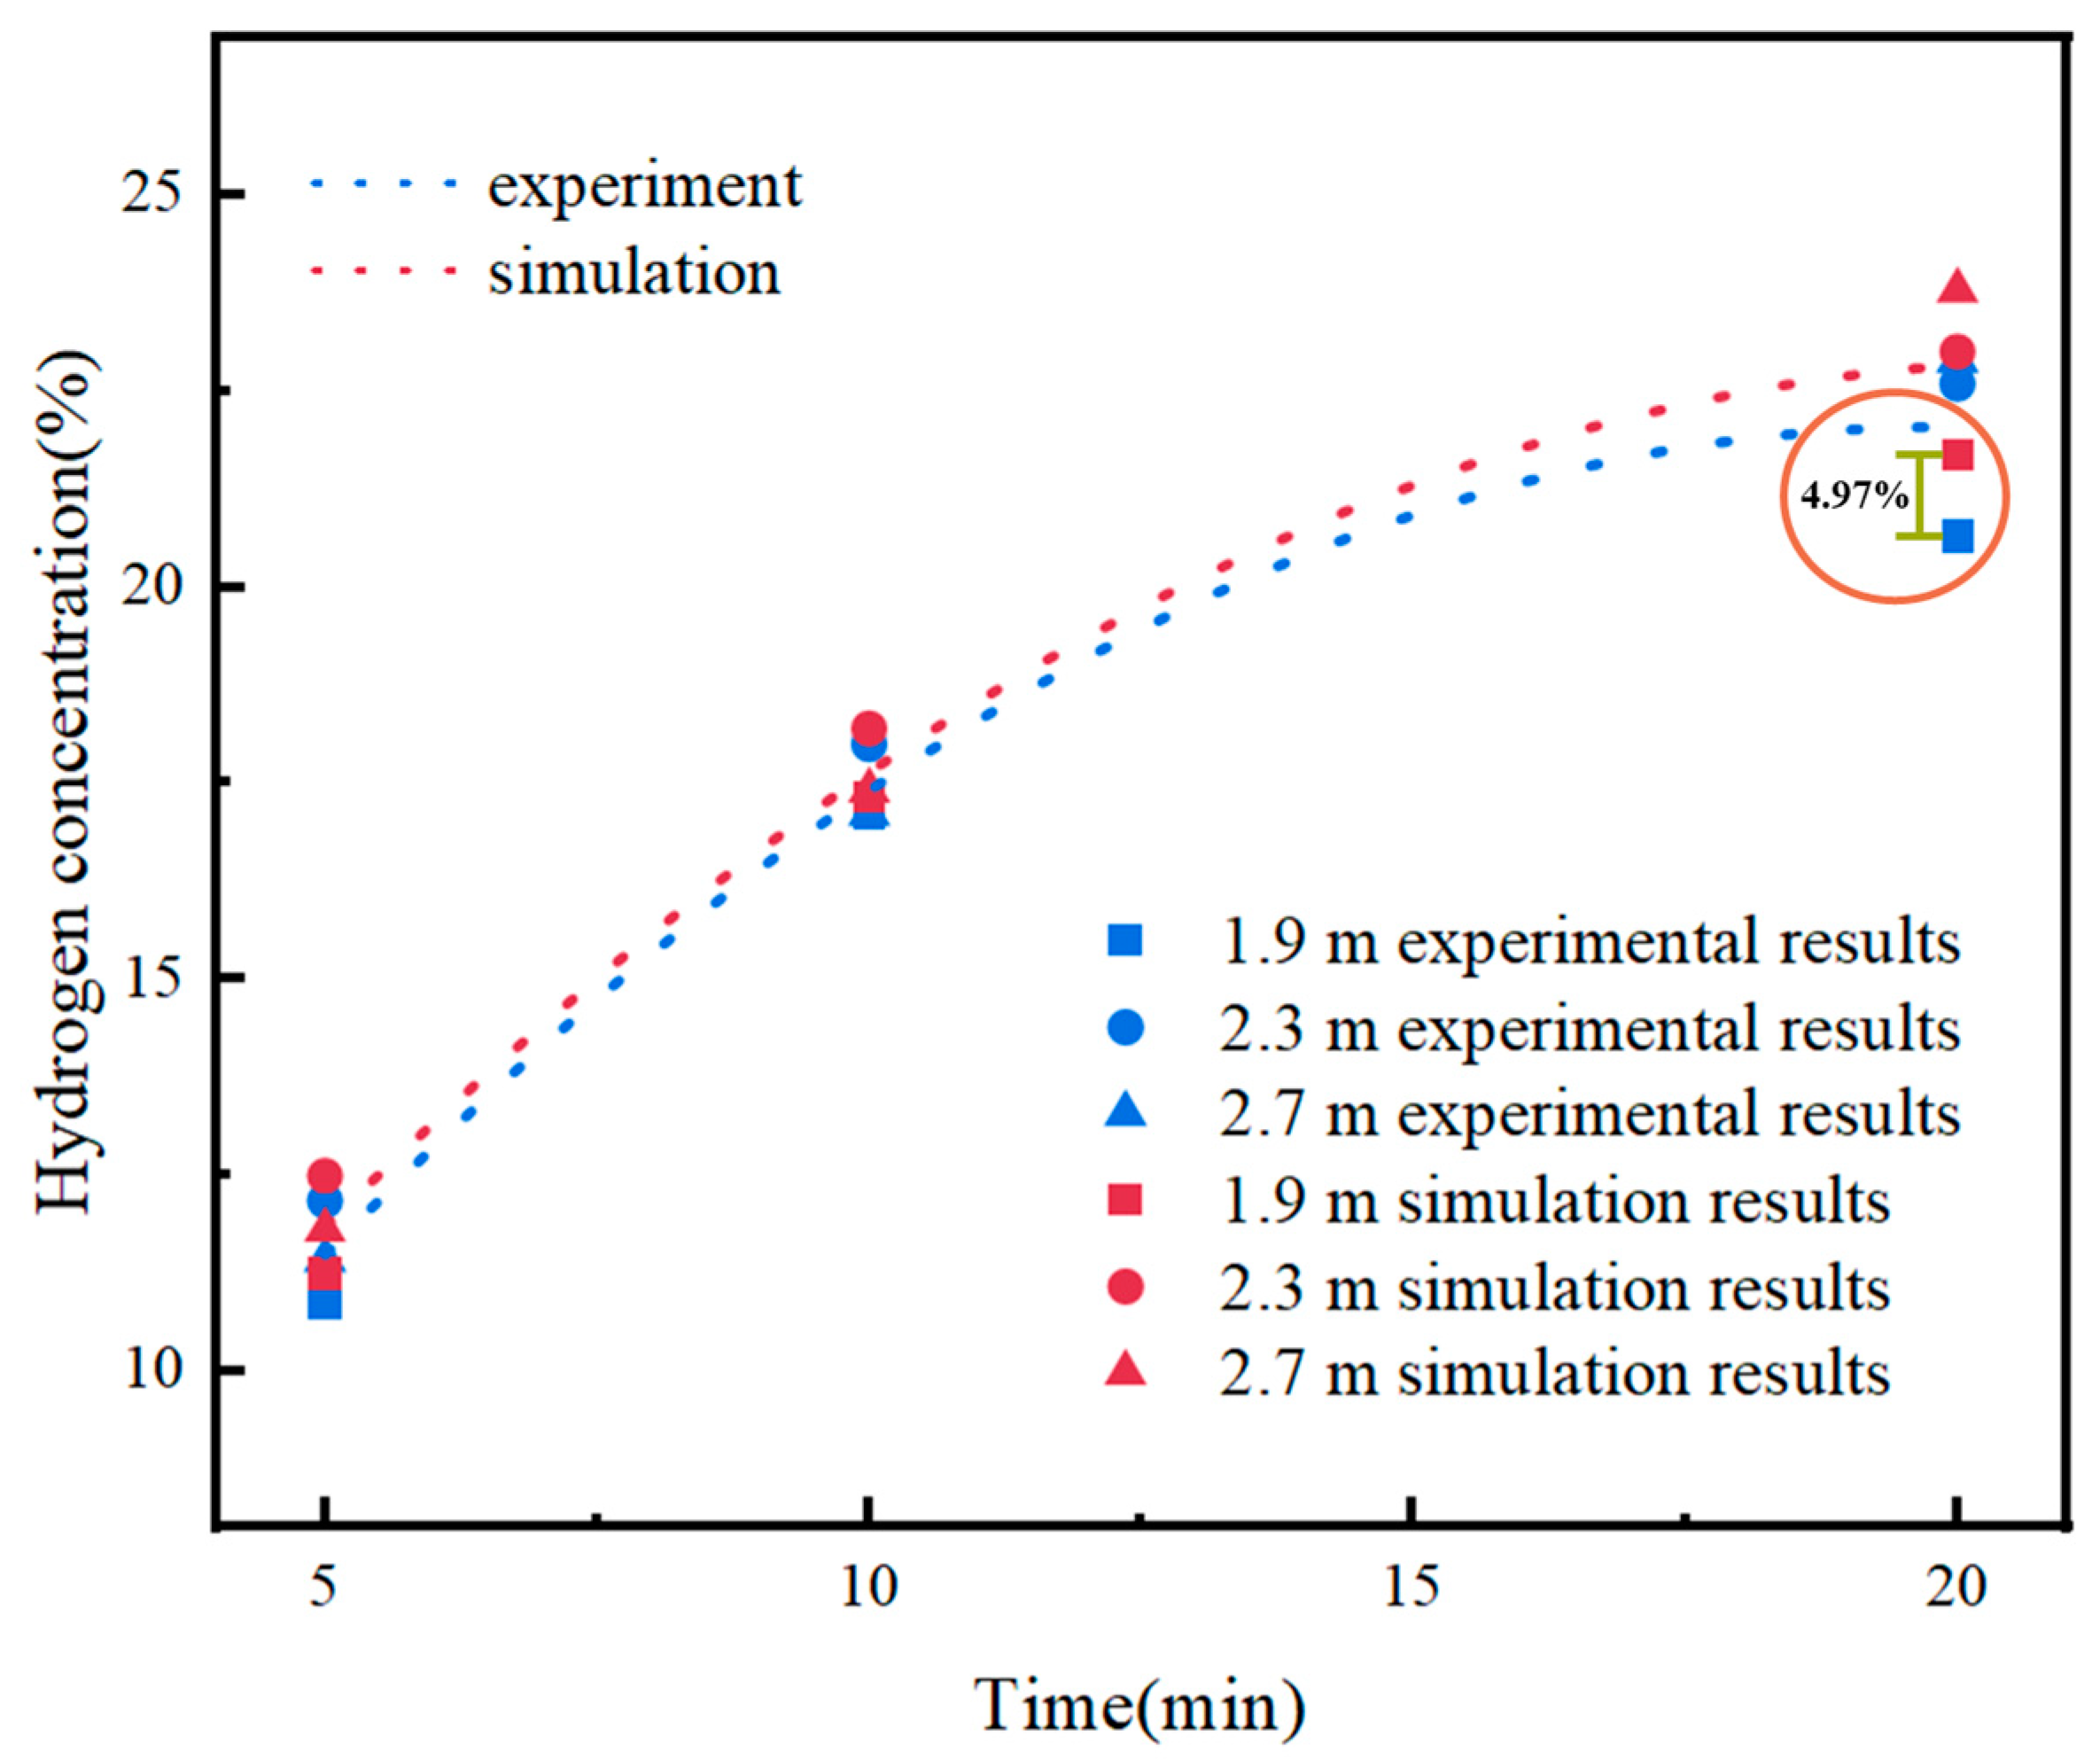
The physical model of the simulation and the choice of solver are consistent with the simulation in the longitudinal wind scene. In [28], the sensors with the same height were averaged, and the concentration values of three heights at different time nodes were obtained. Taking the same position in the simulation, comparing the difference of other experimental results, the maximum concentration error is 4.97%, as shown in Figure 4, which proves that the CFD simulation software STAR CCM 2021.1 and simulation settings selected in this paper can effectively simulate the diffusion of hydrogen leakage. Before the formal simulation of the longitudinal wind scene, the grid independence verification and time step independence verification are carried out, which further proves the reliability of the simulation results.
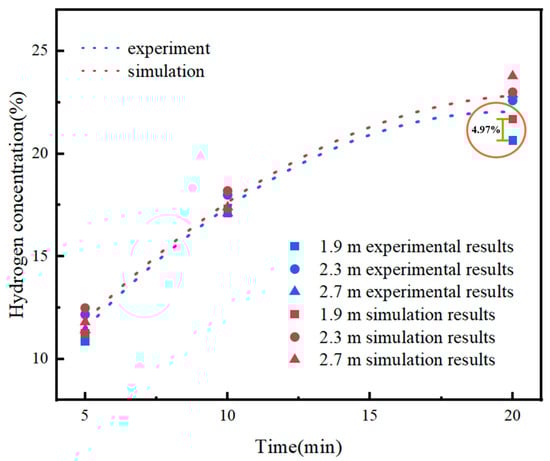
Figure 4.
Comparison between simulation results and experimental results.
3.2. Simulation Result Analysis
During hydrogen leakage, hydrogen is affected by both buoyancy and the initial momentum. The hydrogen leakage process is divided into near-field jetting and far-field diffusion. At the beginning of the hydrogen leakage, momentum dominates, and hydrogen primarily diffuses along the normal direction of the leak; subsequently, the hydrogen momentum gradually decays, and buoyancy begins to dominate, at which point the diffusion direction of hydrogen changes to vertically upward.
The simulation result of hydrogen leakage under windless conditions is shown in Figure 5, in which Figure 5a is the simulation result of hydrogen leakage at the anode inlet, Figure 5b is the simulation result of hydrogen leakage at the anode outlet, Figure 5c is the simulation result of hydrogen leakage at the valve of the first bottle of the hydrogen storage tank, Figure 5d is the simulation result of hydrogen leakage at the valve of the second bottle of the hydrogen storage tank and Figure 5e is the simulation result of hydrogen leakage at the valve of the third bottle of the hydrogen storage tank. In FCC, when hydrogen leaks for 1 s, the leaked hydrogen spreads to the top space of the fuel cell compartment, and some hydrogen leaks from the front grille of the vehicle to the outer space of the fuel cell compartment. When hydrogen leaks for 2–5 s, it continuously accumulates at the top of FCC and gradually covers the headspace, and the accumulated hydrogen cloud extends downward, and the hydrogen leaked to the outer space of the fuel cell compartment gradually increases. Comparing the simulation results of hydrogen leakage between Figure 5a,b, it is found that when hydrogen leaks for 1 s, Figure 5b has less hydrogen accumulated at the top of the FCC, and more hydrogen leaks from the front grille of the vehicle to the outer space of the fuel cell compartment. This is because the leakage position of Figure 5b is the anode air outlet, which is located below the anode air inlet of the Figure 5a leakage position, and the distance for hydrogen to diffuse to the top is longer, which takes more time, and the hydrogen is more dispersed in the buoyancy-dominated ascending process. In HSTC, the diffusion trends of leaked hydrogen in Figure 5c–e are the same, because the leaking ports are all in the rear direction. The leaked hydrogen first accumulates at the tail of the HSTC, and then gradually spreads forward, until it covers the whole HSTC. The final simulated concentration distributions of the leaked hydrogen in Figure 5c–e are different: in Figure 5c, the leaked hydrogen is most evenly distributed in the headspace of the HSTC, because the leaked hydrogen at the valve of the three bottles of the hydrogen storage tank initially hits the tail wall of the HSTC and spreads around more evenly. In Figure 5c,d, because the leakage point is far away from the tail wall of the HSTC, the kinetic energy is low during impact, the diffusion range after impact is smaller, and the hydrogen concentration distribution in the right front of the HSTC is low.
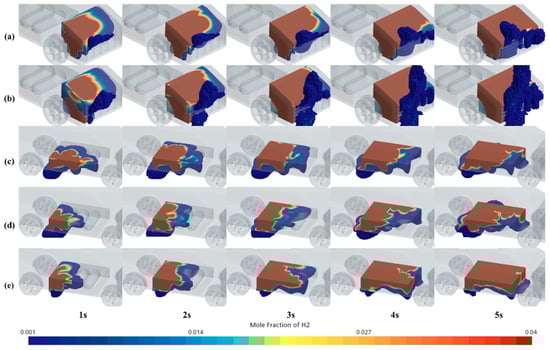
Figure 5.
Cloud chart of hydrogen leakage without longitudinal wind (a) anode air inlet (b) anode air outlet (c) bottle valve 1 (d) bottle valve 2 (e) bottle valve 3.
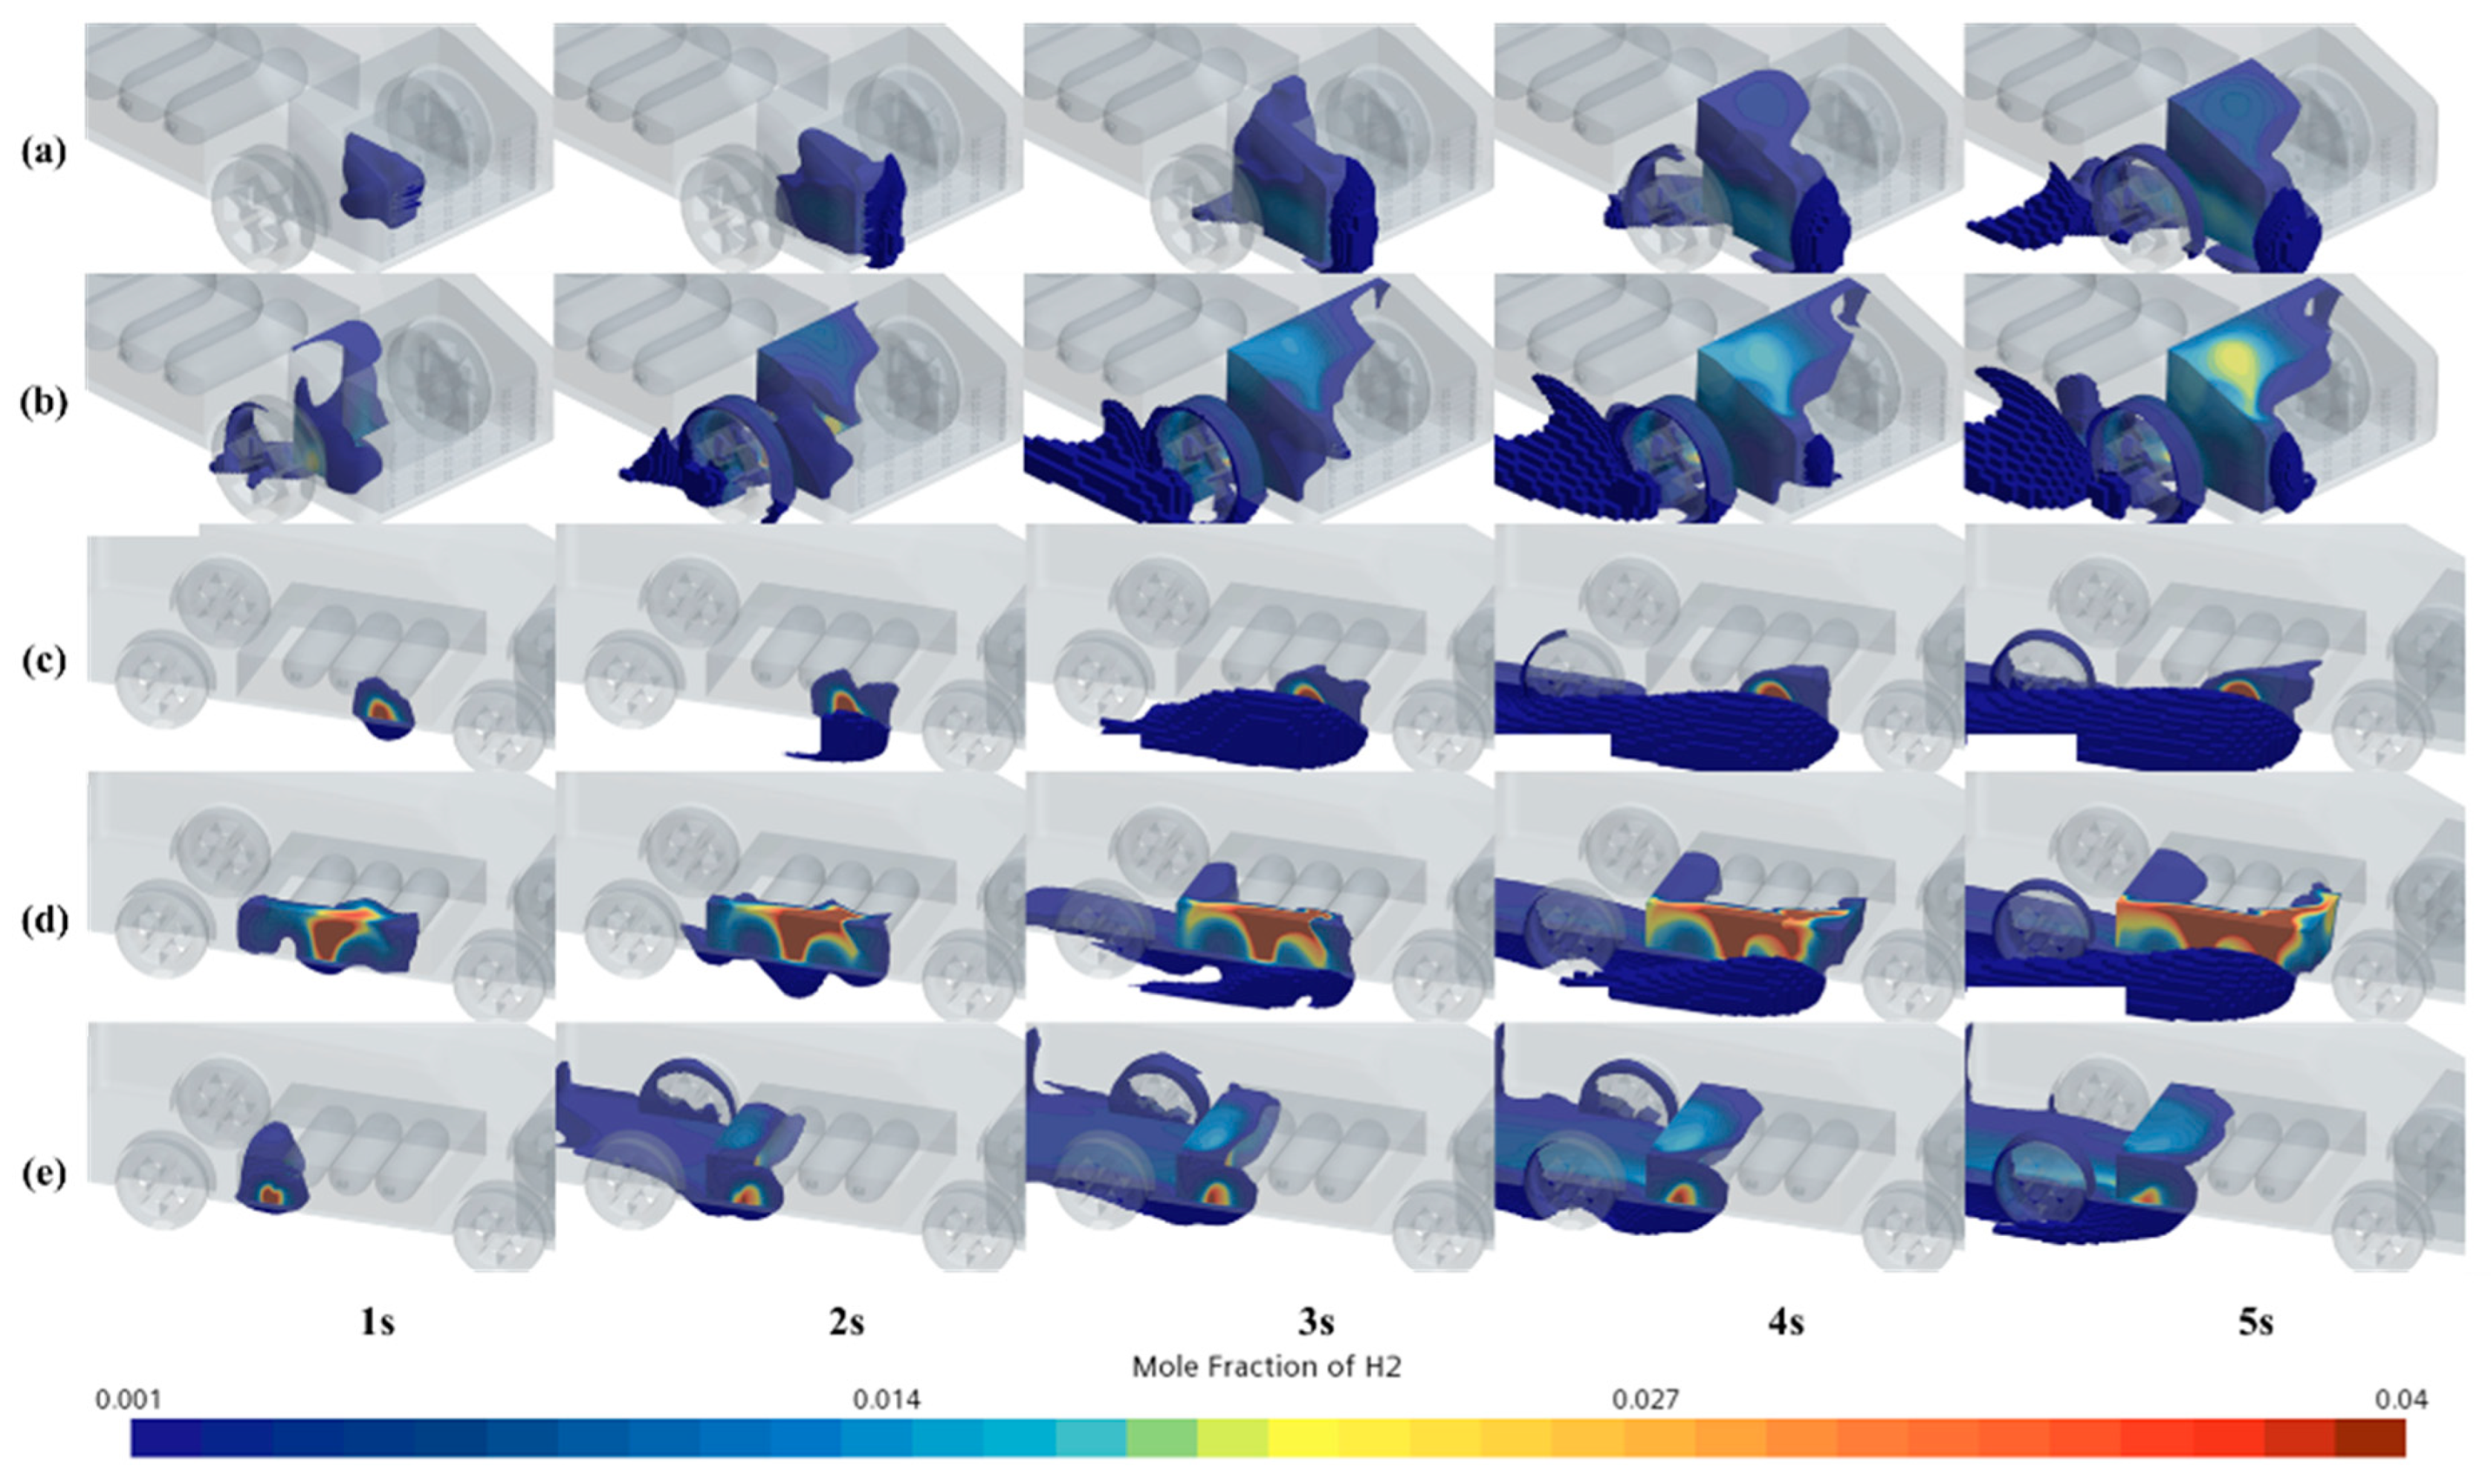
When the longitudinal win d speed is 37.18 km/h, the simulation result of hydrogen leakage is shown in Figure 6. Compared with the leakage in the windless state, at the longitudinal wind speed of 37.18 km/h, the way that the leaked hydrogen diffuses to the outer space of FCC increases the gap of the bottom guard plate of FCC on the basis of the front grille of the vehicle, the amount of hydrogen leaked from HSTC increases obviously, and the area covered by the accumulated hydrogen at the top of FCC and HSTC decreases.

Figure 6.
Cloud chart of hydrogen leakage under 37.18 km/h (a) anode air inlet (b) anode air outlet (c) bottle valve 1 (d) bottle valve 2 (e) bottle valve 3.
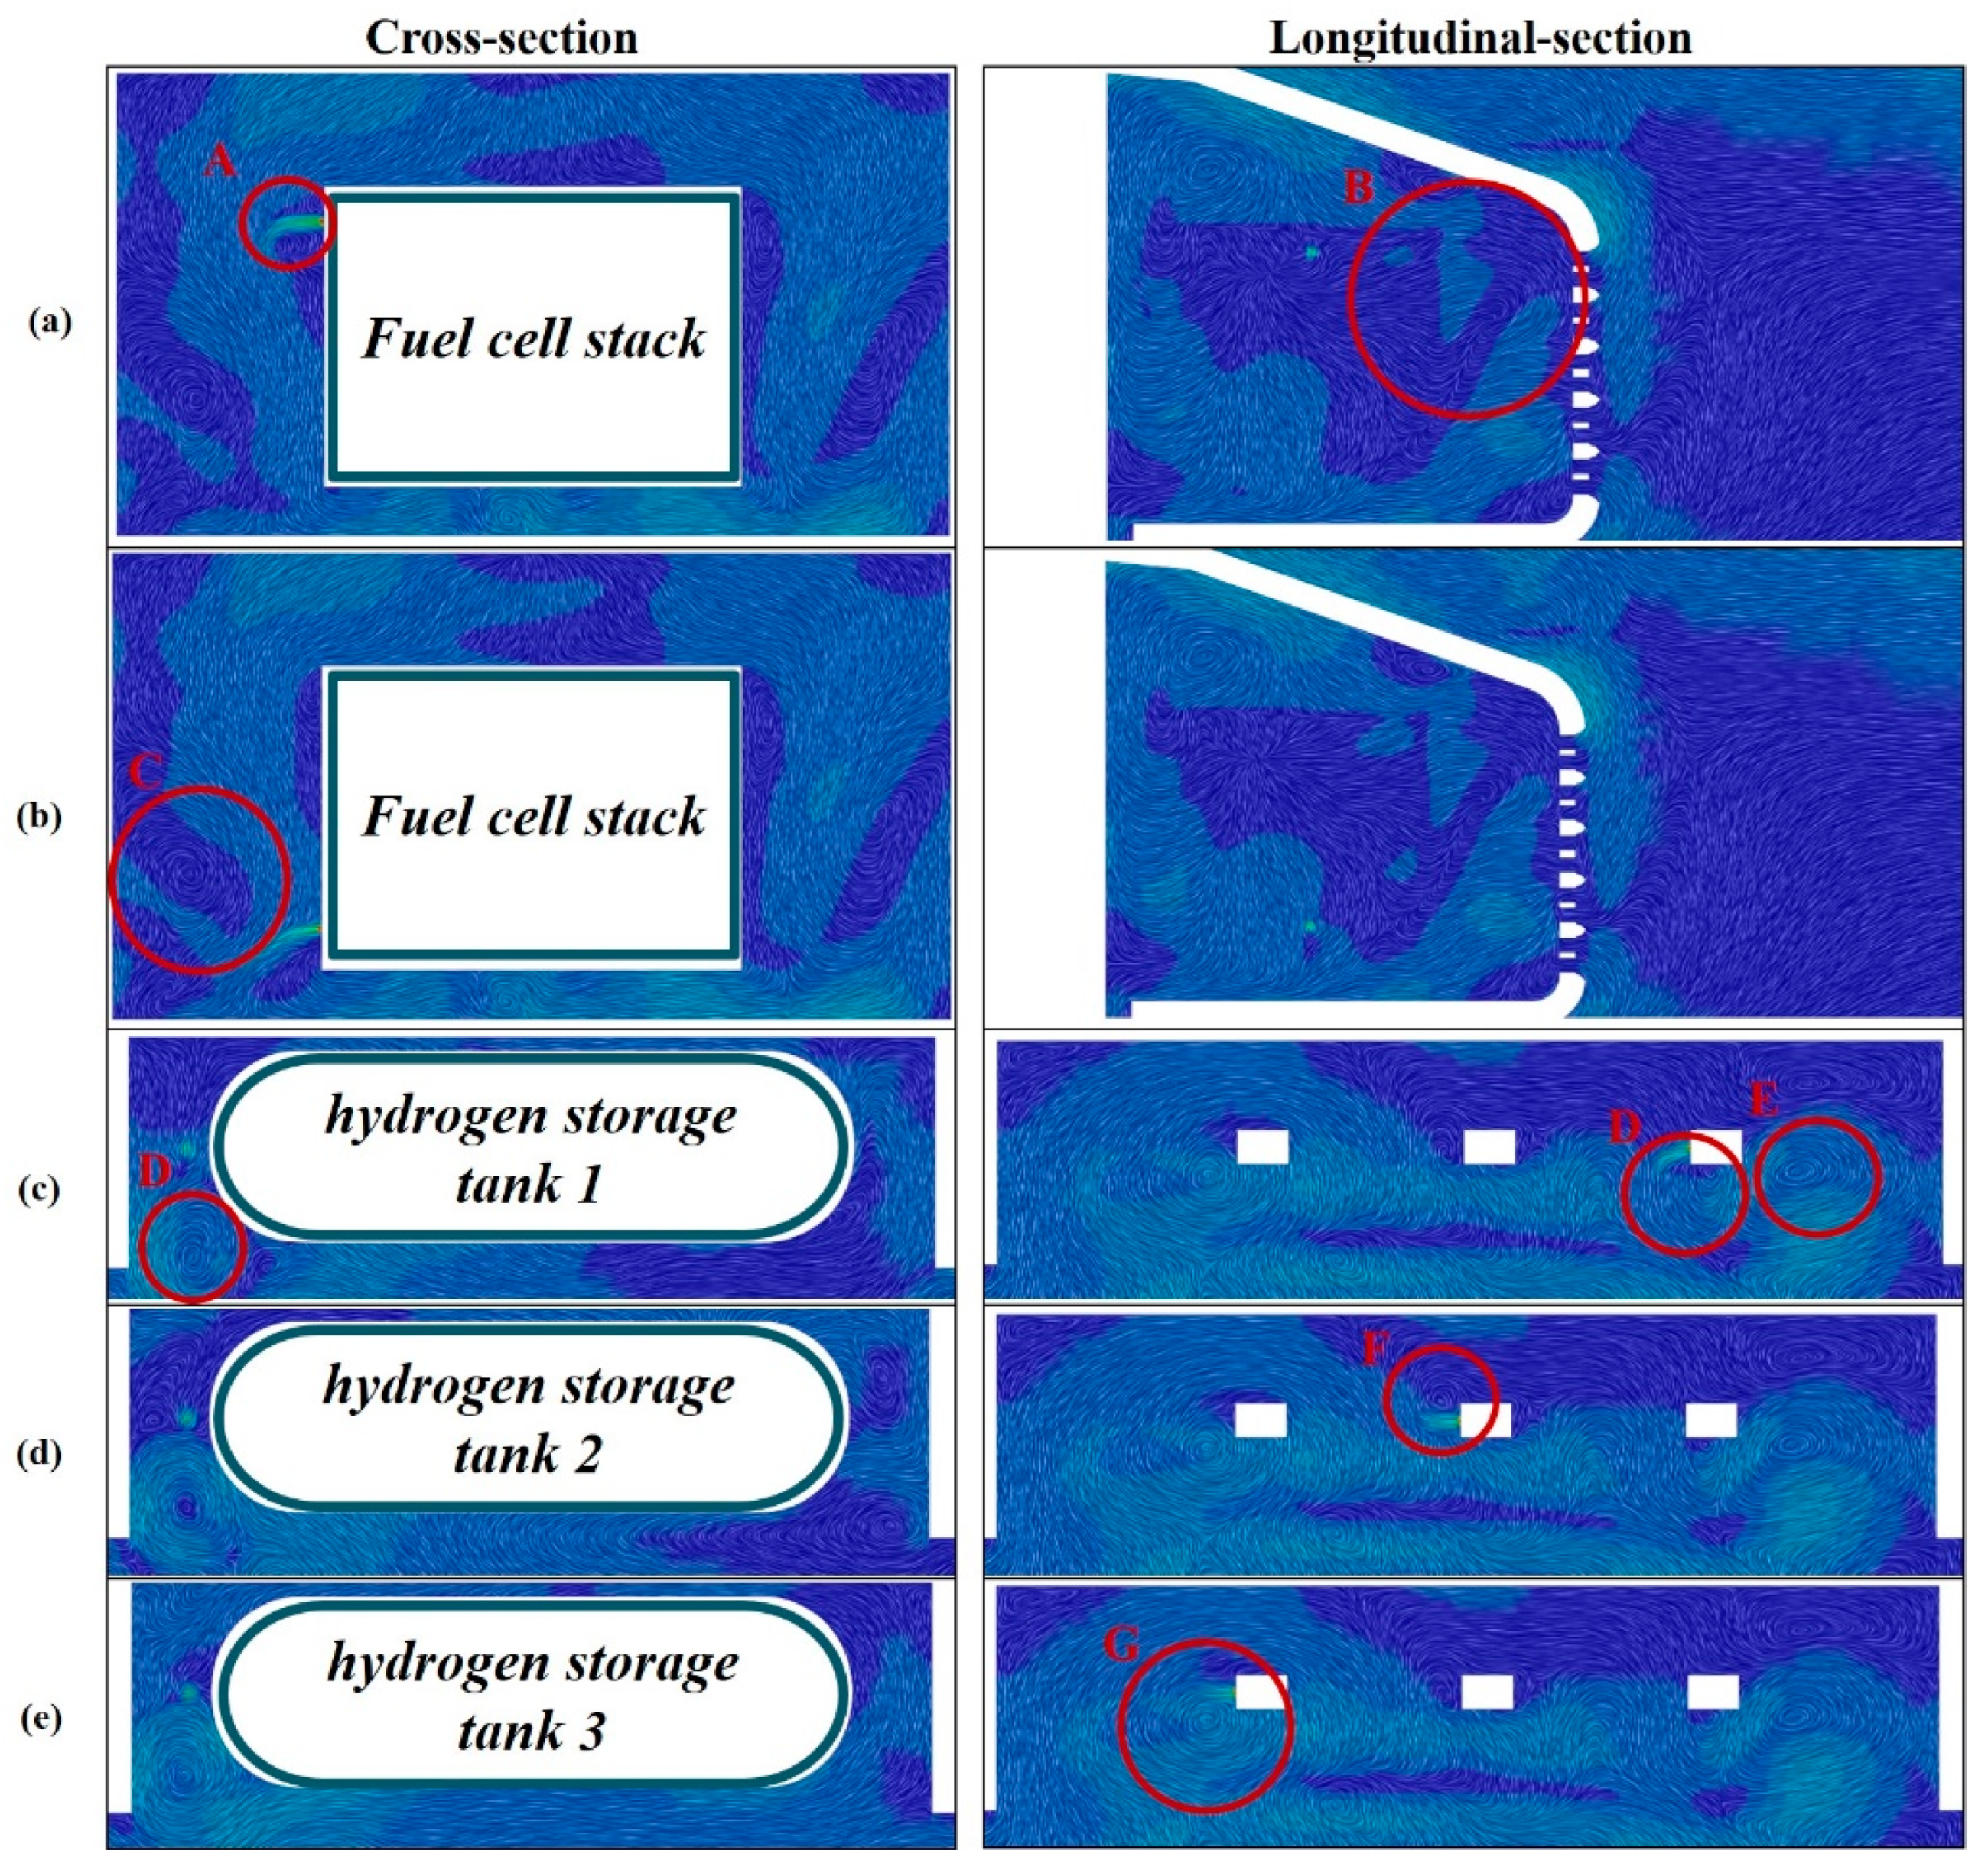
The main reason for the difference is the vortex generated by the longitudinal wind entering the FCC, as shown in Figure 7. In the cross-sectional line integral convolution diagram of Figure 7a, it can be clearly seen that the hydrogen leaked from the anode inlet is limited by the vortex A near the leakage port and accumulates near the leakage port. In the velocity convolution diagram of the longitudinal section, it can be seen that the leaked hydrogen diffuses to the outside of FCC after being influenced by vortex B, accumulates at this vortex, and then is attracted by the vortex generated at the gap of the front grille of the vehicle. In Figure 7b cross-sectional line integral convolution diagram, it is found that the vortex C near the leakage position of the anode outlet is larger, which has a greater impact on the leaked hydrogen. The leaked hydrogen is initially suppressed at the right bottom of FCC due to this vortex. In the velocity convolution diagram of the longitudinal section, it can be seen that the gas flow at the bottom of the battery compartment is relatively smooth. When the leaked hydrogen is suppressed at the bottom of the right side of the FCC under the influence of vortex C, the gas flow quickly spreads along the wall of the FCC and spreads out of the FCC from the gap of the FCC bottom guard plate. In Figure 7c cross-sectional line integral convolution diagram, there is eddy current D below the leakage port, and most of the leaked hydrogen moves downward under the influence of this eddy current until it escapes from the FCC and the ground gap, and only a small amount of hydrogen diffuses upward. It can be found in the vertical section line integral convolution diagram that the leaked hydrogen is accumulated under the influence of eddy current D and then diffused to the front of FCC under the influence of eddy current E. In Figure 7d vertical section line integral convolution diagram, it can be seen that the vortex F above the valve of the second bottle of the hydrogen storage tank gathers the leaked hydrogen, which spreads to the front and back of the HSTC after hitting the top plate of the HSTC. In Figure 7e vertical section line integral convolution diagram, the leaked hydrogen is always gathered at the tail of FCC due to the action of vortex G near the valve of the third bottle of hydrogen storage tank.
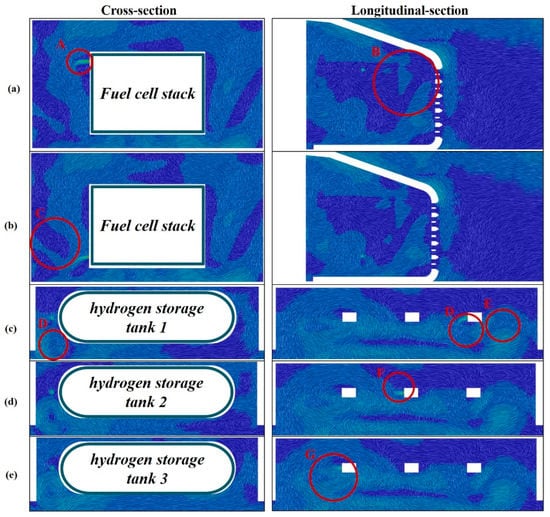
Figure 7.
Integral convolution diagram of the velocity line under 37.18 km/h (a) Anode air inlet; (b) Anode air outlet; (c) Bottle valve 1; (d) Bottle valve 2; (e) Bottle valve 3.
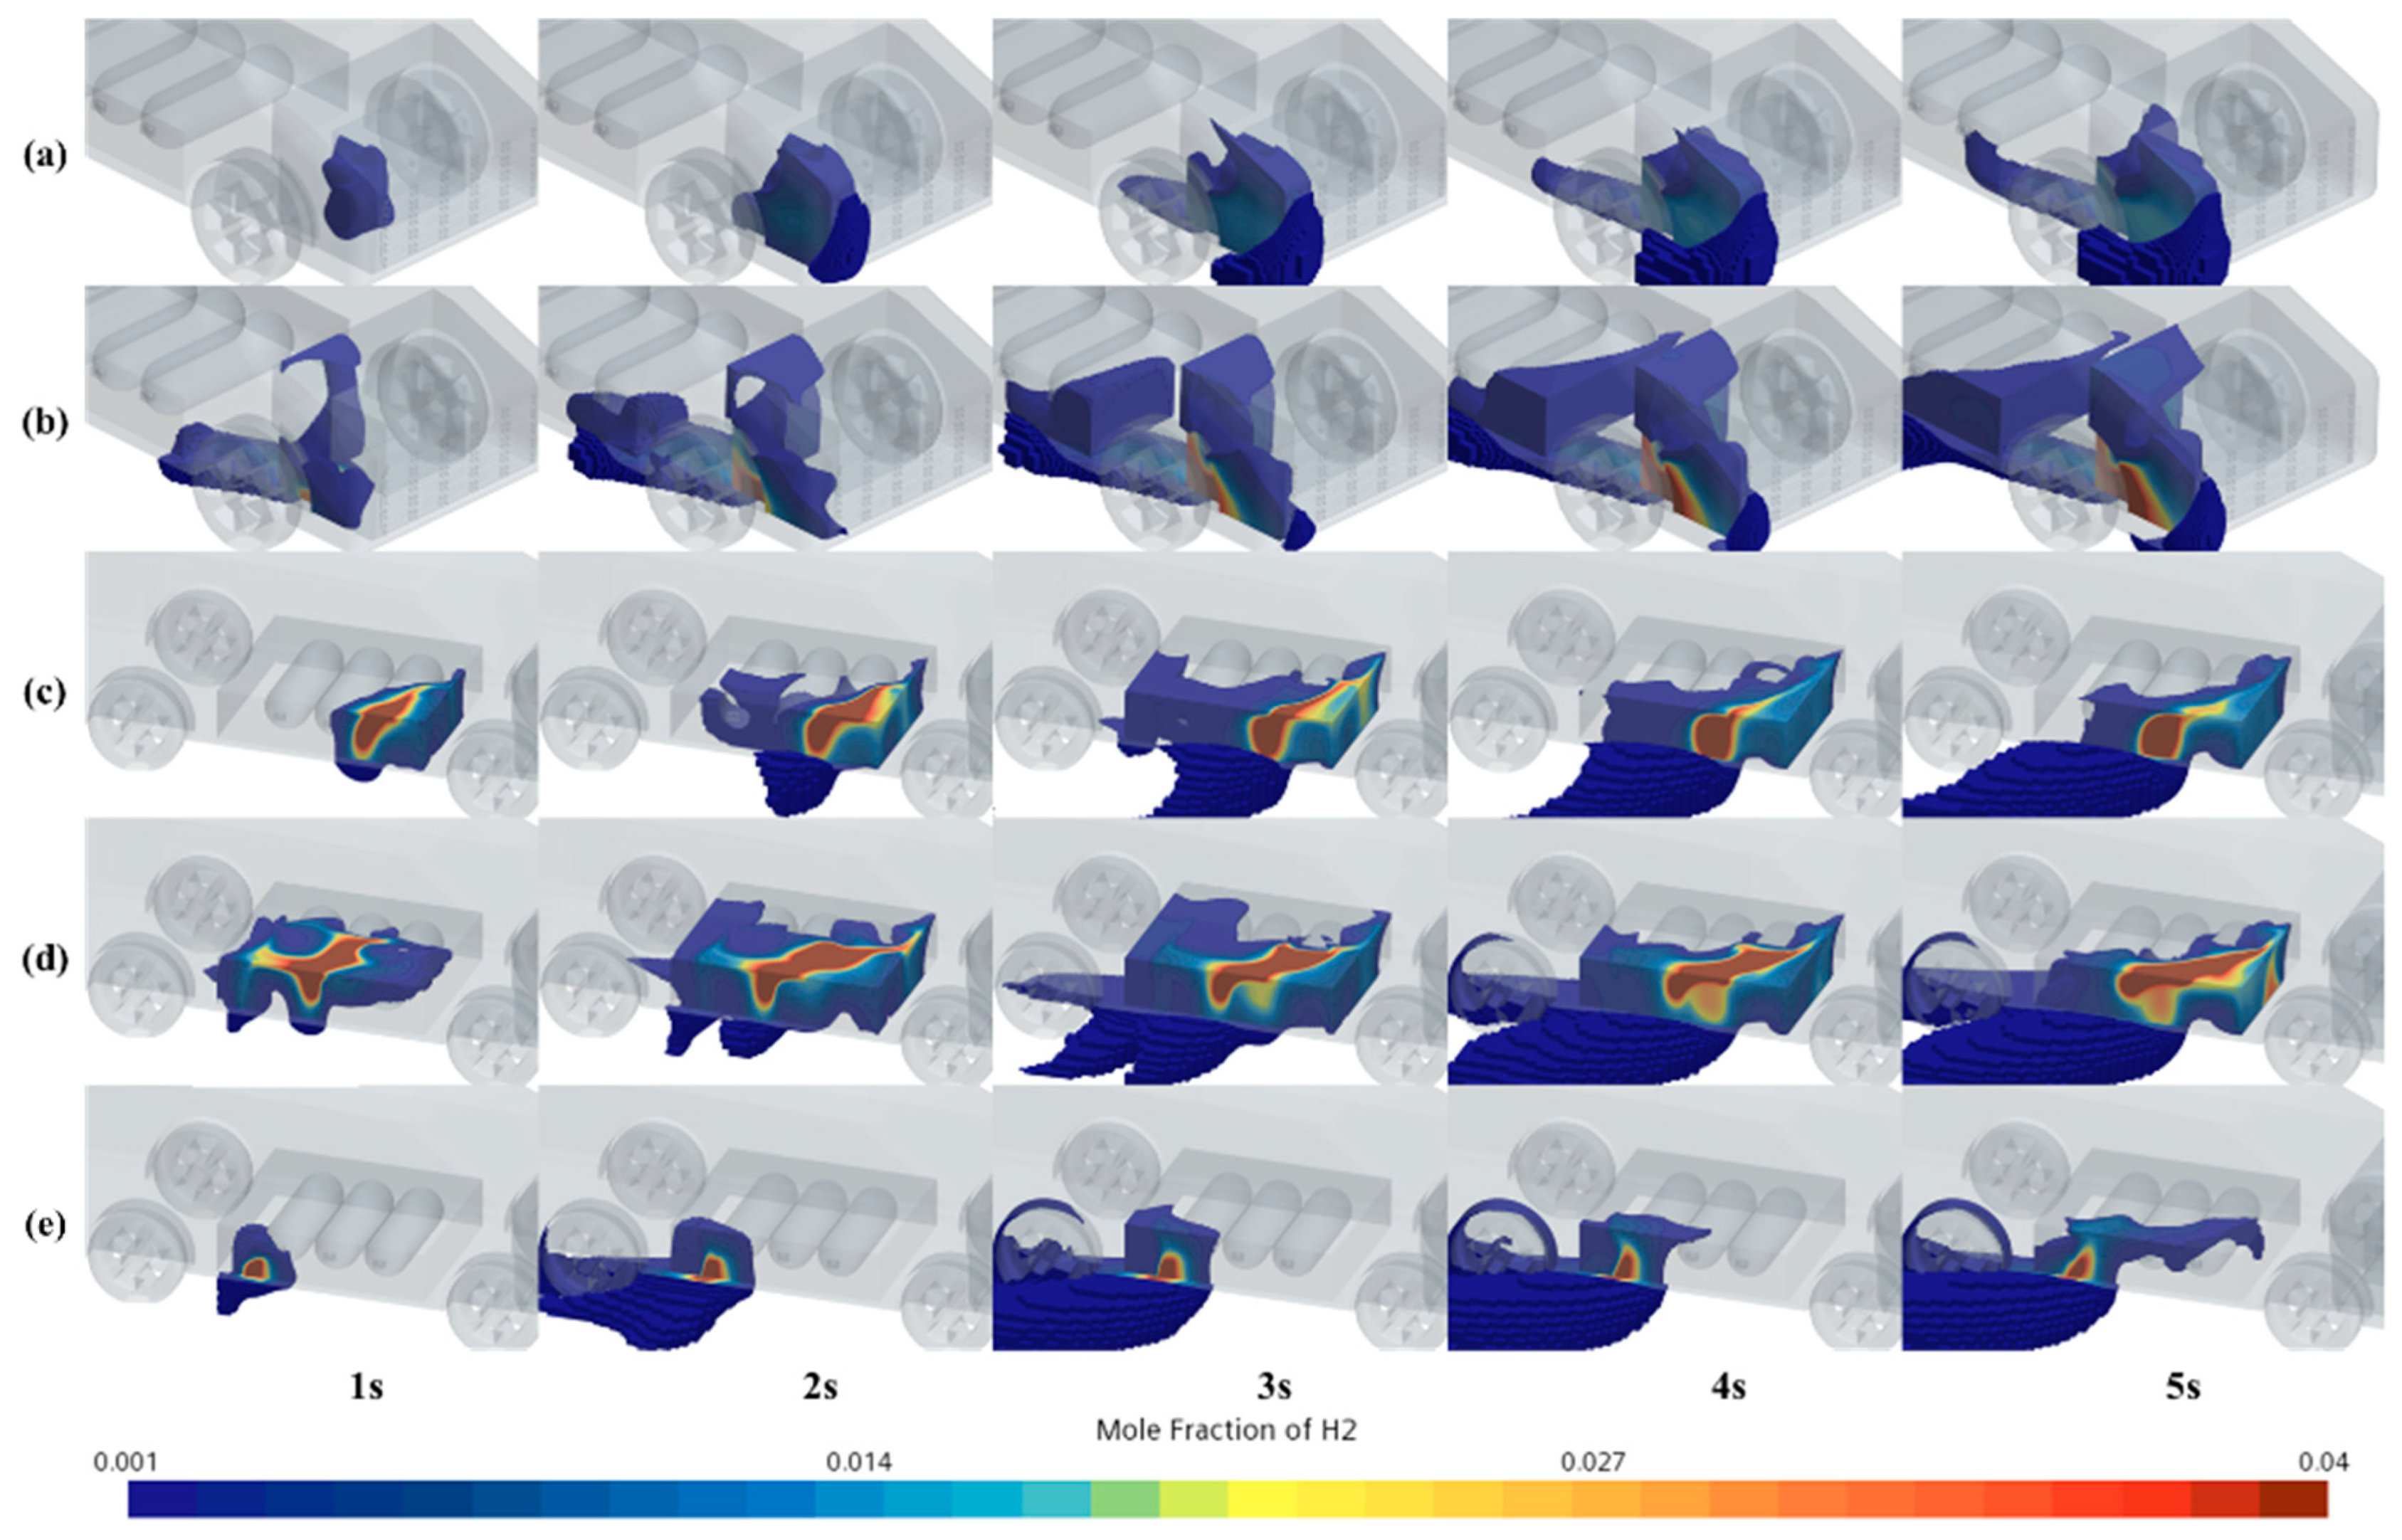
When the longitudinal wind speed is 114 km/h, the simulation result of hydrogen leakage is shown in Figure 8. In the FCC, the leakage trend of longitudinal wind speed of 114 km/h is similar to that of 37.18 km/h, but the coverage area of the FCC headspace is obviously smaller than that of the simulation results in a windless state and a wind speed of 37.18 km/h. In the HSTC, when the longitudinal wind speed is 114 km/h, compared with the windless state, the accumulated hydrogen coverage area at the top of the leaked hydrogen decreases, and hydrogen leaks out of the HSTC. However, compared with the hydrogen leakage with the longitudinal wind speed of 37.18 km/h, the accumulated hydrogen coverage area at the top of the leaked hydrogen in Bottle 1 and Bottle 2 increased.

Figure 8.
Cloud chart of hydrogen leakage under 114 km/h. (a) Anode air inlet; (b) Anode air outlet; (c) Bottle valve 1; (d) Bottle valve 2; (e) Bottle valve 3.
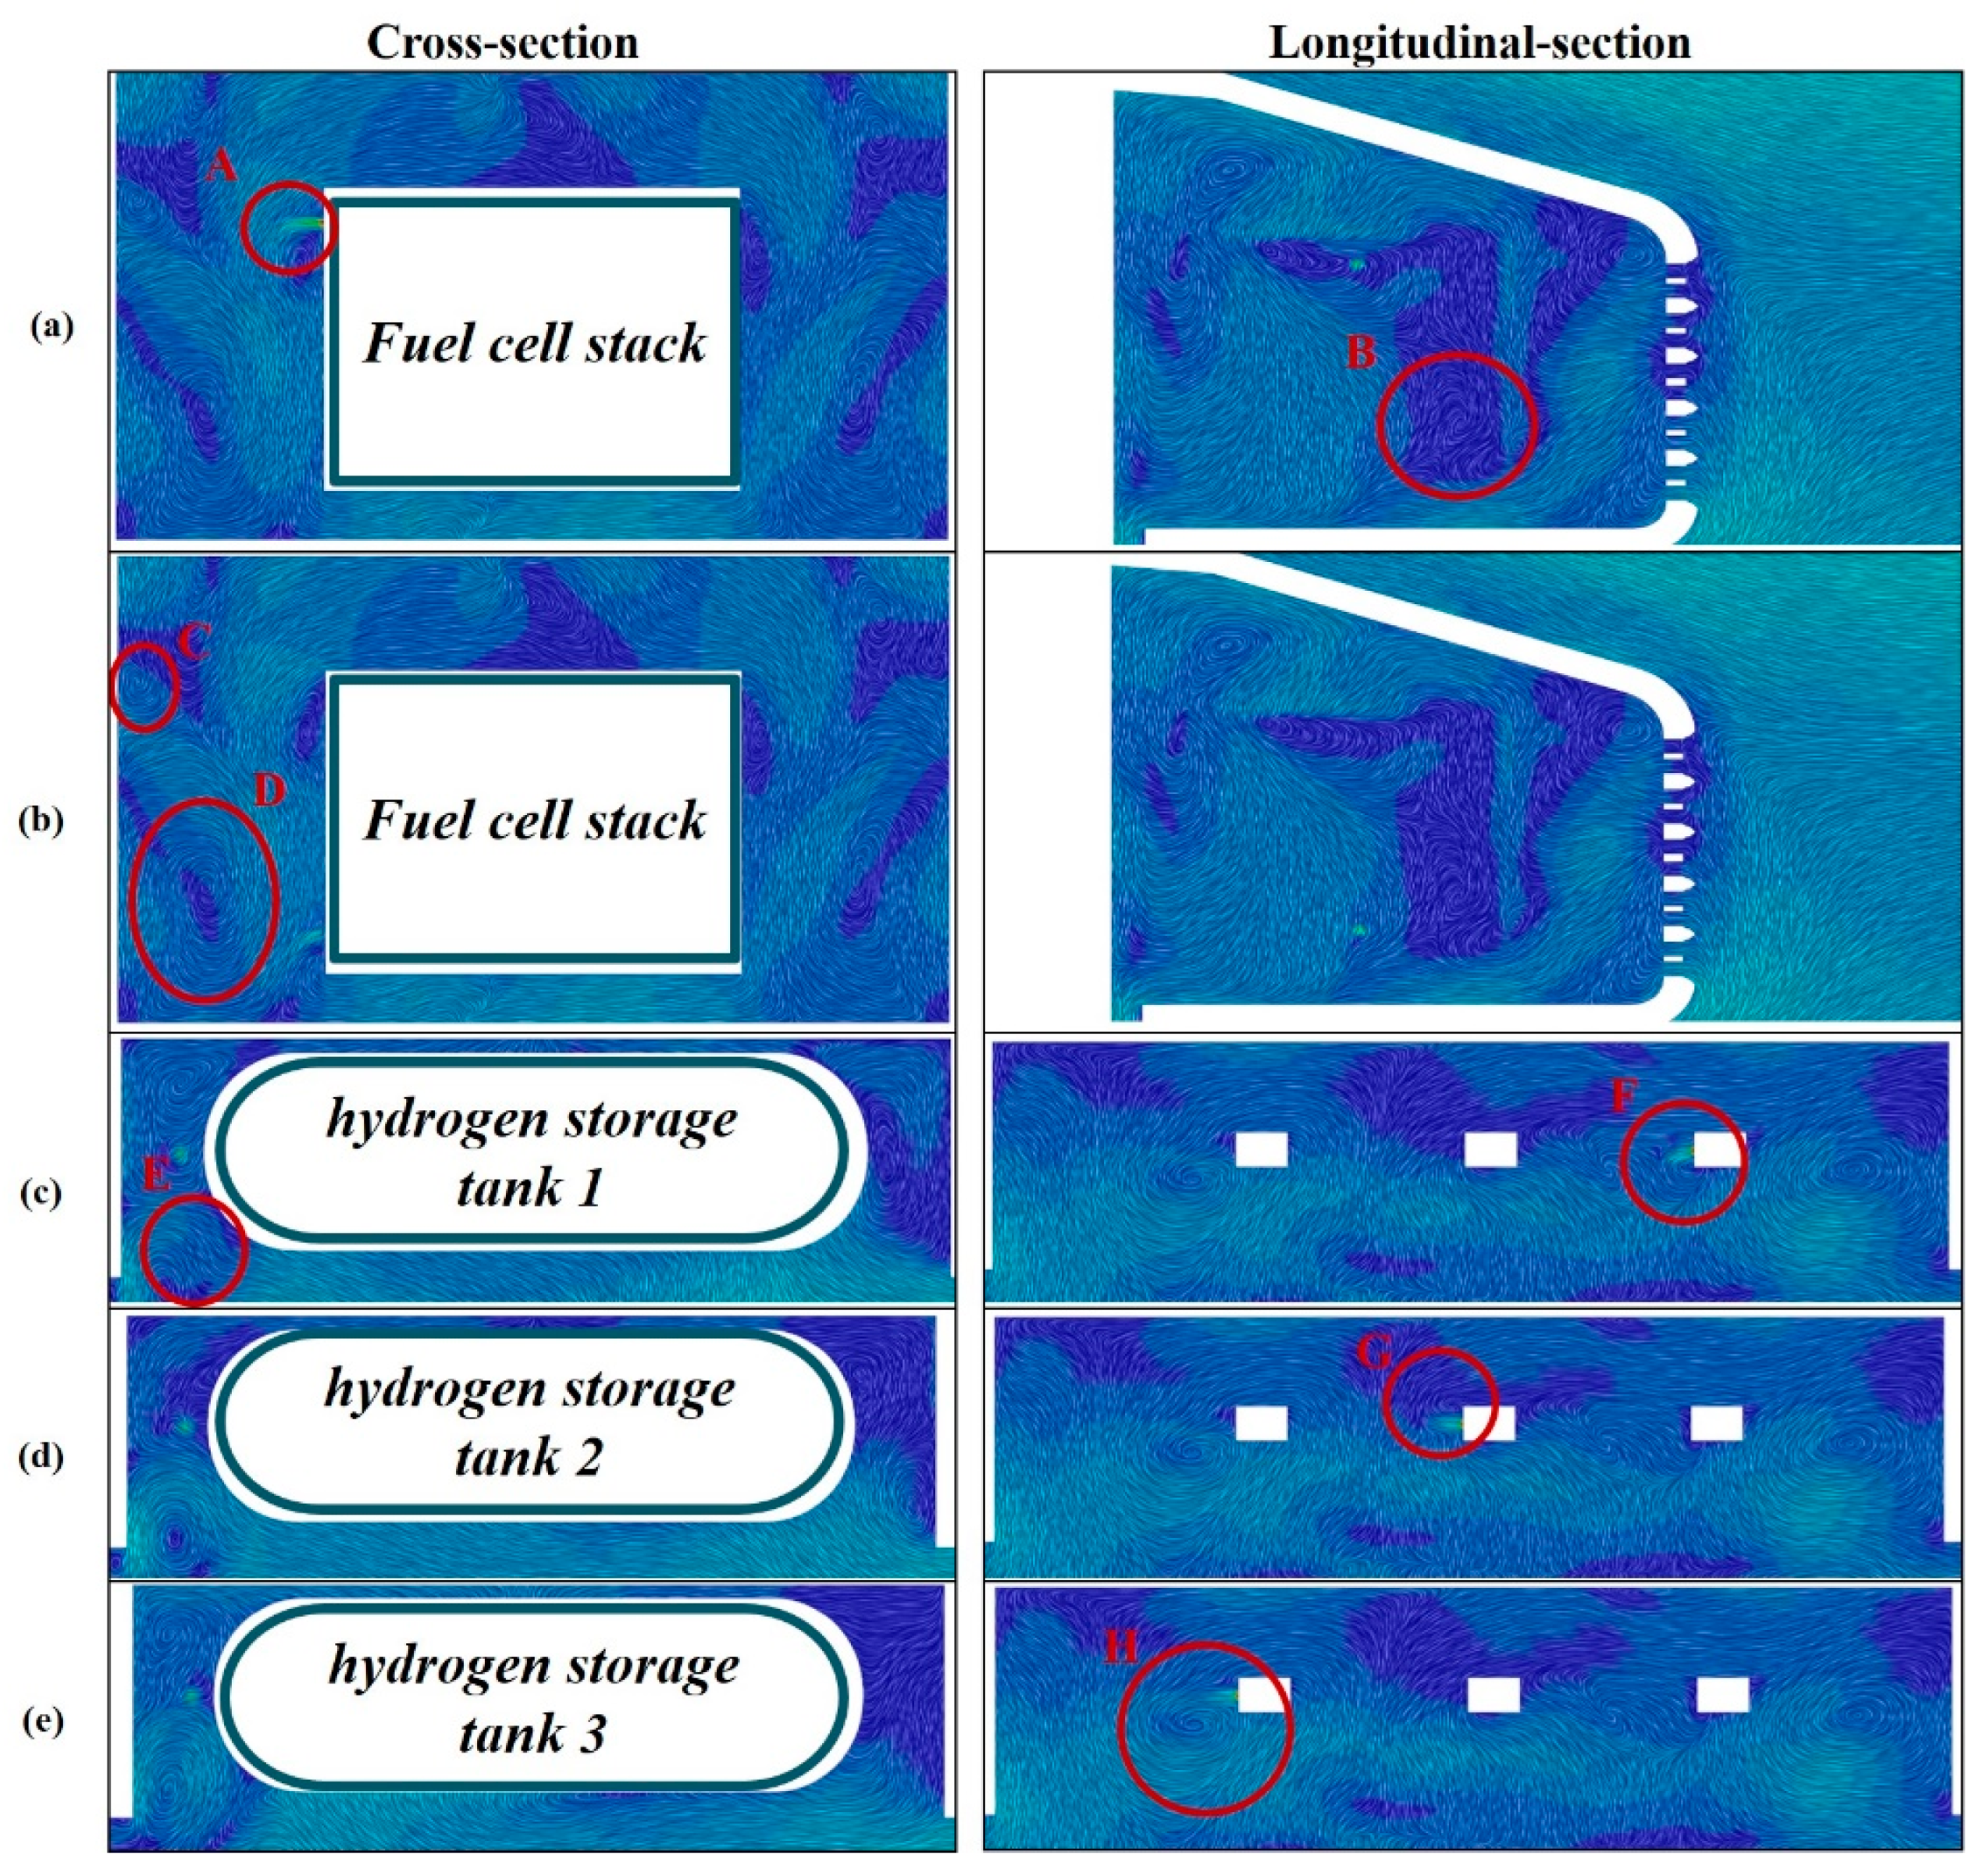
Combined with Figure 9, the reasons for the above phenomenon are analyzed. Figure 9a is similar to Figure 7a, but because of the change of the longitudinal wind speed, the overall wind speed in Figure 9a increases, and the size and position of vortex B change slightly. Figure 9b is similar to Figure 7b, but the position of some small eddies changes, which leads to the difference in the accumulation of leaked hydrogen in the later period. For example, the newly appeared small eddy C above eddy D makes the leaked hydrogen that diffuses to the top accumulate, so it is difficult to leave and spread to the top far away. Therefore, when the longitudinal wind speed is 114 km/h, the hydrogen coverage area in the FCC headspace is obviously smaller than that in the windless state and the wind speed of 37.18 km/h. In Figure 7, the vortex which has the greatest influence on the hydrogen leakage of Bottle 1 and Bottle 2, is weakened and the effect of accumulating hydrogen is reduced, and the diffusion of leaked hydrogen is intensified by the influence of the chaotic airflow. However, vortex H does not change much, so the initial diffusion of the hydrogen leaked from Bottle 3 in Figure 8 and Figure 6 is similar. At the same time, in the cross-sectional velocity line integral convolution diagram, it can be found that vortex E appears in the space above the bottle valve, which has a positive effect on the accumulation of the leaked hydrogen in the headspace.

Figure 9.
Integral convolution diagram of the velocity line under 114 km/h. (a) Anode air inlet; (b) Anode air outlet; (c) Bottle valve 1; (d) Bottle valve 2; (e) Bottle valve 3.
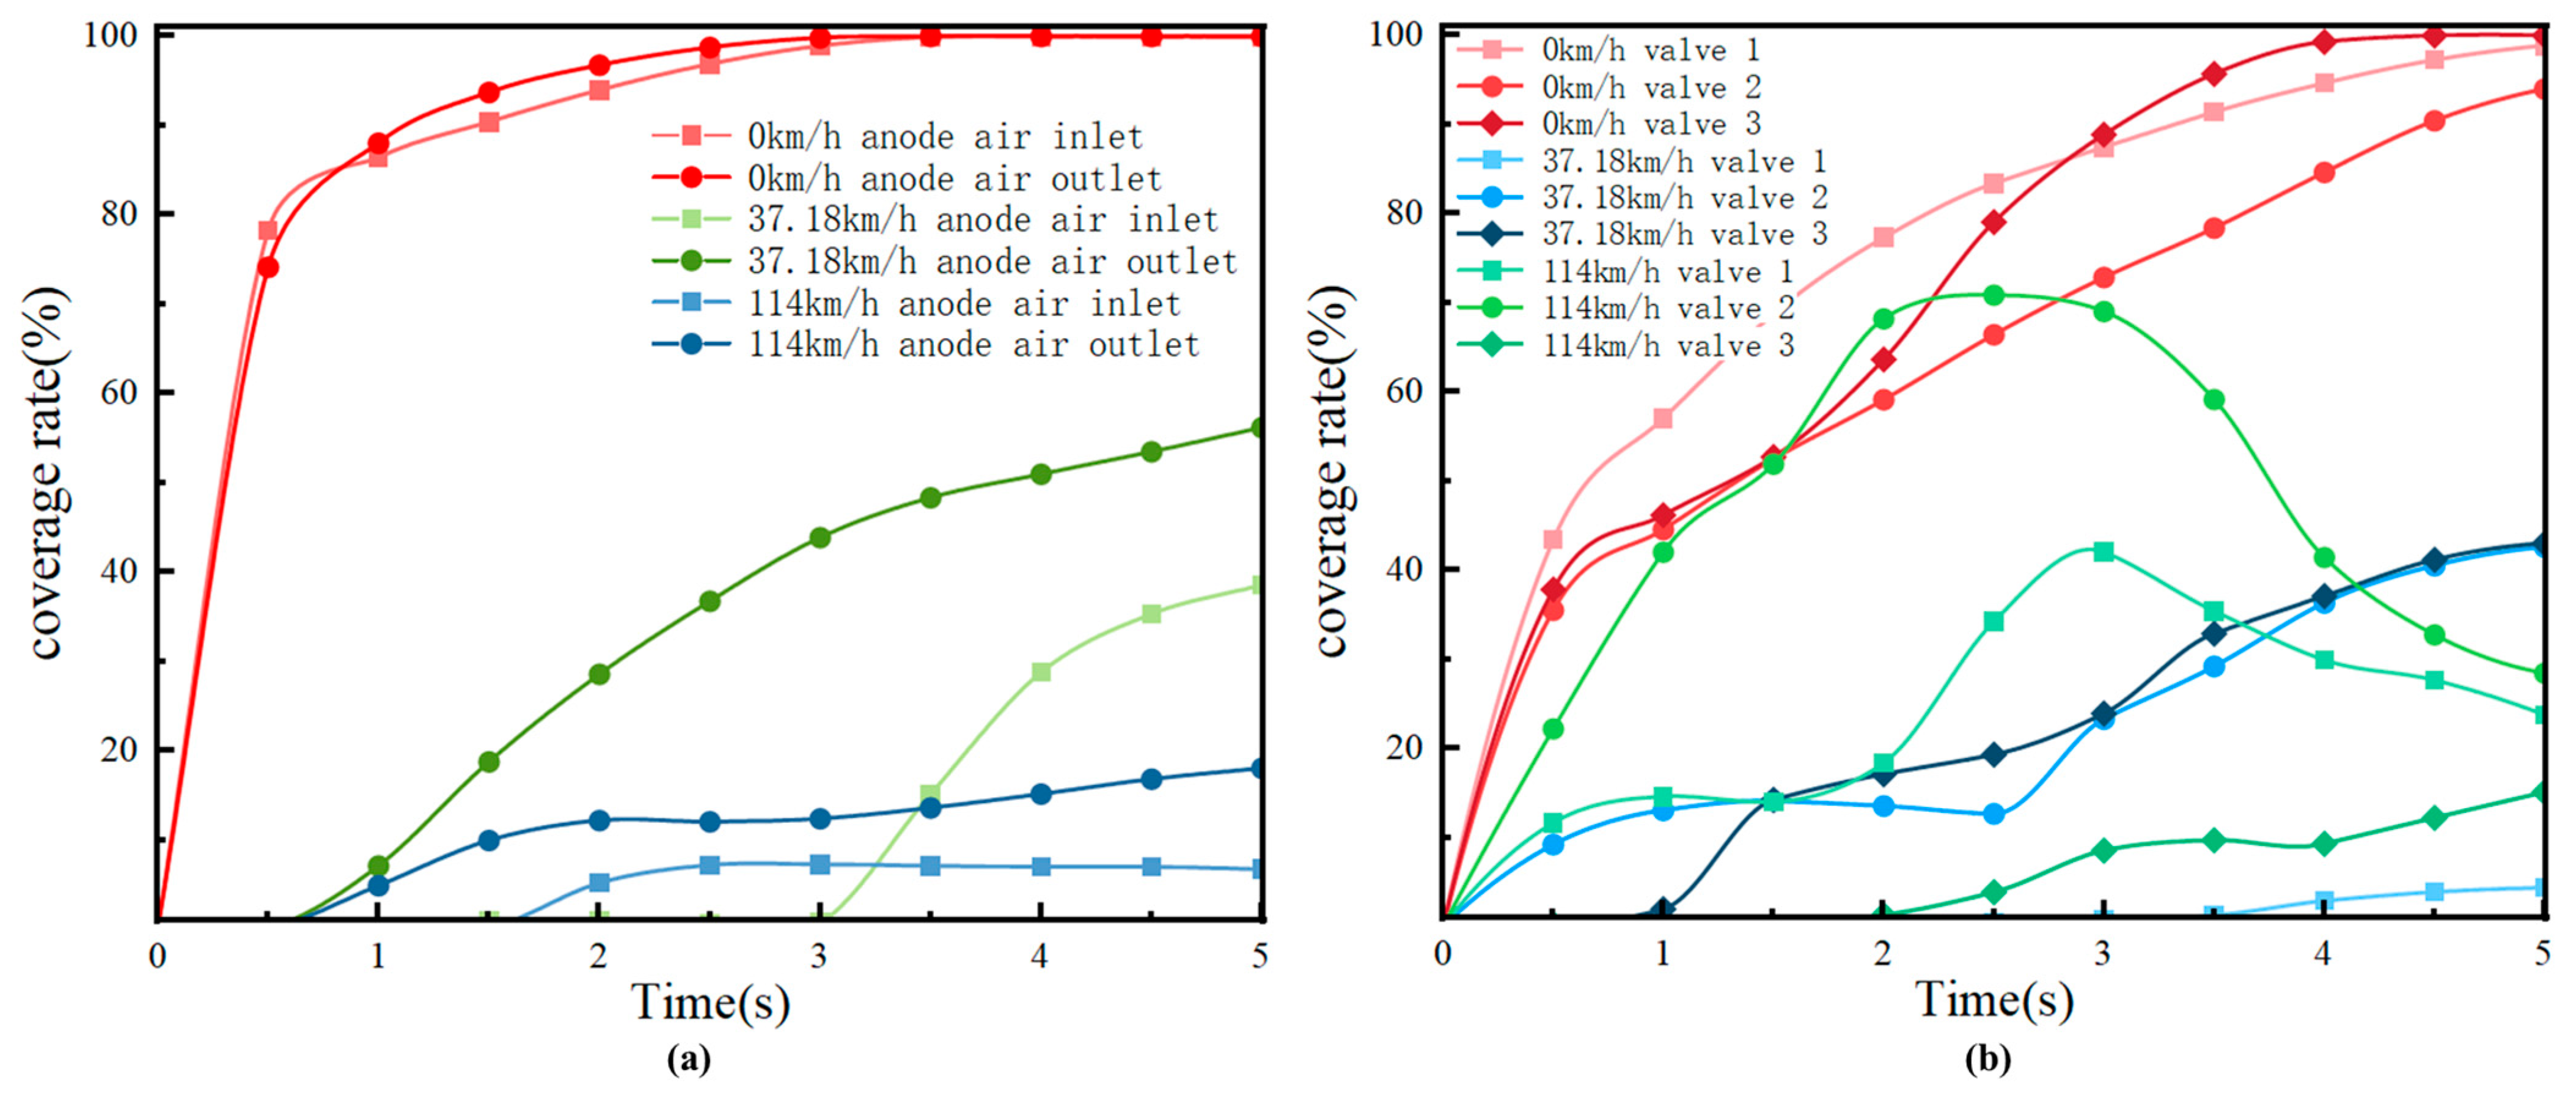
Hydrogen coverage in the headspace under three longitudinal wind speeds and five leaks is summarized, as shown in Figure 10. It can be seen that the hydrogen coverage in the headspace of the leaking species with longitudinal wind decreased. After five seconds of leakage, the average coverage reached 98.58% under windless conditions, only 36.92% at 37.18 km/h, and even decreased to 18.38% at 114 km/h, and the coverage decreased by 81.35%.
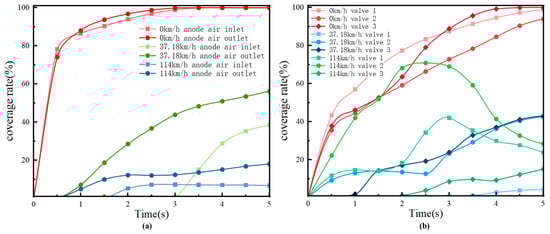
Figure 10.
Hydrogen coverage in the headspace. (a) FCC; (b) HSTC.
4. Sensor Layout Optimization
4.1. Leakage Scene Clustering Analysis
Due to the influence of multiple factors such as vertical wind and leakage position on the trajectory of the hydrogen leakage, there are numerous sub-divided scenes of hydrogen leakage. The summarized concentration distribution matrix data of the leakage space are enormous. When only considering a small number of scenes, the optimal sensor position can be directly calculated from the summarized concentration distribution matrix of the leakage space. However, when considering a larger number of scenes, an effective clustering method for the concentration distribution matrix data of the leakage space is needed to reduce the computational complexity of the subsequent sensor layout optimization. Therefore, this paper proposes a scene clustering method based on vector similarity evaluation. Based on this clustering result, the HCS layout is optimized using a genetic algorithm, as shown in Figure 11.
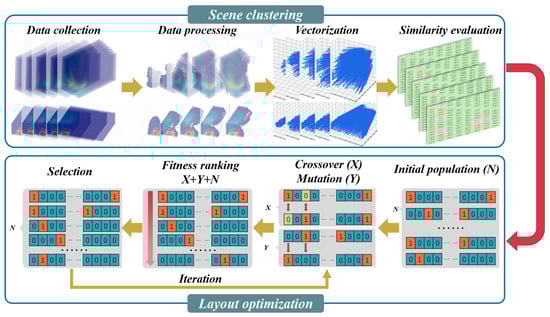
Figure 11.
Schematic diagram of the layout optimization of HCSs.
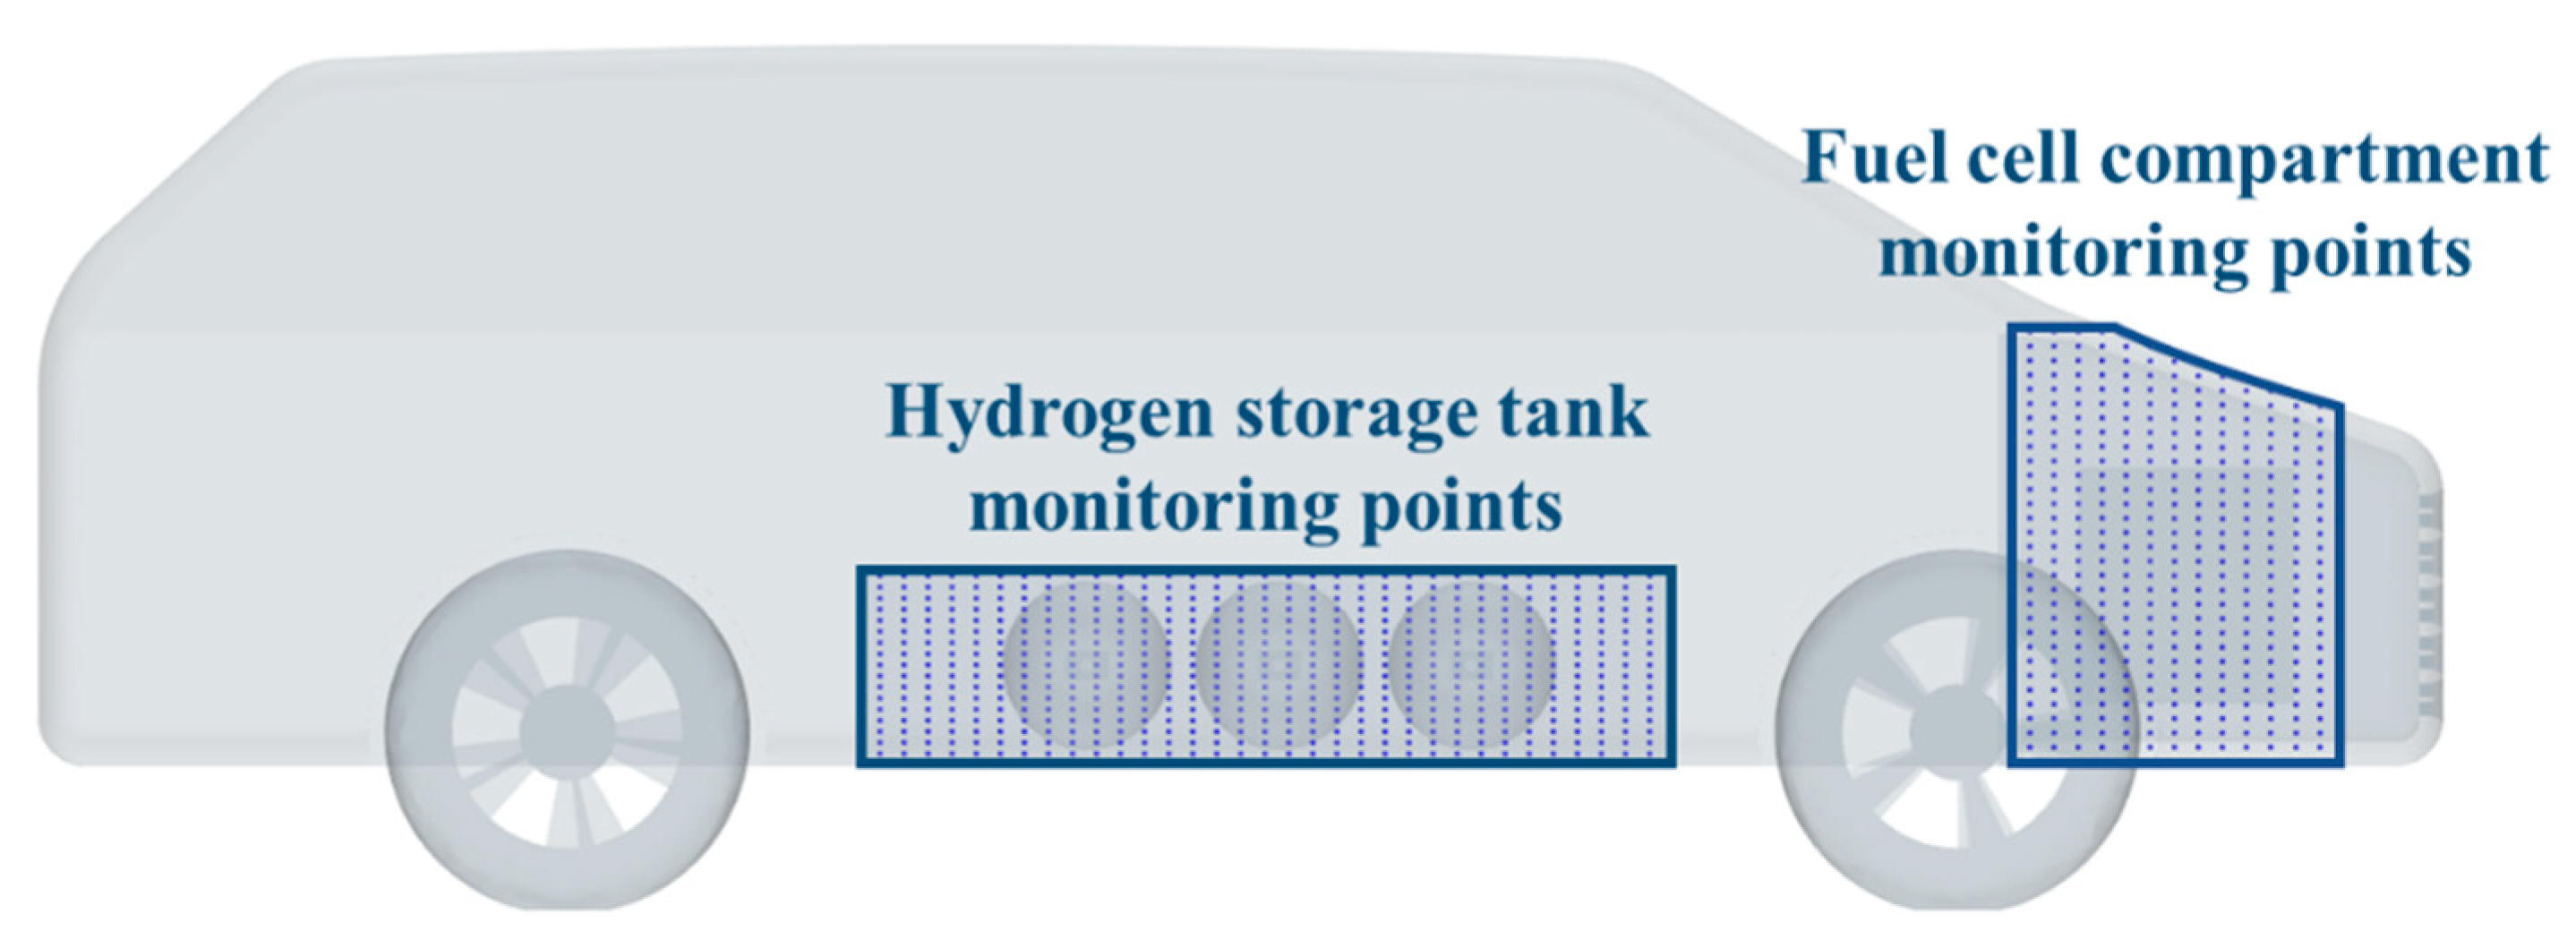
The leakage and diffusion of hydrogen has the characteristics that the space changes with time, so it is necessary to consider both time and space factors in order to classify the diffusion scenes. Therefore, the time average is divided into segments first, and then the hydrogen diffusion process in the space in each segment is clustered. At the same time, considering the directionality of hydrogen diffusion in each time segment, it is necessary to consider the diffusion direction in addition to the spatial distance in cluster evaluation. In this way, the final clustering results have a different number of scene sets in different time periods, which can better reflect the temporal and spatial characteristics of hydrogen diffusion. The specific scene clustering method is as follows: Step 1 involves processing the concentration distribution matrix data of the leakage space. In the hydrogen leakage simulation, 11,687 monitoring points are arranged in the FCC, and 8037 monitoring points are arranged in the HSTC, as shown in Figure 12. According to the performance parameters of the SEJONG sensor on NEXO (as shown in Table 2), the lowest detection limit of hydrogen leakage is 1000 ppm.
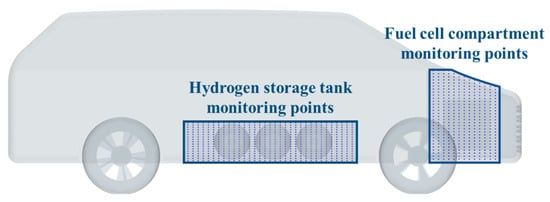
Figure 12.
Layout of the simulated monitoring points.
Table 2.
Performance parameters of the SEJONG sensor.
In step 2, the concentration distribution matrix of the leakage space at adjacent time points of the same scene is converted into a hydrogen diffusion vector of the leakage space. Use the datapoint coordinates at t2 to find the datapoint coordinates at t1 with the shortest distance, and generate the hydrogen diffusion vector in the leakage space, as shown in the following formula:
where dmin represents the shortest distance between two adjacent leakage spatial concentration distribution matrices. xt1, yt1 and zt1 represent datapoints at time t1, and xt2, yt2 and zt2 represent datapoints at time t2.
In step 3, an evaluation function is formed by two indicators, namely the vector distance and the vector included angle, and the evaluation function is shown in the following Formula (2). Through this evaluation function, the similarity of hydrogen diffusion vectors in different scenes at the same time is evaluated. The higher the similarity between the vectors, the smaller the evaluation function.
Ld1 represents the linear distance between the vector starting points, Ld2 represents the linear distance between the vector ending points, xp,t1, yp,t1, zp,t1, xp,t2, yp,t2 and zp,t2 represent the datapoints at t1 and t2 in the p scene, xq,t1, yq,t1, zq,t1, xq,t2, yq,t2 and zq,t2 represent the datapoints at t1 and t2 in the q scene. The included angle between the vectors is expressed by the following formula:
║Lq║ indicates the length of the vector in q scene. θ indicates the included angle of the vectors in the p scene and q scene. The evaluation function is expressed by the following formula:
ω⊥ indicates the weight of the vector distance in the evaluation function. ω‖ indicates the weight of the vector included angle in the evaluation function. In this paper, both weight parameters are selected as 0.5. The average similarity score between the vectors in all scenes was found using the formula:
In step 4, the scene similarity score was compared with the set threshold, and the hydrogen leakage clustered at different wind speeds and different leakage positions. The number of scenes after clustering and the proportion of leakage space coverage are shown in the figure below.
As seen in Figure 13, at the initial time of leakage, the similarity between the leakage scenes is not high because of the difference of the leakage position and longitudinal wind. However, with the increase in leakage time, the number of scenes after clustering gradually decreases, and the number of scenes after clustering is stable at 10, which is 33.33% lower than the original number, and the spatial coverage rate of leakage after clustering is not less than 82.67%.
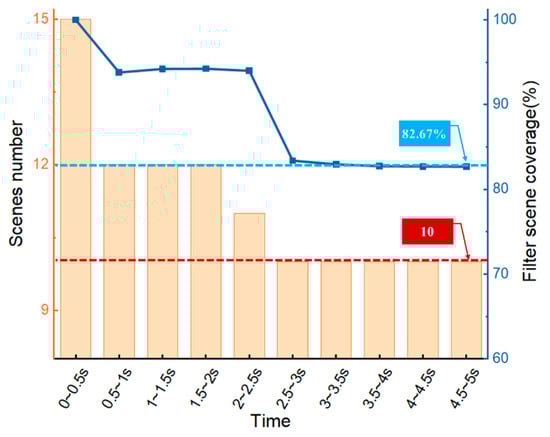
Figure 13.
Relationship between the scene number and coverage rate after clustering.
4.2. Sensor Layout Optimization Method
Due to the influence of different vertical wind speeds, the trajectory of leaked hydrogen gas changes, and the hydrogen gas is no longer always accumulated in the top space. The traditional HCS layout on the top can no longer detect hydrogen gas leakage in a timely manner. It is necessary to optimize the HCS layout based on the scene clustering results in the previous section and the hydrogen leakage simulation results in Section 3. This problem aims to detect hydrogen leakage in all scenes in the shortest possible time, which can be simplified as a single-objective optimization problem. A multi-scene full coverage response time minimization model is proposed, and the objective function is formulated as follows:
for detecting hydrogen leakage in all scenes. P is the set of leakage scenes. P = {1, 2, …, p, …, n}. Q is the position set of the sensors, Q = {1, 2, …, q, …, m}. is the time taken for sensor q to detect the leaked hydrogen concentration index C′ in a leakage accident scene p, and according to the sensor performance parameters selected in this paper, C′ is selected as 1000 ppm. As a decision variable, the value is 1 when the sensor q successfully detects the leaked gas in the leakage accident scene p and gives an alarm; otherwise the value is 0.
Considering the actual situation, the following constraints are set. Equation (9) ensures that the alarm sensor is unique for each leakage scene. Equation (10) ensures that the number of installed sensors conforms to the set total number of sensors. Equation (11) ensures that if there is a sensor at position q, position q can only be the first position where leakage scene p is detected. Equation (12) is to ensure the and number type.
Whether the sensor is installed at the q position or not confirms that the value is 1 when installing, otherwise the value is 0. X is the total number of sensors to be set up.
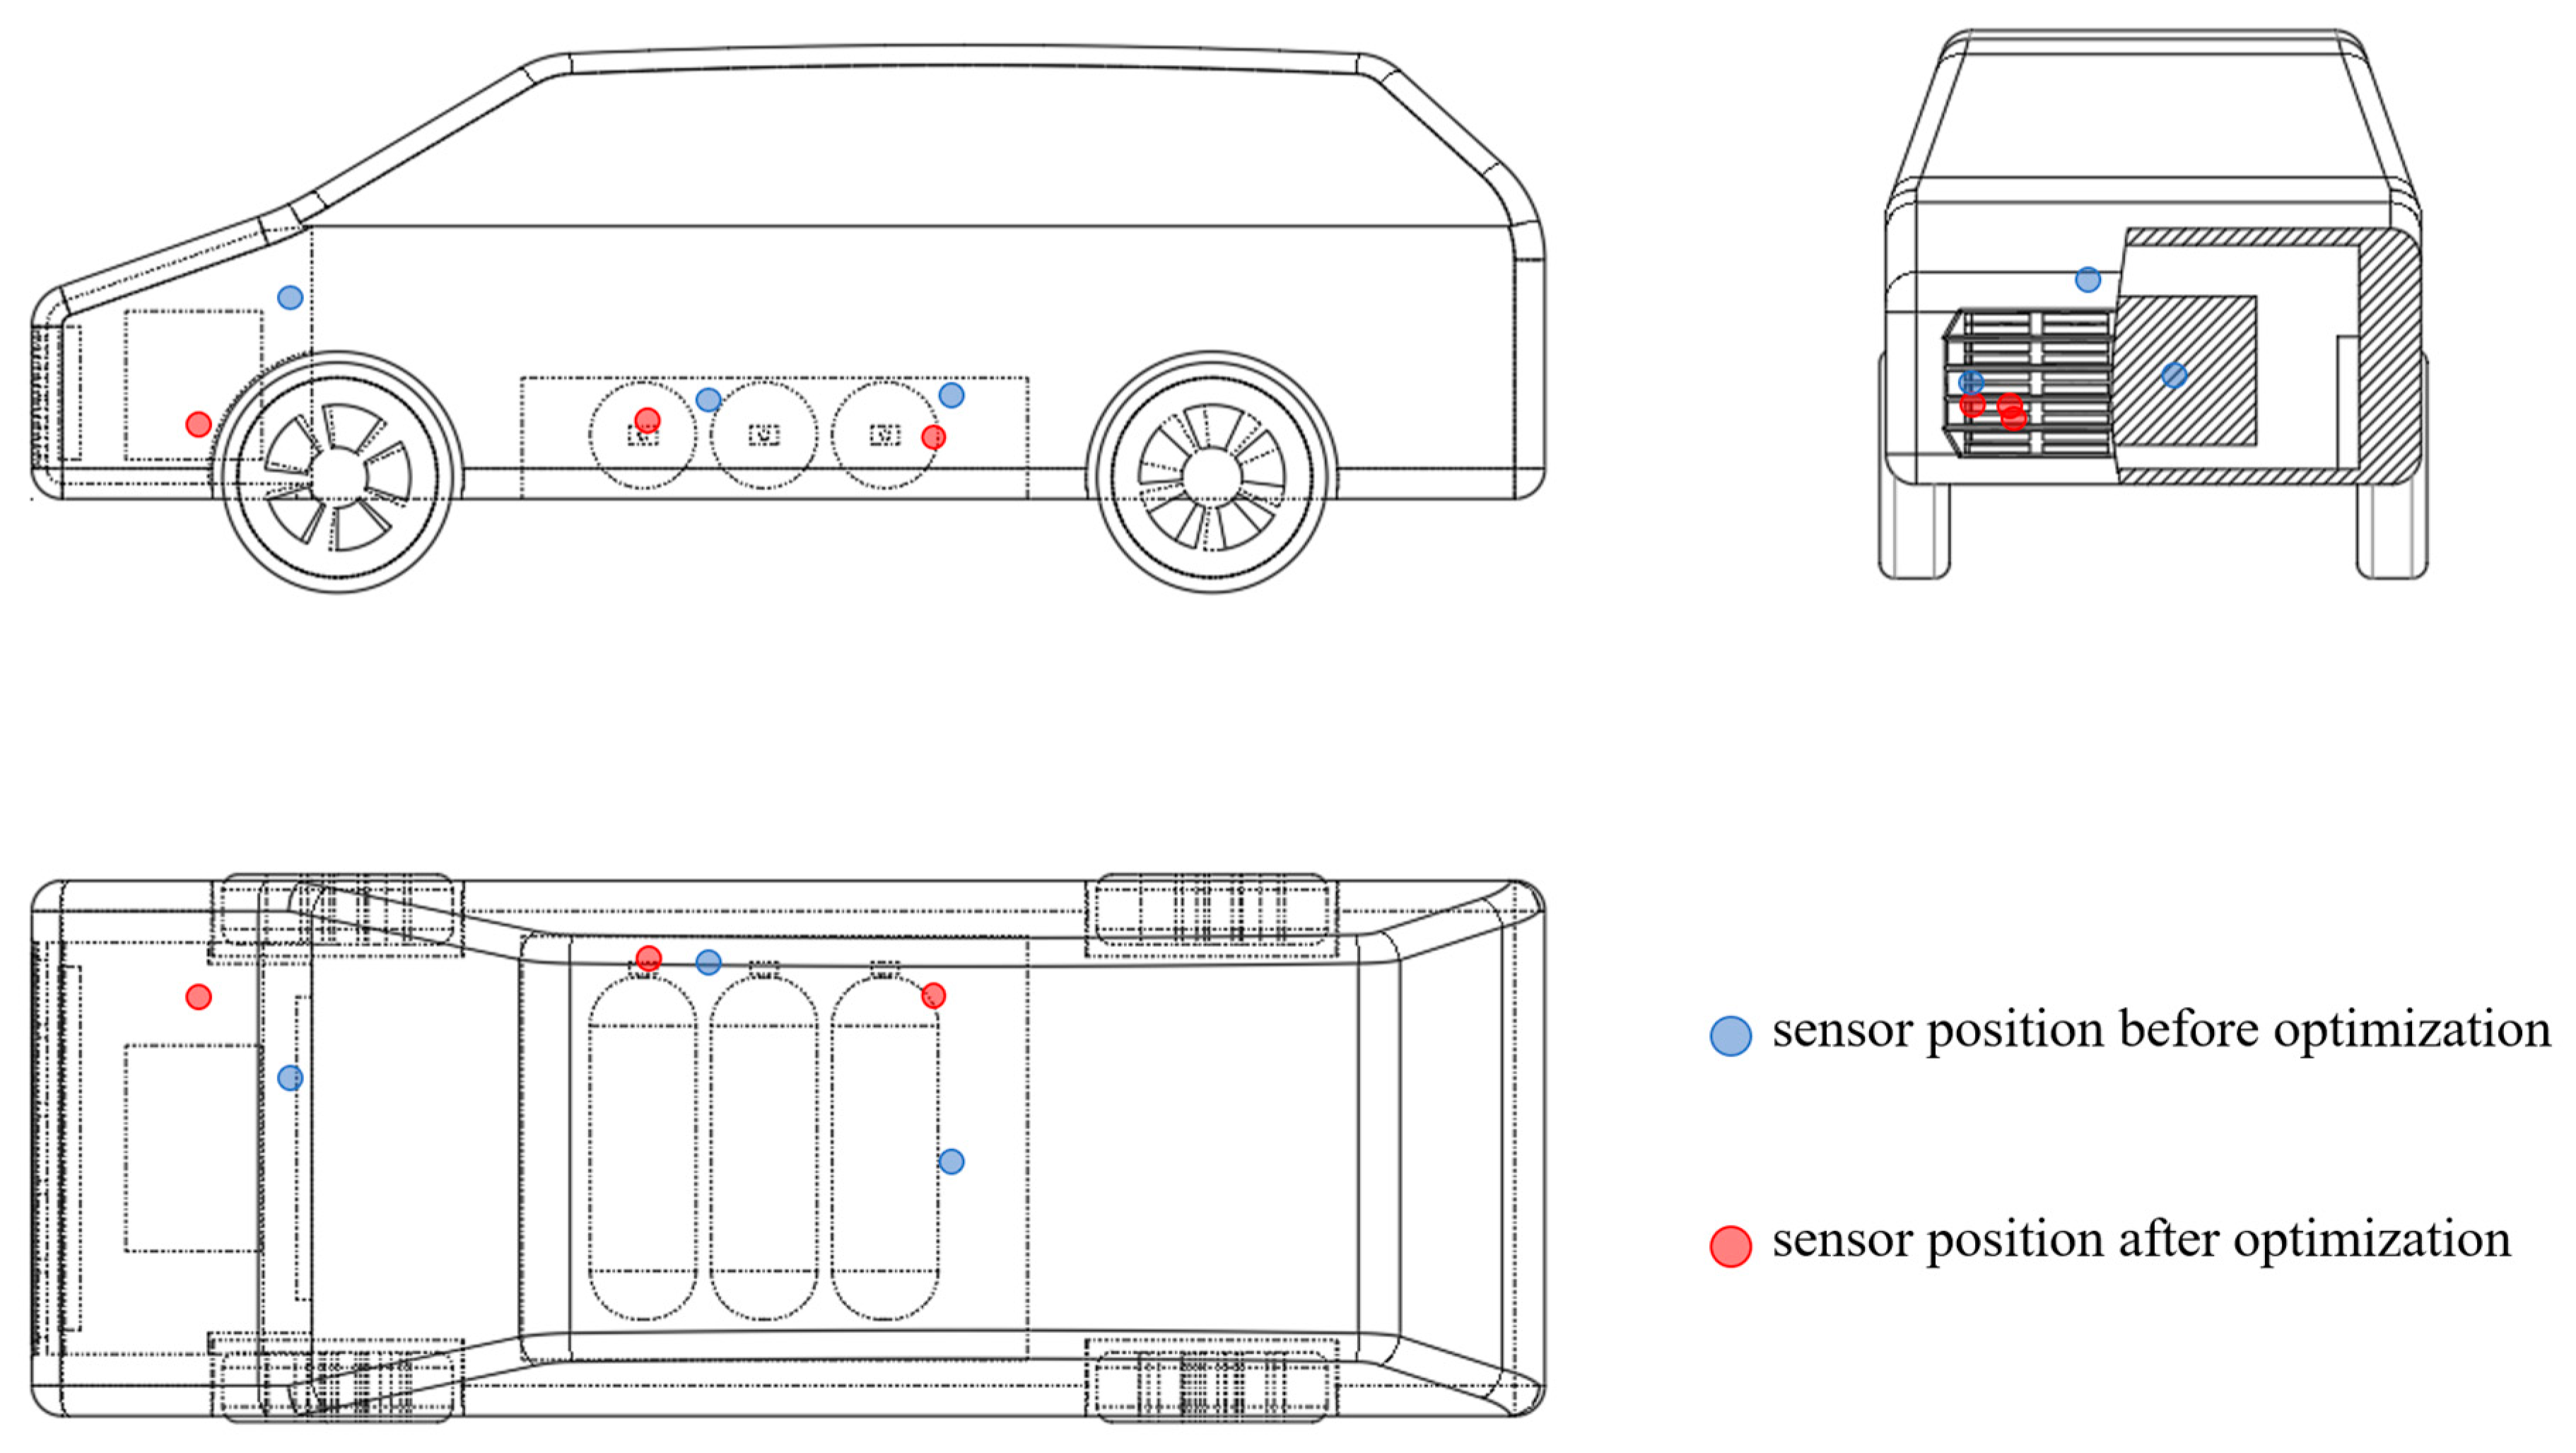
Based on the genetic algorithm, the above problems are solved. The initial population size of the genetic algorithm is set to 100, the crossover probability is 0.8 and the mutation probability is 0.2, as shown in Table 3. The number of sensors is determined according to the original HCS number of each compartment on the vehicle (FCC: 2, HSTC: 1). Based on the clustered leak set data, after 1000 iterations, the optimal position of HCSs is finally obtained by convergence, as shown in Figure 14, where red is the optimal position of the sensor and blue is the original position of the sensor. In order to verify the accuracy of the clustering effect, the original leakage scene before clustering is used for calculation again, and the calculated optimal position of sensors is consistent with the leakage scene set after clustering.
Table 3.
Parameter setting of the genetic algorithm.
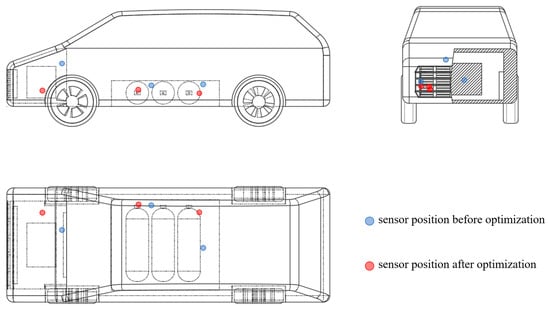
Figure 14.
HCS layout optimization position.
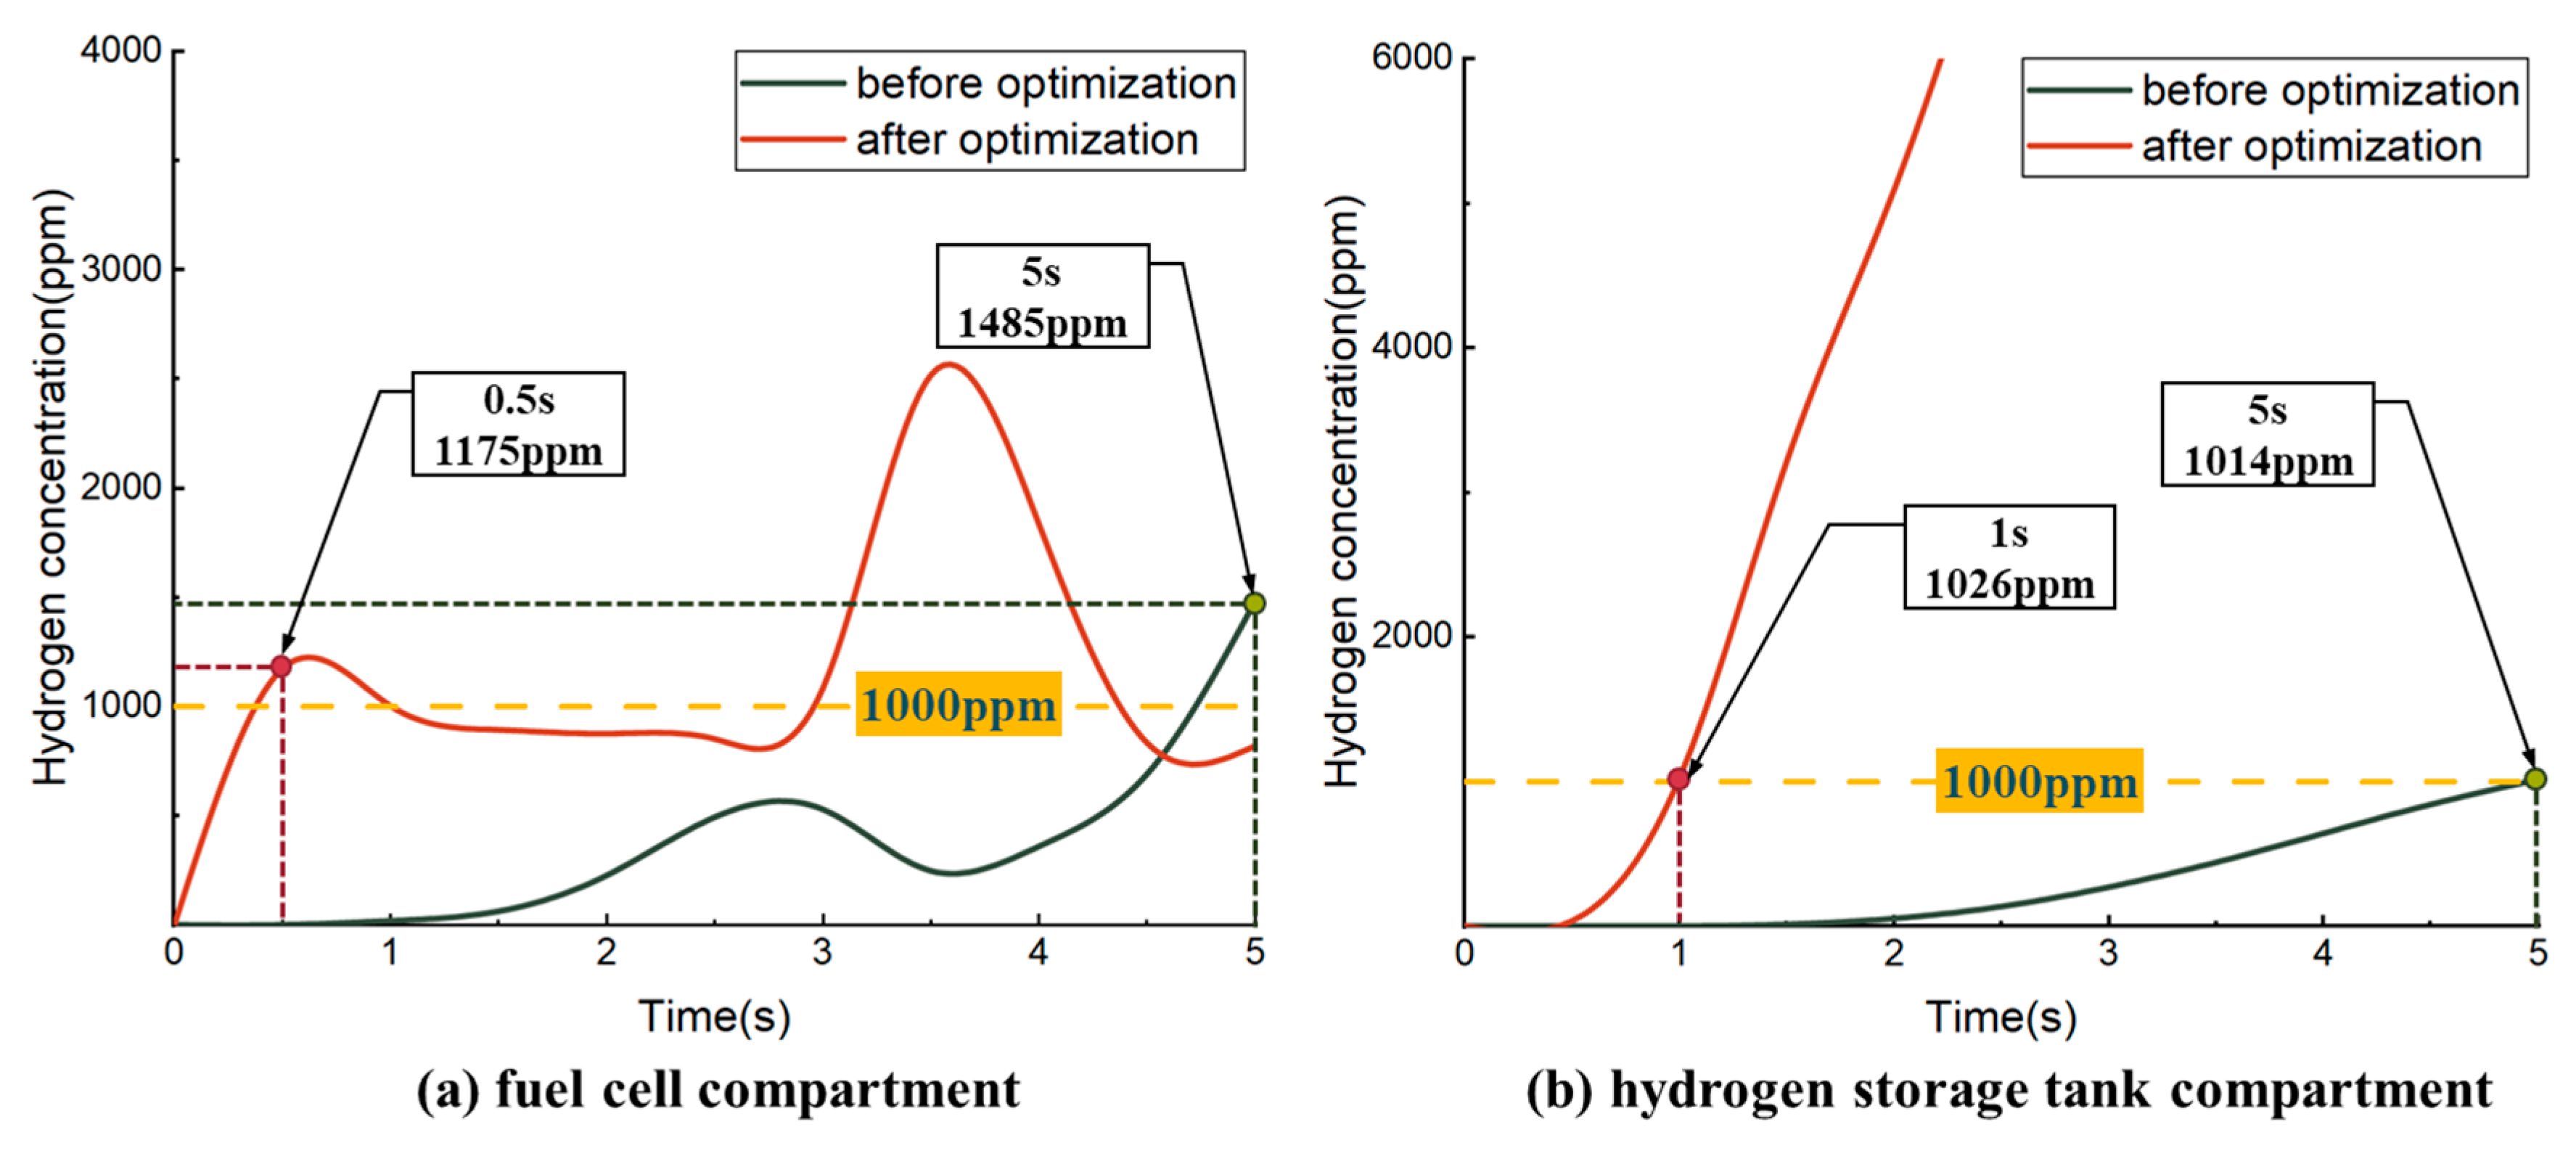
The change of hydrogen concentration with time before and after sensor optimization are compared, as shown in Figure 15, where Figure 15a represents the minimum value of the spatial coordinate concentration of the sensors in the FCC leakage scenes in each time node before and after optimization, and Figure 15b represents the maximum value of the spatial coordinate concentration of the two sensors in each time node before and after optimization, and the minimum value in the HSTC leakage scenes. It can be seen that in the FCC leakage scene, hydrogen leakage in all scene sets can only be detected in the 5th second before optimization, and after optimization, the hydrogen concentration in the sensor coordinates in all scene sets reaches the lower detection limit of the sensor (1000 ppm). In the hydrogen storage tank leakage scene, the detection time is also reduced from 5 s to 1 s after optimization. Based on the detection of two scenes, the response time of hydrogen leakage is shortened from 5 s to 1 s after sensor optimization. Combined with the position changes of the sensor before and after optimization, it can be found that the sensor layout before optimization follows the spatial high-point principle and the position is relatively high. As can be seen from the conclusion of the previous section, under the influence of longitudinal wind, there are more eddy currents inside the FCC and HSTC, and the accumulation of hydrogen at the top is greatly weakened, so the layout of the high point can no longer detect the occurrence of hydrogen leakage in time. The optimized sensor position is similar to the position of several major vortices in the longitudinal wind scene, and the accumulation effect of vortices on leaking hydrogen can be used to achieve a more timely alarm.
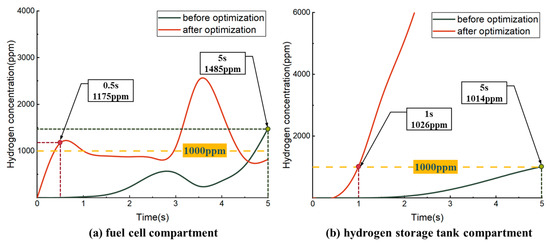
Figure 15.
Concentration–time variation of HCS positions.
5. Conclusions
The longitudinal wind generated during the running of FCVs has a great influence on the diffusion of leaked hydrogen. In this paper, CFD software STAR CCM 2021.1 is used to simulate the change of diffusion trajectory of hydrogen leakage in five different leakage locations of FCVs under three longitudinal wind speeds, and the influence of longitudinal wind on hydrogen leakage diffusion is analyzed. Based on the simulated hydrogen concentration–time matrix, a clustering method based on vector similarity evaluation is used to eliminate repeated leakage trajectories, and the proposed multi-scene full coverage response time minimization model combined with a genetic algorithm is used to optimize the position of HCSs, thus improving the hydrogen leakage detection ability of FCVs in longitudinal wind scenes. The following results are obtained:
- (1)
- The longitudinal wind prolongs the diffusion time of hydrogen to the headspace, and the coverage area of hydrogen in the headspace decreases. After five seconds of leakage, the average coverage rate reached 98.58% in windless conditions, only 36.92% at 37.18 km/h, and even decreased to 18.38% at 114 km/h, with a decrease of 81.35%.
- (2)
- At the beginning of different leakage scenarios, the similarity between the leakage scenarios is poor because of the different leakage locations and longitudinal winds. However, as the FCC and HSTC are semi-closed spaces, with the increase in leakage time, the similarity of hydrogen diffusion trajectories in the cabin is enhanced, and the number of clustered scenarios is gradually reduced, from the initial 15 to 10, with a decrease of 33.33%. The coverage rate of the leakage space after clustering is not lower than 82.67% of the original leakage space, which shows that the clustering result can better represent the original whole scene set.
- (3)
- Optimizing the position of HCSs. After optimization, the sensor position is highly coincident with several main vortex positions in the longitudinal wind scene, and the response time of the hydrogen leakage is shortened from 5 s to 1 s.
In the future work, the following aspects will be carried out to further enhance the practical application value of the proposed method:
- (1)
- Considering more longitudinal wind speeds in the simulation, and adding the longitudinal wind angle to make the data of the leakage scene set more perfect.
- (2)
- When the FCV is running, the fuel cell stack will generate huge heat to change the temperature distribution in the FCC, and the hydrogen leakage and diffusion caused by the temperature gradient distribution in the FCC have not been considered yet.
Author Contributions
Conceptualization, J.Z.; Methodology, F.Y.; Software, X.W. and Y.S.; Formal analysis, W.G.; Investigation, Q.S.; Data curation, X.W., Y.S., W.G. and Xing Shu; Writing—original draft, X.W.; Writing—review & editing, Q.S.; Visualization, F.Y. and Q.S.; Supervision, J.Z. and X.S.; Project administration, F.Y.; Funding acquisition, J.Z. All authors have read and agreed to the published version of the manuscript.
Funding
This research is supported by Weifang University of Science and Technology High-level Talent Research Start-up Fund Project KJRC2023001, the Natural Science Foundation of Shandong Province with ZR2019MEE029 and Shandong Jiaotong University Graduate Science and Technology Innovation Project with 2023YK004.
Institutional Review Board Statement
Not applicable.
Informed Consent Statement
Not applicable.
Data Availability Statement
The data presented in this study are available on request from the corresponding author. The data are not publicly available due to third-party confidentiality agreement restrictions.
Conflicts of Interest
The authors declare no conflict of interest.
References
- Hu, D.; Wang, Y.; Li, J.; Yang, Q.; Wang, J. Investigation of optimal operating temperature for the PEMFC and its tracking control for energy saving in vehicle applications. Energy Convers. Manag. 2021, 249, 114842. [Google Scholar] [CrossRef]
- Li, Y.; Kimura, S. Economic competitiveness and environmental implications of hydrogen energy and fuel cell electric vehicles in ASEAN countries: The current and future scenarios. Energy Policy 2021, 148, 111980. [Google Scholar] [CrossRef]
- Xie, Y.; Lv, N.; Huang, Y.; Wu, D.; Gong, L.; Yang, X.; Zeng, Y. Comparative analysis on temperature characteristics of hydrogen-powered and traditional fossil-fueled vehicle fires in the tunnel under longitudinal ventilations. Int. J. Hydrogen Energy 2022, 47, 24107–24118. [Google Scholar] [CrossRef]
- Zeng, T.; Zhang, C.; Hao, D.; Cao, D.; Chen, J.; Chen, J.; Li, J. Data-driven approach for short-term power demand prediction of fuel cell hybrid vehicles. Energy 2020, 208, 118319. [Google Scholar] [CrossRef]
- Andersson, J.; Grönkvist, S. Large-scale storage of hydrogen. Int. J. Hydrogen Energy 2019, 44, 11901–11919. [Google Scholar] [CrossRef]
- Fan, L.; Tu, Z.; Chan, S.H. Recent development of hydrogen and fuel cell technologies: A review. Energy Rep. 2021, 7, 8421–8446. [Google Scholar] [CrossRef]
- Li, Y.; Hou, X.; Wang, C.; Wang, Q.; Qi, W.; Li, J.; Zhang, X. Modeling and analysis of hydrogen diffusion in an enclosed fuel cell vehicle with obstacles. Int. J. Hydrogen Energy 2022, 47, 5745–5756. [Google Scholar] [CrossRef]
- Moradi, R.; Growth, K.M. Hydrogen storage and delivery: Review of the state of the art technologies and risk and reliability analysis. Int. J. Hydrogen Energy 2019, 44, 12254–12269. [Google Scholar] [CrossRef]
- Xie, Y.; Lv, N.; Wang, X.; Wu, D.; Wang, S. Thermal and fire characteristics of hydrogen jet flames in the tunnel at longitudinal ventilation strategies. Fuel 2021, 306, 121659. [Google Scholar] [CrossRef]
- Yu, X.; Wang, C.; He, Q. Numerical study of hydrogen dispersion in a fuel cell vehicle under the effect of ambient wind. Int. J. Hydrogen Energy 2019, 44, 22671–22680. [Google Scholar] [CrossRef]
- Mo, F.; Liu, B.; Wang, H.; She, X.; Teng, L.; Kang, X. Study on hydrogen dispersion in confined space with complex air supply and exhaust system. Int. J. Hydrogen Energy 2022, 47, 29131–29147. [Google Scholar] [CrossRef]
- Gu, X.; Zhang, J.; Pan, Y.; Ni, Y.; Ma, C.; Zhou, W.; Wang, Y. Hazard analysis on tunnel hydrogen jet fire based on CFD simulation of temperature field and concentration field. Saf. Sci. 2020, 122, 104532. [Google Scholar] [CrossRef]
- Wang, T.; Yang, F.; Hu, Q.; Hu, S.; Li, Y.; Ouyang, M. Experimental and simulation research on hydrogen leakage of double ferrule joints. Process Saf. Environ. Prot. 2022, 160, 839–846. [Google Scholar] [CrossRef]
- Malakhov, A.; Avdeenkov, A.; Du Toit, M.; Bessarabov, D. CFD simulation and experimental study of a hydrogen leak in a semi-closed space with the purpose of risk mitigation. Int. J. Hydrogen Energy 2020, 45, 9231–9240. [Google Scholar] [CrossRef]
- Giannissi, S.G.; Tolias, I.C.; Melideo, D.; Baraldi, D.; Shentsov, V.; Makarov, D.; Molkov, V.; Venetsanos, A.G. On the CFD modelling of hydrogen dispersion at low-Reynolds number release in closed facility. Int. J. Hydrogen Energy 2021, 46, 29745–29761. [Google Scholar] [CrossRef]
- Hao, D.; Wang, X.; Zhang, Y.; Wang, R.; Chen, G.; Li, J. Experimental Study on Hydrogen Leakage and Emission of Fuel Cell Vehicles in Confined Spaces. Automot. Innov. 2020, 3, 111–122. [Google Scholar] [CrossRef]
- Liang, Y.; Pan, X.; Zhang, C.; Xie, B.; Liu, S. The simulation and analysis of leakage and explosion at a renewable hydrogen refuelling station. Int. J. Hydrogen Energy 2019, 44, 22608–22619. [Google Scholar] [CrossRef]
- Tsunemi, K.; Kihara, T.; Kato, E.; Kawamoto, A.; Saburi, T. Quantitative risk assessment of the interior of a hydrogen refueling station considering safety barrier systems. Int. J. Hydrogen Energy 2019, 44, 23522–23531. [Google Scholar] [CrossRef]
- To, C.W.; Chow, W.K.; Cheng, F.M. Simulation of Possible Fire and Explosion Hazards of Clean Fuel Vehicles in Garages. Sustainability 2021, 13, 12537. [Google Scholar] [CrossRef]
- Lv, H.; Shen, Y.H.; Zheng, T.; Zhou, W.; Ming, P.W.; Zhang, C.M. Numerical study of hydrogen leakage, diffusion, and combustion in an outdoor parking space under different parking configurations. Renew. Sustain. Energy Rev. 2023, 173, 113093. [Google Scholar] [CrossRef]
- Chauhan, P.S.; Bhattacharya, S. Hydrogen gas sensing methods, materials, and approach to achieve parts per billion level detection: A review. Int. J. Hydrogen Energy 2019, 44, 26076–26099. [Google Scholar] [CrossRef]
- Tian, Y.; Zou, Q.; Lin, Z. Hydrogen Leakage Diagnosis for Proton Exchange Membrane Fuel Cell Systems: Methods and Suggestions on Its Application in Fuel Cell Vehicles. IEEE Access 2020, 8, 224895–224910. [Google Scholar] [CrossRef]
- Tian, Y.; Zou, Q.; Jin, Z.; Lin, Z. Data-driven diagnosis of the high-pressure hydrogen leakage in fuel cell vehicles based on relevance vector machine. Int. J. Hydrogen Energy 2022, 47, 12281–12292. [Google Scholar] [CrossRef]
- De Stefano, M.; Rocourt, X.; Sochet, I.; Daudey, N. Hydrogen dispersion in a closed environment. Int. J. Hydrogen Energy 2019, 44, 9031–9040. [Google Scholar] [CrossRef]
- GB/T 24549—2020; Fuel Cell Electric Vehicles—Safety Requirements. Standardization Administration of the People’s Republic of China: Beijing, China, 2020.
- Zhang, C.; Cao, X.; Bujlo, P.; Chen, B.; Zhang, X.; Sheng, X.; Liang, C. Review on the safety analysis and protection strategies of fast filling hydrogen storage system for fuel cell vehicle application. J. Energy Storage 2022, 45, 103451. [Google Scholar] [CrossRef]
- Kobayashi, H.; Naruo, Y.; Maru, Y.; Takesaki, Y.; Miyanabe, K. Experiment of cryo-compressed (90-MPa) hydrogen leakage diffusion. Int. J. Hydrogen Energy 2018, 43, 17928–17937. [Google Scholar] [CrossRef]
- Merilo, E.G.; Groethe, M.A.; Colton, J.D.; Chiba, S. Experimental study of hydrogen release accidents in a vehicle garage. Int. J. Hydrogen Energy 2011, 36, 2436–2444. [Google Scholar] [CrossRef]


Disclaimer/Publisher’s Note: The statements, opinions and data contained in all publications are solely those of the individual author(s) and contributor(s) and not of MDPI and/or the editor(s). MDPI and/or the editor(s) disclaim responsibility for any injury to people or property resulting from any ideas, methods, instructions or products referred to in the content. |
© 2023 by the authors. Licensee MDPI, Basel, Switzerland. This article is an open access article distributed under the terms and conditions of the Creative Commons Attribution (CC BY) license (https://creativecommons.org/licenses/by/4.0/).