Abstract
Patents support technological innovations in any economy and would also support a clean environment. We investigate the effects of economic growth, patents, industrialization, and urbanization on CO2 emissions in 17 Middle East and North Africa (MENA) economies by applying spatial econometrics. We substantiate the Environment Kuznets Curve (EKC) in the domestic economies and the whole MENA region as per direct and total estimates. Moreover, urbanization increases CO2 emissions in local economies and reduces neighboring nations’ emissions. The total effect of urbanization is found to be insignificant. Industrial value added increases CO2 emissions in domestic and neighboring countries, as well as in the whole MENA region. Patents increase CO2 emissions in domestic economies. However, patents reduce CO2 emissions in neighboring countries and the MENA region. Thus, patents have a pleasant effect on the environment in the whole MENA region. It is suggested that the MENA economies focus more on patents to reduce CO2 emissions. Moreover, urbanization and the industrial sector should be checked to protect the environment.
1. Introduction
The Middle East and North Africa (MENA) countries have natural resource-rich economies. Their economic growth is mostly dependent on the oil and natural gas sectors and could have environmental concerns for the region, as most of the MENA region’s emissions flow from the energy sector [1]. The Paris Agreement is continuously putting pressure on member countries to reduce pollution emissions and global warming [2]. Along the same lines, the Sustainable Development Goals (SDGs) also have the same objectives: to reduce pollution and promote sustainable development worldwide [3]. However, these pollution-reduction goals are a challenge for the MENA region because of its heavy reliance on pollution-oriented oil and natural gas production. Moreover, many MENA countries are among the world’s top polluters. For instance, in the year 2020, six MENA countries were on the top 10 polluters list of per capita CO2 emissions. Additionally, 8% of global CO2 emissions are contributed by the whole MENA region [4]. To follow the target of the Paris Agreement, the MENA region is striving toward Renewable Energy Consumption (REC). This transformation was just followed by Morocco and Jordan, and most MENA countries have a minute contribution of REC in the energy mix [5]. To reduce pollution in these highly polluted economies, there is a need for innovation to introduce energy-efficient and less polluting technologies. During the last two decades, the level of innovation has remained low in most MENA countries except Iran and Israel. For instance, Iran and Israel produced 8753 and 6886 patents annually on average during 2000–2019, respectively. In the same years, Egypt, Saudi Arabia, and Morocco produced on average 1781, 1229, and 1017 patents annually, respectively. However, the remaining MENA countries produced less than 1000 patents annually [4]. Thus, there is a need to test whether the level of innovation is sufficient to reduce pollution emissions or not. Moreover, innovation would help in the transformation of MENA economies from pollution-oriented oil and gas sectors to less-polluted industries and sectors. In addition, innovation may help reduce dependence on fossil fuels by providing alternative clean energy sources, and it could also increase energy and production efficiencies. Thus, less-polluted economic sectors, cleaner energy sources, and energy efficiency could help in the reduction of pollution emissions by technique and/or composition effects in the economies. On the other hand, innovation may have a dominant scale effect by increasing overall economic activities and energy consumption, which would pollute the environment consequently. Therefore, the net effect of innovation on the environment is an empirical question, and the present study is motivated to empirically investigate this question in a maximum sample of MENA countries to verify whether innovation helps in the reduction of emissions or not.
In the debate on REC, Research and Development (R&D) could play a significant role in transferring the economy from fossil fuels to cleaner energy. Moreover, it would improve the efficiency of the industrial and energy sectors [6]. Thus, technical innovations generated by R&D activities could help raise energy efficiency and reduce emissions [7]. Moreover, Murphy [8] argued that technical innovations would raise production efficiency, which would optimize the output with a lower level of energy and other inputs to maintain sustainable development in an economy. In macroeconomic pollution studies, we cannot ignore the effect of economic growth in determining emissions. A pioneering study by Grossman and Krueger [9] established a nonlinear association between economic progress and emissions. Subsequently, the Environmental Kuznets Curve (EKC) becomes a working horse in the environmental literature [10]. Economic growth may increase emissions in the first phase of the EKC due to excess energy usage, which is claimed as a scale effect. Later, technical and/or compositional effects may dominate, resulting in pleasant environmental outcomes of economic growth in the second phase of the EKC. In this phase of the EKC, technical progress and innovation can play a productive role in generating clean and productive technologies [11], which can reduce energy intensity and improve carbon productivity in production processes [12,13,14]. Thus, technical innovations can help shape the EKC.
Keeping in mind the role of innovation in pollution emissions, some studies have explored the influence of innovation on pollution in the MENA region. Bilal et al. [15] investigated One Belt One Road (OBOR) economies, including six countries from the MENA region, and corroborated the negative effect of innovation on CO2 emissions using dynamic, seemingly unrelated regression. Alternatively, Dauda et al. [16] probed the different regions, including a small sample of seven MENA countries, and stated that innovation enhanced CO2 emissions in the region by using Dynamic Ordinary Least Squares (DOLS). However, they did not corroborate this relationship by using Fully Modified Ordinary Least Squares (FMOLS). Thus, this relationship is inconclusive in the MENA region literature due to considering a limited sample of MENA countries and ignoring the possible spatial dimensions in the geographically nearby MENA economies. Thus, a literature gap exists in the MENA literature to identify the relationship between innovation and emissions, considering the spatial dimensions in a maximum sample of MENA countries. Yin et al. [17] argued that technical innovations could have spillovers that diffuse knowledge. Thus, innovations could have spatial linkages in a region [18], and this spatial dependency could help in developing a true relationship between innovations and emissions in the MENA region. In addition, Bockstael [19] strongly recommended the use of spatial econometrics in ecological studies, as CO2 emissions are global emissions. Thus, the emissions from one country can affect neighboring countries’ environments as well. Moreover, Maddison [20] suggested using spatial techniques in pollution studies of a region because a region sharing the same landscape and environmental policies as the countries in the region could have spatial dimensions. Furthermore, we cannot ignore spatial analyses in a model if spatial autocorrelation is substantiated statistically in the model [21].
Following the above arguments, some literature suggests doing spatial analyses of the innovation, technology, and emissions relationships [18,22,23,24,25,26]. Thus, the present study uses spatial techniques to analyze the impact of innovations on CO2 emissions in a maximum sample of 17 MENA countries, as per data availability. The present study contributes to the MENA literature by finding a positive effect of innovation on CO2 emissions in domestic economies and a negative effect of innovation on CO2 emissions in neighboring countries. Moreover, industrial value added has a positive effect on CO2 emissions in both domestic and neighboring economies. Urbanization has a positive effect on CO2 emissions in domestic economies and a negative effect in neighboring economies. In addition, the EKC is also substantiated by the relationship between economic growth and CO2 emissions.
2. Literature Review
Due to the increasing importance of using technology in combating pollution emissions, many recent studies have investigated this issue using different proxies of innovation in different economies or groups of economies. First, we discuss the studies on single-country cases, where most of the studies found were for China. For instance, Shahbaz et al. [27] investigated China by using bootstrapping Autoregressive Distributive Lag (ARDL) and found an inverted U-shaped EKC. Further, innovations reduced emissions. Moreover, public–private partnerships, exports, and Foreign Direct Investment (FDI) accelerated CO2 emissions. Using data from 1991 to 2019 for China, Li et al. [28] applied nonlinear ARDL and indicated that increasing green energy technologies and energy efficiency could help reduce CO2 emissions. In the same way, decreasing trends in these variables could increase emissions. Thus, they suggested that these two factors should be taken into account while trying to achieve carbon neutrality. Yang et al. [29] applied the bootstrap ARDL method to data collected for China from 1980 to 2019. Their analysis also showed that innovation could help reduce emission levels, especially in the green technology domain. Also, financial development was shown to reduce emission levels, but employment levels and energy consumption increased these levels. Nguyen et al. [30] investigated Vietnam from 1986 to 2019 by applying the ARDL technique, and found that economic growth and financial development enhanced CO2 emissions. However, transportation capacity and FDI helped reduce CO2 emissions. The various robustness tests also verified the results of the study. Liu et al. [31] investigated China from 1985 to 2019 and mentioned that technological innovation, as well as electricity generation, increased emissions in China in the first stage of the EKC. Afterward, economic growth reduced emissions. In their analysis of data from China using dynamic ARDL simulations, Ulucak [32] showed that energy innovation could help decrease emissions in the country and that the EKC also existed. Jiemin and Chen [33] applied the ARDL to show that private energy investments could help reduce CO2 emissions, while energy consumption increased emissions on both a short- and long-term basis. They also mentioned that foreign trade in China could lead to higher emissions.
Some Chinese studies used data from cities, provinces, or sectors. For instance, Ma et al. [34] investigated Chinese provinces by using Cross-sectional Dependence (CD) techniques from 1995 to 2019 and found that technological innovation, energy investment, REC, pollution taxes, and R&D expenditures helped reduce CO2 emissions. Using CD techniques, Kuang et al. [35] investigated Chinese provinces from 1990 to 2018 and indicated that REC and green technology reduced CO2 emissions in China. Zhu [36] argued about the mediating role of technology and analyzed 30 Chinese provinces during 2005–2017. The results showed that technological growth and advancement in the industrial segment reduced carbon emissions and helped achieve environmental goals. Gao et al. [37] conducted a similar analysis in 30 Chinese provinces from 2008–2020 and showed that the industrial sector promoted emissions and green technology advancements decreased carbon emissions.
In the city-level analysis, Gu [38] analyzed 275 Chinese cities from 2011 to 2017 and conducted a panel data analysis. The results showed that technological innovation reduced emissions. Technological innovation was also seen to have a moderating negative effect on two widely discussed variables, including emissions and economic expansion. Liu et al. [39] performed a quasi-experiment to test the effect that innovation incentives could have on urban CO2 emissions in Chinese cities and found that these incentives could help reduce CO2 emissions in urban areas. You and Chen [40] investigated 282 Chinese cities from 2005–2015 and found that carbon emissions in China were reduced by technological innovations. Thus, innovation played a mediating role in reducing emissions. Li et al. [41] investigated 285 Chinese cities and showed that population density, economic growth, industrial development, and FDI increased CO2 emissions. However, innovation helped reduce these emission levels. Lin and Ma [42] examined 264 Chinese cities from 2006–2017 and found that green technological innovations reduced CO2 emissions after the year 2010 in the sample period. Moreover, public expenditures could not play a role in the effects of green technological innovations. However, these innovations could reduce CO2 emissions in cities after they attain a mature level of human capital. In addition, these innovations upgraded the industrial structure in the cities, which consequently reduced CO2 emissions. Using city-level data from 30 Chinese provinces from 2005–2019, Dong et al. [43] showed that regulations and green technologies helped reduce emissions in China.
Li et al. [44] conducted a panel analysis of 32 economic sectors from 30 provinces in China by using quantile regression. They found an EKC between emissions and patents in these sectors. In low-innovation technology fields, emissions tended to be higher, but with more advancement and patents, emissions eventually started to decline. Wang et al. [45] used data from 97 counties in China from 2000–2017 to test the effects of industrial structure and innovations on CO2 emissions. An analysis showed that there were regional differences in these variables. Both innovations and industrial structures were shown to reduce emissions, and the eastern parts of the province saw more remarkable changes than the West. Yuan et al. [46] analyzed China in the first two decades of the 2000s and showed that green innovation reduced emissions. Additionally, institutional quality played a mediating role and helped improve the environment. Zheng et al. [47] investigated three Chinese regions from 2003 to 2017 and found that technological advancement improved carbon emission efficiency.
Apart from China, Adebayo et al. [48] collected data from Portugal from 1980 to 2019 by using wavelet analysis. The results showed that REC reduced CO2 emissions, while trade openness and technological innovations increased CO2 emissions. Their results about a positive relationship between innovation and CO2 emissions were different from other studies, which corroborated a negative relationship. Xin et al. [49] examined the US from 1990 to 2016 and stated that technical innovations reduced emissions, but economic growth and trade increased emissions. Likewise, Su et al. [50] also showed that technological innovation and REC in the US could help reduce CO2 emissions. The impact of REC was more significant than technological advancements, as it provided more opportunities to bring structural upgrades to energy policies. Adebayo et al. [51] investigated Brazil from 1990 to 2018 by using ARDL and found that economic growth increased emissions while technology reduced them. Jordaan et al. [52] showed a similar result for Canada, implying that more investment in innovation could reduce emissions.
Jiang and Khattak [53] showed the effect that technological advancements in marine energy could have on CO2 emissions in South Korea from 1991 Q1 to 2018 Q4. There was a long-run connection between income growth, green technology development, CO2 emissions, and REC. Investing more in marine energy technology and REC could help reduce CO2 emissions. Raihan et al. [54] conducted a time series analysis of Malaysian data from 1990 to 2019. Using the DOLS method, they showed that economic growth could lead to almost a one-to-one increment in CO2 emissions, and more REC could help reduce these emissions by 0.3%. Technological innovation could also help reduce emissions. Udeagha and Ngepah [55] applied the quantile ARDL approach to South African data from 1960 to 2020. The purpose was to identify the type of association between emissions and technological innovation. Like a couple of studies mentioned above, more technical innovations helped reduce CO2 emissions through technical effects. Moreover, the EKC was also validated in South Africa. Other factors, including higher energy consumption, industrial value added, and FDI, increased these emissions, and trade openness showed a degrading impact on the environment as well.
Some studies focused on a group of countries to capture the impact of innovations on the environment. Du et al. [56] analyzed 71 countries from 1996 to 2012. The results of their analysis showed the opposite of many other studies, as innovation could not contribute to reducing emissions if the country was below a certain income cut-off. The EKC with an inverted U-shape was validated in these countries, and urbanization, trade openness, and industrial structure seemed to increase emissions. Yu et al. [57] showed that technological innovation could have a major impact on reducing CO2 emissions in 52 countries from 1990 to 2014 as it helped improve the environmental condition in a country. Their results suggested policy implications: more investment should be made in innovation so that the environmental profile of the country could be improved. Liobikienė and Butkus [58] investigated a large panel of 147 countries from 1990 to 2012 and noticed that urbanization and trade reduced CO2 emissions through the technical upshot of energy efficiency, and REC could also play a role.
Some literature tries to capture the effects of innovation in developed economies, which are supposed to produce more innovations than developing countries. For instance, Saqib [59] examined and validated the EKC in the 18 most developed countries from 1990 to 2019 by using ARDL. Moreover, increasing REC and innovations reduced CO2 emissions. Economic expansion caused CO2 emissions, and renewable energy could help reduce emission levels. Awan et al. [60] substantiated the EKC in 33 developed countries. They collected data from 1996 to 2014 and showed that the EKC was an N-shape in these nations in the transport sector. Moreover, urbanization increased CO2 emissions. However, innovation reduced these environmentally degrading effects in the transport industry. Green technologies played a particularly important role in reducing emissions from this sector. Vitenu-Sackey and Acheampong [61] used panel data from 18 countries in the developed world from 2005 to 2018 to test the effects of energy intensity, R&D, and economic policy uncertainty on emissions. The results showed an inverted U-shaped EKC. Moreover, REC and R&D helped reduce emissions. Using data from 22 developed countries from 1990 to 2018, Rahman et al. [62] confirmed the EKC in these countries, and both renewable energy and export quality could help reduce CO2 emission levels over a long period of time. Additionally, technological advancement also helped reduce emission levels.
Abid et al. [63] analyzed G8 countries from 1990 to 2019 and mentioned that technological innovation and FDI tended to reduce emission levels. Nevertheless, there was also a bidirectional relationship between emissions and several other variables like urbanization, trade openness, and financial development. The authors emphasized the role that urbanization played in lowering emission levels and mentioned that more comprehensive policies were needed to tackle the environmental degradation of urbanization. Rehman et al. [64] examined G7 countries from 1990 to 2019, and FDI and trade openness largely increased CO2 emissions in Canada and Germany, while that effect was the opposite in the US and the UK. Shah et al. [65] showed that there was a dynamic association between oil prices and emissions. They also found that energy innovations helped reduce emissions. Ostadzad [66] analyzed 29 European Union (EU) countries from 2000 to 2019 and showed that innovations decreased emissions. The panel analysis also showed that innovation could help improve clean energy technology, which, in turn, contributed to emission reduction. In their panel study, Qureshi et al. [67] analyzed 17 European economies from 2010 to 2018. Eco-innovation helped reduce emissions. Khurshid et al. [68] showed that green innovations and environmental policies reduced carbon emissions in 15 European economies and could be used to achieve sustainable development goals. Ahmed et al. [69] examined European countries from 1995 to 2019 and found that green technologies and REC reduced CO2 emissions. However, economic growth raised emissions.
Some literature also examined Brazil, Russia, India, China, and South Africa (BRICS). For instance, Ma et al. [70] analyzed BRICS nations using an ARDL model. Technological innovations and patents tended to reduce emissions. However, the trademarks increased emissions. Abbas et al. [71] analyzed BRICS countries from 1990 to 2020 and mentioned that market regulation could help mediate the relationship between emissions, REC, and innovations. They also found that innovations and REC could decrease emissions. Khan et al. [72] collected data from BRICS countries from 1990 to 2019 to test the impact of information technologies on CO2 emissions. The results showed that these technologies helped reduce CO2 emissions. Additionally, REC and innovations reduced these emissions as well. They also validated the existence of the EKC in these countries. Zhang [73] analyzed BRICS nations from 1990 to 2019 and showed that technology helped reduce emissions. Moreover, an EKC was found except in Brazil and China.
Jiang et al. [74] analyzed BRICS nations from 1985 to 2018 to test the relationship between some variables, including coal consumption, population, Consumption-Based CO2 (CBC) emissions, and environmental technologies. The analysis of the data showed that environmental technologies could help reduce CO2 emissions, while coal consumption aggravated the emissions levels, resulting in environmental degradation. Meng et al. [75] analyzed BRICS and Turkey by using the CS-ARDL approach. Results showed that trade diversification, renewable energy, and green innovation could help reduce emission levels. However, economic growth increased consumption-based emissions. Jiang and Khan [76] examined the BRI economies for the period from 1995 to 2019 and found that REC and trademark applications reduced CO2 emissions. Moreover, the EKC was also found. Li et al. [77] applied the ARDL model to analyze data from BRI economies from 2003–2018 and found that green innovations and exports reduced CBC emissions. However, FDI and imports increased these emissions.
Many studies also investigated the highly polluted Organization for Economic Co-operation and Development (OECD) nations. For instance, Mensah et al. [78] conducted an analysis of OECD nations and showed that patents and trademarks reduced CO2 emissions while economic growth and urbanization increased these emissions. Yildirim et al. [79] analyzed 32 OECD countries from 1997 to 2018. They divided the effects of technological innovations into three regimes. The results showed that in the first regime, the effect on CO2 emissions was insignificant but changed in later regimes. It tended to reduce emissions in the second regime but started to increase in the third one. There was not any extensive discussion on why this might be the case. But the results suggested that a more comprehensive and robust policy was required to test this relationship so that emissions could be reduced. Khattak and Ahmad [80] examined OECD economies, and REC and green innovations helped reduce emissions while income could increase CO2 emissions. Alvarez-Herranz et al. [81] investigated 28 OECD nations from 1990 to 2014 and also showed that emissions could be reduced with innovation in OECD countries. But it took time to reach the full environmental effects of innovation in these economies. Mensah et al. [82] examined 28 OECD nations from 1990 to 2014. The results showed a valid EKC between innovation and emissions in these economies. A pollution haven was also seen in these nations, and higher income led to higher emissions before starting to decline after a cutoff. More innovation in renewable technology played the most significant role in reducing CO2 emission levels, suggesting higher government investment in renewable technology. Ganda [83] examined OECD countries from 2000–2014 and indicated that R&D reduced carbon emissions. However, triadic patents increased emissions in OECD countries.
Li et al. [84] collected data from Mexico, Nigeria, Indonesia, and Turkey (MINT) countries from 2000 to 2022. FMOLS and DOLS were used to test the panel data to identify a pattern in the way technological advancement, investment in green technology, and globalization could impact CO2 emissions. Non-REC led to higher emissions, but globalization and green innovation could help reduce emissions. Moreover, technical advancements also had a moderating effect on reducing emissions. However, the EKC was not substantiated. Du et al. [85] investigated MINT economies from 1990 to 2018 and validated the EKC. Moreover, REC reduced emissions, and high-tech exports and FDI raised emissions. Chhabra et al. [86] tested 23 middle-income countries by collecting data from 1994 to 2018. They showed that the EKC was substantiated in these countries. Thus, after a certain point of income growth, emissions started to fall. There was also a spillover effect from green technologies in the results.
Obovisa et al. [87] mentioned in their study that green technologies could reduce CO2 emissions in African countries. They also showed that REC had a similar impact on the environment and that fossil fuel technology had a degrading effect. Dauda et al. [88] collected data from nine African nations from 1990 to 2016 and corroborated the EKC between technological advancement and emissions. They also showed that emissions were reduced by an increase in human capital. Habiba et al. [89] investigated and substantiated that financial development raised emissions in 12 top-emitter countries. Additionally, trade openness and non-REC raised emission levels. However, REC and innovation could help reduce CO2 emissions. Hafeez et al. [90] applied the ARDL to the CO2 emissions model in highly polluted countries. The results of their panel data analysis showed that renewable energy demand could help reduce emission levels to a significant level. Innovation and financial markets could also help reduce these emission levels in selected countries, including India, Japan, China, and Russia. Amin et al. [91] collected data from N-11 countries and applied the CS-ARDL model. Eco-innovations, exports, and productivity reduced emission levels, and factors contributing to higher CO2 emissions were economic growth and imports.
Yunzhao [92] analyzed data from E7 countries from 1995 to 2018 to show that environmental taxes, green technology, and eco-innovation could help reduce emission levels. There was also evidence of feedback between the variables. They suggested that environmental policy needed rigorous review so that environmental issues could be tackled in a more structured way. Lingyan et al. [93] mentioned that CO2 emissions could be reduced by fiscal decentralization, and environmental innovation helped achieve similar goals. Hao and Chen [94] tested E7 countries by applying the ARDL and FMOLS models. REC and innovation led to a 0.357% decline in emissions. Inflation and economic growth, however, tended to increase emissions by 0.946%. Moving to renewable energy sources significantly reduced CO2 emissions in these E7 nations, and green innovation could also promote that decline. Jiang et al. [95] showed that in high-income countries, emissions tend to decline with an increase in income. Thus, the EKC hypothesis was substantiated. Moreover, innovation helped reduce emissions. Yan [96] collected data from 15 countries from 1992 to 2012 and showed that technological innovation reduced emission levels. Additionally, the role of clean and green innovative technologies was seen to be significantly notable in the reduction of emission levels.
In 10 Asian countries, Wenlong et al. [97] showed that institutional quality and trade openness could increase emissions, but technological innovation and energy efficiency could help mitigate those environmentally degrading effects. Similar to other studies mentioned above, they suggested that more investment in green technological advancement should be promoted so that environmental goals could be achieved. After collecting data from Asian countries from 2001 to 2019, Luo et al. [98] found that green technology and technological advancement, in general, led to environmental improvement by cutting down emission levels. They also validated the EKC hypothesis in the Asian countries under analysis and showed that it had an inverted U shape. The analysis also showed that FDI, population density, energy consumption, and trade increased emissions. Hao et al. [99] explored the 25 Asian economies from 1998 to 2019 and found that technological development and innovation reduced CO2 emissions. Rahman and Alam [100] investigated Asian countries from 1960 to 2020 and showed that a few factors, including corruption, globalization, growth, and technical innovations, could increase emissions, and REC could reduce these levels. Naz and Aslam [101] analyzed four South Asian economies from 1996 to 2019 and validated the EKC in the panel. Moreover, environmental innovations reduced CO2 emissions, and globalization and financial development increased CO2 emissions. In addition, the moderating role of governance was tested, and governance interaction with innovation helped reduce emissions. However, governance interacted with globalization and financial development to increase CO2 emissions.
Some studies also care about the spatial dimensions while investigating the innovation–emissions relationship. For example, Zhong et al. [102] tested data from the power industry in China from 1997 to 2020. Clean energy technologies and technological advancements reduced SO2 emissions and water and solid waste. Emissions also showed path dependencies, and fossil fuel technologies and energy-saving technologies seemed to have spatial effects on pollution. Liang et al. [25] collected data on the logistics industry in 30 Chinese provinces from 2002 to 2019. Outcomes from the panel analysis confirmed a U-shaped impact of technical innovations on emissions in the logistics industry. This rebound effect was also found in spillovers. Liu et al. [18] investigated 30 Chinese provinces from 2000 to 2019, and green innovations reduced CO2 intensity in China. There was also a spillover effect, which explained that innovation in one part of a country could help generate innovations in other surrounding areas and reduce emissions.
Cai et al. [22] examined 30 Chinese provinces from 2006 to 2019 and indicated in their panel data analysis that green technology led to environmental improvement, but the effect was not as obvious and straightforward. Thus, the results could vary on a regional basis. Emissions also seem to have a spatial and regional effect, and green technologies also showed spillovers in other regions. Factors such as energy consumption, economic development, and the industrial structure of a country increased emissions, leading to environmental degradation. Sheng et al. [23] analyzed data from 48 Chinese cities located in different regions from 2001 to 2015 and showed that urbanization and emissions had different shapes of association across the country. For instance, it was U-shaped, N-shaped, and inverted N-shaped in different regions. Urbanization also depended on innovation, which tended to improve environmental quality. CO2 emissions from urban areas also seemed to have a spillover effect, which negatively impacted their surrounding regions.
Chen et al. [24] examined 30 Chinese provinces from 2007–2019 and found the EKC between carbon intensity and green technological innovations in spatial analyses. It means that as more growth in green technology innovation took place, carbon intensity first increased before starting to fall after a certain cutoff. The same relationship was seen in neighboring regions. With low levels of green technology innovation, carbon emissions were high. Once technology started to grow, emissions gradually started to decline. The results had crucial policy implications and suggested that governments and companies invest more in green technologies to tackle environmental degradation. In the relationship between emissions and growth, Zhang and Chen [26] investigated 37 Chinese cities and found an N-shaped EKC in spatial analyses. Moreover, the EKC was also found between technological innovation and emissions.
In the MENA literature, Bilal et al. [15] conducted a panel data analysis on OBOR countries and divided OBOR countries into different regions, including six MENA countries from 1991 to 2019. Innovation could reduce emissions rates in these regions, including the MENA region, while globalization tended to increase emissions. There were some regional differences seen across countries as well. The analysis implied that investing more in technological innovation could moderate the effect of globalization on emissions and reduce environmental degradation. Dauda et al. [16] examined 18 countries from different regions, including seven MENA countries, BRICS, and G6 regions, from 1990 to 2016. The authors corroborated that innovations decreased emissions in G6 and raised them in the MENA and BRICS. Moreover, the EKC was validated in the BRICS nations. Salehi et al. [103] investigated six automobile companies in Iran from 2018 to 2019 using dynamic panel techniques and found that CO2 emissions reduced the stock prices, returns, and market value of automobile companies. Moreover, a unidirectional causality was also reported from CO2 emissions to stock returns.
The reviewed literature shows the importance of innovation and technological progress in reducing emissions in most studies. However, some studies also corroborated that innovation increased emissions [31,48,100]. These studies exposed the scale of the effect of innovation on emissions. For instance, increasing innovation can lead to higher economic activities and energy consumption, which can be responsible for higher pollution emissions. Thus, innovation had a positive effect on emissions. Moreover, Liang et al. [25] found a U-shaped impact of innovation on emissions. This study confirmed that innovation had a technique effect and initially reduced emissions. Later, the scale effect of innovation was found to be dominant over the technique effect, and innovation enhanced emissions through increasing economic activities. On the other hand, some studies also reported an inverted U-shaped impact of innovation on emissions [26,44,82,88]. These studies confirmed that innovation had a scale effect in the first stage and increased emissions. Later, innovation generated a more dominant technique effect over the scale effect and helped reduce emissions. The different results may also be claimed because of different countries’ samples, econometric techniques, and ways of modeling this relationship. Thus, the exact effect of innovation on emissions is an empirical question, which is explored in the MENA region [15,16]. However, both studies found the opposite results. For instance, Bilal et al. [15] reported a negative effect of innovation in six MENA countries, and Dauda et al. [16] reported a positive impact of innovation on emissions in seven MENA countries. Thus, the effect of innovation on emissions is inconclusive in the MENA literature, which needs further attention by using a maximum sample of countries from the MENA region. Moreover, MENA countries have nearby economies. Therefore, spatial dimensions are expected in the relationship between innovation and emissions, which are ignored by Bilal et al. [15] and Dauda et al. [16]. Therefore, the present study applies spatial econometrics to a sample of 17 MENA countries from 2000 to 2019 and re-investigates this relationship in spatial dimensions to claim an empirical contribution to the MENA literature.
3. Methods
Grossman and Krueger [9] suggested a nonlinear impact of economic growth on pollution, which is termed the EKC. This nonlinear relationship between economic growth and pollution is suggested because economic growth may increase the scale of economic activities and energy consumption. Thus, economic growth can be responsible for higher emissions in the first phase of economic growth [9]. However, economic growth may generate the technique and composition effects in the second stage of the EKC [10]. Thus, the present study also hypothesizes a nonlinear, inverted U-shaped relationship between economic growth and CO2 emissions to test the EKC hypothesis. Moreover, innovations can play a role in shaping the EKC. For instance, innovations can generate technologies that can increase overall economic activity and pollute the environment by having a scale effect. However, technical innovation would generate low-energy consumption technologies, which could enhance production with a lesser use of energy [8]. Moreover, technical innovation can also generate clean technologies [11] and may decrease energy intensity and emissions [12,13,14]. Thus, innovation can help generate technique and/or composition effects in an economy and reduce emissions. Thus, we hypothesize a negative effect of innovation on CO2 emissions. However, industrialization may increase energy consumption and pollute the environment [22,37,41,55,56]. Therefore, we hypothesize the positive effect of industrial value added on CO2 emissions. On the consumption side, urbanization can increase the demand for consumables, which can increase energy consumption and pollution emissions [23,37,63,78]. Thus, we hypothesize a positive effect of urbanization on CO2 emissions. Based on the above theoretical discussions, we hypothesize the following model:
CO2it shows the natural log of CO2 per capita. GDPCit shows a natural logarithm of Gross Domestic Product (GDP) per capita (constant 2015 USD). GDPCit2 is the square of GDPCit to analyze the EKC hypothesis in Equation (1). IVAit and URBit are the percentages of industrial value added and urban population in GDP and total population, respectively. PATit shows the total number of applied resident and nonresident patents in thousands, which is a proxy for innovation. URBit and IVAit are in percentages. Thus, these variables are not taken in logarithms. Patent data carries zero in some years. So, patents’ data is also not taken in logarithm. The period 2000–2019 is utilized for 17 MENA economies, and data on all variables are taken from the World Bank [4]. Table 1 shows the description of the variables.

Table 1.
Description of variables.
Equation (1) can be tested by using Fixed Effects (FE) with different country and time effects. The FE is regressed with FE-time, FE-country, and FE-both to verify which specification is superior to pooled Ordinary Least Square (OLS). The valid specification will be chosen by applying the Likelihood Ratio (LR) test. Moreover, the spatial autocorrelation may be expected in Equation (1) due to geographically nearby MENA economies, as Bockstael [19] argued for its importance in pollution studies. In a particular relationship between innovation and emissions, the literature suggests doing spatial analyses [18,22,23,24,25,26]. Thus, it seems pertinent to check the spatial autocorrelation in Equation (1) by using Lagrange Multiplier (LM) and LM robust tests as proposed by Debarsy and Ertur [104]. If we can find a statistically significant spatial autocorrelation, then we need to apply any spatial specification to have robust results. Thus, we apply the Spatial Durbin Model (SDM) to Equation (1), which is suggested by Elhorst [105], in the following way:
Equation (2) is the SDM specification and has been added to a weight matrix of 17 × 17 dimensions. Each element of the weight matrix carries the inverse of the distance (1/distance) between the capital cities of 17 MENA countries. The distance is calculated from one country (i) located in the MENA region to the other MENA countries (j) in kilometers. Zero is placed in the case of i = i. Later, the weight matrix is normalized with a procedure proposed by Kelejian and Prucha [106]. Moreover, it is pertinent to check the suitability of SDM over other spatial specifications to choose the best spatial specification for Equation (2). Thus, we will use the Wald test suggested by Elhorst [107]. The Wald test can be applied to the null hypotheses of and . The rejection of will suggest that SDM is better than Spatial Autoregressive (SAR). The rejection of may recommend that SDM is better than Spatial Error Model (SEM). In addition, the LR test will be used to verify the conclusions from the Wald test. The Stata 14.2 software is used for data estimations, and commands for estimation are taken from Belotti et al. [108].
4. Data Analysis
Figure 1 shows the spatial distribution of CO2 emissions per capita in the year 2019. Egypt, Morocco, and Tunisia are located in North Africa and are nearby countries with CO2 emissions less than 3. Jordan and Syria are also nearby countries in the same range. Algeria and Libya are neighboring countries and have emissions between 3 and 9.9. In the same emission bands, Iran and Iraq are neighboring countries, and Israel is also located near these countries. Oman, the UAE, and Saudi Arabia are neighboring countries and have CO2 emissions between 10 and 19.9. Moreover, Bahrain, Kuwait, and Qatar are nearby countries and have CO2 emissions of more than 20. Thus, Figure 1 displays the spatial connections between CO2 emissions in 17 MENA countries.
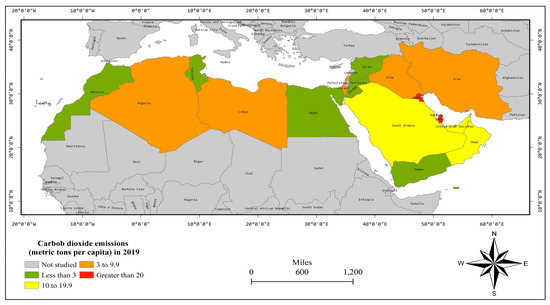
Figure 1.
Geographical distribution of CO2 emissions per capita in the year 2019. Source: Data were sourced from the World Bank [4] to develop this figure.
Before starting regression analysis, we perform Variance Inflation Factor (VIF) to test multicollinearity among the independent variables of the model. Table 2 shows that all VIF values are less than 5. Thus, we may conclude that independent variables do not carry the problem of multicollinearity.
Table 2.
Variance Inflation Factor (VIF).
At first, pooled regression is applied to Equation (1) and then tested using FE models in Table 3. Later, we use the LR test to verify that FE models are better than pooled regression. The LR test rejects the null hypothesis for the FE-country and FE-both effects. Thus, these models are preferable to pooled regression. These models confirm the EKC. Patents could not determine emissions, and industrial value added and urbanization have negative effects on emissions. Then, we apply LM and LM-robust tests to verify the spatial autocorrelation in the estimates. The results substantiate the spatial lag and error effects in all models, which is also proven by Figure 1. Thus, the non-spatial results in Table 3 are biased, and we shift our analyses toward spatial models.
Table 3.
Non-spatial results.
Table 4 shows the spatial results. At first, we estimate SDM with both FE and Random Effects (RE) and apply the Wald test. The null hypotheses and are rejected in both the FE and RE estimates. Thus, SDM cannot condense to SAR or SEM in both FE and RE estimates. Thus, SDM is proven to be the most appropriate spatial model in both estimates. Then, we apply the LR test to confirm the results of the Wald test and find the same evidence that SDM is preferred. However, the SAR results are also presented to verify the robustness of the SDM results, and the signs of the effects remain the same in both SAR and SDM estimations. Moreover, the Hausman test is applied to compare the FE and RE effects. The null hypothesis is accepted, which explains that RE is superior to FE. Thus, we continue the interpretation of SDM with RE.
Table 4.
Spatial results.
The results of coefficient estimates are ignored as they do not carry spatial effects. The direct estimates show the positive and negative effects of GDPCit and GDPCit2, respectively. Thus, the EKC is substantiated in the domestic economies of the investigated MENA region with an inverted U-shaped relationship. The indirect estimates display an inverse situation, and economic expansion shows a U-shaped impact on CO2 emissions in neighboring MENA countries. However, the net effect of economic expansion is inverted U-shaped in the total estimates. Accordingly, the EKC is proven in the spatial analysis of the whole MENA region, and our hypothesis of an inverted U-shaped relationship between economic growth and CO2 emissions is validated. Patents have a positive impact on emissions in direct estimates. In contrast, the spillover effect of patents is negative. On the whole, the net effect of patents is negative in the total estimates. Thus, the hypothesized negative effect of innovation on CO2 emissions in the whole region is validated. Industrial value added has a positive effect on direct and indirect estimates. Moreover, the indirect impact is found to be larger in magnitude than the direct impact. The total effect of industrial value added is positive, and industrialization is responsible for higher CO2 emissions. Hence, our hypothesized positive effect of industrial value added on CO2 emissions is validated in the whole region. Urbanization has a positive impact on direct estimates. However, our results show a negative effect of urbanization in indirect estimates, and urbanization has pleasant environmental spillovers in neighboring economies. Even so, the indirect impact is larger in magnitude than the direct impact. However, the total effect of urbanization is insignificant, and the hypothesis of a positive effect of urbanization is not validated in the whole region.
5. Discussion
The results show that the EKC is corroborated by an inverted U-shaped relationship between economic growth and CO2 emissions. Thus, economic growth after a certain threshold point could have pleasant environmental effects. Likewise, Zhang and Chen [26] also corroborated the EKC in spatial analyses of Chinese cities. Innovation has a positive effect on CO2 emissions in the direct estimates. Thus, innovation has a scale effect on CO2 emissions in the local economies of innovation producers. It means that innovation is responsible for increasing economic activities, energy consumption, and CO2 emissions. Some literature has also shared the same finding that innovation increased emissions [31,48,100]. Moreover, a few other studies reported the U-shaped effect [25] and the inverted U-shaped effect [24,44,88] of innovation on emissions. However, our results indicate that increasing innovation is increasing CO2 emissions, which may be due to the increasing overall energy consumption of economic activities. It seems that the level of innovation is still low in MENA countries, and the scale effect of innovation is dominant over the technique effect. Hence, increasing innovation could not generate sufficient clean technologies, and energy efficiency could not be achieved at a level to support a clean environment. So, innovation contributes to emissions by increasing aggregate energy consumption in innovation-generating domestic economies.
The indirect estimates show a negative effect of innovation on CO2 emissions. Thus, increasing patents is helping to reduce emissions in neighboring MENA countries and has positive environmental consequences for neighboring economies. This finding is matched with the theoretical arguments of Yin et al. [17] that innovation diffuses knowledge through spillover effects. In the empirical analyses, a few studies also corroborated the spillovers of regional innovation and green technologies on the emissions of neighboring regions in China [18,22,102]. Moreover, the total effect of innovation is negative. Thus, increasing innovation reduces CO2 emissions and has pleasant environmental outcomes in the whole MENA region. The most reviewed literature also substantiated the negative impact of innovation on emissions. Particularly in the MENA literature, Bilal et al. [15] reported a negative impact of innovation on CO2 emissions in six MENA countries, and Dauda et al. [16] stated a positive impact of innovation on CO2 emissions in seven MENA countries. Thus, the MENA literature is inconclusive regarding the exact relationship between innovation and emissions due to a limited sample of MENA countries. However, we find a negative indirect effect and a positive direct effect of innovations on CO2 emissions in MENA countries. Thus, innovations are damaging the environment of the patent producers’ MENA economies. However, patents are improving the environment of neighboring nations, with spillover effects across the whole MENA region. Thus, the results of the present study provide some new insights into this relationship by applying a spatial model and exploring a large sample of 17 MENA countries.
The results show the positive direct and indirect effects of industrial value added on CO2 emissions. Thus, the industrial sector shows a scale effect and is increasing CO2 emissions in domestic and neighboring economies. So, industrialization has environmental concerns for both domestic and neighboring countries. Moreover, the indirect effect is found to be greater than the direct effect. Therefore, neighboring countries are affected on a larger scale by the industrial activities of their domestic economies. Along the same line, many studies corroborated the positive effect of industrialization on emissions [22,37,41,55,56]. In contrast, Zhu [36] reported a negative impact of industrialization on emissions [36]. Urbanization has a positive impact on direct estimates. Thus, urbanization has a scale effect on domestic economies. Along the same line, many studies have substantiated the positive impact of urbanization on emissions [23,56,60,63,78]. However, our results show a negative effect of urbanization in indirect estimates. Thus, increasing urbanization increases CO2 emissions in domestic economies but has pleasant environmental spillovers in neighboring economies. Even so, the indirect impact is larger in magnitude than the direct impact. Sheng et al. [23] also corroborated the negative spillover effect of urbanization on emissions. However, the total effect of urbanization is found to be statistically insignificant in our estimates.
6. Conclusions
Technological innovations can reduce pollution if the technique effect of innovation surpasses the scale effect. We examine the effects of economic growth, patents, industrialization, and urbanization on CO2 emissions in 17 MENA economies by doing spatial analyses. The results substantiate the EKC’s impact on local economies and the whole MENA region. Nevertheless, the spillover effect of economic growth is U-shaped in indirect estimates. Patents increase CO2 emissions in direct estimates and have environmental concerns for local economies through the scale effect of innovation. However, patents reduce CO2 emissions with an indirect effect, and patents are reducing CO2 emissions in neighboring MENA countries. Moreover, the indirect impact of patents is found to be greater than the direct impact. Thus, the net effect of patents is negative in total estimates, and innovation helps decrease CO2 emissions in the whole MENA region. In prior studies, Dauda et al. [16] found a positive impact of innovation on emissions in seven MENA countries. However, Bilal et al. [15] substantiated the negative effect of innovation on emissions in six MENA countries. Both studies used a limited sample of MENA countries and also ignored the possible spatial dimensions in analyses of geographically nearby economies in the MENA region. Therefore, the present study tests and substantiates the spatial autocorrelation in the non-spatial models. Then, spatial techniques are utilized to conclude the results. The study finds a positive effect of innovation on CO2 emissions in domestic economies and a negative spillover effect of innovation on CO2 emissions in neighboring economies. Thus, the present study contributes to the MENA literature by reporting the positive direct and negative indirect effects of innovation on CO2 emissions. Industrial value added in a country increases CO2 emissions in domestic and neighboring MENA countries. Additionally, the net effect of industrialization on emissions is also positive in the whole MENA region, which shows that the industrial sector has environmental concerns for the MENA region. Urbanization increases CO2 emissions in domestic economies but reduces emissions in neighboring MENA economies through its spillover effects. Thus, urbanization is harmful to the domestic environment but has pleasant environmental effects in neighboring MENA economies. The total effect of urbanization is statistically insignificant, and urbanization has neutral environmental effects for the whole MENA region.
The results specify that innovation increases CO2 emissions in domestic economies. It means that the scale effect of innovation is dominant over the technique effect of innovation in domestic economies. Thus, MENA countries are suggested to finance the innovations, which could promote the technique effect and reduce CO2 emissions in their domestic economies. However, innovation has a negative effect on CO2 emissions in the whole MENA region, and innovation is supporting a clean environment in the whole MENA region as well. We suggest MENA countries develop a common innovation fund in the region to finance patents and technological innovation activities in any country in this region. Moreover, the results show that the industrial sector has environmental concerns in both domestic and neighboring economies. It means that the scale effect of industrialization is dominant over the technique effect. To promote the technique effect in the industrial sector, MENA countries are advised to give tax concessions and financial support for the use of clean technologies and renewable energy sources in industries. In this way, the negative environmental effects of industrial value added may turn into positive environmental effects, which could be helpful in protecting the environment from industrial activities. Moreover, the composition of the industry should be changed. For this purpose, the government should tax the dirty industries with high pollution levels and may use this revenue to subsidize the industries with low levels of pollution. Urbanization increases emissions in domestic economies. So, low-energy-consumption vehicles and urban items should be subsidized. Moreover, items with high energy consumption should be taxed. So, the negative environmental effects of urbanization can be reduced in domestic economies.
Author Contributions
Conceptualization, H.M.; validation, H.M. investigation, H.M. and M.F., resources, H.M.; data curation, N.S.; writing—original draft preparation, H.M., M.F., N.S., A.H.A. and M.A.; writing—review and editing, H.M., M.F., N.S., A.H.A. and M.A.; visualization, H.M.; supervision, H.M.; project administration, H.M.; funding acquisition, H.M. All authors have read and agreed to the published version of the manuscript.
Funding
The authors extend their appreciation to the Deputyship for Research & Innovation, Ministry of Education in Saudi Arabia for funding this research work through the project number (IF2/PSAU/2022/02/21824).
Institutional Review Board Statement
The study did not require ethical approval.
Informed Consent Statement
Not applicable.
Data Availability Statement
The data are available from the corresponding author upon request.
Conflicts of Interest
The authors declare no conflict of interest.
References
- Abbass, R.A.; Kumar, P.; El-Gendy, A. An overview of monitoring and reduction strategies for health and climate change related emissions in the Middle East and North Africa region. Atmos. Environ. 2018, 175, 33–43. [Google Scholar] [CrossRef]
- Shahbaz, M.; Trabelsi, N.; Tiwari, A.K.; Abakah, E.J.A.; Jiao, Z. Relationship between green investments, energy markets, and stock markets in the aftermath of the global financial crisis. Energy Econ. 2021, 104, 105655. [Google Scholar] [CrossRef]
- Hak, T.; Janouskova, S.; Moldan, B. Sustainable Development Goals: A need for relevant indicators. Ecol. Indicat. 2016, 60, 565–573. [Google Scholar] [CrossRef]
- World Bank. World Development Indicators. The World Bank, Washington, D.C. 2022. Available online: https://databank.worldbank.org/source/worlddevelopment-indicators (accessed on 16 December 2022).
- Timmerberg, S.; Sanna, A.; Kaltschmitt, M.; Finkbeiner, M. Renewable electricity targets in selected MENA countries–Assessment of available resources, generation costs and GHG emissions. Energy Rep. 2019, 5, 1470–1487. [Google Scholar] [CrossRef]
- Cheng, Y.; Yao, X. Carbon intensity reduction assessment of renewable energy technology innovation in China: A panel data model with cross-section dependence and slope heterogeneity. Renew. Sustain. Energy Rev. 2021, 135, 110157. [Google Scholar] [CrossRef]
- Geels, F.W.; Schwanen, T.; Sorrell, S.; Jenkins, K.; Sovacool, B.K. Reducing energy demand through low carbon innovation: A sociotechnical transitions perspective and thirteen research debates. Energy Res. Soc. Sci. 2018, 40, 23–35. [Google Scholar] [CrossRef]
- Murphy, R. The emerging hyper carbon reality, technological and post-carbon utopias, and social innovation to low-carbon societies. Curr. Sociol. 2015, 63, 317–338. [Google Scholar] [CrossRef]
- Grossman, G.M.; Krueger, A.B. Environmental impacts of the North American Free Trade Agreement. In NBER Working Paper 3914; National Bureau of Economic Research: Cambridge, MA, USA, 1991. [Google Scholar] [CrossRef]
- Mahmood, H.; Furqan, M.; Hassan, M.S.; Rej, S. The Environmental Kuznets Curve (EKC) hypothesis in China: A review. Sustainability 2023, 15, 6110. [Google Scholar] [CrossRef]
- Bai, C.; Du, K.; Yu, Y.; Feng, C. Understanding the trend of total factor carbon productivity in the world: Insights from convergence analysis. Energy Econ. 2019, 81, 698–708. [Google Scholar] [CrossRef]
- Mo, J.Y. Do environmental policy and innovation improve carbon productivity? Evidence from the Korean Emission Trading Scheme. Energy Environ. 2023, 34, 445–462. [Google Scholar] [CrossRef]
- Meng, M.; Niu, D. Three-dimensional decomposition models for carbon productivity. Energy 2012, 46, 179–187. [Google Scholar] [CrossRef]
- Zhang, H.; Xu, K. Impact of environmental regulation and technical progress on industrial carbon productivity: An approach based on proxy measure. Sustainability 2016, 8, 819. [Google Scholar] [CrossRef]
- Bilal, A.; Li, X.; Zhu, N.; Sharma, R.; Jahanger, A. Green technology innovation, globalization, and CO2 emissions: Recent insights from the OBOR economies. Sustainability 2022, 14, 236. [Google Scholar] [CrossRef]
- Dauda, L.; Long, X.; Mehsah, C.; Salman, M. The Effects of Economic Growth and Innovation on CO2 Emissions in Different Regions. Environ. Sci. Pollut. Res. 2019, 26, 15028–15038. [Google Scholar] [CrossRef] [PubMed]
- Yin, H.; Zhao, J.; Xi, X.; Zhang, Y. Evolution of regional low-carbon innovation systems with sustainable development: An empirical study with big-data. J. Clean. Prod. 2019, 209, 1545–1563. [Google Scholar] [CrossRef]
- Liu, J.; Duan, Y.; Zhong, S. Does Green Innovation Suppress Carbon Emission Intensity? New Evidence from China. Environ. Sci. Pollut. Res. 2022, 29, 86722–86743. [Google Scholar] [CrossRef]
- Bockstael, N. Modelling economics and ecology: The importance of a spatial perspective. Am. J. Agric. Econ. 1996, 40, 1168–1180. [Google Scholar] [CrossRef]
- Maddison, D. Modelling sulphur emissions in Europe: A spatial econometric approach. Oxf. Econ. Pap. 2007, 59, 726–743. [Google Scholar] [CrossRef]
- Anselin, L.; Le Gallo, J.; Jayet, H. Spatial panel econometrics. In The Econometrics of Panel Data; Matyas, L., Sevestre, P., Eds.; Springer: Berlin/Heidelberg, Germany, 2008; pp. 625–660. [Google Scholar] [CrossRef]
- Cai, A.; Zheng, S.; Cai, L.; Yang, H.; Comite, U. How Does Green Technology Innovation Affect Carbon Emissions? A Spatial Econometric Analysis of China’s Provincial Panel Data. Front. Environ. Sci. 2021, 9, 630. [Google Scholar] [CrossRef]
- Sheng, Y.; Miao, Y.; Song, J.; Shen, H. The Moderating Effect of Innovation on the Relationship between Urbanization and CO2 Emissions: Evidence from Three Major Urban Agglomerations in China. Sustainability 2019, 11, 1633. [Google Scholar] [CrossRef]
- Chen, H.; Yi, J.; Chen, A.; Peng, D.; Yang, J. Green Technology Innovation and CO2 Emission in China: Evidence from a Spatial-Temporal Analysis and a Nonlinear Spatial Durbin Model. Energy Policy 2023, 172, 113338. [Google Scholar] [CrossRef]
- Liang, H.; Lin, S.; Wang, J. Impact of Technological Innovation on Carbon Emissions in China’s Logistics Industry: Based on the Rebound Effect. J. Clean. Prod. 2022, 377, 134371. [Google Scholar] [CrossRef]
- Zhang, Y.; Chen, X. Spatial and Nonlinear Effects of New-Type Urbanization and Technological Innovation on Industrial Carbon Dioxide Emission in Yangtze River Delta. Environ. Sci. Pollut. Res. 2022, 30, 29243–29257. [Google Scholar] [CrossRef]
- Shahbaz, M.; Raghutla, C.; Song, M.; Zameer, H.; Jiao, Z. Public-private partnerships investment in energy as new determinant of CO2 emissions: The role of technological innovations in China. Energy Econ. 2020, 86, 104664. [Google Scholar] [CrossRef]
- Li, Y.; Zhang, C.; Li, S.; Usman, A. Energy Efficiency and Green Innovation and its Asymmetric Impact on CO2 Emission in China: A New Perspective. Environ. Sci. Pollut. Res. 2022, 29, 47810–47817. [Google Scholar] [CrossRef]
- Yang, J.; Sun, Y.; Sun, H.; Lau, C.; Apergis, N.; Zhang, K. Role of Financial Development, Green Technology Innovation, and Macroeconomic Dynamics toward Carbon Emissions in China: Analysis Based on Bootstrap ARDL Approach. Front. Environ. Sci. 2022, 10, 407. [Google Scholar] [CrossRef]
- Nguyen, V.C.; Vu, D.B.; Nguyen, T.H.Y.; Pham, C.D.; Huynh, T.N. Economic growth, financial development, transportation capacity, and environmental degradation: Empirical evidence from Vietnam. J. Asian Financ. Econ. Bus. 2021, 8, 93–104. [Google Scholar]
- Liu, X.; Chang, S.; Bae, J. Nonlinear Analysis of Technological Innovation and Electricity Generation on Carbon Dioxide Emissions in China. J. Clean. Prod. 2022, 343, 131021. [Google Scholar] [CrossRef]
- Ulucak, R. Analyzing Energy Innovation-Emissions Nexus in China: A Novel Dynamic Simulation Method. Energy 2022, 244, 123010. [Google Scholar]
- Jiemin, H.; Chen, W. The Impact of Private Sector Energy Investment, Innovation and Energy Consumption on China’s Carbon Emissions. Renew. Energy 2022, 195, 1291–1299. [Google Scholar] [CrossRef]
- Ma, Q.; Murshed, M.; Khan, Z. The nexuses between energy investments, technological innovations, emission taxes, and carbon emissions in China. Energy Policy 2021, 155, 112345. [Google Scholar] [CrossRef]
- Kuang, H.; Akmal, Z.; Li, F. Measuring the Effects of Green Technology Innovations and Renewable Energy Investment for Reducing Carbon Emissions in China. Renew. Energy 2022, 197, 1–10. [Google Scholar] [CrossRef]
- Zhu, X. Have Carbon Emissions been Reduced Due to the Upgrading of Industrial Structure? Analysis of the Mediating Effect Based on Technological Innovation. Environ. Sci. Pollut. Res. 2022, 29, 54890–54901. [Google Scholar] [CrossRef]
- Gao, P.; Wang, Y.; Zou, Y.; Su, X.; Che, X.; Yang, X. Green Technology Innovation and Carbon Emissions Nexus in China: Does Industrial Structure Upgrading Matter. Front. Psychol. 2022, 13, 951172. [Google Scholar] [CrossRef]
- Gu, J. Sharing Economy, Technological Innovation, and Carbon Emissions: Evidence from Chinese Cities. J. Innov. Knowl. 2022, 7, 100228. [Google Scholar] [CrossRef]
- Liu, R.; Zhu, X.; Zhang, M.; Hu, C. Innovation Incentives and Urban Carbon Dioxide Emissions: A Quasi-Natural Experiment based on Fast-Tracking Green Patent Applications in China. J. Clean. Prod. 2022, 382, 135444. [Google Scholar] [CrossRef]
- You, X.; Chen, Z. Interaction and Mediation Effects of Economic Growth and Innovation Performance on Carbon Emissions: Insights from 282 Chinese Cities. Sci. Total Environ. 2022, 831, 154910. [Google Scholar] [CrossRef] [PubMed]
- Li, Z.; Zhou, Y.; Zhang, C. The Impact of Population Factors and Low-Carbon Innovation on Carbon Dioxide Emissions: A Chinese City Perspective. Environ. Sci. Pollut. Res. 2022, 29, 72853–72870. [Google Scholar] [CrossRef]
- Lin, B.; Ma, R. Green Technology Innovations, Urban Innovation Environment and CO2 Emission Reduction in China: Fresh Evidence from a Partially Linear Functional-coefficient Panel Model. Technol. Forecast. Soc. Chang. 2022, 176, 121434. [Google Scholar] [CrossRef]
- Dong, X.; Zhong, Y.; Liu, M.; Xiao, W.; Qin, C. Research on the Impacts of Dual Environmental Regulation on Regional Carbon Emissions under the Goal of Carbon Neutrality-the Intermediary Role of Green Technology Innovation. Front. Environ. Sci. 2022, 10, 1709. [Google Scholar] [CrossRef]
- Li, W.; Elheddad, M.; Doytch, N. The Impact of Innovation on Environmental Quality: Evidence for the Non-Linear Relationship of Patents and CO2 Emissions in China. J. Environ. Manag. 2021, 292, 112781. [Google Scholar] [CrossRef]
- Wang, J.; Wang, C.; Yu, S.; Li, M.; Cheng, Y. Coupling Coordination and Spatiotemporal Evolution between Carbon Emissions, Industrial Structure, and Regional Innovation of Countries in Shandong Province. Sustainability 2022, 14, 7484. [Google Scholar] [CrossRef]
- Yuan, B.; Li, C.; Yin, H.; Zeng, M. Green Innovation and China’s CO2 Emissions-The Moderating Effect of Institutional Quality. J. Environ. Plan. Manag. 2022, 65, 877–906. [Google Scholar] [CrossRef]
- Zheng, R.; Cheng, Y.; Liu, H.; Chen, W.; Chen, X.; Wang, Y. The Spatiotemporal Distribution and Drivers of Urban Carbon Emission Efficiency: The Role of Technological Innovation. Int. J. Environ. Res. Public Health 2022, 19, 9111. [Google Scholar] [CrossRef] [PubMed]
- Adebayo, T.; Oladipupo, S.; Adeshola, I.; Rjoub, H. Walvet Analysis of Impact of Renewable Energy Consumption and Technological Innovation on CO2 Emissions: Evidence from Portugal. Environ. Sci. Pollut. Res. 2022, 29, 23887–23904. [Google Scholar] [CrossRef]
- Xin, D.; Ahmad, M.; Lei, H.; Khattak, S. Do Innovation in Environmental-Related Technologies Asymmetrically Affect Carbon Dioxide Emissions in the US? Technol. Soc. 2021, 67, 101761. [Google Scholar] [CrossRef]
- Su, C.; Pang, D.; Tao, R.; Shao, X.; Umar, M. Renewable Energy and Technological Innovation: Which One is the Winner in Promoting Net-Zero Emissions? Technol. Forecast. Soc. Chang. 2022, 182, 121798. [Google Scholar] [CrossRef]
- Adebayo, T.; Adedoyin, F.; Kirikkaleli, D. Toward a Sustainable Environment: Nexus between Consumption-based Carbon Emissions, Economic Growth, and Renewable Energy and Technological Innovation in Brazil. Environ. Sci. Pollut. Res. 2021, 28, 52272–52282. [Google Scholar] [CrossRef]
- Jordaan, S.; Romo-Rabago, E.; McLeary, R.; Reidy, L.; Nazari, J.; Herremans, I. The Role of Energy Technology Innovation in Reducing Greenhouse Gas Emissions: A Case Study of Canada. Renew. Sustain. Energy Rev. 2017, 78, 1397–1409. [Google Scholar] [CrossRef]
- Jiang, Q.; Khattak, S. Modeling the Impact of Innovation in Marine Energy Generation-related Technologies on Carbon Dioxide Emissions in South Korea. J. Environ. Manag. 2023, 326, 116818. [Google Scholar] [CrossRef]
- Raihan, A.; Begam, R.; Said, M.; Pereira, J. Relationship between Economic Growth, Renewable Energy Use, Technological Innovation, and Carbon Emission toward Achieving Malaysia’s Paris Agreement. Environ. Syst. Decis. 2022, 42, 586–607. [Google Scholar] [CrossRef]
- Udeagha, M.; Ngepah, N. The Asymmetric Effect of Technological Innovation on CO2 Emissions in South Africa: New Evidence from the QARDL Approach. Front. Environ. Sci. 2022, 10, 985719. [Google Scholar] [CrossRef]
- Du, K.; Li, P.; Yan, Z. Do Green Technology Innovations Contribute to Carbon Dioxide Emission Reduction? Empirical Evidence from Patent Data. Technol. Forecast. Soc. Chang. 2019, 146, 297–303. [Google Scholar] [CrossRef]
- Yu, D.; Soh, W.; Noordin, A.; Yahya, D.H.; Latif, B. The Impact of Innovation on CO2 Emissions: The Threshold Effect of Financial Development. Front. Environ. Sci. 2022, 10, 980267. [Google Scholar] [CrossRef]
- Liobikienė, G.; Butkus, M. Scale, composition, and technique effects through which the economic growth, foreign direct investment, urbanization, and trade affect greenhouse gas emissions. Renew. Energy 2019, 132, 1310–1322. [Google Scholar] [CrossRef]
- Saqib, N. Asymmetric linkages between renewable energy, technological innovation, and carbon-dioxide emission in developed economies: Non-linear ARDL analysis. Environ. Sci. Pollut. Res. 2022, 29, 60744–60758. [Google Scholar] [CrossRef]
- Awan, A.; Alnour, M.; Jahanger, A.; Onwe, J. Do Technological Innovation and Urbanization Mitigate Carbon Dioxide Emissions from the Transport Sector? Technol. Soc. 2022, 71, 102128. [Google Scholar] [CrossRef]
- Vitenu-Sackey, P.; Acheampong, T. Impact of Economic Policy Uncertainty, Energy Intensity, Technological Innovation and R&D on CO2 Emissions: Evidence from a Panel of 18 Developed Economies. Environ. Sci. Pollut. Res. 2022, 29, 87426–87445. [Google Scholar]
- Rahman, M.; Alam, K.; Velayutham, E. Reduction of CO2 Emissions: The Role of Renewable Energy, Technological Innovation and Export Quality. Energy Rep. 2022, 8, 2793–2805. [Google Scholar] [CrossRef]
- Abid, A.; Mehmood, U.; Haq, Z.; Tariq, S. The Effect of Technological Innovation, FDI, and Financial Development on CO2 Emission: Evidence from the G8 Countries. Environ. Sci. Pollut. Res. 2022, 29, 11654–11662. [Google Scholar] [CrossRef]
- Rehman, E.; Rehman, S.; Mumtaz, A.; Jianglin, Z.; Shahiman, M. The Influencing Factors of CO2 Emissions and the Adoption of Eco-Innovation across G-7 Economies: A Novel Hybrid Mathematical and Statistical Approach. Front. Environ. Sci. 2022, 10, 98892. [Google Scholar] [CrossRef]
- Shah, M.; Foglia, M.; Shahzad, U.; Fareed, Z. Green Innovation, Resource Price and Carbon Emissions during the COVID-19 Times: New Findings from Wavelet Local Multiple Correlation Analysis. Technol. Forecast. Soc. Chang. 2022, 184, 121957. [Google Scholar] [CrossRef]
- Ostadzad, A. Innovation and Carbon Emissions: Fixed-Effects Panel Threshold Model Estimation for Renewable Energy. Renew. Energy 2022, 198, 602–617. [Google Scholar] [CrossRef]
- Qureshi, M.; Ahsan, T.; Gull, A. Does Country-Level Eco-Innovation Help Reduce Corporate CO2 Emissions? Evidence from Europe. J. Clean. Prod. 2022, 379, 134732. [Google Scholar] [CrossRef]
- Khurshid, A.; Rauf, A.; Qayyum, S.; Calin, A.; Duan, W. Green Innovation and Carbon Emissions: The Role of Carbon Pricing and Environmental Policies in Attaining Sustainable Development Targets of Carbon Mitigation—Evidence from Central-Eastern Europe. Environ. Dev. Sustain. 2022. [Google Scholar] [CrossRef]
- Ahmed, N.; Areche, F.; Nieto, D.; Borda, R.; Gonzales, B.; Senkus, P.; Skrzypek, A. Nexus between Cyclical Innovation in Green Technologies and CO2 Emissions in Nordic Countries: Consent toward Environment Sustainability. Sustainability 2022, 14, 11768. [Google Scholar] [CrossRef]
- Ma, X.; Arif, A.; Kaur, P.; Jain, V.; Refiana, S.; Mughal, N. Revealing the Effectiveness of Technological Innovation Shocks on CO2 Emissions in BRICS: Emerging Challenges and Implications. Environ. Sci. Pollut. Res. 2022, 29, 47373–47381. [Google Scholar] [CrossRef]
- Abbas, S.; Gui, P.; Chen, A.; Ali, N. The Effect of Renewable Energy Development, Market Regulation, and Environmental Innovation on CO2 Emissions in BRICS Countries. Environ. Sci. Pollut. Res. 2022, 29, 59483–59501. [Google Scholar] [CrossRef]
- Khan, H.; Weili, L.; Khan, I. Examining the Effect of Information and Communication Technology, Innovations, and Renewable Consumption on CO2 Emission: Evidence from BRICS Countries. Environ. Sci. Pollut. Res. 2023, 29, 47696–47712. [Google Scholar] [CrossRef]
- Zhang, H. Technology Innovation, Economic Growth, and Carbon Emissions in the Context of Carbon Neutrality: Evidence from BRICS. Sustainability 2021, 13, 11138. [Google Scholar] [CrossRef]
- Jiang, Q.; Rahman, Z.; Zhang, X.; Islam, M. An Assessment of the Effect of Green Innovation, Income, and Energy Use on Consumption-based CO2 Emissions: Empirical Evidence from Emerging Nations BRICS. J. Clean. Prod. 2022, 365, 132636. [Google Scholar] [CrossRef]
- Meng, Y.; Wu, H.; Wang, Y.; Duan, Y. International Trade Diversification, Green Innovation, and Consumption-based Carbon Emissions: The Role of Renewable Energy for Sustainable Development in BRICST Countries. Renew. Energy 2022, 198, 1243–1253. [Google Scholar] [CrossRef]
- Jiang, Y.; Khan, H. The relationship between renewable energy consumption, technological innovations, and carbon dioxide emission: Evidence from two-step system GMM. Environ. Sci. Pollut. Res. 2022, 30, 4187–4202. [Google Scholar] [CrossRef] [PubMed]
- Li, S.; Raza, A.; Si, R.; Huo, X. International Trade, Chinese Foreign Direct Investment and Green Innovation Impact on Consumption-based CO2 Emissions: Empirical Estimation Focusing on BRI Countries. Environ. Sci. Pollut. Res. 2022, 29, 89014–89028. [Google Scholar] [CrossRef] [PubMed]
- Mensah, C.; Long, X.; Dauda, L.; Boamah, K.; Salman, M. Innovation and CO2 Emissions: The Complimentary Role of Eco-Patent and Trademark in the OECD Economies. Environ. Sci. Pollut. Res. 2019, 26, 22878–22891. [Google Scholar] [CrossRef]
- Yildirim, D.; Esen, O.; Yildirim, S. The Nonlinear Effects of Environmental Innovation on Energy Sector-based Carbon Dioxide Emissions in OECD Countries. Technol. Forecast. Soc. Chang. 2022, 182, 121800. [Google Scholar] [CrossRef]
- Khattak, S.; Ahmad, M. The Cyclical Impact of Innovation in Green and Sustainable Technologies on Carbon Dioxide Emissions in OECD Economies. Environ. Sci. Pollut. Res. 2022, 29, 33809–33825. [Google Scholar] [CrossRef]
- Alvarez-Herranz, A.; Balsalobre, D.; Cantos, J.; Shahbaz, M. Energy Innovations-GHG Emissions Nexus: Fresh Empirical Evidence from OECD Countries. Energy Policy 2017, 100, 90–100. [Google Scholar] [CrossRef]
- Mensah, C.; Long, X.; Boamah, K.; Bediako, I.; Dauda, L.; Salman, M. The Effect of Innovation on CO2 Emissions of OECD Countries from 1990-2014. Environ. Sci. Pollut. Res. 2018, 25, 29678–29698. [Google Scholar] [CrossRef]
- Ganda, F. The Impact of Innovation and Technology Investments on Carbon Emissions in Selected Organization for Economic Co-Operation and Development Countries. J. Clean. Prod. 2019, 217, 469–483. [Google Scholar] [CrossRef]
- Li, S.; Yu, Y.; Jahanger, A.; Usman, M.; Ning, Y. The Impact of Green Investment, Technological Innovation and Globalization on CO2 Emissions: Evidence from MINT Countries. Front. Environ. Sci. 2022, 10, 156. [Google Scholar] [CrossRef]
- Du, L.; Jiang, H.; Adebayo, T.S.; Awosusi, A.A.; Razzaq, A. Asymmetric effects of high-tech industry and renewable energy on consumption-based carbon emissions in MINT countries. Renew. Energy 2022, 196, 1269–1280. [Google Scholar] [CrossRef]
- Chhabra, M.; Giri, A.; Kumar, A. Do Technological Innovations and Trade Openness Reduce CO2 Emissions? Evidence from Selected Middle-Income Countries. Environ. Sci. Pollut. Res. 2022, 29, 65723–65738. [Google Scholar] [CrossRef]
- Obovisa, E.; Chen, H.; Mensah, I. The Impact of Green Technological Innovation and Institutional Quality on CO2 Emissions in African Countries. Technol. Forecast. Soc. Chang. 2022, 180, 121670. [Google Scholar] [CrossRef]
- Dauda, L.; Long, X.; Mensah, C.; Salman, M.; Boumah, K.; Ampon-Wireko, S.; Dodbe, C. Innovation, Trade Openness, and CO2 Emissions in Selected Countries in Africa. J. Clean. Prod. 2021, 281, 125143. [Google Scholar] [CrossRef]
- Habiba, U.; Xinbang, C.; Anwar, A. Do Green Technology Innovations, Financial Development, and Renewable Energy Use Help to Curb Carbon Emissions? Renew. Energy 2022, 193, 1082–1093. [Google Scholar] [CrossRef]
- Hafeez, M.; Rehman, S.; Faisal, C.; Yang, J.; Ullah, S.; Kaium, M.; Malik, M. Financial Efficiency and Its Impact on Renewable Energy Demand and CO2 Emissions: Do Eco-Innovations Matter for Highly Polluted Asian Economies? Sustainability 2022, 14, 10950. [Google Scholar] [CrossRef]
- Amin, M.; Zhou, S.; Safi, A. The Nexus between Consumption-based Carbon Emissions, Trade, Eco-Innovation, and Energy Productivity: Empirical Evidence from N-11 Economies. Environ. Sci. Pollut. Res. 2022, 29, 39239–39248. [Google Scholar] [CrossRef] [PubMed]
- Yunzhao, L. Modelling the Role of Eco-Innovation, Renewable Energy and Environmental Taxes in Carbon Emissions Reduction in E-7 Economies: Evidence from Advance Panel Estimations. Renew. Energy 2022, 190, 309–318. [Google Scholar] [CrossRef]
- Lingyan, M.; Zhao, Z.; Malik, H.; Razzaq, A.; An, H.; Hassan, M. Asymmetric Impact of Fiscal Decentralization and Environmental Innovation on Carbon Emissions: Evidence from Highly Decentralized Countries. Energy Environ. 2022, 33, 752–782. [Google Scholar] [CrossRef]
- Hao, Y.; Chen, P. Do Renewable Energy Consumption and Green Innovation Help Curb CO2 Emissions? Evidence from E7 Countries. Environ. Sci. Pollut. Res. 2022, 30, 21115–21131. [Google Scholar] [CrossRef] [PubMed]
- Jiang, W.; Cole, M.; Sun, J.; Wang, S. Innovation, Carbon Emissions and the Pollution Haven Hypothesis: Climate Capitalism and Global Re-Interpretations. J. Environ. Manag. 2022, 307, 114465. [Google Scholar] [CrossRef] [PubMed]
- Yan, Z.; Yi, L.; Du, K.; Yang, Z. Impacts of Low-Carbon Innovation and its Heterogeneous Components on CO2 Emissions. Sustainability 2017, 9, 548. [Google Scholar] [CrossRef]
- Wenlong, Z.; Tien, N.; Sibghatullah, A.; Asih, D.; Soelton, M.; Ramli, Y. Impact of Energy Efficiency, Technology Innovation, Institutional Quality, and Trade Openness on Greenhouse Gas Emissions in Ten Asian Economies. Environ. Sci. Pollut. Res. 2023, 30, 43024–43039. [Google Scholar] [CrossRef]
- Luo, R.; Ullah, S.; Ali, K. Pathway towards Sustainability in Selected Asian Countries: Influence of Green Investment, Technology Innovations, and Economic Growth on CO2 Emissions. Sustainability 2021, 13, 12873. [Google Scholar] [CrossRef]
- Hao, W.; Rasul, F.; Bhatti, Z.; Hassan, M.S.; Ahmed, I.; Asghar, N. A technological innovation and economic progress enhancement: An assessment of sustainable economic and environmental management. Environ. Sci. Pollut. Res. 2021, 28, 28585–28597. [Google Scholar] [CrossRef]
- Rahman, M.; Alam, K. Effects of Corruption, Technological Innovation, Globalization, and Renewable Energy on Carbon Emissions in Asian Countries. Util. Policy 2022, 79, 101448. [Google Scholar] [CrossRef]
- Naz, A.; Aslam, M. Green innovation, globalization, financial development, and CO2 emissions: The role of governance as a moderator in South Asian countries. Environ. Sci. Pollut. Res. 2023, 30, 57358–57377. [Google Scholar] [CrossRef]
- Zhong, M.; Xia, J.; He, R. Spatial Effects of Analysis of Heterogeneous Green Technology Innovations on Pollution Emission Reduction: Evidence from China’s Power Industry. Environ. Sci. Pollut. Res. 2022, 29, 67336–67352. [Google Scholar] [CrossRef]
- Salehi, M.; Fahimifard, S.H.; Zimon, G.; Bujak, A.; Sadowski, A. The Effect of CO2 Gas Emissions on the Market Value, Price and Shares Returns. Energies 2022, 15, 9221. [Google Scholar] [CrossRef]
- Debarsy, N.; Ertur, C. Testing for spatial autocorrelation in a fixed–effects panel data model. Reg. Sci. Urban Econ. 2010, 40, 453–470. [Google Scholar] [CrossRef]
- Elhorst, J.P. Matlab software for spatial panels. Int. Reg. Sci. Rev. 2012, 35, 1–17. [Google Scholar] [CrossRef]
- Kelejian, H.; Prucha, I. Specification and estimation of spatial autoregressive models with autoregressive and heteroskedastic disturbances. J. Econom. 2010, 157, 53–67. [Google Scholar] [CrossRef] [PubMed]
- Elhorst, J.P. Spatial panel data models. In Handbook of Applied Spatial Analysis; Fischer, M.M., Getis, A., Eds.; Springer: Berlin/Heidelberg, Germany; New York, NY, USA, 2010; pp. 377–407. [Google Scholar] [CrossRef]
- Belotti, F.; Hughes, G.; Mortari, A.P. Spatial panel-data models using Stata. Stata J. 2017, 17, 139–180. [Google Scholar] [CrossRef]

Disclaimer/Publisher’s Note: The statements, opinions and data contained in all publications are solely those of the individual author(s) and contributor(s) and not of MDPI and/or the editor(s). MDPI and/or the editor(s) disclaim responsibility for any injury to people or property resulting from any ideas, methods, instructions or products referred to in the content. |
© 2023 by the authors. Licensee MDPI, Basel, Switzerland. This article is an open access article distributed under the terms and conditions of the Creative Commons Attribution (CC BY) license (https://creativecommons.org/licenses/by/4.0/).