Abstract
Urban tunnels often easily become traffic bottlenecks. Once traffic accidents occur, traffic congestion, environmental pollution, personnel and property damage and other problems restrict the sustainable development of tunnels. In order to reveal the factors affecting the incidence of tunnel traffic accidents, this paper quantitatively analyzes the influence of the single factors of tunnel geometric conditions and control measures on traffic accidents in Jiaozhou Bay underwater tunnel. The study examines the distribution patterns of tunnel traffic accidents under three dual-factor combinations: road gradient and curve radius, road gradient and slope length, and road gradient and the proportion of distance to the bottom of the slope. Based on this, a comprehensive index model is constructed using a negative binomial regression model to calculate the accident occurrence rate in Jiaozhou Bay underwater tunnel under road geometric conditions and control measures. The accident data after the second lining of Jiaozhou Bay underwater tunnel are selected as the validation object. The actual accident occurrence rate is compared with the model’s calculated value to verify the feasibility of the model constructed in this study. The results indicate that high gradient, long slope length, proximity to the bottom of the slope, and straight downhill sections have a significant impact on the occurrence of traffic accidents. Lane change signs can effectively reduce the accident rate by 30–40%. The percentage errors of the left- and right-lane traffic accident prediction models are within (−30%, 30%) and (−20%, 30%), respectively, which can assist in the design and control of underwater tunnels, offering valuable guidance and contributions to the construction of safer, more efficient, and more sustainable urban transportation systems.
1. Introduction
In the process of urban development, with the rapid economic development and urban expansion, the construction of urban tunnels across rivers and mountains has become more and more important. However, the special status and limitations of urban tunnels in the road network make them a traffic bottleneck, which can easily lead to traffic congestion and regional traffic paralysis. At the same time, the relatively closed space structure of the tunnel and the driver’s driving decision in it are easily affected by the road environment and other factors, thus increasing the risk of traffic accidents. The economic losses caused by tunnel traffic accidents include traffic congestion, vehicle damage and casualties, which not only threaten the life safety of travelers, but also affect the sustainable economic and social development of tunnels. In addition, tunnel accidents can have a negative impact on the environment inside and outside the tunnel, for example, environmental sustainability issues such as pollutant emissions. If we can reveal the correlation between factors such as the tunnel road environment and the accident rate, it can help us understand how to improve the traffic safety performance of the tunnel through sustainable development measures, including the design and construction, maintenance and management, traffic flow management and other aspects of sustainability measures to reduce the incidence of accidents, so as to improve the sustainability of the tunnel.
Compared with ordinary highway tunnels, urban expressway underwater tunnels have a longer construction length and are mostly long and extra-long tunnels, and their longitudinal slope design is mostly V-shaped. Scholars have analyzed the factors influencing traffic accidents in tunnels primarily from the viewpoints of tunnel environment, vehicle operation characteristics, and road alignment, using a combination of qualitative and quantitative analysis to determine the degree of influence. The former federal German and Swiss scholars [1] showed that most traffic accidents are not caused by a single factor, and each accident is influenced by an average of 1.5–1.6 factors. Eric et al. [2] applied a logistic model to analyze the influence of road factors as well as environmental factors on hit-and-run accidents. Pan et al. [3] found that traffic accidents caused by sharp shifts and lane changing accounted for more than 70% of the total number of traffic accidents occurring in tunnels. Masayoshi [4], based on a two-dimensional composite Poisson model, obtained the conclusion that the occurrence of traffic accidents per kilometer on road sections is disturbed by changes in the average speed and mean speed of vehicles, and that the accident rate is higher on sunny days than on cloudy days. Studies [5,6,7] found that a higher proportion of trucks and trailers in the volume of traffic resulted in a lower accident risk. Tang et al. [8] found that the main cause of tailgating accidents in highway tunnels is the uneven speed of vehicles. Using SPSS to analyze the distribution pattern of vehicle speed in tunnel sections can help the development of tunnel traffic control measures and provide a reference basis for preventing and reducing the occurrence of tailgating accidents in tunnels. Wang et al. [9] addressed the domestic tunnel traffic safety and tunnel safety problems from five perspectives—drivers, vehicles, roads, tunnel environment and tunnel management—and investigated in depth the factors influencing tunnel traffic accidents and their degree of influence. Du et al. [10] studied the impact of running speed coordination, tunnel safety design range, tunnel cavity alignment consistency, and safe running sight distance in tunnel-on-tunnel traffic safety, providing a basis for highway tunnel alignment design. Justice Zhang et al. [11] used a meta-cellular automata model to simulate the traffic operation state of the entrance section of a highway tunnel and analyzed the effects of traffic volume and vehicle speed on tunnel traffic safety. It can be seen that the existing research results mainly focus on the impact of tunnel environmental conditions (such as lighting, etc.), road alignment index, driver psychological factors and other single variables on traffic accidents.
Accidents are a discreet variable and a rare event. Therefore, Poisson regression is considered an appropriate method for modeling accident frequency data compared to linear models [12,13,14,15,16]. However, the data associated with accident frequency are usually found to be too dispersed and therefore violate the basic assumptions of Poisson models (equal mean and variance). Therefore, Poisson models cannot handle over- and under-dispersion. When the sample size and sample mean are small, the results are severely affected [17]. To overcome these limitations and to improve the predictive power of Poisson models, many variants of Poisson models are used. The zero-truncated Poisson (ZTP) model [18], also known as conditional Poisson distribution or positive Poisson distribution, is used when the sample must be truncated due to observability limitations and the omission of certain accident data. Hosseilou et al. [15] developed a zero-truncated Poisson (ZTP) model for estimating accidents and potential violations on Iranian highways and compared the results with the Poisson model. It is an extension of the Poisson model [17] and effectively deals with the problem of the over-dispersion of accident data. However, it has limitations in dealing with data correlation due to time effects and location-specific effects, as it assumes that accident frequencies on road segments are independent [19,20,21,22]. The Poisson log-normal model can solve the dispersion problem [21] and is found to be more flexible than the NB model [14]. However, it has the limitation of complex model estimation. Caliendo et al. [13] developed a negative polynomial model for highways to solve the correlation problem between observations. Similar to Poisson and NB models, negative polynomial models do not have the ability to handle under-dispersion [17]. Li et al. [23] developed a univariate negative binomial (UVNB) model for estimating crash probabilities based on crash types on Florida highways. Univariate or independent count NB models do not solve the correlation problem between different severity levels [22]. To solve the correlation problem, binary or multivariate methods can be used.
In order to accurately understand the factors influencing traffic accidents in urban expressway underwater tunnels, and to construct a model for the occurrence rate of tunnel traffic accidents, this study aims to understand the causes of accidents and provide theoretical guidance for tunnel traffic safety management. We selected the Qingdao Jiaozhou Bay Subsea Tunnel as the research subject and developed a prediction model for the accident occurrence rate in the tunnel. This study makes several contributions to the literature and supports the study of traffic safety in underwater tunnels on urban expressways. Specifically:
- (1)
- From the dimension of tunnel geometry and control measures, we analyzed the characteristics of tunnel traffic accidents, and quantified the coupling relationship between multiple factors and the incidence of tunnel traffic accidents.
- (2)
- Based on the negative binomial regression model, we established the prediction model of the Jiaozhou Bay undersea tunnel accident rate, which can provide theoretical support for further traffic safety research such as tunnel safety risk identification.
The following is how this paper is structured: Section 2 analyzes the factors influencing accidents in urban expressway underwater tunnels and constructs a prediction model for accident occurrence rates in urban expressway underwater tunnels, taking model feasibility analysis. Section 3 processes relevant data and constructs a calculation model for the left and right lane accident occurrence rates in Jiaozhou Bay underwater tunnel under the comprehensive index of road geometric conditions and control measures. The model is then validated. Section 4 presents the conclusions and outlook of the paper.
2. Materials and Methods
Compared to ordinary highway tunnels, urban motorway submerged tunnels have longer construction distances and are mostly long or extra-long tunnels. The longitudinal slope design of these tunnels is mostly V-shaped. In this study, the Qingdao Jiaozhou Bay Subsea Tunnel, which is representative of urban motorway submerged tunnels, was selected as the research object. Historical accident data of the Qingdao Jiaozhou Bay Subsea Tunnel were collected for analysis and modeling.
As an important rapid transportation link between the main urban area of Qingdao and the West Coast New Area, the Qingdao Jiaozhou Bay Subsea Tunnel carries a significant amount of urban traffic demand. While facilitating people’s lives and the development of the city’s economy, its road traffic safety issues cannot be overlooked. According to statistics, the overall number of traffic accidents in the Jiaozhou Bay Subsea Tunnel has shown an increasing trend. From 2011 to 2020, the annual average number of traffic accidents in the tunnel increased from 28 to 857, a 30-fold increase. The highest number of traffic accidents in a single day reached 30, indicating significant potential hazards in tunnel traffic safety. Studying the influencing factors of accidents in urban motorway submerged tunnels is a preliminary step in exploring preventive measures for tunnel traffic accidents. It can not only improve traffic safety inside the tunnel and reduce accidents but also help alleviate congestion in tunnel sections, thereby improving traffic efficiency.
2.1. Screening of Accident Influence Factors
2.1.1. Accident Characteristics Analysis
- (1)
- Accident time distribution
As shown in Figure 1, accidents were more likely to occur during the day in the Qingdao Jiaozhou Bay Subsea tunnel in 2019; the distribution of traffic accidents in the tunnel exhibits a clear “bimodal” phenomenon, with a concentration of traffic accidents during the day’s peak hours.
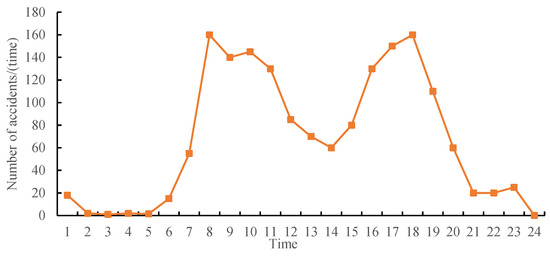
Figure 1.
Distribution of Qingdao Jiaozhou Bay Subsea Tunnel incidents by time period in 2019.
- (2)
- Accident types
Based on the historical accident records of the underwater tunnel of the urban expressway and the tunnel’s traffic operating characteristics, this study categorizes the tunnel’s accident types into seven categories: rear-end collision, scraping, collision with the roadside ditch, rollover, fire incident, engine failure and others. The types of accidents that occurred annually in the tunnel from 2018 to 2020 are tallied using the urban expressway underwater tunnel accident record table; the statistical outcomes are shown in Figure 2.
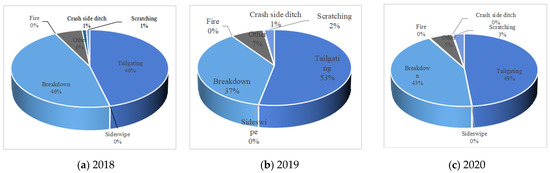
Figure 2.
Types of tunnel accidents from 2018 to 2020.
The majority of incidents in urban expressway underwater tunnels are rear-end collisions, with rear-finished collisions accounting for more than 45 percent of total accidents from 2018 to 2020.
As a result, this paper uses the Jiaozhou Bay underwater tunnel rear-end collision, scraping, collision with the roadside ditch, and overturning accidents as the research object, along with statistics on the distribution of accident models and spatial distribution of accidents, to investigate the impact of road factors on tunnel traffic accidents and then to discover tunnel traffic accident law.
- (3)
- Type of vehicle involved
Through the above analysis, the distribution of accident models of rear-end collision, scrape, collision with the roadside ditch and rollover accidents in underwater tunnels of urban expressways were tallied, and the accident models were primarily classified into five groups: commercial vehicles, cars, SUVs, vans, and buses, as shown in Figure 3.
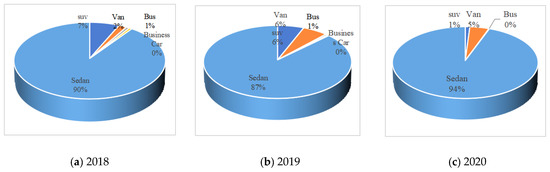
Figure 3.
Annual type of vehicle involved for 2018 to 2020.
As illustrated in Figure 3, the automobile is the most common model of urban expressway undersea tunnel traffic accidents, accounting for roughly 90% of total traffic accidents in the statistical year, a proportion significantly higher than other accident models. The study of the effect of road conditions on tunnel traffic accidents is critical for tunnel traffic accident legislation.
- (4)
- Accident spatial distribution
Using the Jiaozhou Bay underwater tunnel accident as the starting point, statistics of urban expressway underwater tunnel rear-end collision, scraping, collision with the roadside ditch, rollover accident spatial distribution, the road mileage stake number as the basis for division, the left and right lines of the tunnel to 400 m intervals for uniform division, and statistics of the number of traffic accidents in each road unit of the left and right lines of the tunnel, the statistician deduced that the left tunnel (“left line”) connects Qingdao from south to north, while the right tunnel (“right line”) connects Qingdao from north to south.
Figure 4b demonstrates that the number of traffic accidents in the tunnel’s right lane between YK4+400 and YK4+800 is quite low, which is strongly related to the configuration of curved portions in this segment. Clearly, road conditions have an effect on traffic collisions.
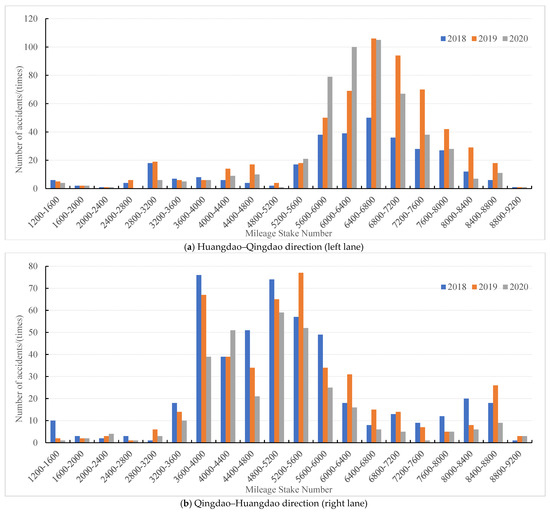
Figure 4.
Spatial distribution of Qingdao Jiaozhou Bay Subsea Tunnel accidents.
In conclusion, there is a correlation between the prevalence of urban expressway underwater tunnel accidents and road slope, curve radius, distance from the bottom of the slope, and slope length.
2.1.2. Analysis of the Correlation between Influential Variables and Accident Rate
Analysis from the perspective of system safety engineering suggests that the primary goal of preventing traffic accidents is to investigate the rules governing the occurrence of accidents and to identify their primary causes. In this paper, geometric conditions (slope, slope length, curve radius, the proportion of road length from the bottom of slope) and control measures (traffic line marking, intelligent transportation facilities) are selected as the main influencing factors of underwater tunnel accidents of urban expressways.
- (1)
- Influence of slope on the occurrence of accidents
Slope () is the actual slope of the road, with a positive value indicating an uphill segment and a negative value indicating a downhill segment; this determines the accident rates for each segment.
Figure 5 shows that different slopes have varying degrees of influence on tunnel traffic accidents, and that the rate of tunnel traffic accidents varies within the same slope interval. When the longitudinal slope is greater, the number of tunnel traffic accidents increases, and vice versa.
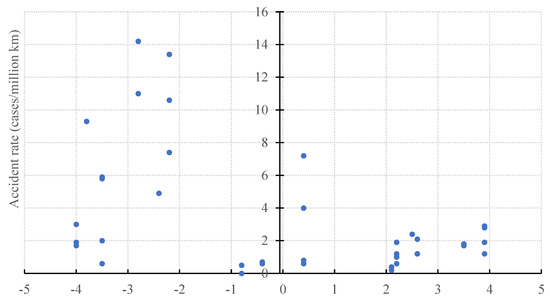
Figure 5.
Effect of slope on tunnel traffic accidents.
- (2)
- Influence of the curve radius on accident occurrence
Curve radius (R) is the road’s turning radius. When straight sections of road are aligned, the turning radius is recorded as ∞. The traffic accident data of each section of urban expressway underwater tunnel with a curve radius less than 3000 m, between 3000 m and 10,000 m, and greater than or equal to 10,000 m, i.e., straight sections, are compiled and counted based on the curve radius in Figure 6.
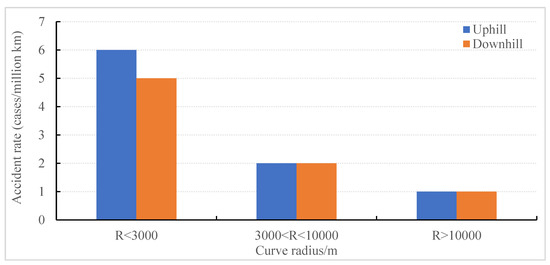
Figure 6.
Effect of tunnel traffic accident curve radius.
Different curve radii have varying degrees of influence on tunnel traffic accidents, as shown in Figure 6. From a global perspective, the downhill section of the tunnel has a significantly higher traffic accident rate than the uphill section, but whether uphill or downhill, the tunnel traffic accident rate follows the same pattern of increase in straight sections.
- (3)
- Influence of slope length on accident occurrence
The actual length of the road within the statistical section is represented by the slope length (D). The accident rate is used as an indicator to compile and analyze the traffic accident data for each section of the underwater tunnel with slope lengths ranging from 100 to 800 m.
Different slope lengths have varying degrees of impact on tunnel traffic accidents, as shown in Figure 7. In general, the downhill section of the tunnel has a significantly higher accident rate than the uphill section. In the downhill segment of the tunnel, the traffic accident rate is proportional to the length of the slope; the longer the slope, the higher the tunnel’s traffic accident rate.
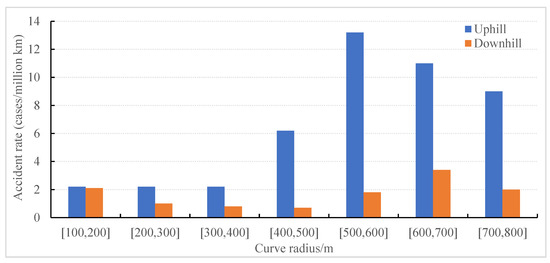
Figure 7.
Effect of slope length on tunnel traffic accidents.
- (4)
- Influence of the percentage of road length from the bottom of the slope on the occurrence of accidents
This work combines the road alignment characteristics of urban submerged tunnels and selects the ratio of road length from the bottom of the slope to reflect the distance from the bottom of the tunnel slope. Figure 8 compiles and evaluates accident data from various sections of urban motorway underwater tunnels using the accident rate as an indicator.
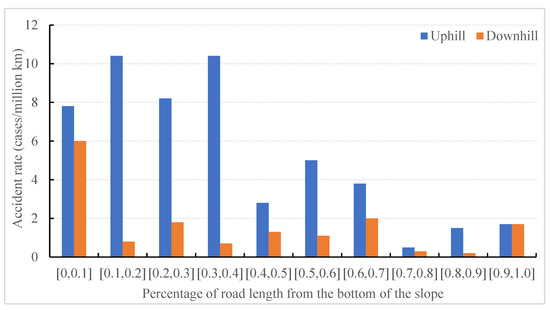
Figure 8.
Influence of the percentage of road length from the bottom of the slope on the occurrence of accidents.
Figure 8 shows how different road length ratios from the slope’s base have varying degrees of impact on tunnel traffic accidents. On the tunnel’s longitudinal sections, particularly the uphill sections, the accident rate of each statistical section is lower, the value is lower, and some statistical sections have a slightly higher accident rate.
- (5)
- Influence of geometric two-factor combination conditions on the occurrence of accidents
① Gradient and curve radius combinations
The relationship between different road types and tunnel traffic accidents under the combination of slope and curve radius can be discovered by studying the relationship between different road types and tunnel traffic accidents: the tunnel traffic accident rate is highest on steep downhill and straight sections, and lowest on gentle slopes and straight sections. According to the tunnel traffic accident change pattern depicted in Figure 9 and Figure 10, whether in the tunnel uphill or tunnel downhill section, the tunnel steep slope section always has more traffic accidents than the tunnel gentle slope section, especially in the tunnel steep downhill section.
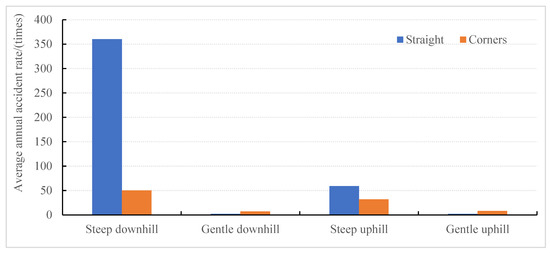
Figure 9.
Tunnel traffic accidents under the combined influence of slope and curve radius.
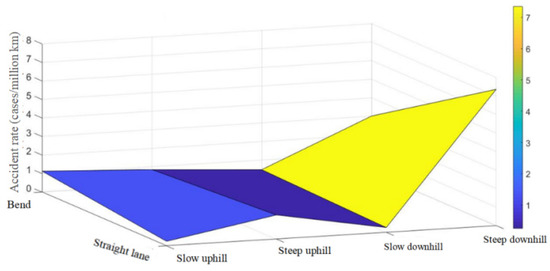
Figure 10.
Effect of slope and curve radius combinations on tunnel traffic accidents.
② Combination of gradient and slope length
The correlation between various road types and traffic accidents in tunnels under the influence of slope and slope length reveals that: traffic accidents are more common in road sections with higher slope and longer slope length, and the accident rate in tunnels is significantly higher in the steep downhill sections, followed by the steep uphill sections. The rate of tunnel traffic accidents rises with an increase in slope length at a given slope, as shown by the changing pattern of tunnel traffic accidents in Figure 11 and Figure 12.
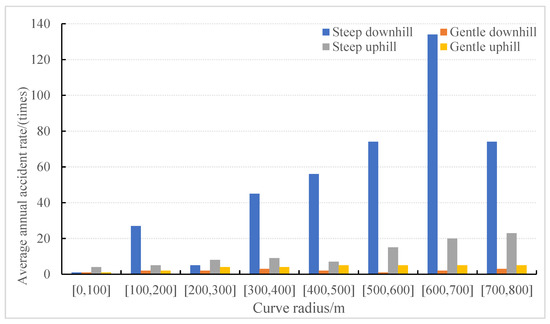
Figure 11.
Tunnel traffic accidents under the combination of slope and slope length.
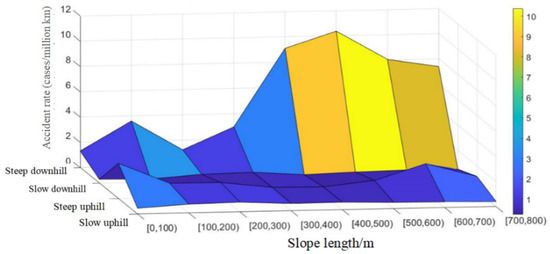
Figure 12.
Slope and slope length combinations on tunnel traffic accidents.
③ Combination of slope and length from the bottom of the slope
Studying the relationship between various road types and tunnel traffic accidents under the combination of slope and slope length reveals that: the steeper the tunnel’s slope, the shorter the proportion of the road’s length from the slope’s bottom, and the more frequently accidents occur; the accident rate in the steep downhill tunnel is also significantly higher than that of other road sections; the steep uphill road section is the second-highest accident rate location. As the percentage of road length from the slope’s bottom decreases, the rate of traffic accidents in tunnels rises, according to the shifting patterns of accidents in Figure 13 and Figure 14 at the same slope.
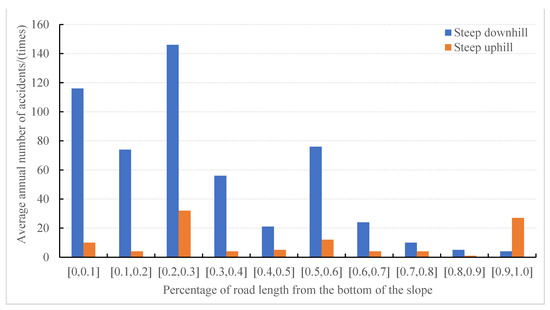
Figure 13.
Tunnel traffic accidents under the combination of slope and road length from the bottom of the slope.
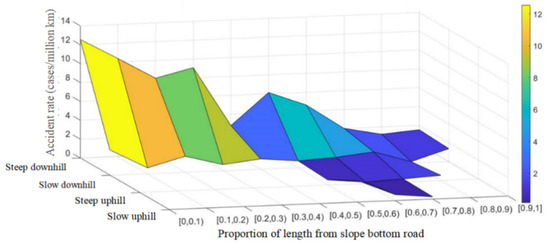
Figure 14.
Effect of the combination of slope and road length from the bottom of the slope on the traffic accidents in the tunnel.
- (6)
- Impact of control measures on the occurrence of accidents
In conjunction with the current situation of the Jiaozhou Bay Crossing’s improvement of control measures in recent years, the optimization of tunnel traffic markings was carried out. As a result, the focus of this paper will be on comprehensive control measures based on traffic marking. The data were collected between 23 January 2021 and 25 January 2021, prior to and following the first traffic lane change marking in the Qingdao Jiaozhou Bay Subsea Tunnel in Table 1. For the first time, the Qingdao Jiaozhou Bay Subsea Tunnel has a total of seven lane change markings, with each section designed in the form of white dashed lines and white dashed solid lines. The following is the marking implementation strategy in Figure 15.

Table 1.
First delineation scheme of Qingdao Jiaozhou Bay Subsea Tunnel.
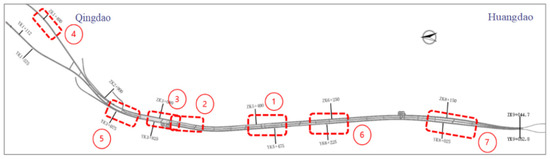
Figure 15.
Location of the first alignment of Qingdao Jiaozhou Bay Subsea Tunnel.
The data of the Qingdao Jiaozhou Bay Subsea Tunnel were chosen from February to June 2021 after the first delineation and from February to June 2019 before the first delineation. The data set includes historical accident information such as accident time, type, and location, as well as the average daily number of vehicles in the tunnel during the statistical period in Figure 16.
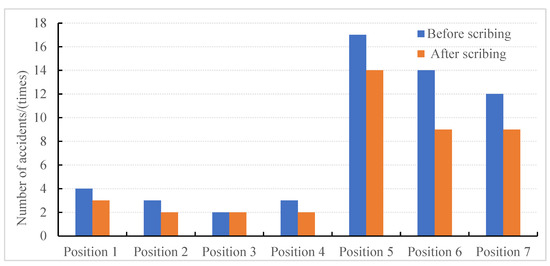
Figure 16.
Number of traffic accidents in the tunnel before and after delineation.
According to the statistical results of the number of traffic accidents before and after lining, the occurrence of tunnel traffic accidents is inextricably linked to the geometric conditions, which confirms the previous analysis of the influence of geometric conditions on tunnel traffic accidents.
Furthermore, there is a significant difference in the length of the tunnel traffic accident statistics before and after the delineation; therefore, in order to accurately analyze the impact of the marking design on tunnel accidents, this section chooses the accident rate as an evaluation index to compare and analyze the changes in tunnel traffic accidents before and after the delineation. Table 2 displays the results.
Table 2.
Accident rate calculation results for the delineated section of Qingdao Jiaozhou Bay Subsea Tunnel.
The analysis of the changes in accident rates in the delineated sections of the Qingdao Jiaozhou Bay Subsea Tunnel before and after the first delineation revealed that, with the exception of delineated sections No. 3 and No. 4, tunnel traffic accident rates in the rest of the delineated sections were significantly reduced, while traffic accidents in the delineated sections No. 3 and No. 4 were elevated or slightly reduced, and the changes were not significant.
This section examines the results of the traffic accident rate calculation for the lined section of the Jiaozhou Bay underwater tunnel before and after the application of lane change markings using SPSS 22 software, and the independent sample t-test was chosen to verify the results, which are shown in Table 3. According to the results, at the 95% confidence interval, F = 5.035 > 0.05, equal variance is assumed between the two groups of data, and the significance Sig = 0.0490 < 0.05, indicating that there is a significant difference between the two groups of data, and the application of lane change markings has a certain impact on the Jiaozhou Bay underwater tunnel’s accident rate.
Table 3.
The Jiaozhou Bay tunnel delineation section accident rate’s independent sample test results.
Figure 17 shows that the traffic accident rate of Qingdao Jiaozhou Bay Subsea Tunnel before and after lane marking has been reduced to a certain extent after lane change markings are applied, with a reduction of 30% to 40% after lane change markings are applied, excluding the influence of special sections such as tunnel entrances and exits, diversions and merges.
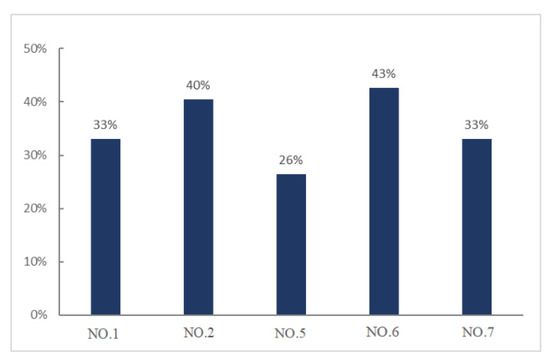
Figure 17.
Reduction in the tunnel traffic accident rate before and after delineation.
2.2. Accident Rate Modeling
2.2.1. Model Form
This study examines the relationship between factors such as slope, slope length, curve radius, proportion of distance to the bottom of the slope, and control measures affecting the accident rate in urban expressway underwater tunnels in Section 2.1. It is found that there is a certain correlation between these influencing factors and the accident rate. Taking slope as an example, different slope gradients have varying effects on tunnel traffic accidents. When the longitudinal slope is steep, the number of tunnel traffic accidents increases, and vice versa. Therefore, this paper adopts the regression model theory to construct a model for the accident rate of tunnels based on geometric conditions, considering the influence of control measures. After a comprehensive study of the above content, the basic form of the prediction model for the accident rate in urban expressway super-long tunnels is established as follows:
where —tunnel traffic accident rate; —the rate of tunnel traffic accidents based on geometric conditions; —slope, %; —curve radius, m; —percentage of road length from the bottom of the slope; —slope length, km; —discount factor of comprehensive control measures based on traffic marking design.
Control measures to improve the degree of impact on the accident are in the range of 30% to 40%, according to the study of control measures on the degree of impact of tunnel accidents and review of the relevant research literature. Therefore, this paper’s comprehensive control discount factor takes the value of 0.3~0.4; when the control measures are not improved, the value is 0.
2.2.2. Regression Model
Because the tunnel structure and alignment differ, this study chooses the negative binomial regression model and the Possion regression model to model multiple sample sections of the tunnel, respectively, and employs three evaluation indexes—the Deviance statistic, the AIC (Akaike Information Criteria) statistic, and the BIC (Bayesian Schwartz Criteria) statistic—to evaluate the final fitting effect of the model and determine the appropriate regression model to construct.
- (1)
- Possion regression model
The Possion regression model is a regression model based on the count variables of events; the events involved in the regression model are independent variables, while the count variables are the number of times the event variables occur (frequency). It is suitable for the analysis of research data that approximately obey the Possion distribution, where the Possion distribution is a discrete probability distribution with equal mean and variance, commonly used to describe the number of occurrences of a random event Y per unit of time (or space). Its probability density function is as follows:
where —the probability of occurrence of the random event and the mean of , —the mean value of .
The functional equation of the Possion regression model is
The equation of the function after linearization is
where —the number of times the random event —occurs, —the sample size, —the model regression coefficients.
- (2)
- Negative binomial regression model
Possion regression, the most basic counting regression model, requires the mean and variance of events to be equal; however, in actual observed data, the variance is frequently greater than the mean, i.e., over discrepancy, so a negative binomial regression model is introduced to solve this problem. The negative binomial regression is applicable to research data that follow a negative binomial distribution, where the distribution is determined by two parameters, μ and α. The parameter μ represents the mean or expected value of y, while α represents the dispersion parameter. As the values of μ and α increase, the difference between the mean and variance becomes larger, and the variance of the negative binomial regression model is always greater than the mean. Conversely, as the values of μ and α decrease, the mean and variance become nearly equal. The probability density function of the negative binomial distribution is as follows:
The negative binomial regression model is similar to the Possion regression model, and its functional equation is detailed in Equation (3).
2.3. Model Feasibility Analysis
2.3.1. Goodness-of-Fit Test
The primary goal of the model fit test is to validate the constructed model’s goodness of fit. To evaluate the final fit of the model, three evaluation indicators are typically used: the Deviance statistic, the AIC (Akaike Information Criteria) statistic, and the BIC (Bayesian Schwartz Criteria).
The deviance statistic (Deviance) can be used to express the degree of difference between the existing and saturated models. The smaller the calculated Deviance value, the smaller the difference between the existing model and the saturated model, and the closer the two models are, i.e., the better the fitting effect of the Possion regression model, which is calculated as
where —existing model, the Possion regression model, —The saturation model, i.e., the ideal state model.
The AIC information criterion, also known as the deficit pool information criterion, is one of the most important criteria for determining the goodness of fit of a statistical model. It is frequently used in comparing the goodness of fit of two or more models, and the AIC value of the model cannot indicate its goodness of fit. The formula shows that the smaller the AIC value, the better the model fit, so when selecting the best model, the model with the smallest AIC should be preferred, as well as its calculation formula.
where —The number of parameters in the model, —Value of the maximum likelihood function in the model.
The BIC information criterion, also known as the Bayesian information criterion, is similar to the AIC information criterion in that the magnitude of its value can be used to judge model fit. The formula shows that the smaller the BIC value, the higher the model fitting accuracy and its calculation formula.
where —The number of parameters in the model; —The number of samples in the model. —The value of the maximum likelihood function in the model.
2.3.2. Parameter Testing
The estimation method of model parameters in the Possion regression model is Maximum Likelihood estimation (MLE), whose central idea is to find the estimated parameters that maximize the joint probability of the observed data to the greatest extent possible. Typically, three tests are used to determine whether the model constraints hold: the Wald test, the LM test, and the LR test, which are asymptotically equivalent, but in different ways.
The Wald test necessitates estimation of the unconstrained model and, to some extent, can circumvent the complexity of estimating the constrained model. Assuming that the constraints are valid, the estimates derived from the unconstrained model should asymptotically meet the constraints. Estimation under the unconstrained condition permits the development of a Wald statistic, which conforms to the χ2 distribution.
2.3.3. Model Evaluation Indexes
This paper selects absolute error, average absolute error, and percentage error as evaluation indices for the purpose of determining the viability of a model for predicting the accident rate of extra-long tunnels on urban expressways.
- (1)
- Absolute Error (AE) is a term used to describe the difference between the theoretical value and the actual value; its formula is as follows.
- (2)
- Mean Absolute Error (MAE) is the average absolute error between the theoretical value and the actual value. In general, the smaller the MAE value, the greater the accuracy of the regression model, which can more accurately reflect the magnitude of the theoretical value’s error, and its calculation formula is as follows.
- (3)
- Percent Error (PE) is the percentage of the ratio of absolute error to the actual value. When the value of PE is smaller, it indicates that the regression model has a higher level of accuracy.
3. Results and Discussion
3.1. Data Processing
3.1.1. Road Segmentation
To improve tunnel traffic efficiency and ensure tunnel traffic safety, the Qingdao Jiaozhou Bay Subsea Tunnel was marked with traffic markings for the second time on 2 July 2021 in Table 4, and this marking implementation plan is shown in Figure 18 below.
Table 4.
Second delineation scheme of Qingdao Jiaozhou Bay Subsea Tunnel.
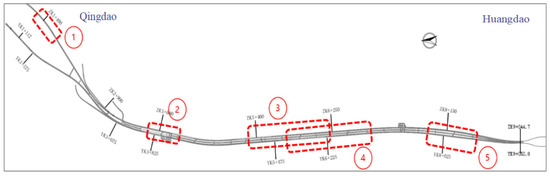
Figure 18.
Schematic diagram of the second delineation position of Qingdao Jiaozhou Bay Subsea Tunnel.
This section validates the traffic accident rates obtained for 35 sections of the left lane and 44 sections of the right lane based on the previous section divided by geometric conditions such as slope and curve radius when modelling the traffic accident rates of the Jiaozhou Bay underwater tunnel’s left and right lanes, and taking into account the factors of control measures for the Jiaozhou Bay underwater tunnel’s section division.
3.1.2. Data Processing
Data from the second delineation of the Qingdao Jiaozhou Bay Subsea Tunnel Crossing, which covered 114 days from 10 July 2021 to 31 October 2021, was extracted in Table 5 and Table 6. Average daily traffic flow, accident type, and accident location were all counted separately, along with the number of accidents in each segment, and their respective traffic accident rates were calculated. These are the outcomes.
Table 5.
Second delineation of the left-lane traffic accident rate results.
Table 6.
The results of the second delineation of the right-lane traffic accident rate.
3.2. Example Calculation
This study incorporates findings from a prior study on the factors influencing urban expressway tunnel accidents and the method used to build accident rate models to identify accident-prone sections of the Jiaozhou Bay underwater tunnel. It also makes assumptions about the values of other variables, such as tunnel lighting and traffic control, and it considers the Jiaozhou Bay underwater tunnel’s actual conditions, with a focus on road geometric characteristics (slope, slope length, etc.). The relationship between the Jiaozhou Bay Tunnel’s road geometry (slope, slope length, curve radius, and length ratio from the bottom of the slope) and preventative measures (primarily traffic marking design).
The historical accident data of the Jiaozhou Bay underwater tunnel for three consecutive years from 2018 to 2020 provided the information needed to build the regression model for the tunnel accident rate based on geometric conditions in this section. The left line is divided into 19 road sections, and the right line is divided into 22 road sections, using the geometric condition as the division standard. To increase the accuracy of the model building, the longer sections are further divided into sections. As a result, 41 road sections on the left line and 46 on the right line are obtained. The left and right lines of the Qingdao Jiaozhou Bay Subsea Tunnel Crossing’s traffic accident rates were modelled and computed separately.
3.2.1. Model Form
The basic form of the prediction model for the accident rate of Jiaozhou Bay Crossing is constructed as follows:
where —tunnel traffic accident rate; —tunnel traffic accident rates based on geometric conditions; —traffic-marking-based integrated control measures discount factor.
The discount factor under the influence of comprehensive control measures in the model of this paper is taken to be 0 when the internal road of the Jiaozhou Bay Crossing does not allow lane change.
Under the influence of comprehensive control measures, after the scientific and reasonable application of variable lane markings, the discount factor under the influence of comprehensive control measures is taken as 0.3~0.4 in the accident rate model constructed in this paper.
3.2.2. Accident Rate Model for the Left Line Based on Geometric Conditions
The relevant data of 41 sections of the left line were collated and counted, and the wrong data and redundant data in the original data were eliminated; the SPSS software was used to describe the statistics of the number of traffic accidents in each section of the left line, and the results are as follows:
As can be seen from Table 7, the minimum value of the number of traffic accidents in the left lane is 3 and the maximum value is 386; the mean number of traffic accidents occurring in the 35 valid sample sections is 84.03, the standard deviation is 110.446, and the variance is 12,198.382; the variance is much larger than the mean, and there is over-dispersion, so the regression model of the left-lane traffic accident rate is more suitable for choosing the negative binomial regression model for fitting modeling.
Table 7.
Left-lane traffic accident description statistics.
In this paper, the negative binomial regression model and Possion regression model were selected to model the 35 sample sections of the left line through the genmod process in SAS9.4 software; the results are shown below.
- (1)
- Model goodness of fit
From Table 8, it can be seen that:
Table 8.
Goodness-of-fit indicators for the left-lane traffic accident rate model based on geometric conditions.
(1) AIC and BIC statistics: the AIC and BIC values of the Possion regression model are 433.6176 and 441.3943, respectively, and the AIC and BIC values of the negative binomial regression model are 302.9171 and 321.2492, respectively. The AIC and BIC values of the negative binomial regression model are smaller than those of the Possion regression model, which shows that the left-lane traffic model is more suitable for the negative binomial regression model.
(2) The ratio of the Deviance statistic to the degrees of freedom: 7.8683 for the Possion regression model and 1.3391 for the negative binomial regression model. The Deviance statistic of the negative binomial regression model is closer to 1, so the negative binomial regression model fits better.
(3) Pearson : The Pearson value in the negative binomial regression model is 41.5097, and when the significant level is taken as 0.05, checking the critical distribution table shows that (35) = 49.802 > 41.5097, at which time p > 0.05. There is no significant difference between the observed data and the calculated value of the negative binomial regression model, indicating a better fit of the negative binomial regression model.
- (2)
- Estimation of model parameters
A negative binomial regression model was used to fit the left-lane traffic accident rate, and the estimated values of each parameter in the model were estimated by the great likelihood estimation method. The results are shown in Table 9 below.
Table 9.
Estimated parameters of the left-lane traffic accident rate model based on geometric conditions.
From Table 9, it can be seen that:
(1) The p < 0.0001 for slope () indicates that the original hypothesis is accepted: the slope in the left-lane traffic accident incidence model is significant with the occurrence of traffic accidents. The slope regression coefficient is −0.3347, which is negative, indicating that the slope is negatively correlated with the occurrence of traffic accidents in the left lane.
(2) The p-value of the inverse of the curve radius (1/R) is 0.6934, which is greater than 0.05, so the inverse of the curve radius is not significantly related to the occurrence of traffic accidents in the left lane. The regression coefficient of the inverse of the curve radius is 136.5531, which is positive, indicating that the inverse of the curve radius is positively correlated with the occurrence of traffic accidents in the left lane.
(3) The p < 0.0001 for the percentage of road length from the bottom of the slope (w) indicates that the original hypothesis is accepted: the percentage of road length from the bottom of the slope in the model of traffic accident occurrence in the left lane is significant with traffic accidents. The regression coefficient of the percentage of road length from the bottom of the slope is −2.7089, which is negative, indicating that the percentage of road length from the bottom of the slope is negatively correlated with the traffic accident rate of the left lane.
(4) The p-value of slope length (D) is 0.1001, which is greater than 0.05, so the significance of slope length and traffic accident occurrence in the left-lane traffic accident rate model is not significant. The regression coefficient of slope length is estimated to be 0.6474, which is positive, indicating that the slope length is positively correlated with the left-lane traffic accident occurrence rate.
- (3)
- The left-lane accident occurrence rate model based on geometric conditions
The above analysis revealed that the negative binomial regression model is better suited for calculating the left-lane traffic accident rate; the expression of the regression model based on geometric conditions is as follows:
The left-lane traffic accident rate predicted by the aforementioned model is compared and analyzed with the statistics’ actual left-lane traffic accident rate, as shown in Figure 19. It is found that, within a certain error tolerance, the theoretical value predicted by the model calculation roughly overlaps with the actual value.
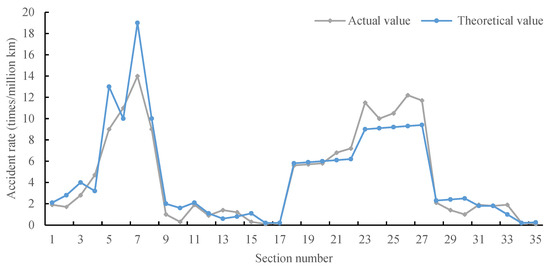
Figure 19.
Diagram of the comparison analysis between the theoretical and actual values of the accident rate model of the left line.
3.2.3. Accident Rate Model of the Right Lane Based on Geometric Conditions
The relevant data from 46 sections of the right lane were compiled and counted, and incorrect and redundant data were removed from the original data. Following that, the SPSS software was used to describe the statistics of the number of traffic accidents in each section of the right lane; the results are as follows:
According to Table 10, the minimum value of the number of traffic accidents on the right line is 2 and the maximum value is 285; the mean number of traffic accidents on the 42 valid sample sections is 65.02, the standard deviation is 71.982, and the variance is 5181.341. The variance is much larger than the mean, and there is over-dispersion, so the regression model of the traffic accident rate on the right line is more appropriate.
Table 10.
Right-lane traffic accident description statistics.
The negative binomial regression model and the Possion regression model were used in this paper to model the 42 sample right lane road sections using the genmod procedure in the SAS 9.4 software; the results are shown below.
From Table 11, it can be seen that:
Table 11.
Goodness-of-fit indicators for the right-lane traffic accident rate model based on geometric conditions.
(1) AIC and BIC statistics: the AIC and BIC values for the Possion regression model are 397.3384 and 406.0267, respectively, while the AIC and BIC values for the negative binomial regression model are 338.7095 and 349.1355. The negative binomial regression model’s AIC and BIC values are lower than those of the Possion regression model, indicating that right-line traffic is increasing. The AIC and BIC values of the negative binomial regression model are lower than those of the Possion regression model.
(2) The Deviance statistic of the negative binomial regression model is closer to one based on the ratio of the Deviance statistic to the degrees of freedom: 4.3391 for the Possion regression model and 1.1727 for the negative binomial regression model, indicating that the negative binomial regression model provides a better fit.
(3) Pearson : The value of Pearson in the negative binomial regression model is 47.0172, and when the significance level is taken as 0.05, checking the critical distribution table shows that (42) = 58.124 > 47.0172, at which time p > 0.05. There is no significant difference between the observed data and the calculated value of the negative binomial regression model, indicating that that the negative binomial regression model fits better.
The right-lane traffic accident rate was fitted using the negative binomial regression model, and the estimated values of each model parameter were calculated using the great likelihood estimation method. The outcomes are shown in Table 12 below.
Table 12.
Estimated parameters of the right-lane traffic accident rate model based on geometric conditions.
From Table 12, it can be seen that:
(1) The p < 0.00001 for slope (i) indicates that the original hypothesis is supported: the slope in the right-lane traffic accident incidence model is significantly related to the occurrence of traffic accidents. The slope regression coefficient is −0.3114, indicating a negative relationship between slope and the occurrence of traffic accidents in the right lane.
(2) A p-value of less than 0.0001 for the inverse of the curve radius (1/R) indicates that the original hypothesis is accepted: in the right-lane traffic accident rate model, there is a significant relationship between the inverse of the curve radius and the occurrence of traffic accidents. The regression coefficient for the inverse of the radius of the curve is −2404.06, indicating that the inverse of the radius of the curve is negatively related to the rate of traffic accidents in the right lane.
(3) The p-value of the percentage of road length from the bottom of the slope (w) is greater than 0.05, indicating that the percentage of road length from the bottom of the slope in the right-lane traffic accident rate model is not statistically significant. The regression coefficient of the percentage of road length from the bottom of the slope is 0.1336, indicating a positive correlation between the percentage of road length from the bottom of the slope and the right-lane traffic accident rate.
(4) Slope length and traffic accidents are not significant in the right-lane traffic accident incidence model because the p-value of slope length (D) is greater than 0.05. The estimated slope length regression coefficient is 0.1584, indicating that slope length is positively related to the rate of right-lane traffic accidents.
The above analysis revealed that the negative binomial regression model is better suited for calculating the left-lane traffic accident rate. The expression of the regression model of the left-lane traffic accident rate based on geometric conditions is as follows:
The right-lane traffic accident rate calculated by the aforementioned model is compared and analyzed with the actual right-lane traffic accident rate of statistics, as depicted in Figure 20, and it is discovered that the theoretical value obtained by the model calculation overlaps with the actual value within a certain error margin.
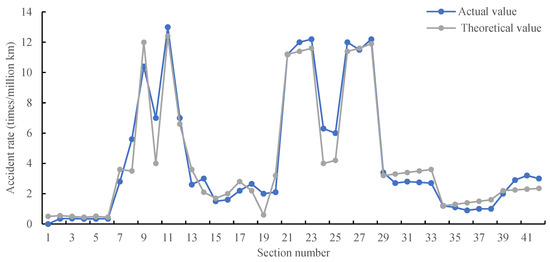
Figure 20.
Diagram of the comparison analysis between the theoretical and actual values of the accident rate model of the right line.
The above calculations lead to the following accident rate prediction model for the Jiaozhou Bay underwater tunnel.
Left line (Huangdao to Qingdao direction):
Right line (Qingdao to Huangdao direction):
where —tunnel traffic accident rate; —slope, %; —curve radius, m; —percentage of road length from the bottom of the slop; —slope length, km; —traffic-marking-based comprehensive control measures discount factor; marking is not optimized to take the value of 0; marking optimization to take the value of 0.3~0.4.
3.3. Model Feasibility Analysis
To verify the feasibility of the traffic accident rate model for the left and right lane tunnels, this paper selects historical accident data for 114 days from 10 July 2021 to 31 October 2021 after the second delineation (2 July 2021) of the Qingdao Jiaozhou Bay Subsea Tunnel, and compares the actual traffic accident rates counted in each segment of the left and right lanes with the traffic accident rates calculated by the model in this paper.
3.3.1. Left-Line Accident Rate Model
The actual traffic accident rates of the 35 validation sections of the left lane are statistically calculated and calculated based on the historical data extracted after the second delineation, and the actual traffic accident rate results are compared and analyzed with the model calculated values, as shown in Figure 21. The horizontal coordinate represents the numbering of each section of the left lane, and the vertical coordinate represents the traffic accident rate of the left lane, with the blue line representing the statistical actual left-lane traffic accident rate value, and the orange and yellow lines representing the theoretical left-lane traffic accident rate values calculated by the model established by the discount factor of comprehensive control measures = 0.3 and = 0.4, respectively.
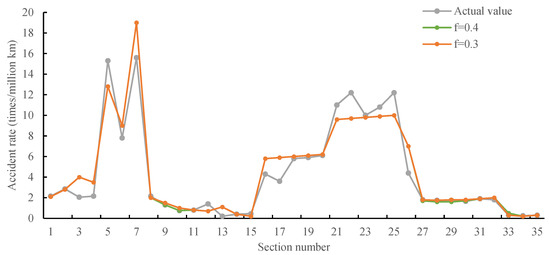
Figure 21.
Diagram of the comparison analysis between theoretical and actual values of the traffic accident rate in the left lane.
As shown in Figure 22, the theoretical left-lane traffic accident rate calculated using the negative binomial regression model is roughly the same as the statistical trend of the actual left-lane traffic accident rate, where segments 9 to 10 and segments 26 to 30 of the tunnel’s left lane are marked with lane change; the model results indicate that the accident rate of the tunnel is reduced by about 40% after the lane change is applied. The model calculations show that the tunnel’s accident rate is reduced by about 40% after the marking, which is consistent with the results of traffic-marking-based control measures with a discount factor of 0.3 to 0.4. The absolute error of a few sections is greater, primarily in accident-prone sections of the tunnel, i.e., downhill or at the bottom of the slope, and the absolute error is primarily distributed in the range of (−2, 1).
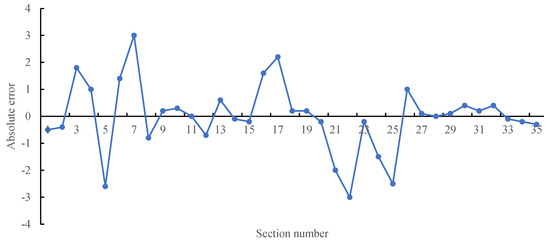
Figure 22.
Absolute error between theoretical and actual values of the traffic accident rate in the left lane.
The comparison of the calculated values of the left-line traffic accident rate model and the actual statistical results, as well as the distribution of absolute errors, is discussed above, and the overall fitting effect of the left-line traffic accident rate regression model is good.
Analyzing the percentage error distribution between theoretical and actual values of the left-lane traffic accident rate in Figure 23 reveals that the percentage error of the regression model of the left-lane traffic accident rate is essentially distributed in the range of (−30%, 30%), while the majority of the percentage error of the traffic accident rate of the validation section is distributed in the range of (−30%, 0).
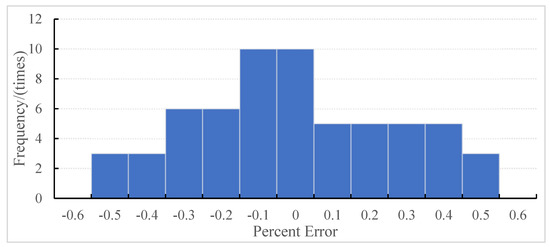
Figure 23.
Error rate distribution of the left-lane traffic accident rate model.
In general, the left-lane traffic accident rate regression model fits well and can predict the traffic accident rate of each section of the tunnel’s left lane within a certain error tolerance.
3.3.2. Right-Line Accident Rate Model
The actual traffic accident rates of the 44 validation sections of the right lane are calculated statistically based on the historical data extracted after the second delineation. The right-lane traffic accident rate model constructed in this paper is applied to calculate the actual traffic accident rate results, and the model calculated values are compared and analyzed, as shown in Figure 24. The horizontal coordinate is the right lane section segment number, and the vertical coordinate is the right-lane traffic accident rate, with the blue line representing the statistical actual right-lane traffic accident rate value, and the orange and yellow lines representing the theoretical right-lane traffic accident rate values calculated by the model with the discount factor of comprehensive control measures = 0.3 and = 0.4.
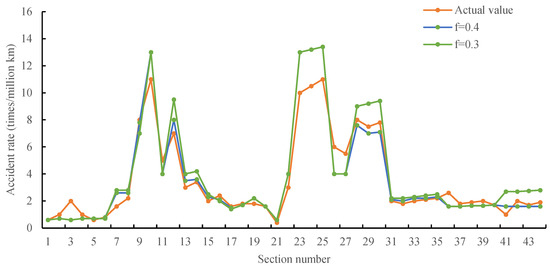
Figure 24.
Diagram of comparison analysis between theoretical and actual values of the traffic accident rate in the right lane.
Figure 25 demonstrates that the theoretical right-lane traffic accident rate calculated using the negative binomial regression model is comparable to the statistical trend of the actual right-lane traffic accident rate, in which the accident rate of each section of the tunnel right-lane marking has been reduced by approximately 40%, which is consistent with the results of the traffic-marking-based comprehensive control measures discount factor. The absolute error of individual sections is greater, primarily distributed in tunnel accident-prone sections, i.e., downhill or slope-bottom sections, and is primarily distributed within the interval [−1, 2].
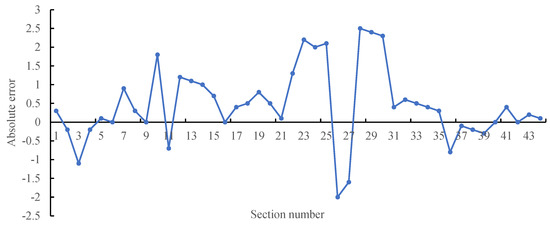
Figure 25.
Absolute error between theoretical and actual values of traffic accident rate in the right lane.
The aforementioned comparison between the calculated values of the right lane traffic accident rate regression model and the actual statistical results, as well as the distribution of absolute errors, are analyzed, and the overall fitting effect of the right lane traffic accident rate regression model is good.
By analyzing the percentage error distribution between the theoretical and actual values of the right-lane traffic accident rate in Figure 26, it can be seen that the percentage error of the regression model of the right-lane traffic accident rate is predominantly distributed between (−20% and 30%), whereas the majority of the percentage error of the validation section traffic accident rate is distributed between 0 and 30%.
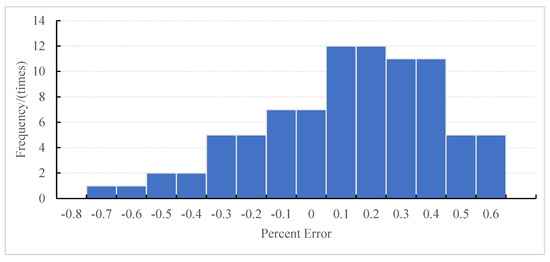
Figure 26.
Error rate distribution of the right-lane traffic accident rate model.
In general, the regression model of the traffic accident rate in the right lane has a good fitting effect and can predict the traffic accident rate of each segment in the right lane of the tunnel within a specified error margin.
4. Conclusions
By quantitatively analyzing the influence of factors such as tunnel road conditions and traffic control conditions on accidents, this paper builds a tunnel accident incidence prediction model; reveals the correlation between road geometry, traffic control measures and accident occurrence; and provides theoretical support for the sustainable development of tunnels such as avoiding some accident risks in the next stage of tunnel design and planning. The specific conclusions of this paper are as follows:
- (1)
- Factors influencing tunnel accidents: The study analyzes the influence of road characteristics, traffic characteristics, traffic control methods, and environmental characteristics on tunnel accidents. It identifies traffic volume, road geometry, and traffic characteristics as the primary factors affecting accident occurrence.
- (2)
- Effectiveness of control measures: Quantitative analysis shows that comprehensive control measures, such as the implementation of variable lane markings, significantly reduce the rate of tunnel traffic accidents. The reduction rate ranges between 30% and 40%. This highlights the effectiveness of control measures in mitigating accident risks.
- (3)
- Model construction for extra-long tunnels: The study focuses on constructing a prediction model for accident occurrence in extra-long tunnels. Using the Jiaozhou Bay underwater tunnel in Qingdao as an example, the characteristics of tunnel accident data are combined with a negative binomial regression model. The model considers factors such as the slope of the tunnel’s left line, the percentage of road length from the bottom of the slope, the slope of the right line, and the inverse of the curve radius, which significantly affect the tunnel’s traffic accident rate.
- (4)
- Model validation: After the second delineation of the Qingdao Jiaozhou Bay Subsea Tunnel, the study selects relevant data to validate the model’s viability. By comparing and analyzing the actual and theoretical values of the tunnel accident rate, the study confirms the consistency between the model predictions and the observed accident rates. The percent error falls within an acceptable range, with the model performing well for both the left and right lanes of the tunnel.
In summary, this study examines the relationship between influencing factors and accident occurrence rates in tunnels, explores the effectiveness of control measures, and develops a prediction model for extra-long tunnel accidents. The findings are validated using real-world data, providing valuable insights for enhancing tunnel safety and accident prevention. Due to the limitations of personal level and research conditions, there are still some deficiencies in this paper that need to be addressed, primarily in the following two areas:
- (1)
- This study focuses on the impact of geometric conditions and control measures on traffic accidents in extra-long tunnels. Future research can explore additional factors, such as traffic status and facilities, to analyze the patterns of traffic accidents in urban expressway tunnels.
- (2)
- The accident rate prediction model in this study considers comprehensive control measures, but further research is needed to assess the specific influence of individual measures like traffic markings and intelligent traffic facilities on traffic safety.
Author Contributions
Methodology, R.X. and X.C.; Formal analysis, Z.L.; Data curation, T.Y.; Writing—original draft, Z.Y.; Writing—review & editing, N.Z. All authors have read and agreed to the published version of the manuscript.
Funding
This work was supported in part by the Young Scientists Fund of the National Natural Science Foundation of China under Grant 52002045, the Science and Technology Research Program of Chongqing Municipal Education Commission under Grant KJQN201900725.
Institutional Review Board Statement
Not applicable.
Informed Consent Statement
Not applicable.
Data Availability Statement
The numerical data used to support the findings of this study are included within the article.
Conflicts of Interest
The authors declare no conflict of interest.
References
- Turner-Fairbank Highway Research Center. Interactive Highway Safety Design Midel: Getting Started Guide; Federal Highway Adiministration: Washington, DC, USA, 2003. [Google Scholar]
- Aidoo, E.N.; Amoh-Gyimah, R.; Ackaah, W. The Effect of Road and Environmental Characteristics on Pedestrian Hit-and-Run Accidents in Ghana. Accid Anal Prev. 2013, 53, 23–27. [Google Scholar] [CrossRef]
- Pan, F.Q.; Xing, Y.; Yang, J.S.; Zhang, L.X.; Yang, X.X.; Xu, Q.N. Factors Affecting Traffic Accidents in Sub-sea Tunnels and Prevention and Control Strategies. Transp. Technol. Econ. 2020, 22, 1–5, 56. [Google Scholar]
- Tanishita, M.; van Wee, B. Impact of Vehicle Speeds and Changes in Mean Speeds on Per Vehicle-kilometer Traffic Accident Rates in Japan. IATSS Res. 2016, 41, 107–112. [Google Scholar] [CrossRef]
- Wen, H.; Zhang, X.; Zeng, Q.; Sze, N.N. Bayesian Spatial-temporal Model for the Main and Interaction Effects of Roadway and Weather Characteristics on Freeway Crash Incidence. Accid. Anal. Prev. 2019, 132, 105249. [Google Scholar] [CrossRef]
- Mohammadi, M.A.; Samaranayake, V.A.; Bham, G.H. Crash Frequency Modeling Using Negative Binomial Models: An application of Generalized Estimating Equation to Longitudinal Data. Anal. Methods Accid. Res. 2014, 2, 52–69. [Google Scholar] [CrossRef]
- Leng, Q.; Huang, H. Bayesian Spatial Joint Modeling of Trattic Crashes on an Urban Road Network. Accid. Anal. Prev. 2014, 67, 105–112. [Google Scholar]
- Tang, Z.G.; Fu, Y.G.; Dong, W.W.; Liu, Y.K. Analysis of Speed Characteristics of Highway Tunnel Sections. J. Chongqing Jiaotong Univ. (Nat. Sci. Ed.) 2020, 39, 25–32. [Google Scholar]
- Wang, X.Y.; Ma, Z.Y.; Dong, X.Y. Analysis of Tunnel Traffic Accidents and Management Countermeasures in China. Traffic Eng. 2017, 17, 33–37. [Google Scholar]
- Du, B.Y.; Sun, P.; Liu, K.F. Highway Tunnel Alignment Design Based on Operational Safety. Highway 2018, 63, 278–282. [Google Scholar]
- Zhang, Z.Z.; Zhu, S.H.; Zhu, K.N.; Liu, H.X.; Zhu, T. Simulation of Traffic Flow and Safety in the Entrance Section of Highway Tunnels. J. Saf. Environ. 2015, 15, 146–150. [Google Scholar]
- Hadi, M.A.; Aruldhas, J.; Chow, L.F.; Wattleworth, J.A. Estimating Safety Effects of Cross-section Design for Various Highway Types Using Negative Binomial Regression. Transp. Res. Rec. 1995, 1500, 169–177. [Google Scholar]
- Caliendo, C.; Guida, M.; Parisi, A. A Crash-prediction Model for Multilane Roads. Accid. Anal. Prev. 2007, 39, 657–670. [Google Scholar] [CrossRef]
- Zeng, Q.; Sun, J.; Wen, H. Bayesian Hierarchical Modeling Monthly Crash Counts on Freeway Segments with Temporal Correlation. J. Adv. Transp. 2017, 2017, 5391054. [Google Scholar] [CrossRef]
- Hosseinlou, M.H.; Mahdavi, A.; Nooghabi, M.J. Validation of the Influencing Factors Associated with Traffic Violations and Crashes on Freeways of Developing Countries: A Case Study of Iran. Accid. Anal. Prev. 2018, 121, 358–366. [Google Scholar] [CrossRef]
- Ture Kibar, F.; Celik, F.; Wegman, F. Analyzing Truck Accident Data on the Interurban Road Ankara-Aksaray-Eregli in Turkey: Comparing the Performances of Negative Binomial Regression and the Artificial Neural Networks Models. J. Transp. Saf. Secur. 2019, 11, 129–149. [Google Scholar] [CrossRef]
- Lord, D.; Mannering, F. The Statistical Analysis of Crash-frequency Data: A Review and Assessment of Methodological Alternatives. Transp. Res. Part A Policy Pract. 2010, 44, 291–305. [Google Scholar] [CrossRef]
- Kim, D.; Lee, Y. Modelling Crash Frequencies at Signalized Intersections with a Truncated Count Data model. Int. J. Urban Sci. 2013, 17, 85–94. [Google Scholar] [CrossRef]
- Ma, Z.; Zhang, H.; Chien, S.I.J.; Wang, J.; Dong, C. Predicting Expressway Crash Frequency Using a Random Effect Negative Binomial Model: A Case Study in China. Accid. Anal. Prev. 2017, 98, 214–222. [Google Scholar] [CrossRef]
- Zou, Y.; Wu, L.; Lord, D. Modeling over-dispersed crash data with a long tail: Examining the accuracy of the dispersion parameter in Negative Binomial models. Anal. Methods Accid. Res. 2015, 5–6, 1–16. [Google Scholar] [CrossRef]
- Shirazi, M.; Lord, D.; Dhavala, S.S.; Geedipally, S.R. A Semiparametric Negative Binomial Generalized Linear Model for Modeling Over-dispersed Count Data with a Heavy Tail: Characteristics and Applications to Crash Data. Accid. Anal. Prev. 2016, 91, 10–18. [Google Scholar] [CrossRef]
- Hou, Q.; Meng, X.; Leng, J.; Yu, L. Application of a Random Effects Negative Binomial Model to Examine Crash Frequency for Freeways in China. Phys. A Stat. Mech. Appl. 2018, 509, 937–944. [Google Scholar] [CrossRef]
- Li, L.; Wang, W.; Liu, P.; Bai, L.; Du, M. Analysis of Crash Risks by Collision Type at Freeway Diverge Area Using Multivariate Modeling Technique. J. Transp. Eng. 2015, 144, 04015002. [Google Scholar] [CrossRef]


Disclaimer/Publisher’s Note: The statements, opinions and data contained in all publications are solely those of the individual author(s) and contributor(s) and not of MDPI and/or the editor(s). MDPI and/or the editor(s) disclaim responsibility for any injury to people or property resulting from any ideas, methods, instructions or products referred to in the content. |
© 2023 by the authors. Licensee MDPI, Basel, Switzerland. This article is an open access article distributed under the terms and conditions of the Creative Commons Attribution (CC BY) license (https://creativecommons.org/licenses/by/4.0/).