Article

Continuous Removal of Dyes from Wastewater Using Banana-Peel Bioadsorbent: A Low-Cost Alternative for Wastewater Treatment

Departamento de Ingeniería Química y Ambiental, Universidad Técnica Federico Santa María, Avenida Vicuña Mackenna 3939, Santiago 7820436, Chile
*
Author to whom correspondence should be addressed.
Sustainability 2023, 15(13), 9870; https://doi.org/10.3390/su15139870
Submission received: 24 April 2023 / Revised: 6 June 2023 / Accepted: 8 June 2023 / Published: 21 June 2023

Abstract

:
Methylene blue is a widely used dye that can have severe negative impacts on the environment and human health. Adsorption is an effective method for removing it from wastewater, but the high cost of traditional adsorbents has motivated the research into low-cost alternatives derived from waste biomass. Designing a dye-removal process requires the knowledge of breakthrough curves. This paper assesses the use of banana peel as an adsorbent in a continuous process for the removal of methylene blue. The adsorption efficiency of lab-scale continuous systems using a stock solution of 0.5 g L−1 methylene blue was analyzed. The best performance was found at pH 6, with a particle size of 0.08–0.3 mm and a fixed bed height of 7.5 cm. The total adsorption capacity was 22.11 mg/g based on experimental data and 25.40 mg/g based on mathematical modeling (Thomas model). The saturation time was 53 h. According to the results, the process conditions and adsorbent characteristics have a critical role in the design of continuous adsorption systems. However, further research is needed to generalize conclusions about the process and include additional experimental data under different operating conditions.

1. Introduction

Industrial effluent from sectors such as paints, leather, tannery, paper, and textiles frequently contains dyes as a common component [1,2]. Even at concentrations below 1 mg/L, dyes can have detrimental effects on both the environment and human health, given their carcinogenic, mutagenic, allergenic, and toxic properties [3,4]. For instance, certain dyes have been found to disrupt aquatic life and interfere with photosynthesis, resulting in significant damage to ecosystems [5]. Additionally, exposure to dyes can cause skin irritation or respiratory problems in humans and increase the risk of developing cancer [6].
Methylene blue is a commonly used dye in the textile and paint industry, as well as in other industrial applications such as a tracer or pH indicator [7]. Various studies have shown that this dye can affect photosystem processes and inhibit bacterial growth [8]. Additionally, it has been reported to have negative effects on the skin, eyes, respiratory system, and gastrointestinal tract, and is also considered a potential carcinogen [9]. Due to these characteristics, it is necessary to remove methylene blue from wastewater before it is discharged into natural water bodies.
Most dyes are synthetic organic molecules that exhibit high stability to light, heat, and oxidizing agents due to their complex molecular structure, making their degradation difficult [10,11]. Various treatment methods have been studied for this type of pollutant, including chemical coagulation/flocculation [12,13], ozonation and oxidation processes [14,15,16], ion exchange [17,18], and ultrafiltration [19,20]. However, these techniques are associated with high costs [21], high energy consumption [22,23], and the generation of secondary pollutants [24]. As a result, research has focused on alternative wastewater treatments. To remove dyes and organic contaminants present in wastewater, many methods have been developed. These methods can be divided into three categories: biological, chemical, and physical [25].
Specifically, for the treatment of dyes and phenolic compounds, methods such as adsorption, solvent extraction, heterogeneous photocatalysis, and biological treatments are the most used [26,27,28,29]. Each of these methods has advantages and disadvantages.
Adsorption: a physicochemical technique involving the adherence of specific molecules to the surfaces of the adsorbent [30]. Adsorption is a well-known equilibrium separation process and an effective method for water decontamination applications. It is superior compared to other techniques for water reuse in terms of initial cost, flexibility, simplicity of design, and ease of operation [25]. Adsorption also does not lead to the formation of harmful substances.
Solvent extraction (or liquid-liquid extraction): a chemical separation technique based on the principle that a solute can be distributed in a certain proportion between immiscible solvents. The extraction depends on the mass transfer rate [31,32].
Heterogeneous photocatalysis: a chemical oxidation process based on the direct or indirect absorption of radiant energy (visible or UV) by a semiconductor solid, where photochemical reactions (oxidation–reduction reactions) occur at the catalyst surface (liquid–solid or gas–solid interface). This process generates highly reactive free radicals, allowing for the degradation, and even mineralization, of a wide range of organic compounds [33,34].
Biological treatment: a biological technique where microorganisms (bacteria, fungi, yeasts, and algae) can remove certain contaminants from aqueous solutions, a phenomenon known as biosorption [26]. Immobilized microorganism technology is increasingly being used to remove organic contaminants from polluted ecosystems [35,36,37].
Adsorption processes have demonstrated high efficiencies in treating this type of effluent [38,39]. However, the high installation and operation costs of treatment plants pose a challenge. To address this issue, researchers have explored alternative adsorbent materials as a means of reducing operating costs, as adsorbent materials such as activated carbon can be expensive. This has led to research on low-cost adsorbents [40].
Several studies have shown that different types of agricultural waste (biomass) can be competitive alternatives to activated carbon for batch processes [41,42,43,44,45,46]. However, in large-scale wastewater treatment, continuous operations in fixed-bed columns are usually required to treat large volumes of contaminated water in shorter periods [47,48]. Continuous adsorption processes in fixed-bed columns are effective, as they rely on the concentration gradient as a driving force for adsorption, enabling efficient use of the adsorbent’s capacity and resulting in the better removal of pollutants [49]. While some studies have presented approaches to this type of process [50,51], there is a need to analyze different operating parameters to determine the efficiency of this process for industrial-scale volumes.
Banana peel is a low-cost and widely available lignocellulosic agricultural waste that has shown a high efficiency in removing methylene blue in both batch [52,53,54] and continuous processes [55,56]. However, there are not many studies analyzing the optimization of continuous adsorption processes using this adsorbent material in fixed-bed columns. Such studies are crucial to obtain the minimum information required to upscale the process to pilot and industrial levels [56].
This study aims to analyze the effects of operational conditions on the continuous adsorption process of methylene blue using banana peel as the adsorbent, focusing on the removal efficiency and breakthrough curve analysis. The study examines fixed-bed height, the nominal size of the adsorbent, and the pH at three different levels to identify the optimal local operating conditions within the range of the study. The preliminary results will enable us to identify the minimum information required to understand the aspects of the adsorption process related to transport phenomena and mathematical modeling, enabling the scaling of the continuous adsorption process to pilot and industrial scales.

2. Materials and Methods

2.1. Preparation of Bio-Sorbent

For this research, banana peel of the type Mussa paradisiaca L., in stage 6 of maturity according to the classification of color index [57], was used. The adsorbent was extensively washed in two stages; in the first, under tap water to remove large particles; and in the second, with grade II distilled water [58]. Afterward, the banana peel was cut onto rectangular pieces of 2 × 2 cm approximately and then dried in a drying oven for 24 h at 100 °C [57]. Next, the peel was crushed and sieved, and the particulate matter with a particle sizes of 0.08–0.3, 0.3–0.8 and 0.8–2.0 mm was collected using sieve meshes of 70, 30 and 16 U.S.STD [59]. The sieving process was carried out using an automatic sieving machine (Ortoalresa model OASS203) for 10 min.

2.2. Characterization of the Adsorbent

2.2.1. Total Ash

This method is based on the destruction of organic matter in the sample by calcination and gravimetric determination of the residue. The procedure follows the Chilean Standard NCh842 for Food—Determination of Ash [60].

2.2.2. Moisture

This method is based on the determination of the water content in the sample. The National Institute of Standardization certifies that the moisture test applied to food, in general, is based on the Chilean Standard NCh841 present by Eurofins [61], applicable to solid, liquid, or paste-like foods but not susceptible to degradation when subjected to temperatures above 105 °C [62].

2.2.3. Total Solids

This test covers the determination of the remaining total solids after drying a sample, according to the Standard Test Method for Determination of Total Solids in Biomass (ASTM E1756-08(2015)) [63].

2.2.4. Density

Density

The density test covers the determination of the specific gravity of solids passing through a No. 4 sieve (4.75 mm), using a water pycnometer. Specific gravity is the ratio of the mass of a unit volume of solids to the mass of the same volume of deionized gas-free water at 20 °C [64].

Specific Gravity (Relative Density)

This test covers the determination of relative density, and the weight per unit of volume of a material, including voids within the material [65].

Porosity

The total porosity is calculated by the methods of [66]:
Porosity (%) = 100∙(1−(Bulk Density)/(Real Density)) (20).

2.2.5. Isoelectric Point

The determination of the isoelectric point was carried out following the procedure established by [67] to determine the pH at which the total net charge (external and internal) of the particles on the surface of the adsorbent material is neutral. Merck analytical-grade reagents were used.

2.3. Preparing the Methylene Blue Stock Solution

To prepare the stock solution, analytic-grade methylene blue (Merck) was used. The stock solution was prepared at a concentration of 0.5 g L−1. For the dilution, grade-II distilled water [4] was used.

2.4. Quantifying the Methylene Blue Concentration

To quantify the methylene blue concentration, a UV-VIS spectrophotometer (Mecasys model OPTIZEN POP) was used through the calibration curve [4]. To estimate the concentration of methylene blue, a spectral scan was performed using a UV-Visible spectrophotometer to obtain the absorption peak and determine the working wavelength. A maximum wavelength of 640 nm was experimentally identified for methylene blue.
Subsequently, using the obtained wavelength and the prepared stock solution, a calibration curve was generated to establish the linear relationship between absorbance and concentration according to the Beer–Lambert Law. For this purpose, six dilutions of the stock solution were prepared in duplicate, and the absorbance of each solution was measured using the UV-Visible spectrophotometer at a wavelength of 640 nm, using polystyrene cuvettes with a 10 mm optical path length.

2.5. Effect of the Solution Initial PH (Batch Experiment)

The effect of the initial pH in the methylene blue solution was determined through batch experiments. For this analysis, the samples were shaken at room temperature in an automatic shaker (Dragon Lab model SK-O330-Pro), at 500 RPM for 1 h. Analyzed solutions were prepared with 0.1 g of bioadsorbent, particle size: 0.8–2.0 mm, in 50 (mL) of methylene blue solution with an initial concentration of 20 mg L−1. Solutions with three different pHs (4, 6, 9) were analyzed in duplicate. To adjust this variable, solutions of NaOH and HCl with a concentration of 0.1 M [4] were used. The amount of adsorbed dye per gram of biosorbent at a time t (qt) was calculated by
q t m g   g 1 = c 0 c t m · V
where c0 and ct (mg L−1) are the methylene blue concentration in the liquid-phase at times 0 and t, respectively; m (g) is the mass of adsorbent used; and V (L) is the volume of the solution.

2.6. Experimental Setup

Continuous adsorption experiments were carried out on a cylindrical glass column (3.5 cm internal diameter and 65.0 cm height), using known quantities of banana peel. For this experiment, a solution of methylene blue with a concentration of 40 mg L−1 was used. The solution was pumped (descending flow mode) at a flow rate of 10 (mL/min−1), using a peristaltic pump (Masterflex L/S model 0752810) as shown in Figure 1. Samples were collected at regular intervals through the bottom of the column (20 min) for a total time of 3 h.
The effect of the fixed-bed height was analyzed by three different points (5.0, 7.5 and 10.0 cm) for a constant banana-peel particle size (0.8–2.0 mm) and the bioadsorbent particle size effect for the three ranges (0.08–0.3, 0.3–0.8 and 0.8–2.0 mm), with a constant fixed-bed height (5.0 cm). In addition, a continuous adsorption experiment was carried out for a total time of 48 h, with a bed height of 5 cm and a particle size between 0.08 and 0.3 mm, to determine the breakthrough curve for the system.

2.7. Determining the Removal Percentage of Methylene Blue

The percentage of total adsorbate removal “R” (column yield), which is the ratio between the total mass of adsorbed dye (𝑚𝑎𝑑) and the total mass of adsorbate (dye) pumped to the column (𝑚𝑡), was determined from Equation (2) [52]:
R % = m a d m t · 100
The total mass of adsorbed dye (mg) can be calculated as [52]:
m a d = Q · C 0 1000 · t 0 t t o t 1 C t C 0 d t
where 𝐶0 and 𝐶𝑡 are the concentrations of adsorbate in the influent and effluent of the column, respectively (mg L−1); 𝑄 is the volumetric flow pumped to the column (mL min−1); and 𝑡0 and 𝑡𝑡𝑜𝑡 are the initial and total time of continuous adsorption, respectively.
  • Determining the Breakthrough Curve
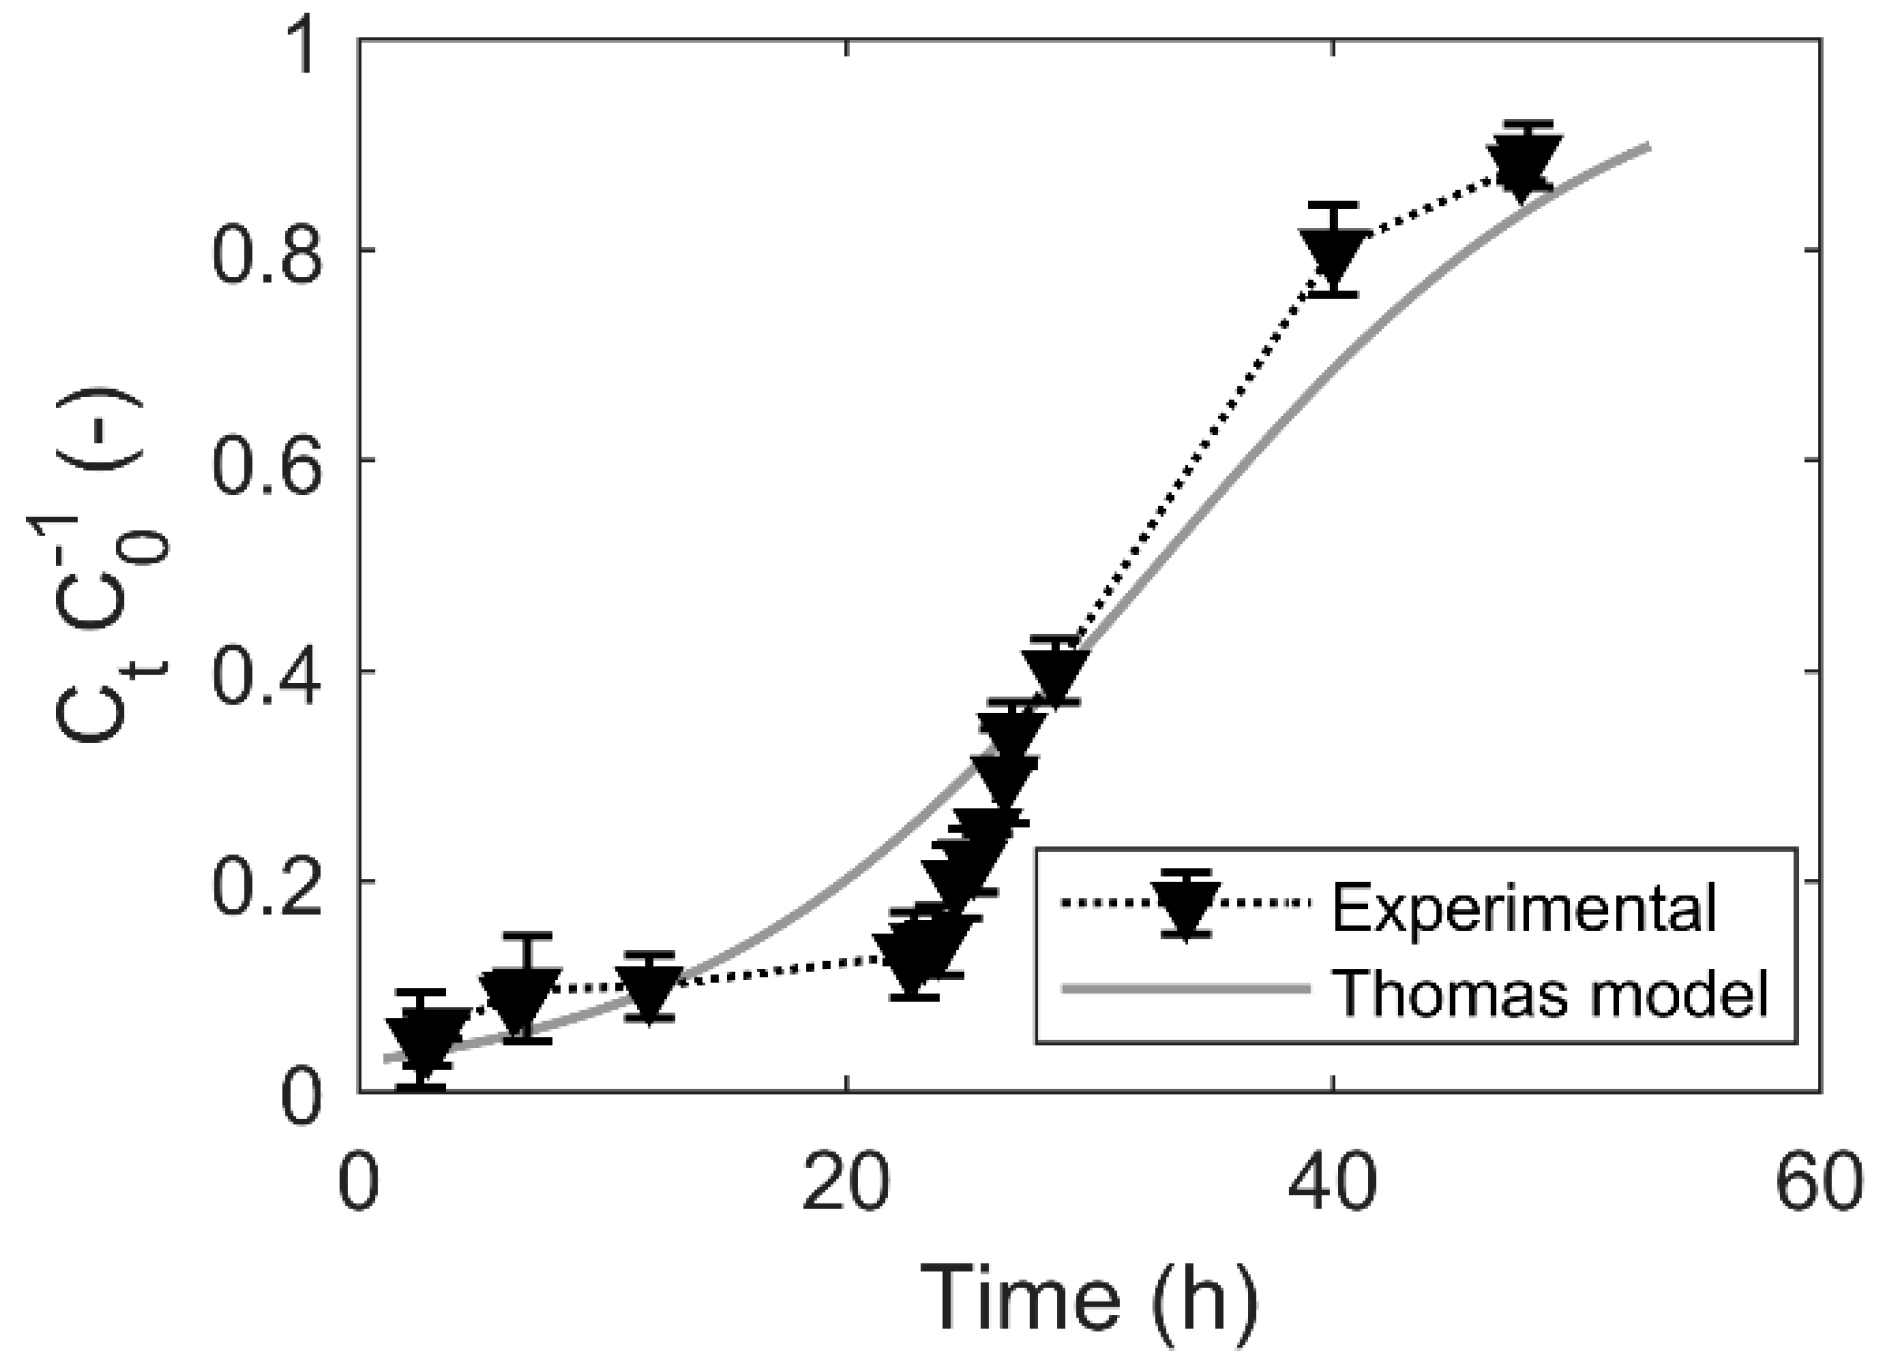
To determine the breakthrough curve, which identifies the saturation time of the system, experimental data were fitted according to the Thomas model present in Equation (3) [44]:
C t C 0 1 1 + exp k T H · q T H · M Q C 0 · t 1000
where 𝑘𝑇𝐻 is the Thomas velocity constant (mL mg−1 min−1); 𝑞𝑇𝐻 is the total adsorption capacity determined by the model (mg g−1); 𝑀 the mass of adsorbent in the column (g); t is the time of operation (min); and 𝐶0 and 𝐶𝑡 are the adsorbate concentrations in the column influent and effluent, respectively (mg L−1). The parameters 𝑘𝑇𝐻 and 𝑞TH are obtained from the linearization of the Thomas model:
ln C 0 C t 1 = q T H · M · k T H Q C 0 · k T H · t

3. Results

3.1. Characterization of the Adsorbent

The results of the proximate analysis for banana peel are presented in Table 1.
The ash content differs by approximately 23% compared to the values reported in the literature: Archibald reported a value of 12.1% (drying temperature: 80 °C) [68]. Oberoi, Sandhu and Vadlani reported a value of 9.81 ± 0.42% (particle size: 0.5–0.6 mm; drying temperature: 60 °C) [69]. The high ash content indicates a high mineral content in banana peel (Abubakar et al., 2016) [70].
Regarding moisture, the obtained result represents the natural moisture content of banana peel (before drying), and its value is consistent with the values reported in the literature: Archibald reported a natural moisture content of 83.8% [68]. However, in the literature, the moisture content of dried banana peel was searched.
Based on the results in Table 2, due to the low moisture percentage (6–10%), dried banana peel can be stored for a longer period since the risk of mold formation is significantly reduced in the absence of limited moisture content [71].
Finally, the total solids presented in Table 1 were determined based on the natural moisture content of the banana peel. According to the literature, the total content of solids in dried banana peel is 20.41 ± 0.4 g/L [55].

3.1.1. Physical Characterization of the Adsorbent

Physical properties of the adsorbent such as porosity, real density, and bulk density are presented in Table 3.
According to the results for density, the obtained values are consistent with those reported in the literature (11–40% percentage): 0.138 ± 0.01 g/cm3 (particle size: 0.2 mm) (Mondal, 2017); 0.89 g/cm3 (particle size: 0.106–0.9 mm) [71]; 1.72 g/cm3 (particle size: 5 mm) [54].
Similarly, the obtained values for specific gravity are also consistent with those reported in the literature: 0.384 ± 0.11 g/cm3 (particle size: 0.2 mm) [72]; 0.39 g/cm3 (particle size: 0.106–0.9 mm) [71]. The differences in the bulk densities of the banana peel are mainly due to variations in particle size, particle shape, or both [71]. Most agricultural residues have low specific gravity compared to materials such as coal, for example [74].
Finally, the experimentally obtained porosity is also consistent with the values reported in the literature: Pathak, Mandavgane and Kulkarni reported a porosity of 56.41% for a particle size range of 0.106–0.9 mm [71]; Bhaumik and Mondal reported a porosity of 62% for a particle size of 0.25 mm [73]. The high porosity of the adsorbent promotes adsorption; for example, activated carbon, which is highly porous, has a porosity in the range of 55–85% [75].

3.1.2. Adsorbent Zero-Point Charge

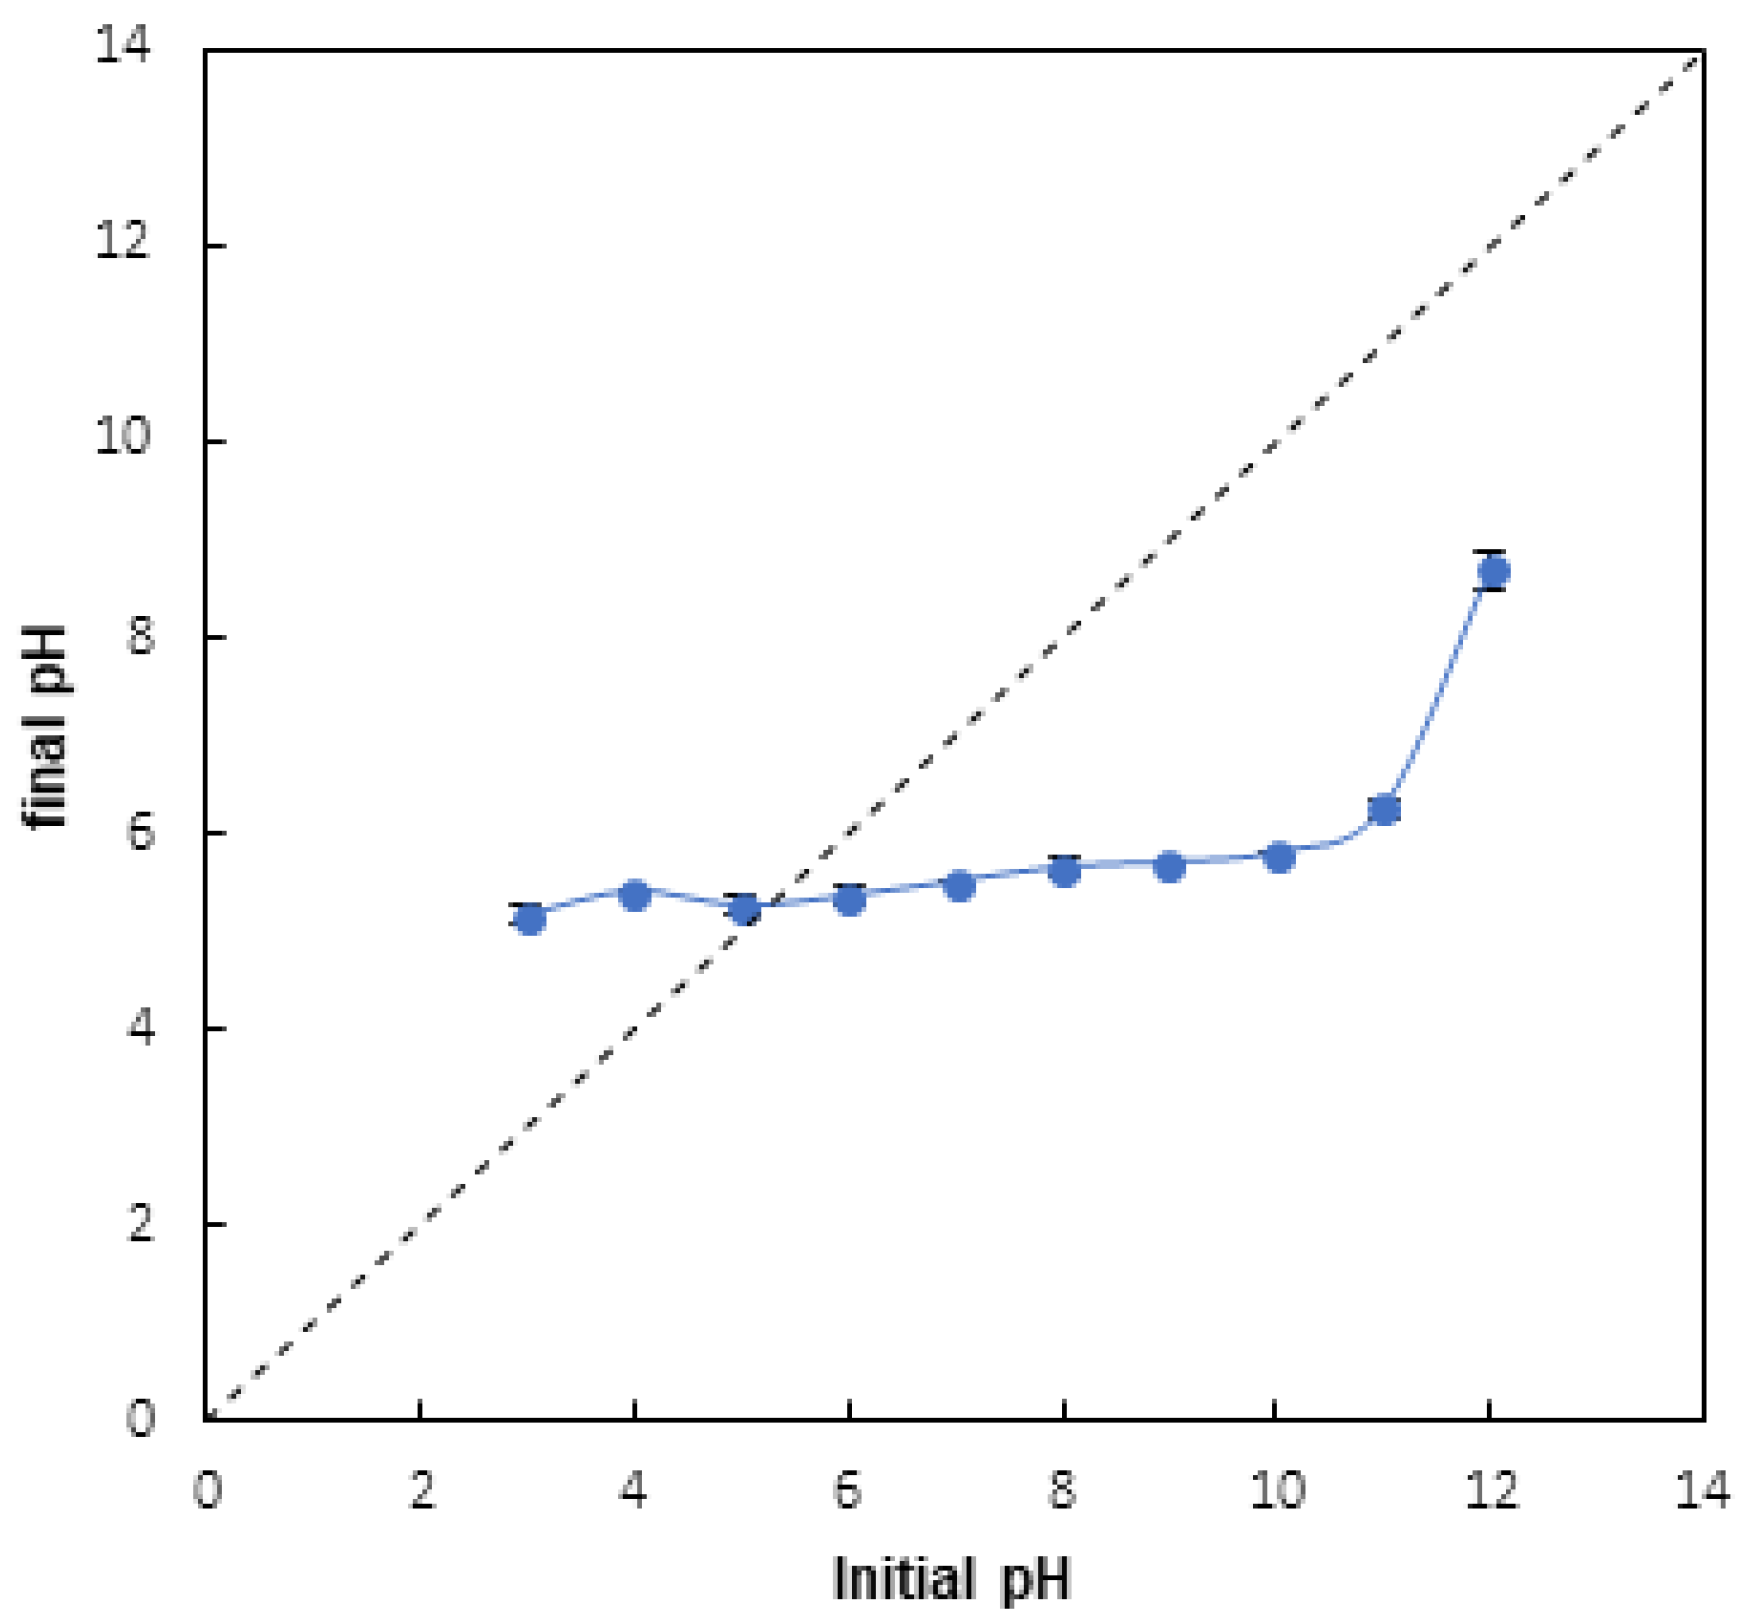
The results for the determination of the zero-point charge, aiming to determine the equilibrium point of charge on the adsorbent material, are presented in Figure 2. From it, it can be determined that the intersection occurs at pH = 5.32 ± 0.071, corresponding to the zero-point of charge.
The obtained value agrees with the one reported in the literature: Pathak, Mandavgane and Kulkarni reported a zero-point of charge of 5.36 (in distilled water) for a dried banana peel with a particle size range of 0.106–0.9 mm, similar to the sizes used in this study [71]. Similarly, Mondal obtained a zero-point of charge of 5.63 ± 0.05 for a dried banana peel with a particle size of 0.2 mm (within the particle size range used in this study) [72].
Therefore, anionic contaminants will be retained at a pH lower than the zero-point of charge, while cationic contaminants will be retained at a pH higher than the zero-point of charge. In particular, the zero-point of charge of the banana peel is close to a neutral pH (compared to other peels such as orange and lemon), so the banana peel can be used for the adsorption of both cationic and anionic contaminants [71].

3.2. Effect of PH

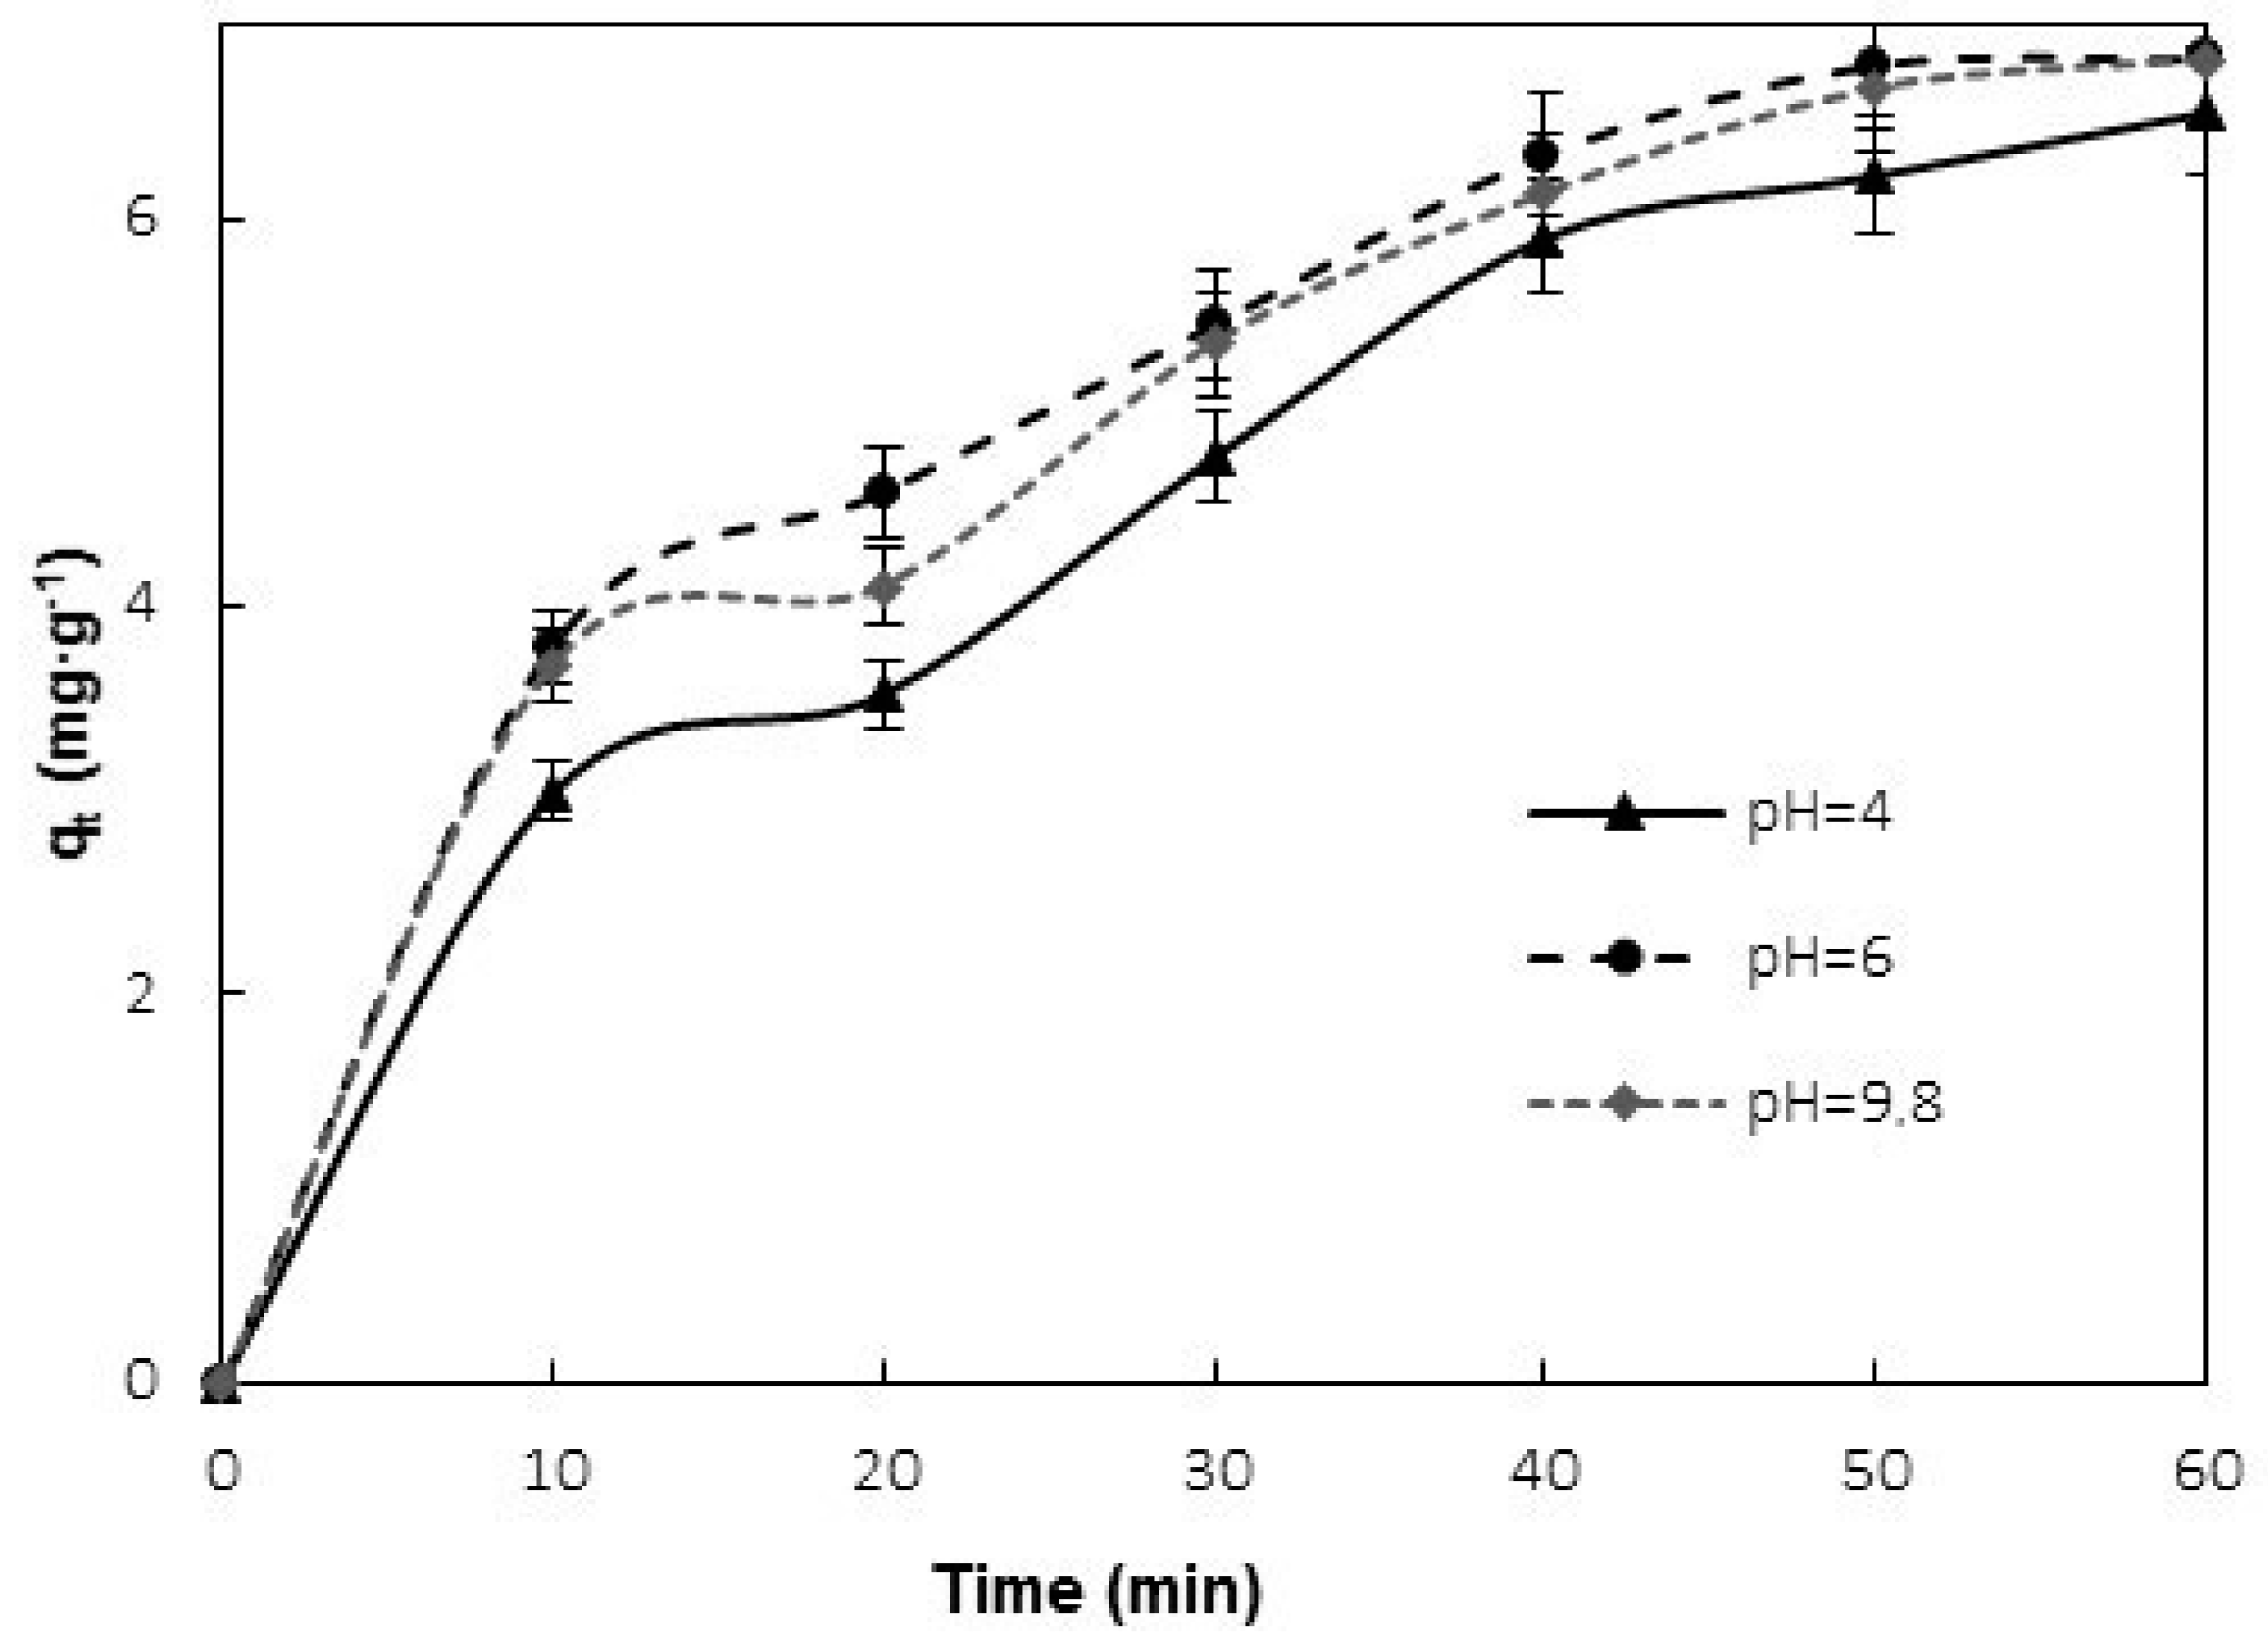
To identify the effect of pH on the adsorption potential of methylene blue using banana peel, three pH levels were analyzed: acidic (pH 4), close to neutral (pH 6), and basic (pH 9.8); the results are presented in Figure 2. These results were obtained from a batch process to define the operational pH for a continuous adsorption processes concerning the most favorable conditions for methylene blue adsorption.
No significant difference was observed in the saturation times for the analyzed conditions, with a saturation time of approximately 1 h for all pH conditions studied. An increase in methylene-blue removal was observed when the pH was modified from 4 to 6, but a slight decrease in removal values was observed when the pH was further increased to 9. The observed trend is similar to the results reported by Amel et al. [4] and Jawad [58] for the analysis of pH on methylene-blue removal using banana peel as an adsorbent. Both studies showed a plateau in the adsorption capacity between pH values of 6 to 9. Based on these results, a pH value of 6 was selected for the continuous experiment operation.

3.3. Effect of the Fixed-Bed Height

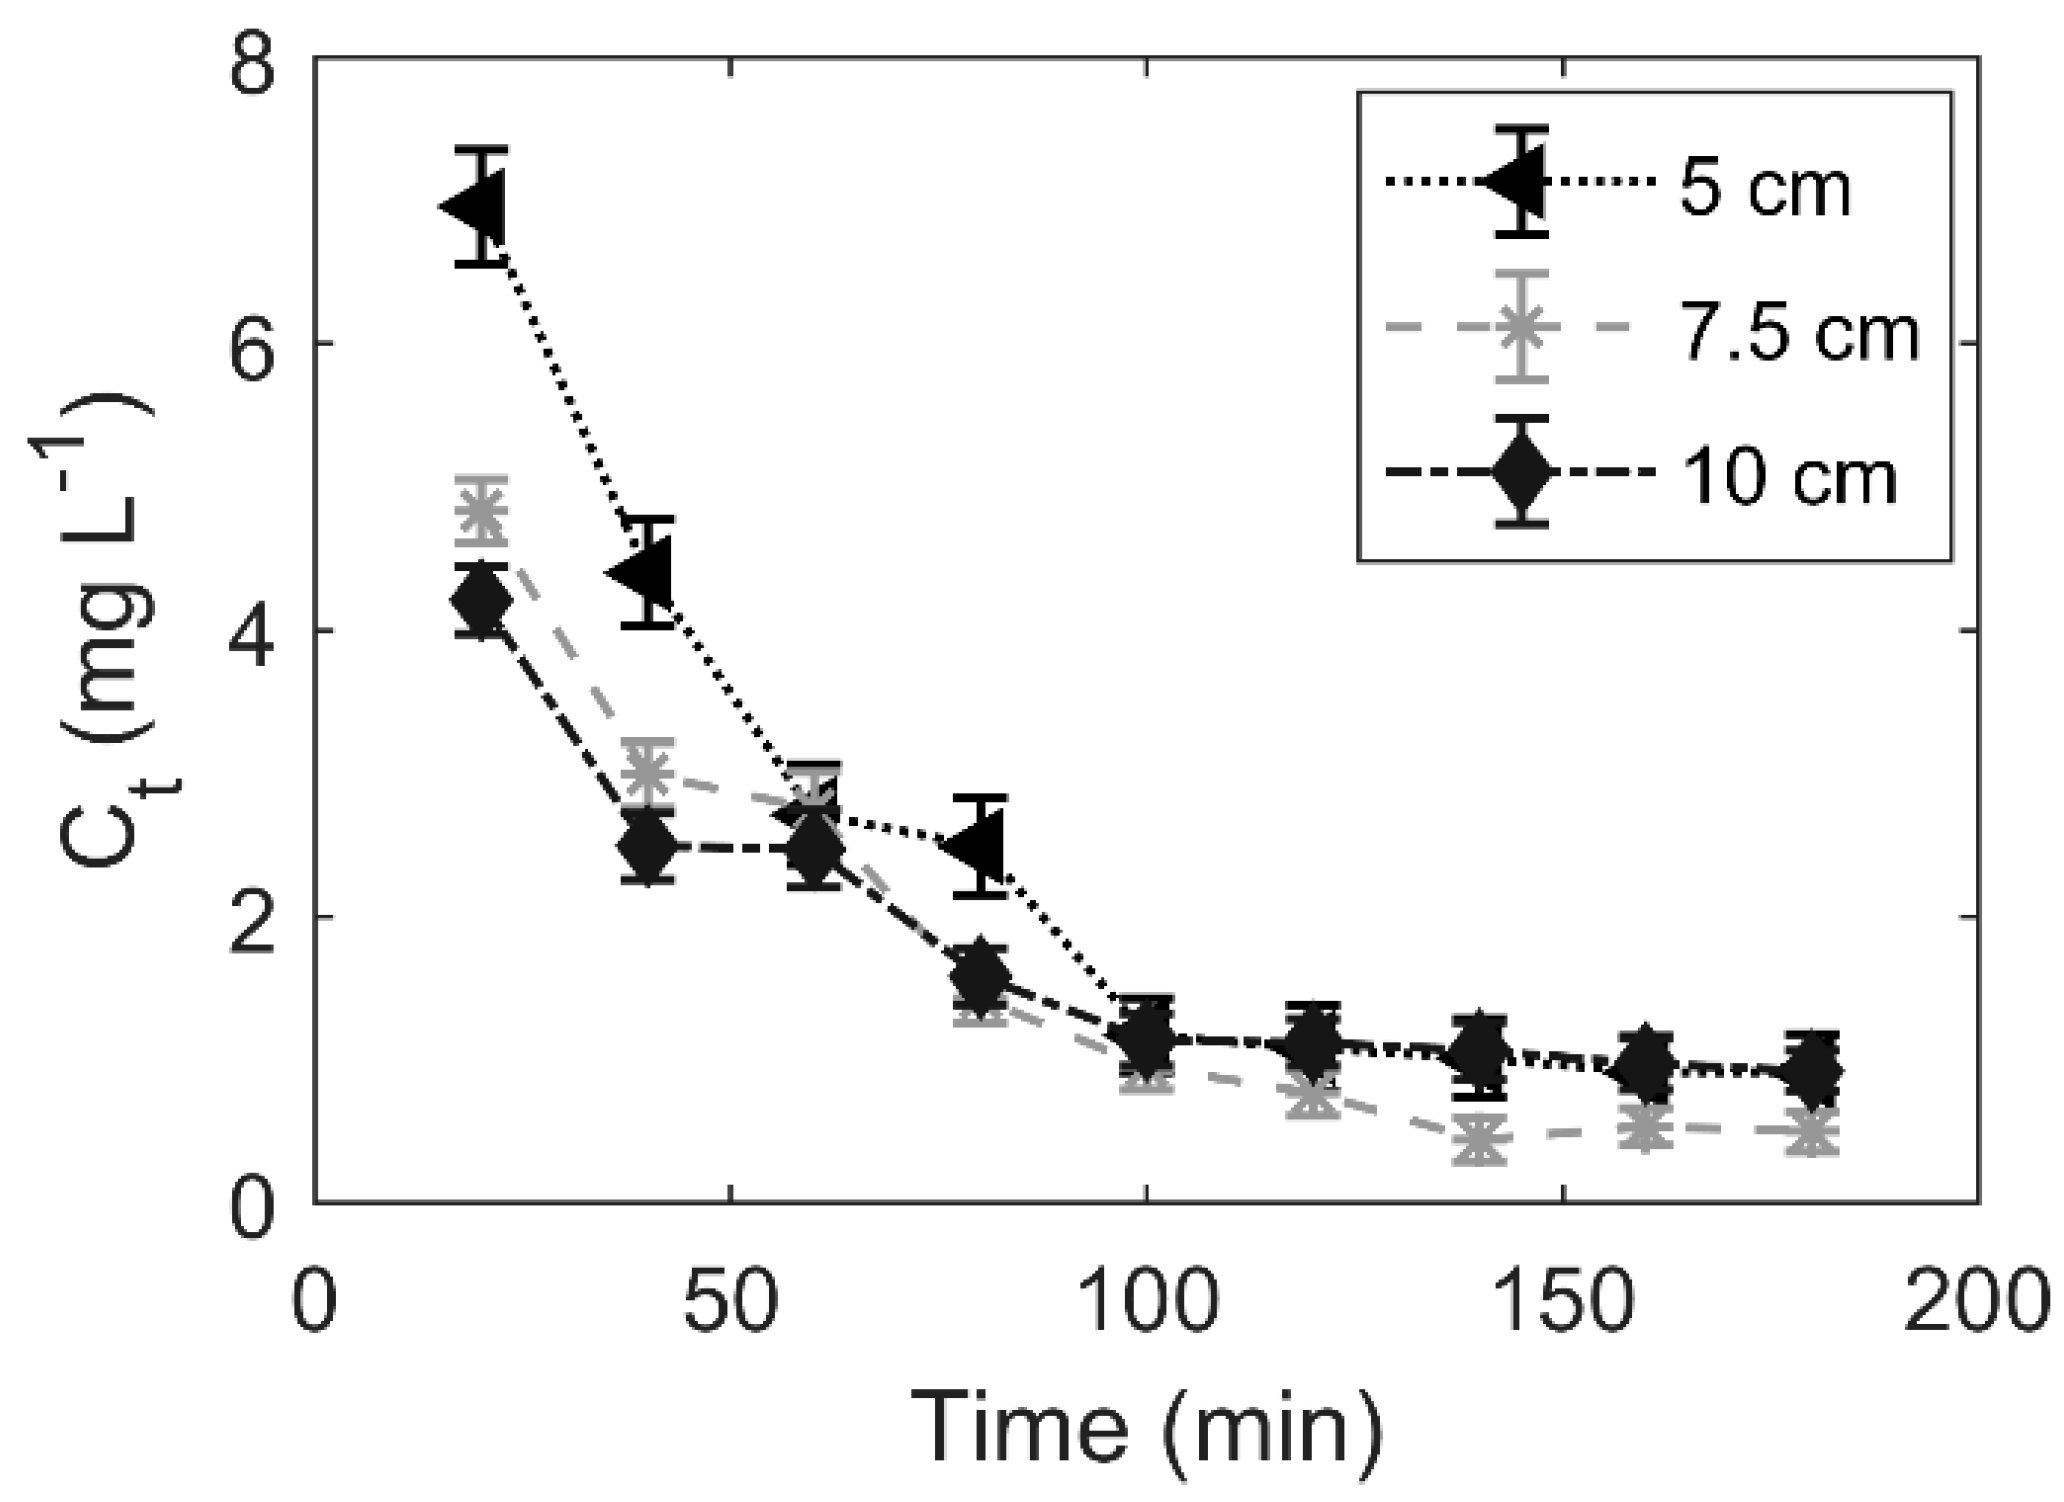
In continuous adsorption processes, an important operating parameter is the height of the fixed-bed, as it affects the residence time. Figure 3 shows the results of continuous methylene-blue removal for three different fixed-bed heights, representing an initial analysis of the potential use of banana peel as a continuous system for wastewater treatment.
During the first 20 min, a drop of over 82% in concentration was observed between the influent concentration (40 mg L−1) and the effluent concentration for all three column heights. Additionally, for times less than 40 min, the fixed bed with the greater height (7.5 and 10.0 cm) showed the highest removal ratio. Between 40 and 60 min, no significant difference in effluent concentration was observed, and for times up to 60 min, a continuous decrease in effluent concentration was observed. A similar trend was observed for the fixed bed of 5.0 cm, but the drop observed at 40 min for other conditions was observed at 60–80 min for this condition. For times up to 100 min, no significant difference was observed between the fixed beds with heights of 5.0 and 10.0 cm, while a slightly lower effluent concentration was observed for the fixed bed of 7.5 cm. The total removal percentage of dye was calculated to be 84.0%, 85.5%, and 84.7% for the fixed beds of 5.0, 7.5, and 10.0 cm height, respectively.
The total removal percentages obtained in this study are higher than the values reported by Ponnusami [59] for experiments under similar conditions using guava-leaf (Psidium guajava) powder at a fixed bed of 5 and 10 cm (flow rate 17.5 mL min−1, particle size 0.425–0.500 mm, influent concentration 20 mg L−1). On the other hand, a higher removal percentage has been reported in other studies but for equilibrium times that were twice as long as those obtained with banana peel in the present study [52].

3.4. Effect of Particle Size

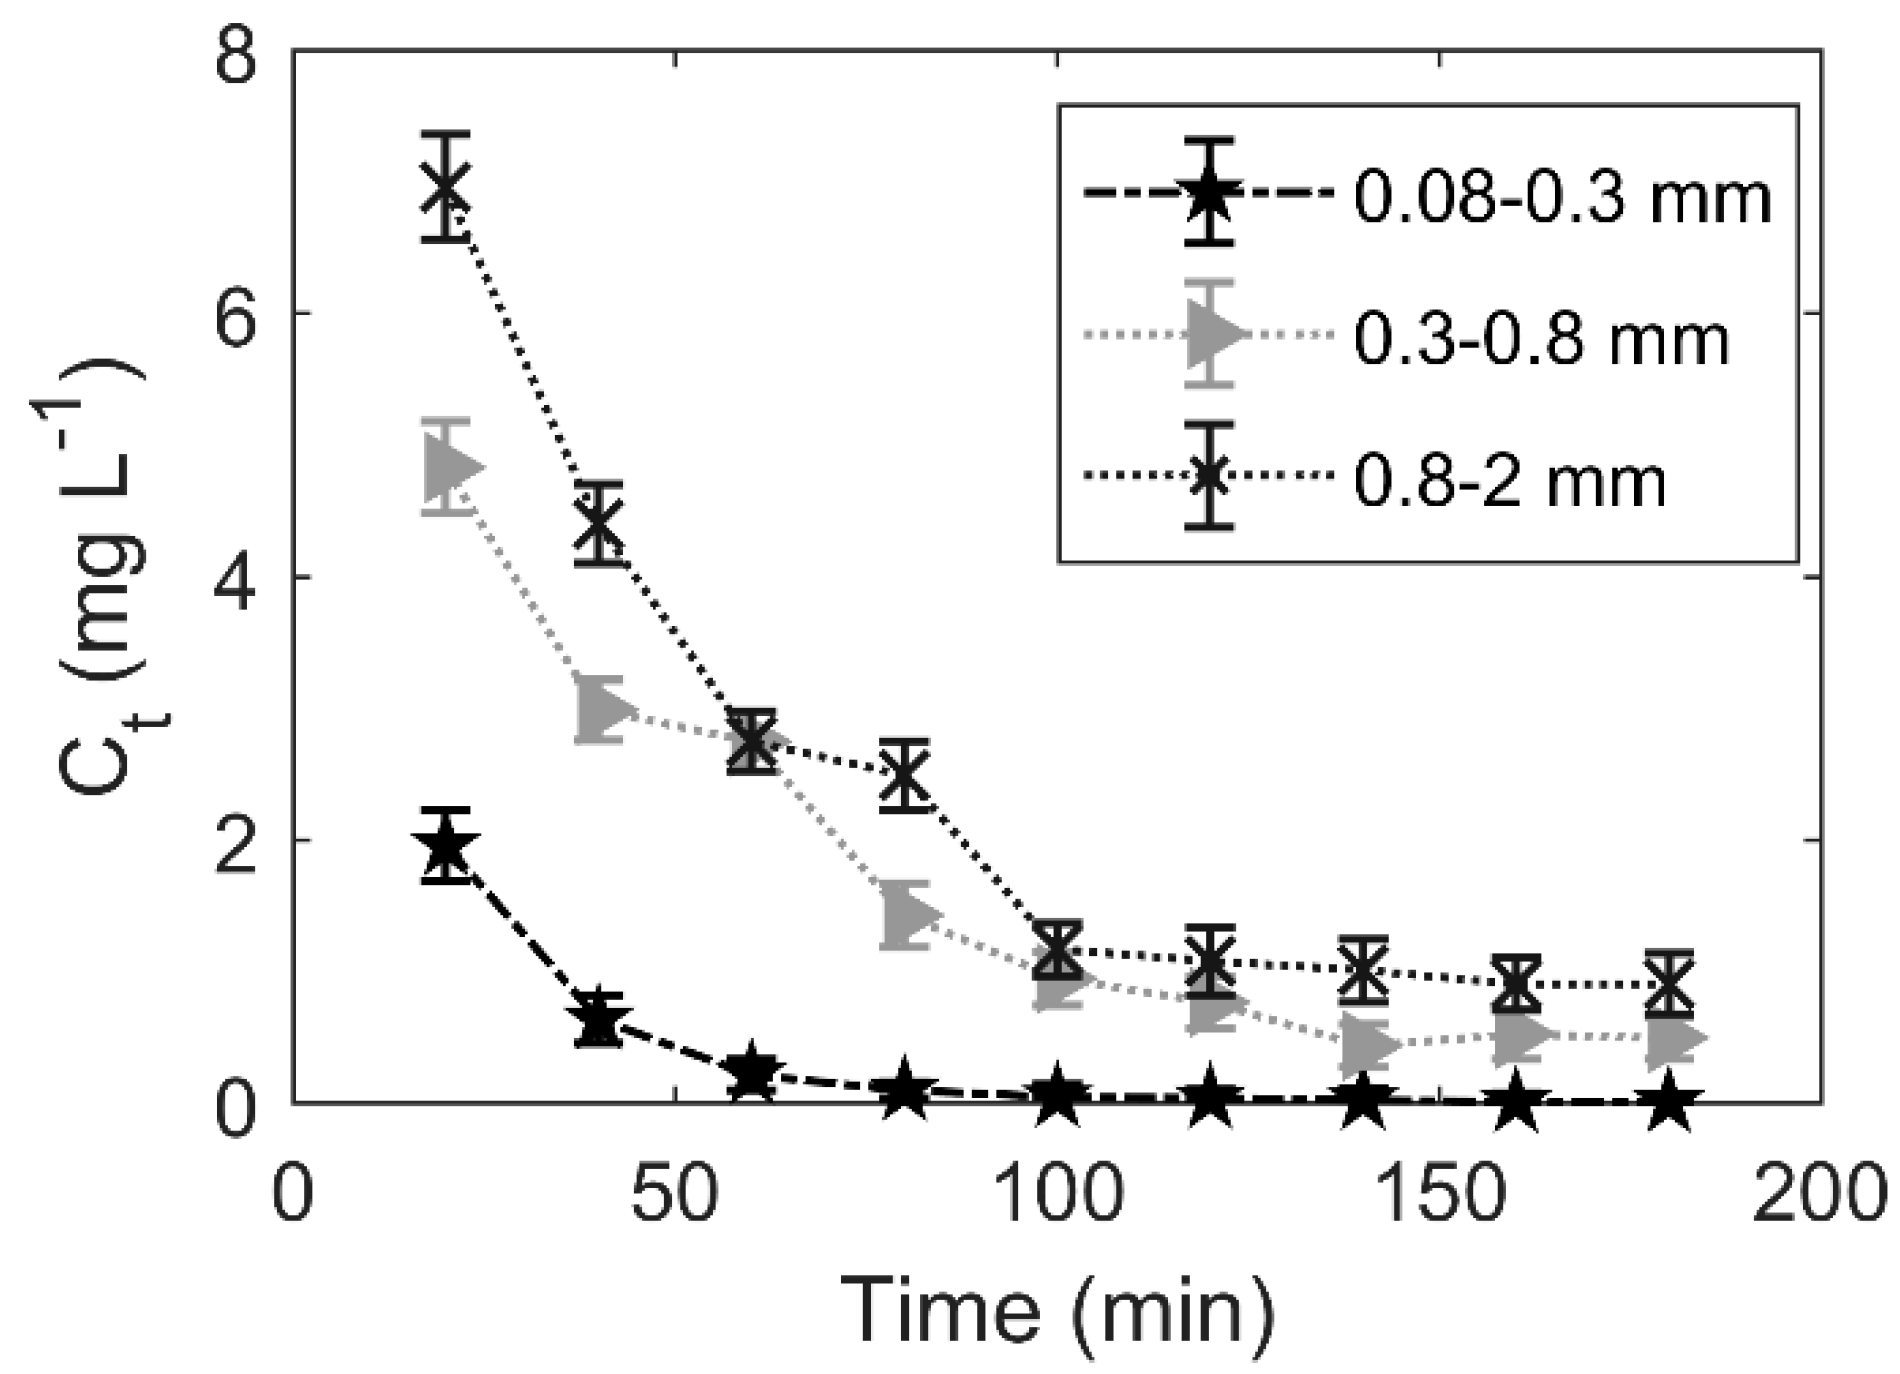
The particle size of the adsorbent is an operational parameter that can be modified in a continuous process to directly affect the removal capacity by changing the mass-transfer area. Figure 4 shows the experimental results for the continuous removal of methylene blue using banana peel as the adsorbent with three different particle sizes.
A greater decrease in effluent concentration was observed for smaller banana peel particle sizes. In the range of 0.3–0.8 and 0.8–2.0 mm particle sizes, a continuous decrease was observed until 40 and 60 min, respectively, after which a step change of 20 min is observed for two conditions. For times up to this range, a continuous decrease in effluent concentration was observed. However, for particle sizes between 0.08–0.30 mm, a continuous decrease in effluent concentration was observed throughout all the experiments without any step change.
Regarding the overall removal percentage in the system, a similar trend can be observed to that of the effluent concentration, with values of 88.4%, 86.2%, and 84.0% for particle sizes of 0.08–0.3 mm, 0.3–0.8 mm, and 0.8–2.0 mm, respectively. These results demonstrate a better performance compared to the values obtained using jackfruit leaf with a particle size between 0.075–0.3 mm [56].
The inverse relationship between the removal percentage and particle size is consistent with findings from several research studies, which have shown that a decrease in particle size leads to an increase in the superficial area [76]. This increase in superficial area facilitates the biosorption processes, which in turn improves the total removal efficiencies [77].

3.5. Breakthrough Curve

Breakthrough curves are an essential tool for the characterization of adsorbent materials and the determination of their adsorption capacity and kinetic parameters. These curves provide valuable information on the adsorbent’s ability to remove pollutants from a given solution under specific operating conditions, such as flow rate, and fixed-bed height, among others. The shape and position of the breakthrough curve can reveal the adsorption capacity, mass transfer zone, and saturation point of the adsorbent. Furthermore, breakthrough curves are crucial for predicting the performance of adsorption systems at different scales and providing crucial data for process design and optimization. In this context, Figure 5 presents the breakthrough curve obtained for a fixed-bed height of 5.0 cm, corresponding to 30.866 g, and using banana peel with particle sizes ranging from 0.8 to 2 mm and a solution pH of 6. The experiments were conducted over a period of 48 h.
The analysis of yields for the Thomas Model (Figure 6) presents a total removal percentage of 62.5% for methylene blue, a total adsorption capacity of 22.11 mg of methylene blue per gram of banana peel, and a saturation time of 53 h. The total removal percentage for methylene blue estimated with this mathematical model was lower than the value obtained in experimental analysis (Figure 3 and Figure 4); this difference is attributed to an increase in column operation time causing a displacement of the transfer matter zone along the column, resulting in bed saturation and a decrease in removal capacity [50]. The total adsorption capacity of the model (qTH) exhibited a 12.9% error concerning the experimental value. Additionally, the determination coefficient value (0.9141) indicates a strong correlation between 𝐶𝑡/𝐶0. Table 4 presents a summary of the experimental and Thomas-model regression parameters.
The total adsorption capacity of banana peel, as determined experimentally and by the Thomas model, is higher than that reported for rice husk (4.41 mg g−1) [57], is comparable to the values reported for peanut shell (35.86 mg g−1) [52] and activated carbon from bamboo waste (39.02 mg g−1) [78], but lower by one order of magnitude than the results for guava leaf powder (around 100 mg g−1) [59].

4. Discussion

4.1. Effect of PH

The results presented in Figure 2 show that a pH of 6 provides a better adsorption potential, which can be attributed to the point of zero charge (pHPZC) of the banana peel adsorbent. The pHPZC is the pH at which the net surface electrical charges of the adsorbent are equal to zero. Below this value, the surface has a positive net charge, while a pH higher than the pHPZC results in a negative net charge on the surface. The pHPZC of banana (Musa sapientum) has been reported to be pH 4 by Dahiru [52], while other authors report values of about 5.5–5.8 for Musa paradisiaca [79,80,81]. Since methylene blue is a cationic dye, its adsorption is favored at pH values above the pHPZC [82]. In this context, the adsorption process at pH 6 presents an advantageous condition for the removal of this dye compared to the other analyzed conditions. However, as this pH value is very close to the pHPZC, it would be of interest to analyze the effect of the remotion of methylene blue in a process with a pH range between 6 and 8 to verify the best condition for methylene-blue adsorption.

4.2. Effect of the Fixed-Bed Height

Several studies have analyzed the adsorption of methylene blue onto banana peel in batch processes, but there is limited information regarding the effect of fixed-bed height, especially for residence time. However, Stavrinou et al. [83] analyzed the adsorption process of methylene blue in both batch and continuous experiments. They analyzed their results to explain the transport phenomena involved in the continuous process and the interaction of operating conditions on removal efficiency. It is important to note that their experiments were conducted with approximately half of the initial methylene blue concentration used in our study, with a small column of different fixed bed heights and particle sizes. Thus, a direct comparison of the results is not possible, but a comparison of the trends is interesting. Stavrinou et al. [81] reported a decrease in adsorption capacity with an increase in fixed-bed height and explained that this was due to nonuniformities in the flow field caused by non-random pore space heterogeneities, which can prevent methylene blue from accessing a fraction of the grain surface sites and lead to lower bed sorption capacity. However, in the present study, this effect was not observed, possibly due to the differences in operating conditions and their effect on removal efficiency. While the explanation of Stavrinou et al. [81] is correct for the boundary conditions of their experiment, the complexity of interaction between operating conditions and adsorbent material concerning removal efficiency prevents a generalization of their results to all cases, including the results presented in this document.

4.3. Effect of Particle Size

The experimental results for particle size analysis are consistent with the trends presented in several studies on continuous adsorption. However, it is interesting to note the presence of a step in the removal curve for the two largest particle size ranges in the study. The observed step in the curves of medium and large particle sizes for different bed heights may be attributed to axial dispersion resulting from the compaction of the bed during operation. In contrast, the bed of particles with smaller particle sizes (0.08–0.3 mm) exhibited lower difficulty in particle reorientation and was less affected by these phenomena [82,83].
It is important to analyze this effect observed at the laboratory scale in order to scale up the adsorption process to pilot and industrial sizes, as it could potentially decrease the useful life of the “filter” that uses banana peel as an adsorbent. Therefore, it will be necessary to define design conditions that prevent this phenomenon from occurring and select the correct particle size for the larger-scale process.
Table 5 presents a comparison of the obtained results with other publications for the removal of methylene blue and methyl violet using other agro-industrial waste products as adsorbents. It can be observed that banana peel exhibits similar or even higher removal capacities compared to the values reported for similar initial concentrations. However, since the experiments are not the same, a direct comparison of efficiency is not possible. Nevertheless, the results indicate that banana peel exhibits at least a similar removal capacity to other reported biomasses.

4.4. Breakthrough Curve

The observed breakthrough curve results indicate a good correlation between the experimental data and mathematical models, which confirms a monolayer interaction in the system, consistent with results present in several previous publications [52].
The primary experimental factor observed to have had a significant impact on the error regarding the mathematical model is the material saturation, indicating a modification in mass-transfer mechanisms compared to the monolayer phenomena defined by the Thomas model. However, due to the lack of surface characterization of banana peel regarding functional groups, it is not possible to confirm these assumptions.
Although the removal efficiency is lower than expected, these preliminary results could be used to scale up the process through mathematical modeling and to analyze its competitiveness with other medium-scale adsorption processes using traditional adsorbents available on the market.

5. Conclusions

Results obtained in this research, within the studied range, determine that the optimal conditions for removing methylene blue using banana peel are at pH 6, with a particle size of banana peel between 0.08 and 0.3 mm and a fixed-bed height of 7.5 cm.
Based on the analysis of the breakthrough curve with a fixed-bed height of 5 cm, using banana peel with a particle size of 0.8–2 mm and a pH of 6, the total adsorption capacity for methylene blue was determined to be 22.11 mg/g based on experimental data and 25.40 mg/g based on mathematical modeling (Thomas model). Additionally, the saturation time was found to be 53 h through the analysis of the Thomas model.
The data obtained in this research confirm the effect of process conditions on the total adsorption capacity. However, when comparing the trends with previous research, it becomes evident that there is a strong interaction between the operating conditions and the adsorbent characteristics, which can be explained by the significant impact of these aspects on removal efficiency. The state of the art indicates that this sensitivity to variables can be attributed to the different boundary conditions for transport phenomena associated with the monolayer adsorption process.
The main desired outcome of this preliminary investigation was to establish the essential information required for scaling up the adsorption process using mathematical modeling, specifically through breakthrough curve analysis.
However, it is important to acknowledge a limitation of this study, which lies in the absence of banana-peel-specific characterization, such as BET surface-area determination, the identification of surface functional groups (to explain interactions with methylene blue), and morphology analysis through SEM. Subsequent stages should include these characterizations to enable a more precise analysis and description of mass transport mechanisms.
Moreover, a key challenge for the next phase of this research is to identify alternatives that can mitigate the prolonged saturation times exhibited by the raw material, thereby enhancing its attractiveness for industrial-scale applications.
Addressing these limitations and challenges will undoubtedly contribute to further advancements in the utilization of banana peel as a valuable resource in sustainable wastewater treatment.

Author Contributions

Methodology M.P.D. and J.Y.; validation, J.Y. and J.M.; formal analysis, M.P.D. and J.Y.; investigation M.P.D. and J.Y.; resources M.P.D.; data curation, J.Y. and E.O.; writing—original draft preparation M.P.D.; writing—review and editing, M.P.D.; visualization, E.O.; supervision, M.P.D.; project administration, M.P.D.; funding acquisition, M.P.D. All authors have read and agreed to the published version of the manuscript.

Funding

This research was funded by Universidad Técnica Federico Santa María, grant number PI_L_17_14.

Institutional Review Board Statement

Not applicable.

Informed Consent Statement

Not applicable.

Data Availability Statement

Data used for generating this paper is associated with the thesis document of Miss Jennifer Yohn for the obtained Chemical Engineer grade; this document is available at https://repositorio.usm.cl/handle/11673/47965.

Acknowledgments

The authors thank Project PI_L_17_14 for supporting and financing the research development.

Conflicts of Interest

The authors declare no conflict of interest.

References

  1. Chandhru, M.; Rani, S.K.; Vasimalai, N. Reductive degradation of toxic six dyes in industrial wastewater using diaminobenzoic acid capped silver nanoparticles. J. Environ. Chem. Eng. 2020, 8, 104225. [Google Scholar] [CrossRef]
  2. Ayele, A.; Getachew, D.; Kamaraj, M.; Suresh, A. Phycoremediation of synthetic dyes: An effective and eco-friendly algal technology for the dye abatement. J. Chem. 2021, 2021, 9923643. [Google Scholar] [CrossRef]
  3. Hai, F.I.; Yamamoto, K.; Fukushi, K. Hybrid Treatment Systems for Dye Wastewater. Crit. Rev. Environ. Sci. Technol. 2007, 37, 315–377. [Google Scholar] [CrossRef]
  4. Amel, K.; Meniai, A.; Kerroum, D. Isotherm and Kinetics Study of Biosorption of Cationic Dye onto Banana Peel. Energy Procedia 2012, 19, 286–295. [Google Scholar] [CrossRef] [Green Version]
  5. Seow, T.W.; Lim, C.K.; Nor, M.H.M.; Mubarak, M.F.M.; Lam, C.Y.; Yahya, A.; Ibrahim, Z. Review on wastewater treatment technologies. Int. J. Appl. Environ. Sci. 2016, 11, 111–126. [Google Scholar]
  6. Fontana, I.B.; Peterson, M.; Cechinel, M.A.P. Application of brewing waste as biosorbent for the removal of metallic ions present in groundwater and surface waters from coal regions. J. Environ. Chem. Eng. 2018, 6, 660–670. [Google Scholar] [CrossRef]
  7. Sabnis, R.W. Handbook of Biological Dyes and Stains: Synthesis and Industrial Applications; John Wiley & Sons: Hoboken, NJ, USA, 2010. [Google Scholar]
  8. Dahri, M.K.; Kooh, M.R.R.; Lim, L.B. Removal of methyl violet 2B from aqueous solution using Casuarina equisetifolia needle. Int. Sch. Res. Not. 2013, 2013, 619819. [Google Scholar]
  9. Kooh, M.R.R.; Dahri, M.K.; Lim, L.B. Removal of the methyl violet 2B dye from aqueous solution using sustainable adsorbent Artocarpus odoratissimus stem axis. Appl. Water Sci. 2017, 7, 3573–3581. [Google Scholar] [CrossRef] [Green Version]
  10. Crini, G. Non-conventional low-cost adsorbents for dye removal: A review. Bioresour. Technol. 2006, 97, 1061–1085. [Google Scholar] [CrossRef]
  11. Mahesh, R.; Gadekar, M. Mansoor Ahammed. Coagulation/flocculation process for dye removal using water treatment residuals: Modelling through artificial neural networks. Des. Water Treat. 2016, 57, 26392–26400. [Google Scholar] [CrossRef]
  12. Rodrigues, C.; Madeira, L.; Boaventura, R. Treatment of textile dye wastewaters using ferrous sulphate in a chemical coagulation/flocculation process. Environ. Technol. 2012, 34, 719–729. [Google Scholar] [CrossRef] [PubMed]
  13. Teh, C.Y.; Budiman, P.M.; Shak, P.Y.; Wu, T.Y. Recent Advancement of Coagulation–Flocculation and Its Application in Wastewater Treatment. Ind. Eng. Chem. Res. 2016, 55, 4363–4389. [Google Scholar] [CrossRef]
  14. Bakheet, B.; Yuan, S.; Li, Z.; Wang, H.; Zuo, J.; Komarneni, S.; Wang, Y. Electro-peroxone treatment of Orange II dye wastewater. Water Res. 2013, 47, 6234–6243. [Google Scholar] [CrossRef] [PubMed]
  15. Benincá, C.; Peralta-Zamora, P.; Tavares, C.; Igarashi-Mafra, L. Degradation of an Azo Dye Ponceau 4R and Treatment of Wastewater from a Food Industry by Ozonation.Ozone. Sci. Eng. 2013, 354, 295–301. [Google Scholar] [CrossRef]
  16. Masoumbeigi, H.; Rezaee, A. Removal of Methylene Blue (MB) dye from synthetic wastewater using UV/H2O2 advanced oxidation process. Health Policy Sustain. Health 2015, 2, 160–166. [Google Scholar]
  17. Wawrzkiewicz, M.; Hubicki, Z.; Kilislioglu, A. Anion Exchange Resins as Effective Sorbents for Removal of Acid, Reactive, and Direct Dyes from Textile Wastewaters. Ion. Exchange. 2015, 2, 37–72. [Google Scholar] [CrossRef] [Green Version]
  18. Suteu, D.; Bilba, D.; Coseri, S. Macroporous polymeric ion exchangers as adsorbents for the removal of cationic dye basic blue 9 from aqueous solutions. J. Appl. Polym. Sci. 2014, 131, 39620. [Google Scholar] [CrossRef]
  19. Mondal, S.; Ouni, H.; Dhahbi, M.; De, S. Kinetic modeling for dye removal using polyelectrolyte enhanced ultrafiltration. J. Hazard. Mater. 2012, 229–230, 381–389. [Google Scholar] [CrossRef]
  20. Buscio, V.; García-Jiménez, M.; Vilaseca, M.; López-Grimau, V.; Crespi, M.; Gutiérrez-Bouzán, C. Reuse of Textile Dyeing Effluents Treated with Coupled Nanofiltration and Electrochemical Processes. Materials 2016, 9, 490. [Google Scholar] [CrossRef]
  21. Katheresan, V.; Kansedo, J.; Sie Yon, J. Efficiency of Various Recent Wastewater Dye Removal Methods: A Review. J. Environ. Chem. Eng. 2018, 6, 4676–4697. [Google Scholar] [CrossRef]
  22. Nguyen, T.; Ngo, H.; Guo, W.; Zhang, J.; Liang, S.; Yue, Q.; Li, Q. Applicability of agricultural waste and by-products for adsorptive removal of heavy metals from wastewater. Biores. Technol. 2013, 148, 574–585. [Google Scholar] [CrossRef] [PubMed]
  23. El-Sayed, H.E.; El-Sayed, M.M. Assessment of food processing and pharmaceutical industrial wastes as potential biosorbents: A review. Biomed. Res. Int. 2014, 2014, 146769. [Google Scholar] [CrossRef] [PubMed]
  24. Hayder, A.A.; Mohammed, A.K.; Alaa, H.A. Removal of heavy metals from wastewater using agricultural byproducts. J. Water Suppl. Res. Technol. Aqua. 2020, 69, 99–112. [Google Scholar] [CrossRef]
  25. Ahmaruzzaman, M. Adsorption of phenolic compounds on low-cost adsorbents: A review. Adv. Colloid. Interface Sci. 2008, 143, 48–67. [Google Scholar] [CrossRef] [PubMed]
  26. Aksu, Z.; Gönen, F. Biosorption of phenol by immobilized activated sludge in a continuous packed bed: Prediction of breakthrough curves. Proc. Biochem. 2004, 39, 599–613. [Google Scholar] [CrossRef]
  27. Bazrafshan, E.; Ahmadabadi, M.; Mahvi, A. Reactive red-120 removal by activated carbon obtained from cumin herb wastes. Fresenius Environ. Bulletin. 2013, 22, 584–590. [Google Scholar]
  28. Benadjemia, M.; Millière, L.; Reinert, L.; Benderdouche, N.; Declaux, L. Preparation, characterization and Methylene Blue adsorption of phosphoric acid activated carbons from globe artichoke leaves. Fuel Proc. Technol. 2011, 92, 1203–1212. [Google Scholar] [CrossRef]
  29. Din, A.; Hameed, B.; Ahmad, A. Batch adsorption of phenol onto physiochemical-activated coconut shell. J. Haz. Mat. 2009, 161, 1522–1529. [Google Scholar] [CrossRef]
  30. Anisuzzaman, S.; Bono, A.; Krishnaiah, D.; Tan, Y. A study on dynamic simulation of phenol adsorption in activated carbon packed bed column. J. King Saud. Univ. Eng. Sci. 2016, 28, 47–55. [Google Scholar] [CrossRef] [Green Version]
  31. El-Ashtoukhy, E.S.; Fouad, Y. Liquid–liquid extraction of methylene blue dye from aqueous solutions using sodium dodecylbenzenesulfonate as an extractant. Alex. Eng. J. 2015, 54, 77–81. [Google Scholar] [CrossRef] [Green Version]
  32. Lee, D.; Hong, W.; Hwang, K. Removal of an Organic Dye from Water Using a Predispersed Solvent Extraction. Sep. Sci. Technol. 2000, 35, 1951–1962. [Google Scholar] [CrossRef]
  33. Fox, M.; Dulay, M. Heterogeneous Photocatalysis. Chem. Rev. 1993, 93, 341–357. [Google Scholar] [CrossRef]
  34. Chauhan, R.; Kumar, A.; Chaudhary, R. Photocatalytic degradation of methylene blue with Fe doped ZnS nanoparticles. Spectrochim. Acta Part. A Mol. Biomol. Spectroscop. 2013, 113, 250–256. [Google Scholar] [CrossRef]
  35. Keweloh, H.; Heipieper, H.-J.; Rehm, H.-J. Protection of bacteria against toxicity of phenol by immobilization in calcium alginate. Appl. Micro. Biotechnol. 1989, 31, 383–389. [Google Scholar] [CrossRef]
  36. Bülbül, G.; Aksu, Z. Investigation of the combined effects of external mass transfer and biodegradation rates on phenol removal using immobilized P. putida in a packed-bed column reactor. Enz. Micro. Technol. 1998, 22, 397–403. [Google Scholar] [CrossRef]
  37. Gemeiner, P.; Štefuca, V.; Báleš, V. Biochemical engineering of biocatalysts immobilized on cellulosic materials. Enz. Micro. Technol. 1993, 7, 551–566. [Google Scholar] [CrossRef]
  38. Giannakoudakis, D.; Kyzas, G.; Avranas, A.; Lazaridis, N. Multi-parametric adsorption effects of the reactive dye removal with commercial activated carbons. J. Molec. Liq. 2016, 213, 381–389. [Google Scholar] [CrossRef]
  39. Saroyan, H.S.; Giannakoudakis, D.A.; Sarafidis, C.S.; Lazaridis, N.K.; Deliyanni, E.A. Effective impregnation for the preparation of magnetic mesoporous carbon: Application to dye adsorption. J. Chem. Technol. Biotechnol. 2017, 92, 1899–1911. [Google Scholar] [CrossRef]
  40. Dai, Y.; Sun, Q.; Wang, W.; Lu, L.; Liu, M.; Li, J.; Yang, S.; Sun, Y.; Zhang, K.; Xu, J.; et al. Utilizations of agricultural waste as adsorbent for the removal of contaminants: A review. Chemosphere 2018, 11, 235–253. [Google Scholar] [CrossRef]
  41. Akkaya, G.; Güzel, F. Application of some domestic wastes as new low-cost biosorbents for removal of methylene blue: Kinetic and equilibrium studies. Chem. Eng. Commun. 2014, 201, 557–578. [Google Scholar] [CrossRef]
  42. de Oliveira Brito, S.M.; Andrade, H.M.C.; Soares, L.F.; de Azevedo, R.P. Brazil nut shells as a new biosorbent to remove methylene blue and indigo carmine from aqueous solutions. J. Hazard. Mater. 2013, 174, 84–92. [Google Scholar] [CrossRef] [PubMed]
  43. López-Cabeza, R.; Gámiz, B.; Cornejo, J.; Celis, R. Behavior of the enantiomers of the herbicide 982 imazaquin in agricultural soils under different application regimes. Geoderma 2017, 293, 64–72. [Google Scholar] [CrossRef] [Green Version]
  44. Saeed, A.; Sharif, M.; Iqbal, M. Application potential of grapefruit peel as dye sorbent: Kinetics, equilibrium and mechanism of crystal violet adsorption. J. Hazard. Mater. 2010, 179, 564–572. [Google Scholar]
  45. Tang, C.F.; Shu, Y.; Zhang, R.Q.; Li, X.; Song, J.F.; Li, B.; Zhang, Y.T.; Ou, D.L. Comparison of the removal and adsorption mechanisms of cadmium and lead from aqueous solution by activated carbons prepared from Typha angustifolia and Salix matsudana. RSC Adv. 2017, 26, 16092–16103. [Google Scholar] [CrossRef] [Green Version]
  46. Tonucci, M.C.; Gurgel, L.V.A.; Aquino, S.F.D. Activated carbons from agricultural byproducts (pine tree and coconut shell), coal, and carbon nanotubes as adsorbents for removal of sulfamethoxazole from spiked aqueous solutions: Kinetic and thermodynamic studies. Ind. Crop. Prod. 2015, 74, 111–121. [Google Scholar] [CrossRef]
  47. Mohammed, N.; Grishkewich, N.; Waeijen, H.; Berry, R.; Tam, K. Continuous flow adsorption of methylene blue by cellulose nanocrystal-alginate hydrogel beads in fixed bed columns. Carbohydr. Polym. 2016, 136, 1194–1202. [Google Scholar] [CrossRef]
  48. Patel, H. Fixed-bed column adsorption study: A comprehensive review. Appl. Water Sci. 2019, 9, 45. [Google Scholar] [CrossRef] [Green Version]
  49. Oguz, E. Fixed-bed column studies on the removal of Fe3+ and neural network modelling. Arab. J. Chemist. 2018, 10, 313–320. [Google Scholar] [CrossRef] [Green Version]
  50. Gallo-Cordova, A.; Silva-Gordillo, M.; Muñoz, A.; Arboleda-Faini, X.; Streitwieseer, D. Comparison of the adsorption capacity of organic compounds present in produced water with commercially obtained walnut shell and residual biomass. J. Env. Chem. Eng. 2017, 5, 4041–4050. [Google Scholar] [CrossRef]
  51. Sarici-Özdemir, Ç. Removal of Methylene Blue by Activated Carbon Prepared from Waste in a Fixed-Bed Column. Partic. Sci. Technol. 2014, 32, 311–318. [Google Scholar] [CrossRef]
  52. Akpomie, K.G.; Conradie, J. Banana peel as a biosorbent for the decontamination of water pollutants. A Rev. Env. Chem. Lett. 2020, 18, 1085–1112. [Google Scholar] [CrossRef]
  53. Aurore, G.; Parfait, B.; Fahrasmane, L. Bananas, raw materials for making processed food products. Trends Food Sci. Technol. 2009, 20, 78–91. [Google Scholar] [CrossRef]
  54. Annadurai, G.; Juang, R.S.; Lee, D.J. Use of cellulose-based wastes for adsorption of dyes from aqueous solutions. J. Hazard. Mater. 2002, B92, 263–274. [Google Scholar] [CrossRef] [PubMed]
  55. Achack, M.; Hafdini, A.; Ouazzani, N.; Sayadi, S.; Mandi, L. Low cost biosorbent “banana peel” for the removal of phenolic compounds from olive mill wastewater: Kinetic and equilibrium studies. J. Hazard. Mater. 2009, 1661, 117–125. [Google Scholar] [CrossRef]
  56. Uddin, T.; Rukanuzzaman, M.; Khan, M.; Islam, A. Adsorption of methylene blue from aqueous solution by jackfruit (Artocarpus heteropyllus) leaf powder: A fixed-bed column study. J. Env. Mang. 2009, 90, 3443–3450. [Google Scholar] [CrossRef]
  57. Han, R.; Wang, Y.; Zhao, X.; Wang, Y.; Xie, F.; Cheng, J.; Tang, M. Adsorption of methylene blue by phoenix tree leaf powder in a fixed-bed column: Experiments and prediction of breakthrough curves. Desalination 2009, 245, 284–297. [Google Scholar] [CrossRef]
  58. Jawad, A.H.; Rashid, R.A.; Ishak, M.A.; Ismail, K. Adsorptive removal of methylene blue by chemically treated cellulosic waste banana (Musa sapientum) peels. J. Taibah Univ. Sci. 2018, 6–12, 809–819. [Google Scholar] [CrossRef] [Green Version]
  59. Ponnusami, V.; Vikram, S.; Srivastava, S.N. Guava Psidium guajava leaf powder: Novel adsorbent for removal of methylene blue from aqueous solutions. J. Hazard. Mater. 2008, 1521, 276–286. [Google Scholar] [CrossRef]
  60. INN. NCh842 Alimentos—Determinación de Ceniza. 2018. Available online: http://www.inn.cl/inn-informa-nuevas-normas-chilenas (accessed on 12 April 2022).
  61. Eurofins. Laboratorio de AlimentosIDA. 2016. Available online: https://www.eurofins.cl/media/166258/le340-qu%C3%ADmica-alimentos.pdf (accessed on 12 April 2022).
  62. IDAL. Determinación Humedad—Método en Estufa de Aire. 2011. Available online: http://www.idal.cl/sgcidal/images/stories/Procedimientos/Laboratorio/Determinacion%20humedad%20metodo%20estufa%20de%20aire.pdf (accessed on 12 April 2022).
  63. ASTM International. ASTM E1756-08(2015), Standard Test Method for Determination of Total Solids in Biomass. 2015. Available online: http://www.astm.org/cgi-bin/resolver.cgi?E1756-08(2015) (accessed on 12 April 2022).
  64. ASTM International. ASTM D6683-14, Standard Test Method for Measuring Bulk Density Values of Powders and Other Bulk Solids as Function of Compressive Stress. 2014. Available online: http://www.astm.org/cgi-bin/resolver.cgi?D6683-14 (accessed on 15 April 2022).
  65. ASTM International. ASTM D854-14, Standard Test Methods for Specific Gravity of Soil Solids by Water Pycnometer. 2014. Available online: http://www.astm.org/cgi-bin/resolver.cgi?D854-14 (accessed on 15 April 2022).
  66. Manger, E. Porosity and Bulk. Density of Sedimentary Rocks; United States Departament of the Interior: Washington, DC, USA, 1963. Available online: https://pubs.usgs.gov/bul/1144e/report.pdf (accessed on 3 May 2022).
  67. Amaringo Villa, F.; Hormaza Anaguano, A. Determinación del punto de carga cero y punto isoeléctrico de dos residuos agrícolas y su aplicación en la remoción de colorantes. Rev. De. Investig. Agrar. Y Ambiental. 2013, 4, 27–36. Available online: https://dialnet.unirioja.es/descarga/articulo/5344979.pdf (accessed on 15 May 2022). [CrossRef]
  68. Archibald, J. Nutrient Composition of Banana Skins. J. Dairy. Sci. 1949, 32, 969–971. [Google Scholar] [CrossRef]
  69. Oberoi, H.; Sandhu, S.; Vadlani, P. Statistical optimization of hydrolysis process for banana peels using cellulolytic and pectinolytic enzymes. Food Bioprod. Proc. 2012, 90, 257–265. [Google Scholar] [CrossRef]
  70. Abubakar, U.; Yusuf, K.; Safiyanu, I.; Abdullahi, S.; Saidu, S.; Abdu, G.; Indee, A. Proximate and mineral composition of corn cob, banana and plantain peels. Int. J. Food Sci. Nut. 2016, 1, 25–27. [Google Scholar]
  71. Mandavgane, S.; Pathak, P.; Kulkarni, B. Fruit peel waste: Characterization and its potential uses. Curr. Sci. 2017, 113, 444–454. [Google Scholar] [CrossRef]
  72. Mondal, N.K. Natural Banana (Musa acuminate) Peel: An Unconventional Adsorbent for Removal of Fluoride from Aqueous Solution through Batch Study. Water Conserv. Sci. Eng. 2017, 1, 223–232. [Google Scholar] [CrossRef] [Green Version]
  73. Bhaumik, R.; Mondal, N. Optimizing adsorption of fluoride from water by modified banana peel dust using response surface modelling approach. Appl. Water Sci. 2016, 6, 115–135. [Google Scholar] [CrossRef] [Green Version]
  74. Werther, J.; Saenger, M.; Hartge, E.-U.; Ogada, T. Combustion of agricultural residues. Prog. Energy Comb. Sci. 2000, 26, 1–27. [Google Scholar] [CrossRef]
  75. Gao, X.; Driver, L.; Kasin, I.; Masiello, C.; Pyle, L.; Dugan, B.; Ohlson, M. Effect of environmental exposure on charcoal density and porosity in a boreal forest. Sci. Tot. Env. 2017, 592, 316–325. [Google Scholar] [CrossRef]
  76. Fogler, H.S. Catalysis and catalitic reactors. In Elements of Chemical Reaction Engineering; Amundson, N.R., Ed.; Prentice Hall Professional Technical Reference: Hoboken, NJ, USA, 2005; pp. 645–680. [Google Scholar]
  77. Castellar Ortega, G.; Cardozo Arrieta, B.; Suarez Guerrero, J.; Vega Taboada, J. Adsorción por lote y en una columna de lecho fijo del colorante B39 sobre carbón activado granular. Prospect. 2013, 11, 66–75. [Google Scholar] [CrossRef] [Green Version]
  78. Ahmad, T.; Danish, M. Prospects of banana waste utilization in wastewater treatment: A review. J. Env. Manag. 2018, 206, 330–348. [Google Scholar] [CrossRef]
  79. Dahiru, M.; Zango, Z.U. Maje Alhaji Haruna, Cationic Dyes Removal Using Low-Cost Banana Peel Biosorbent. Am. J. Mat. Sci. 2018, 8, 32–38. [Google Scholar] [CrossRef]
  80. Salleh, A.; Mahmoud, D.; Ghani, W.; Idris, A. Cationic and Anionic Dye Adsorption by Agricultural Solid Wastes: A Comprehensive Review. Desalination 2011, 280, 1–13. [Google Scholar] [CrossRef]
  81. Stavrinou, A.; Aggelopoulos, C.A.; Tsakiroglou, C.D. A Methodology to Estimate the Sorption Parameters from Batch and Column Tests: The Case Study of Methylene Blue Sorption onto Banana Peels. Processes 2020, 8, 1467. [Google Scholar] [CrossRef]
  82. Delgado, J.M.P.Q. A critical review of dispersion in packed beds. Heat. Mass. Transfer. 2006, 42, 279–310. [Google Scholar] [CrossRef]
  83. Luzi, C.D.; Martinez, O.M.; Barreto, G.F. Effect of radial velocity profiles on axial dispersion in packed beds: Asymptotic behaviour. Braz. J. Chem. Eng. 2021, 38, 865–885. [Google Scholar] [CrossRef]
  84. Zhang, W.; Dong, L.; Yan, H.; Li, H.; Jiang, Z.; Kan, X.; Cheng, R. Removal of methylene blue from aqueous solutions by straw based adsorbent in a fixed-bed column. Chem. Eng. J. 2011, 173, 429–436. [Google Scholar] [CrossRef]
  85. Ferrero, F. Dye removal by low cost adsorbents: Hazelnut shells in comparison with wood sawdust. J. Hazard. Mater. 2007, 142, 144–152. [Google Scholar] [CrossRef]
  86. Song, J.; Zou, W.; Bian, Y.; Su, F.; Han, R. Adsorption characteristics of methylene blue by peanut husk in batch and. Desalination 2011, 265, 119–125. [Google Scholar] [CrossRef]
  87. Singh, B.; Thakur, V.; Bhatia, G.; Verma, D.; Singh, K. Eco-friendly and Cost-effective Use of Rice Straw in the Form of Fixed Bed Column to Remove Water Pollutants. J. Bioremediat Biodegrad. 2016, 7, 374. [Google Scholar] [CrossRef] [Green Version]
  88. Abbas, S.; Kamar, F.; Hossien, Y. Adsorption of methyl violet 2B dye from aqueous solutions onto waste of Banana peel using fixed-bed column. Int. J. Civ. Eng. Technol. 2018, 9, 2094–2109. [Google Scholar]
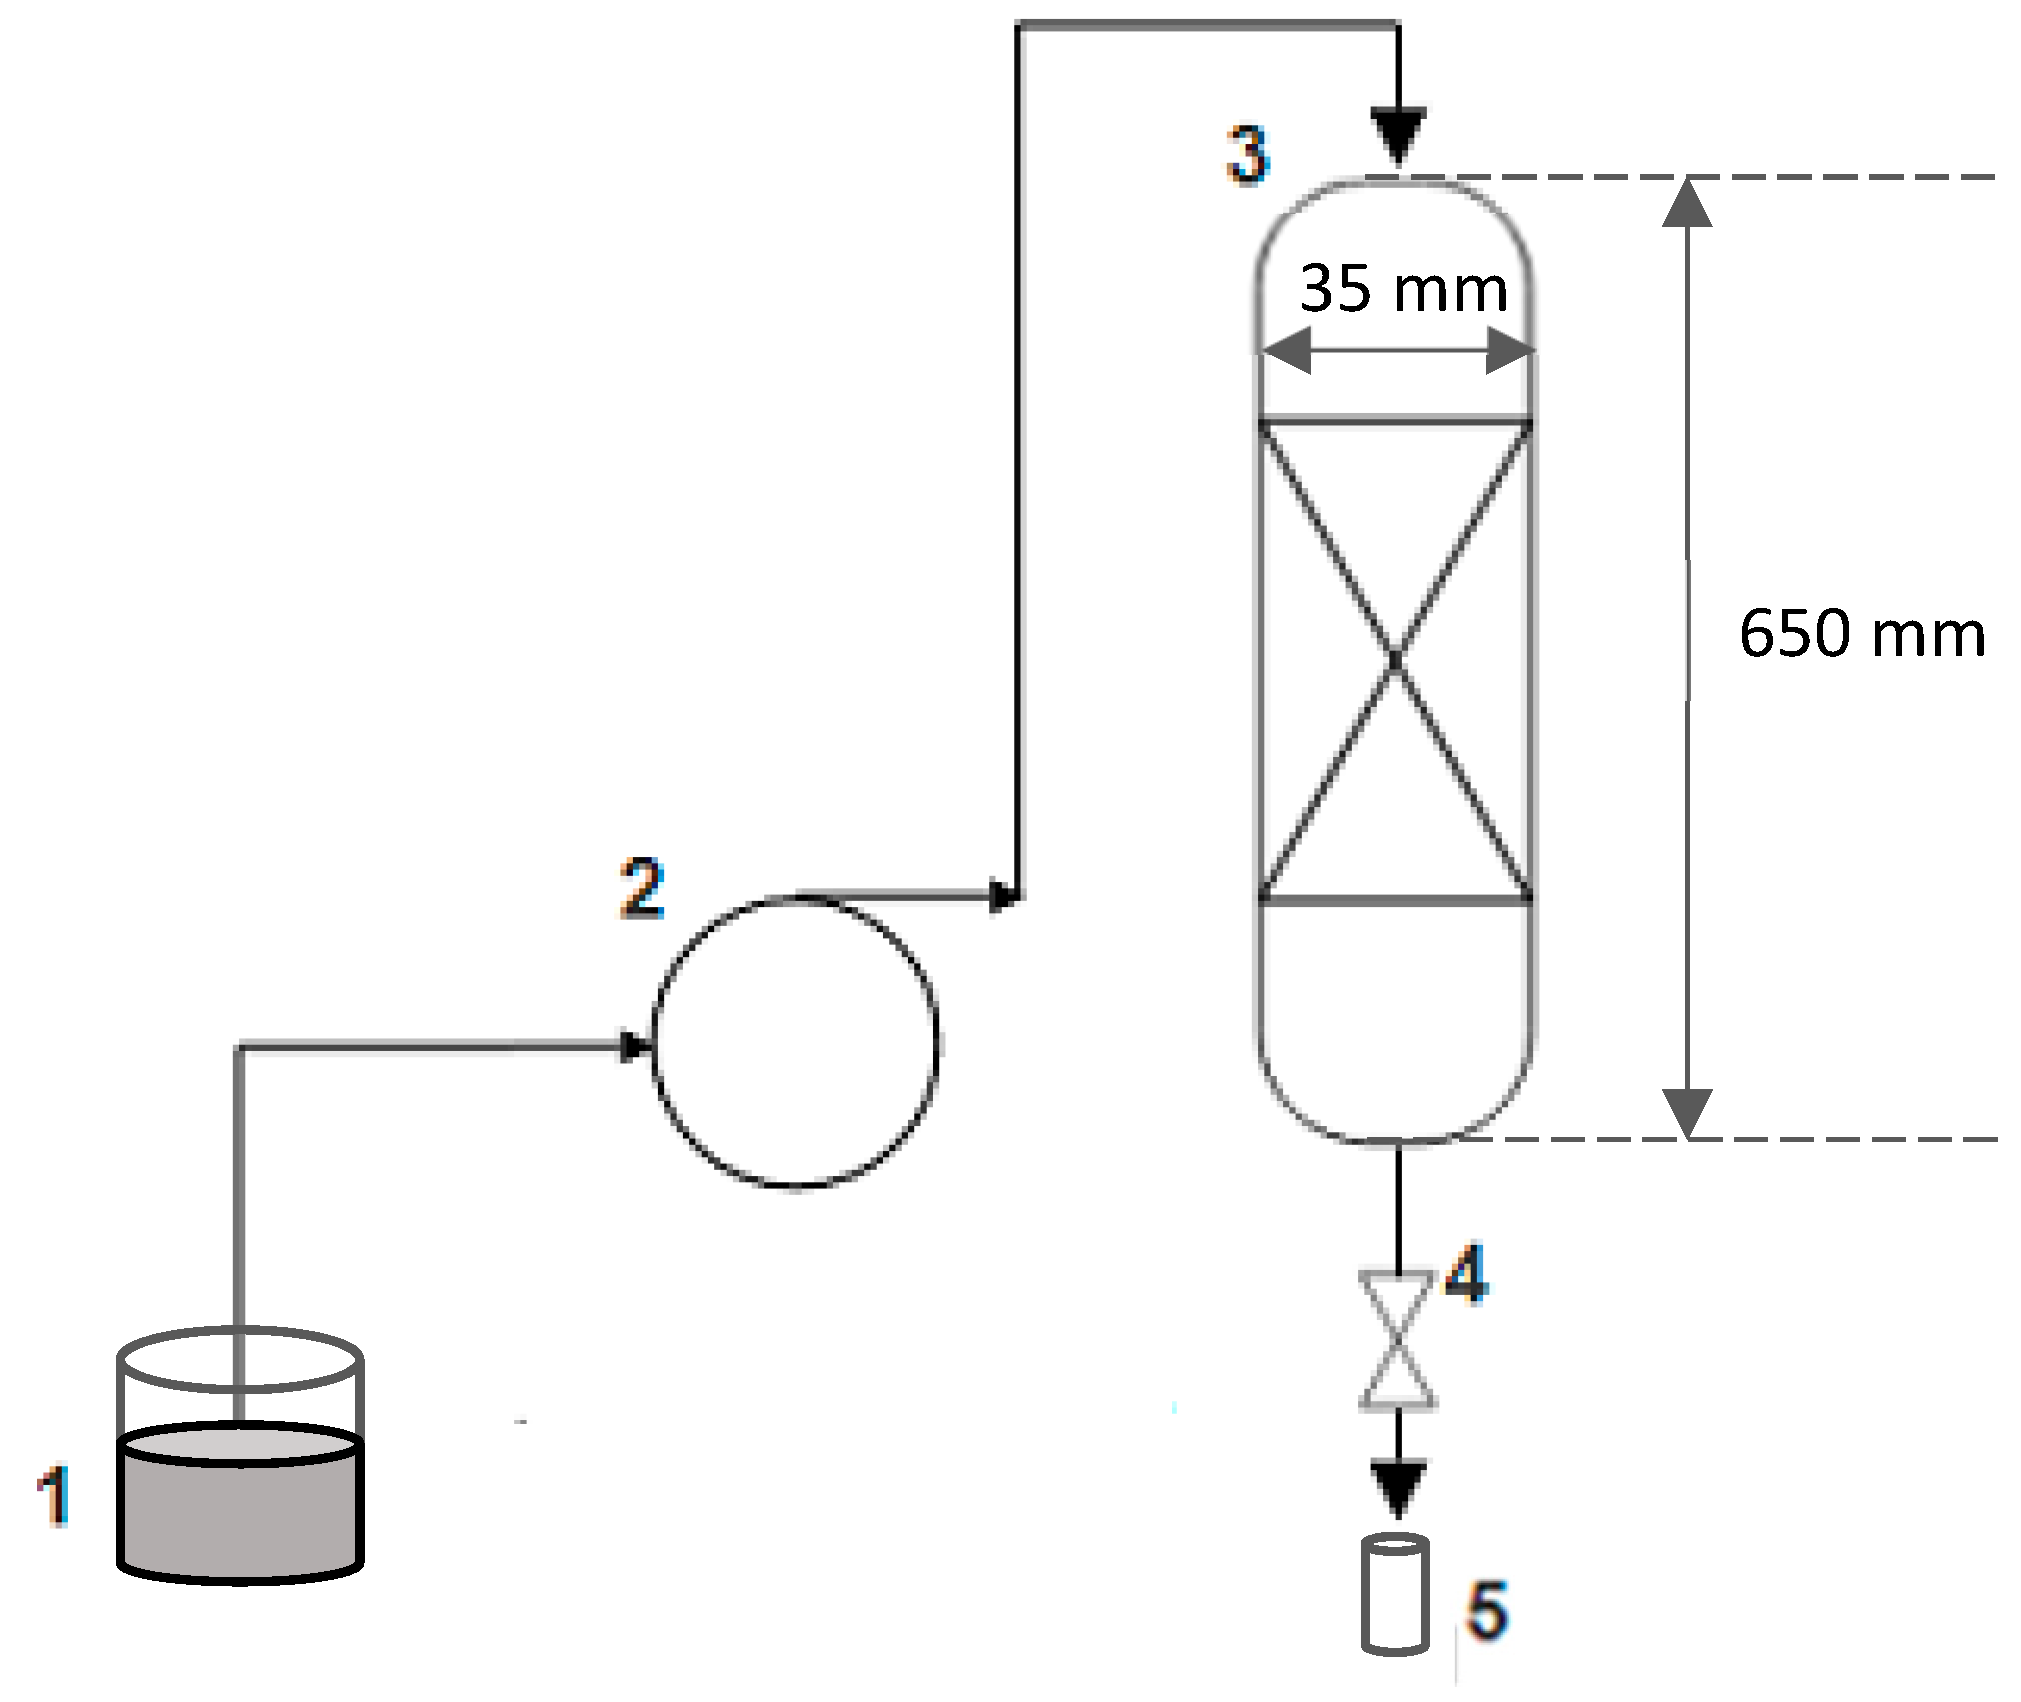
Figure 1. Experimental setup: (1) methylene blue solution; (2) peristaltic pump; (3) glass column (with a fixed bed of banana peel); (4) flow regulation valve (manual); and (5) sample collector.
Sustainability 15 09870 g001
Figure 2. Zero-point charge for banana peel.
Sustainability 15 09870 g002
Figure 3. Effect of pH in methylene blue remotion using banana-peel-like adsorbent.
Sustainability 15 09870 g003
Figure 4. Effect of Fixed Bed Height in the continuous remotion of methylene blue using banana-peel-like adsorbent.
Sustainability 15 09870 g004
Figure 5. Effect of particle size in continuous remotion of methylene blue using banana-peel like adsorbent.
Sustainability 15 09870 g005
Figure 6. Continuous adsorption results and fit according to Thomas model.
Sustainability 15 09870 g006
Table 1. Proximate analysis for banana peel.
ParameterValueUnit
Ash12.88 ± 0.1%
Moisture84.51 ± 0.24%
Total Solids15.49 ± 0.24%
Table 2. Moisture content (%) of dried banana peel.
MoistureOperating ConditionsReference
2.98 ± 0.02Particle size: 0.2 mm[72]
Drying temperature: 60 °C, 24 h
6.1Particle size: 0.25 mm
Drying temperature: 50 °C, 24 h
[73]
9.8Particle size: 0.106–0.9 mm[71]
Drying temperature: 70 °C
Table 3. Physical characterization of banana peel.
Particle Size Range (mm)Density (g/cm3)Specific Gravity (g/cm3)Porosity (%)
0.08–0.30.2480.3854.74
0.3–0.81.0050.3947.46
0.8–21.0250.447.46
Table 4. Experimental and Thomas-model regression parameters.
ResultValue
Experimental
       Removal, %62.5
       Total adsorption capacity, mg g−122.11
Thomas model
        q T H , mg g−125.40
        k T H , mL mg−1 min−14.5 × 10⁻²
        t t o t , h53.0
        R 2 0.914
Table 5. Comparative data of bioadsorbents derived from waste biomass.
BioadsorbentDye H e i g h t
( c m )
C 0
( m g / L )
Flow
( m L / m i n )
Particle
Size   ( m m )
t e
( m i n )
q e x p e r i m e n t a l
( m g · g 1 )
Reference
Jackfruit Leaf PowderMethylene blue7.5300400.075–0.3350264[56]
StrawMethylene blue7.820001.280.063–0.15150227.8[84]
Phoenix Tree Leaf PowderMethylene blue105080.25–0.4251200131[57]
Hazelnut shellMethylene blue8.310019.10.12530050[85]
Peanut shellMethylene blue8.5407.50.425–0.8540042.2[86]
Rice strawMethylene blue2.5100100.3–0.511027.5[87]
Banana PeelMethyl violet 2B105080.15–0.36028.33[88]
320.15–0.36016.64
Banana PeelMethylene blue540100.8–2180138This study
7.540100.8–2180140.3
1040100.8–2180140
540100.08–0.3180145.1
540100.3–0.8180100.9
Disclaimer/Publisher’s Note: The statements, opinions and data contained in all publications are solely those of the individual author(s) and contributor(s) and not of MDPI and/or the editor(s). MDPI and/or the editor(s) disclaim responsibility for any injury to people or property resulting from any ideas, methods, instructions or products referred to in the content.