Article

Solar-Induced Photocatalytic Degradation of Reactive Red and Turquoise Dyes Using a Titanium Oxide/Xanthan Gum Composite

by
Abeer I. Alwared
1,
Noor A. Mohammed
1,
Tariq J. Al-Musawi
2,* and
Ahmed A. Mohammed
1
1
Department of Environmental Engineering, College of Engineering, University of Baghdad, Baghdad 10071, Iraq
2
Building and Construction Techniques Engineering Department, Al-Mustaqbal University, Hillah 51001, Iraq
*
Author to whom correspondence should be addressed.
Sustainability 2023, 15(14), 10815; https://doi.org/10.3390/su151410815
Submission received: 16 December 2022 / Revised: 1 June 2023 / Accepted: 18 June 2023 / Published: 10 July 2023

Abstract

:
The present study explores the solar-induced photocatalytic degradation of reactive red (RR) and reactive turquoise (RT) dyes in a single system using TiO2 immobilized in xanthan gum (TiO2/XG), synthesized using the sol–gel dip-coating technique for direct precipitation. SEM-EDX, XRD, FTIR, and UV–Vis were used to assess the characteristics of the resulting catalyst. Moreover, the effects of different operating parameters, specifically pH, dye concentration, TiO2/XG concentration, H2O2 concentration, and contact time, were also investigated in a batch photocatalytic reactor. The immobilized TiO2/XG catalyst showed a slight adsorption degradation efficiency and then improved the RR and RT dye degradation activity (92.5 and 90.8% in 120 min) under solar light with a remarkable Langmuir–Hinshelwood pseudo-first-order degradation rate of 0.0183 and 0.0151 min−1, respectively, under optimum conditions of pH 5, dye concentration of 25 mg/L, TiO2/XG concentration of 25 mg/L, H2O2 concentration of 400 mg/L, and reaction time of 120 min. The improved photocatalytic ability was ascribed to the impact of TiO2/XG nanoparticles with a high surface area, and lower band gap energy. Solar light energy has significant potential for addressing energy deficit and water pollution concerns.

1. Introduction

Energy consumption and environmental pollution have always been difficult problems worldwide [1,2] Water pollution has attracted significant attention as a result of the discharge of a variety of unwanted pollutants into the environment. These can come from a variety of sources, such as industries, municipalities, and agricultural practices [3,4].
The textile industry has been shown to be a particularly high source of pollutants, generating a significant amount of wastewater daily. Its affluent often contains a high concentration of organic compounds, dyes, and other nutrients, which, if not treated properly, can lead to major environmental pollution [5], such as acarbose [6], and rhodamine-610 [7]. Even at concentrations less than 1 mg/L, the presence of traces of dye in water is very apparent and influences the aesthetic value of lakes, rivers, and other water bodies, impacting their water transparency and gas solubility. However, dyes are more difficult to handle than other contaminants because of their artificial origin and complex aromatic structures [8]. Eliminating colors from wastewater that has been significantly contaminated can be accomplished via photolysis, adsorption, electrochemical or chemical precipitation, membrane approaches, chemical oxidation and reduction, or any combinations thereof. However, many of these methods have significant drawbacks, such as high costs, the need for complex conditions for the reaction, or the fact that they do little more than transform the contaminants from liquids to solids, as is the case with most adsorption techniques [9]. Emerging technologies, such as advanced oxidation processes (AOPs), are becoming more enticing as alternatives due to their broad range of applications in the elimination of toxic pollutants [10,11]. Among different AOP techniques, photocatalytic oxidations have been highly promoted as inexpensive approaches with good removal effectiveness compared to other AOPs [11,12]. The mechanism of photocatalysis is primarily described by the semiconductors’ capability to generate charge carriers under light irradiation, followed by the generation of free radicals such as OH−, which leads to further reactions, eventually forming CO2 and H2O [13,14]. The technology of photocatalysis has, in particular, sparked tremendous interest due to its ability to capture solar energy utilizing semiconductor materials that function as catalysts. Catalysts can aid in the resolution of the environmental challenges associated with water contamination, and these semiconductor materials are harmless and efficient [15]. TiO2 has received a lot of attention among semiconductors because of its potential use in the breakdown of a wide range of environmental pollutants in both gaseous and liquid phases [16]. Numerous researchers have worked to improve the catalytic activity of TiO2 by combining it with magnetic nanoparticles [17] or doping it with non-metallic elements [18,19,20]. On the other hand, the use of recycled plastic materials as a support or to immobilize photocatalyst powders has emerged as a new trend. This facilitates the removal of the photocatalytic material from the decontaminated water after the elimination of the contaminant using simple methods [13]. Activated carbon, silica, zeolites, alumina, carbon nanotubes, and cellulosic fibers produced from chestnut have been utilized to modify the surface or structure of TiO2 [21,22]. Meanwhile, sunlight-induced photodegradation has recently emerged as a cutting-edge, environmentally friendly, and promising approach to wastewater treatment [23]. Xanthan gum (XG) is a naturally occurring polysaccharide consisting of repeating pentasaccharide units made up of two units of mannose, two units of glucose, and one unit of glucuronic acid (molar ratio of 2.8:2:2). The chemical structure of XG is similar to that of cellulose; it has no sensitizing characteristics, and it does not trigger allergic reactions in the skin or eyes. The characteristics of XG are its high viscosity, water solubility, heat stability, emulsion stabilization, and food component compatibility. In addition, it is a non-toxic material, which is especially important for water treatment systems. The Food and Drug Administration of the United States of America has authorized it as a food additive with no further restrictions, with pharmaceuticals, cosmetics, petroleum, and agriculture being its four main industrial areas of application [24]. This study aims to develop TiO2/XG and use it for removing reactive red (RR) and reactive turquoise (RT) dyes in their single system from an aqueous solution. The performance of the TiO2/XG is shown by studying the adsorbents and solar-induced photocatalysts and assessing functional groups, inner structure, constituent elements, and morphology of the TiO2/XG through analysis by corresponding techniques.

2. Materials and Methods

2.1. Materials

The used dyes (RR and RT) were sourced from AL-Kadhimiya Textile Company, Department of Dying and Printing, and were delivered from Thomas Baker, India. The relevant chemical and physical characteristics are given in Table 1 and Figure 1. XG, in the form of a yellow-white powder and with a 1.6 specific gravity, was sourced from Barazan D Plus and was purchased from Central Drug House, Solan, India. Finally, titanium tetra-isopropoxide (TTIP) (97%), hydrogen peroxide, and acetic acid were supplied from Merck.

2.2. Fabrication of TiO2/XG

TiO2 was directly precipitated onto XG using the sol–gel dip-coating process (TiO2/XG). First, 30 mL of the TTIP solution, 3.5 mL of the acetic acid, and 5 mL of the distilled water were stirred for 60 min. To this was added 0.2 gm of XG, and a shaker incubator was used to stir the mixture for 30 min at 350 rpm. Finally, the coated XG was dried in an oven at 50 °C for 30 min. The sample synthesis was then gathered and placed in a muffle furnace at 200 °C for 2 h for calcination. Lastly, it was completely cleansed with distilled water and dried for 30 min in a hot air oven at 50 °C [25]. A second coating cycle was then used to increase the thickness of the immobilized TiO2 film (Figure 2). The TiO2/XG was then washed with distilled water to eliminate any remaining disconnected TiO2 particles, and the material was then saved for later usage.

2.3. Characterization of the TiO2/XG Nanocomposite

The optical absorption of the nanoparticles sample was observed in the UV–Visible spectrum taken by UV–vis spectrometer (UV–Vis Spectrophotometer Perkin-Elmer 55, Waltham, MA, USA). The spectrum was recorded in the wavelength range of 200–600 nm. The optical band gap was measured using a UV–Vis spectrometer (UV-1800, SHIMADZU, Kyoto, Japan) to assess the TiO2/XG nanocomposite’s semiconductor nature. Subsequently, Tauc’s plot double beam equation (Equation (1)) was used to estimate the band gap as appropriate for 200–800 nm wavelengths [26].
( α h ν ) n = A ( h v E g )
where α is the coefficient of absorption, A is a constant with different values for different transitions, e.g., the optical energy band gap value, h is Planks constant (6.626 × 10⁻³⁴ Joules sec), is the light frequency, and n is a constant number that depends on the transition characteristics and can be ½, 2, 3/2 and 3 for, respectively, allowed direct, allowed indirect, forbidden direct, and forbidden indirect transitions.
The various functional groups present on the surface of the TiO2 sample were identified from the Fourier-transform infrared (FTIR) spectrum. The spectrum was recorded over the wavenumber range of 4000–500 cm−1, recorded by an FTIR spectrometer (FT-NIR Spectrometer L1390022, PerkinElmer, Waltham, MA, USA). The topography of the nanoparticles sample was observed from the images taken by an emission scanning electron microscope (SEM TESCAN MIRA3, FRENCH, Fuveau, France). The structural properties, crystallite size, and interplanar spacing between the crystallographic planes of the nanoparticles were determined by X-ray diffraction (XRD) patterns obtained by an X-ray diffractometer (XRD PHILIPS XPERT, HOLLAND, Amsterdam, The Netherlands) and handled by X’Pert HighScore Plus software (version 2.0). The diffraction patterns were recorded in the 2θ range of 10°–80°. The operation voltage was 10 kV.

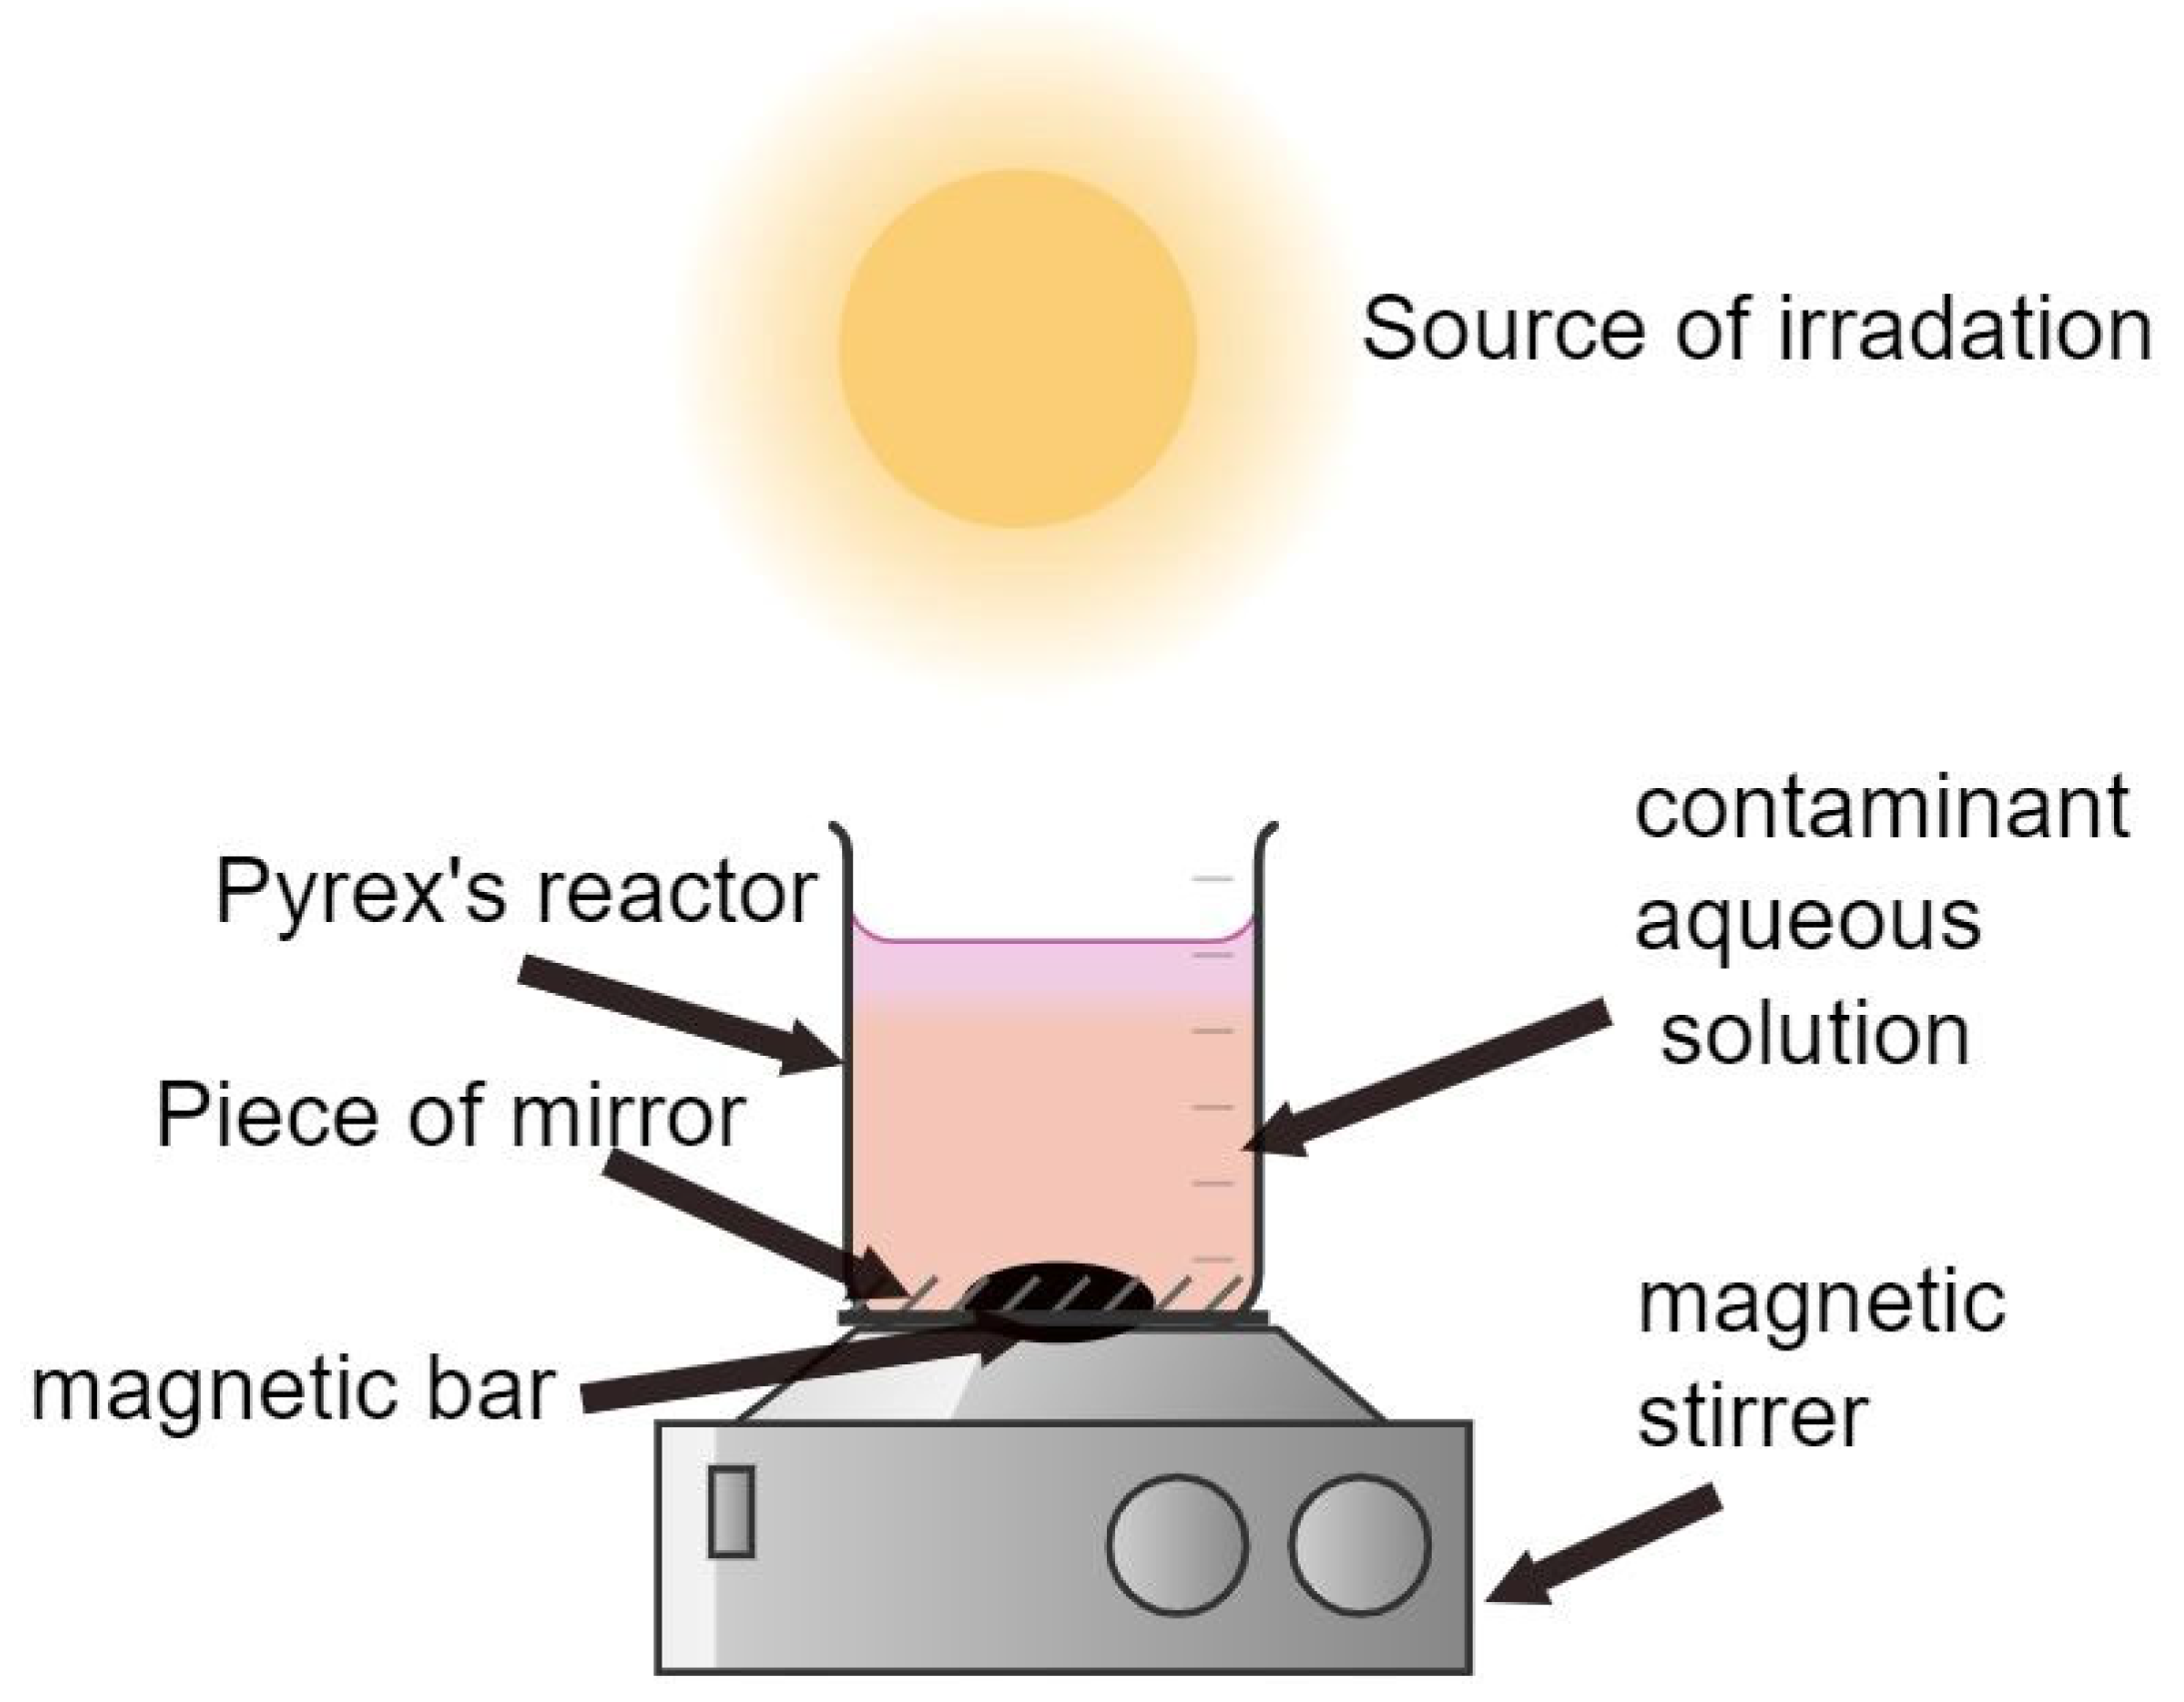
2.4. Experimental Procedure and Analysis

In a batch-mode reactor, two types of dye (RR and RT) were used to evaluate the process of adsorption and the photocatalytic characteristics of the produced materials (Figure 3). The reactor was made of Pyrex glass (1 L) and had a mirror at the bottom that served as a reflector [27]. The solutions were exposed to direct solar radiation between 11 a.m. and 3 p.m. on consecutive sunny days in June and July 2022. Solar radiation was measured using an SPM-1116SD (LUTRON ELECTRONIC, Coopersburg, PA, USA), whereby the device was directed toward the sun to measure the solar radiation reaching the reactor. UV measurements were obtained for the range between 300 and 400 nm, with an average solar UV power of 150–850 W/m2. Different concentrations of the dye solutions were prepared and adjusted to the desired pH using a dilute solution of 0.1 M HCl or NaOH (employing a pH meter model INOLAB 72, WTW Co., Weilheim, Germany). After that, the TiO2/XG nanoparticles were added to the solution at the desired concentrations (15, 25, 50, and 75) mg/L. The suspension was agitated at 200 rpm (type MSH-300N, BOECO, Hamburg, Germany). The solution was kept in the dark under stirring for 30 min in order to reach the primary adsorption equilibrium between the dyes and the TiO2/XG nanocomposite [28]. Consequently, the solutions were exposed to sunlight under constant stirring; H2O2 in various amounts (200, 400, and 600 mg/L) was added to start the reaction. Thereafter, 10 mL was regularly extracted and centrifuged at 200 rpm for 15 min to obtain the catalyst. The dye concentrations in the respective samples were assessed using a spectrophotometer (UV–Vis Spectrophotometer Perkin-Elmer 55 OSE) with a maximum of 540 and 665 nm for the RR and RT dyes, respectively. Finally, the percentage of dye elimination was estimated using Equation (2):
dye   elimination   percentage = Initial   dye   conc . Residual   dye   conc . Initial   conc . × 100

3. Results and Discussion

3.1. TiO2/XG Characteristics

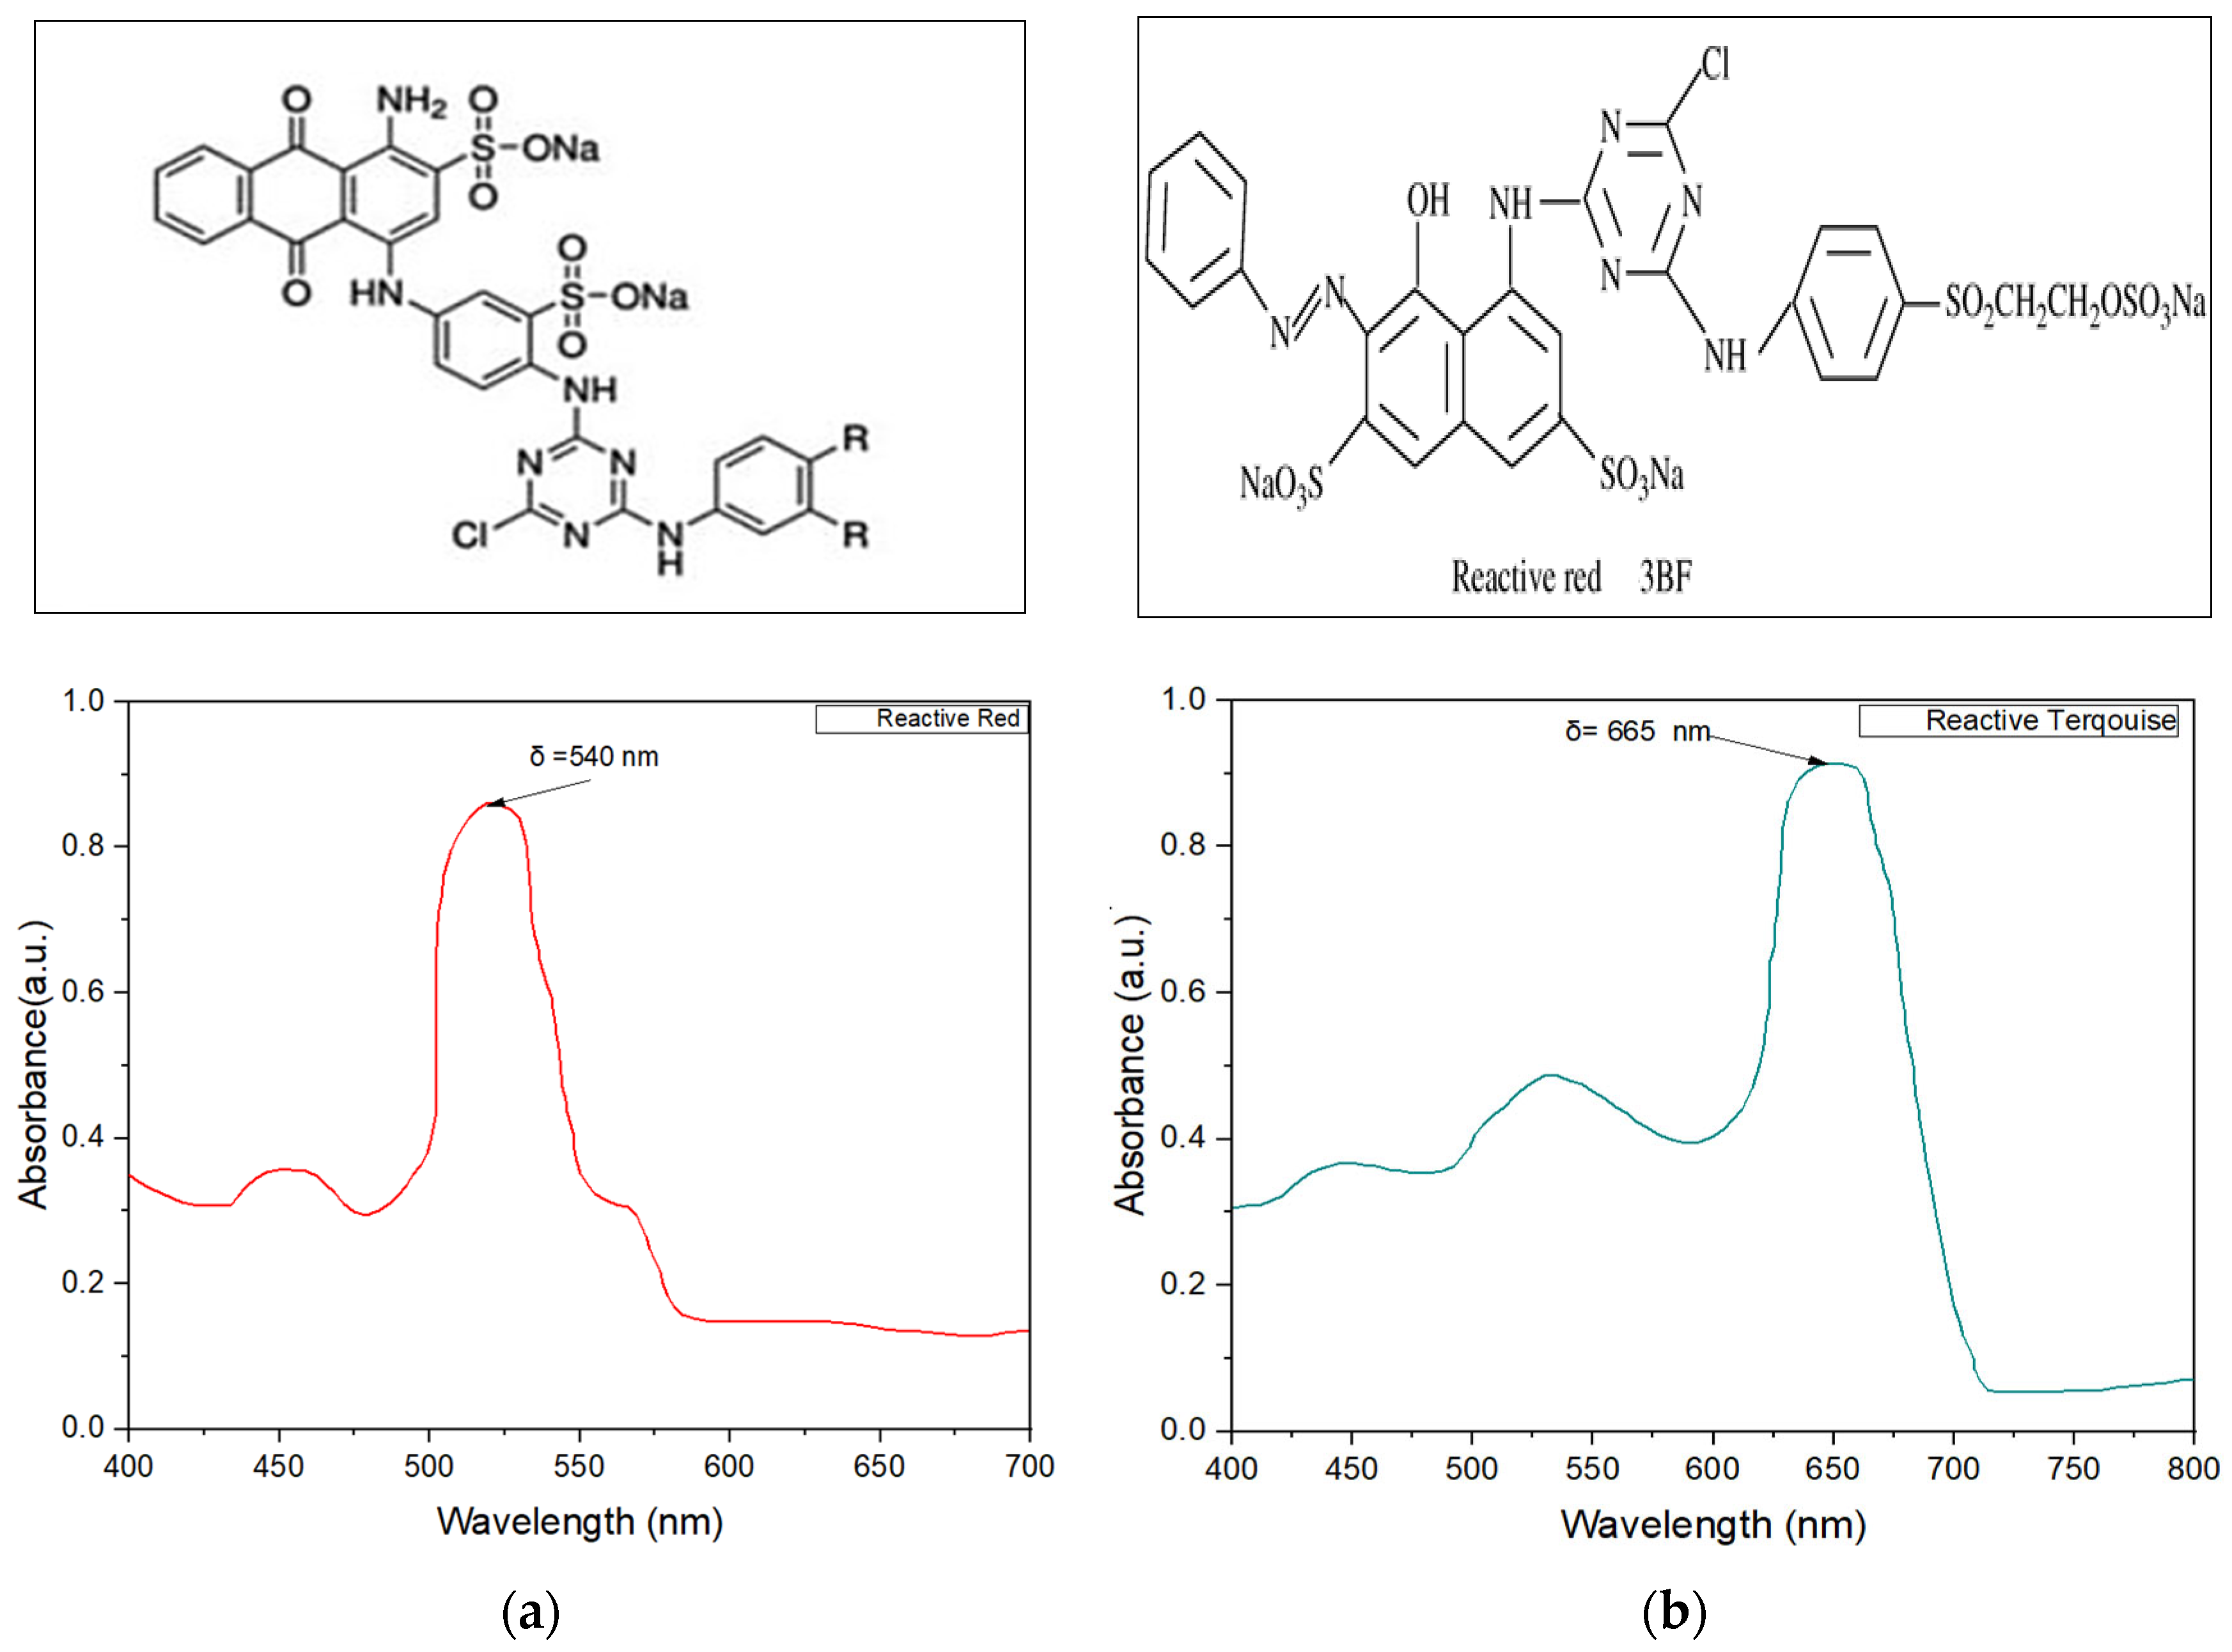
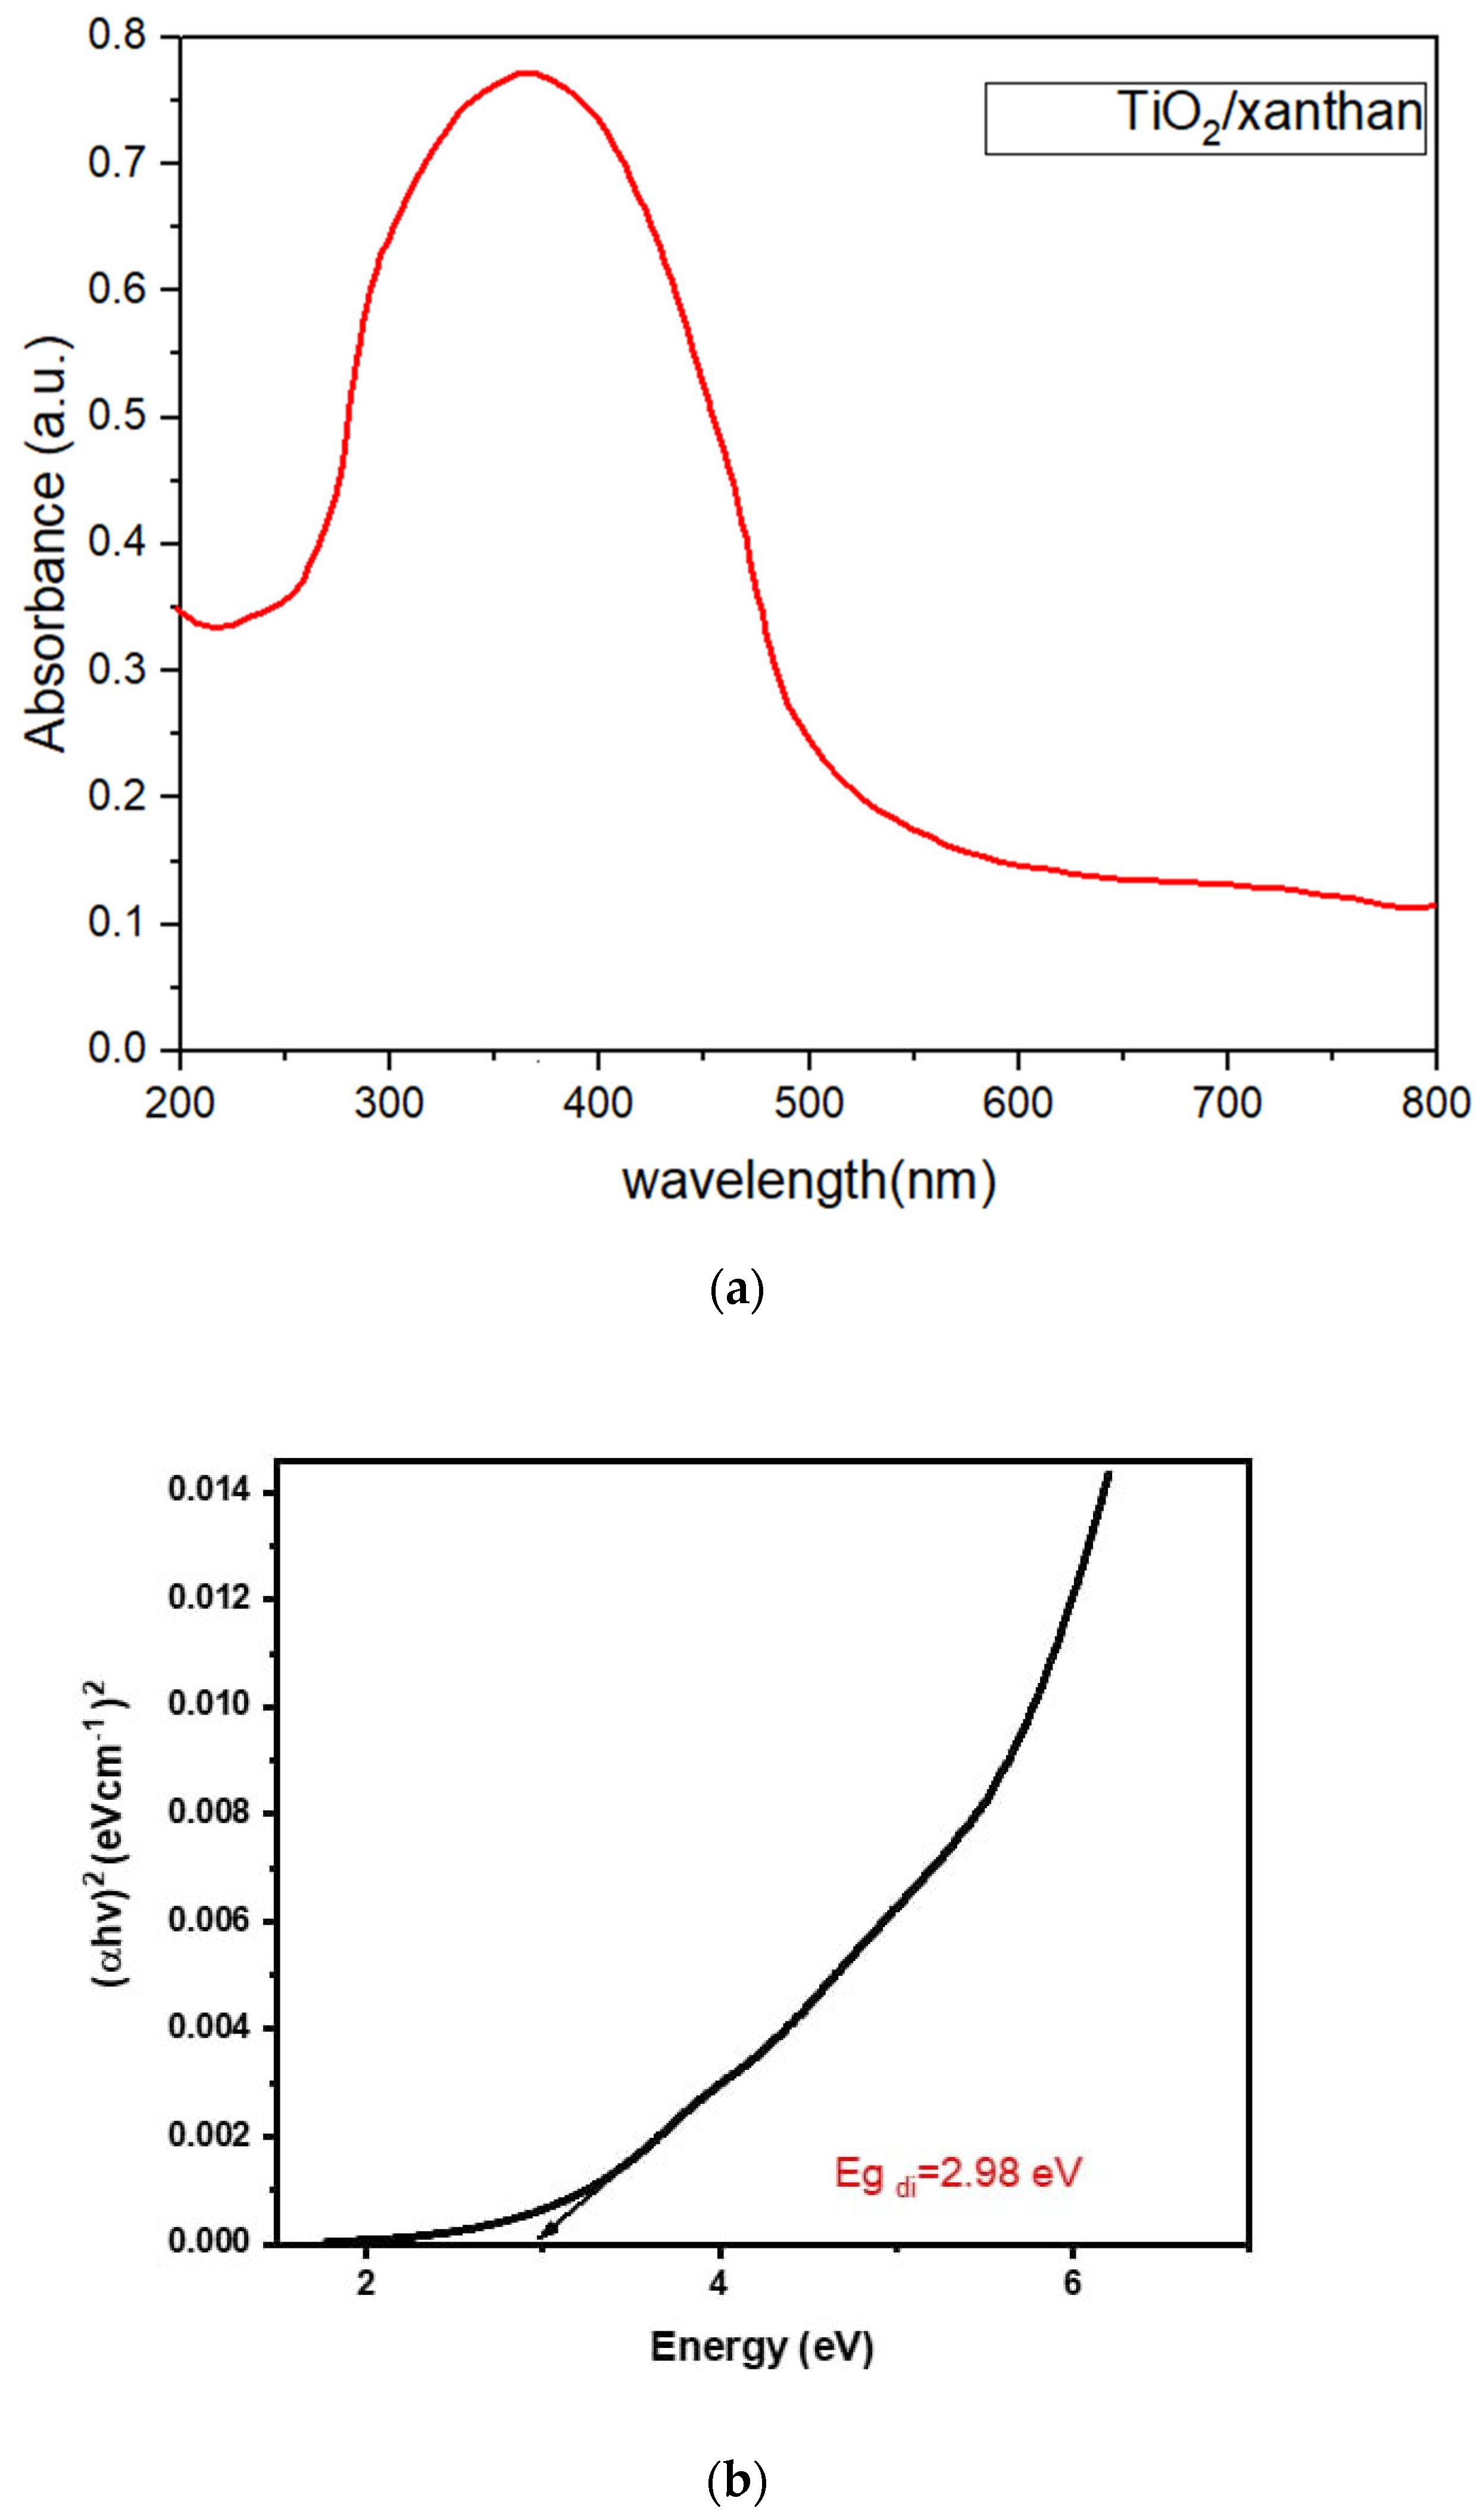
3.1.1. Optical Properties UV–Vis Spectroscopy

The TiO2 crystal formations included rutile, anatase, and brookite. Photocatalytic studies have mainly concentrated on the rutile and anatase phases. Rutile is the most thermodynamically stable crystal structure of any TiO2 phase, whereas anatase is metastable [29]. The wide range of band gap (3.2 ev) of anatase TiO2 gives excellent photocatalytic activity by using UV radiation. In contrast, in the visible region of the solar spectrum, it presents inadequate efficiency [30,31]. As a result, the photocatalytic application of TiO2 on an industrial scale has been limited because only 4–5% of the solar spectrum corresponds to UV photons. To this end, much effort has been expended to activate TiO2 in the presence of visible and solar light for application purposes [31].
Figure 4a shows the UV–Vis spectrum (DRS) of the TiO2/XG composite in the 200 to 800 nm range, which was carried out for the photo properties perception of TiO2/XG composite nanoparticles. The main absorption bands at 365 nm were in the variety of 200 to 600 nm. Furthermore, the optical band gap results obtained by Tauc relation are shown graphically in Figure 4b using Origin Pro 8 software (Origin Lab, Northampton, MA, USA). The direct optical band gap of the TiO2/XG nanocomposite was visible at 2.98 ev; due to the structural changes and greater light absorption, and the indirect band gap energy was 2.04 ev.

3.1.2. FTIR

The TiO2/XG was investigated before and after the dye degradation reaction using FTIR analysis from 4000 to 500 cm−1. Figure 5 depicts the FTIR spectra and their results. The FTIR spectrum in Figure 5 (black line) represents the peaks obtained for TiO2/XG before being used in the degradation of dyes. It exhibits a prominent broad at 3419.17 cm−1, signifying the stretching vibrations for the -OH groups of XG [32]. In addition, the peak detected at 2361.7 cm−1 is linked to C=C conjugated and C≡C [33]. The peak at 1634.3 cm−1 is linked to titanium carboxylate, which gives rise to the CH3 stretching frequency peaks at 2921.3 cm−1. The peaks detected between 500 and 800 cm−1 were most likely caused by Ti-O stretching bands.
After dye degradation (red and blue curves for the solution of RR and RT dye in Figure 3, respectively), the intensity of some peaks shifted to new values due to the reaction between the dye molecules and the catalyst active groups [34]. Thus, there was a change in the peak intensity at 3419.7 cm−1 compared to 3444.2 and 3427.8 cm−1, which resulted from the interaction between the dyes with the -OH groups of XG in the TiO2/XG nanocomposite, and at 2921.3 cm−1 compared to 2920.1 and 2916.8 cm−1, due to interaction between the groups in dyes with titanium carboxylate in addition to the peaks at 1634.3 cm−1 compared to 1635.4 to 1633.3 cm−1, shifting the peak at 668.2 cm−1 to 560.2 and 521.6 cm−1 for the RR and RT dyes, respectively. In addition, the results shown in this figure present the absence of the peak at 2381.7 cm−1.

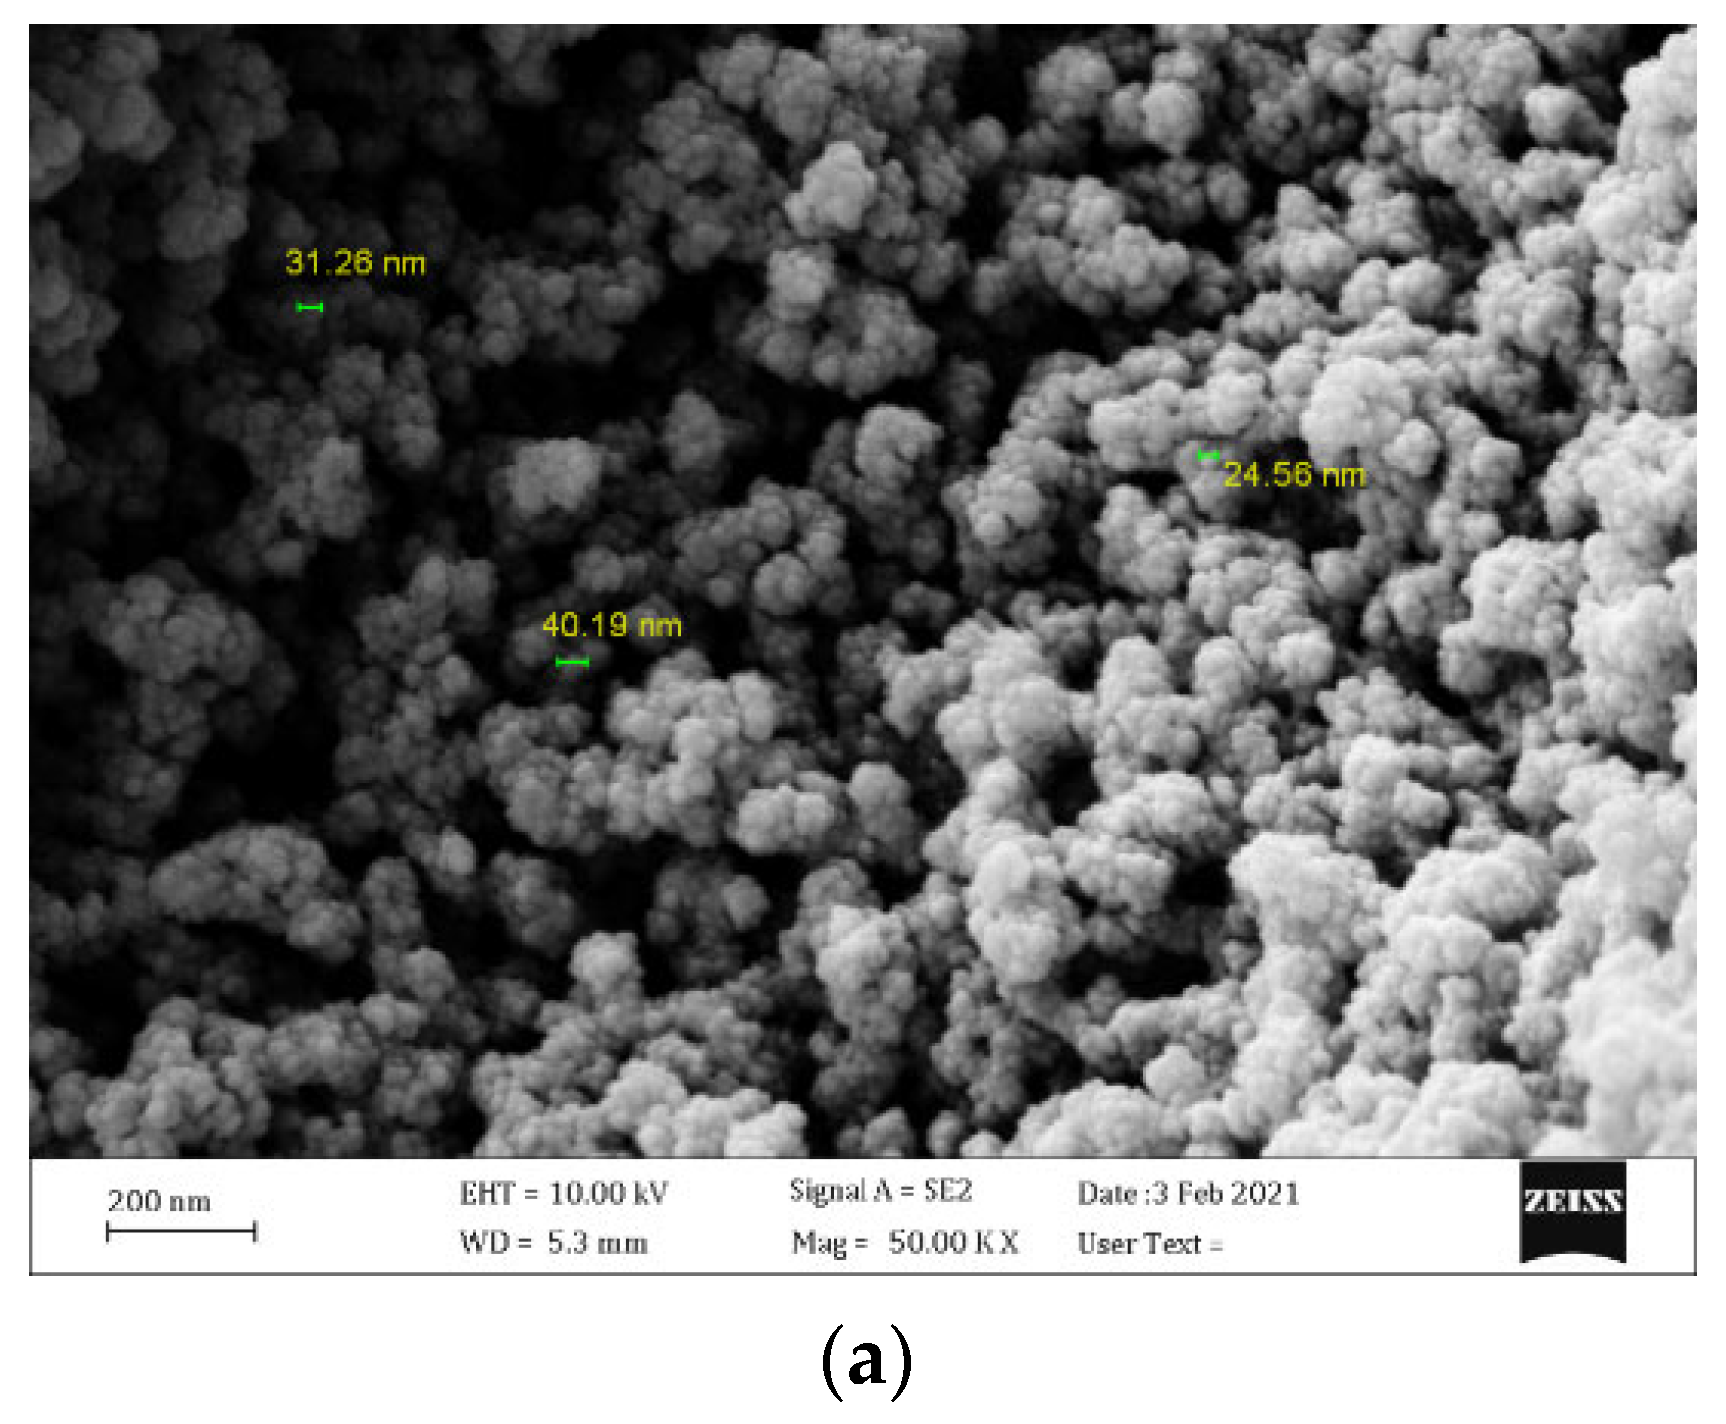
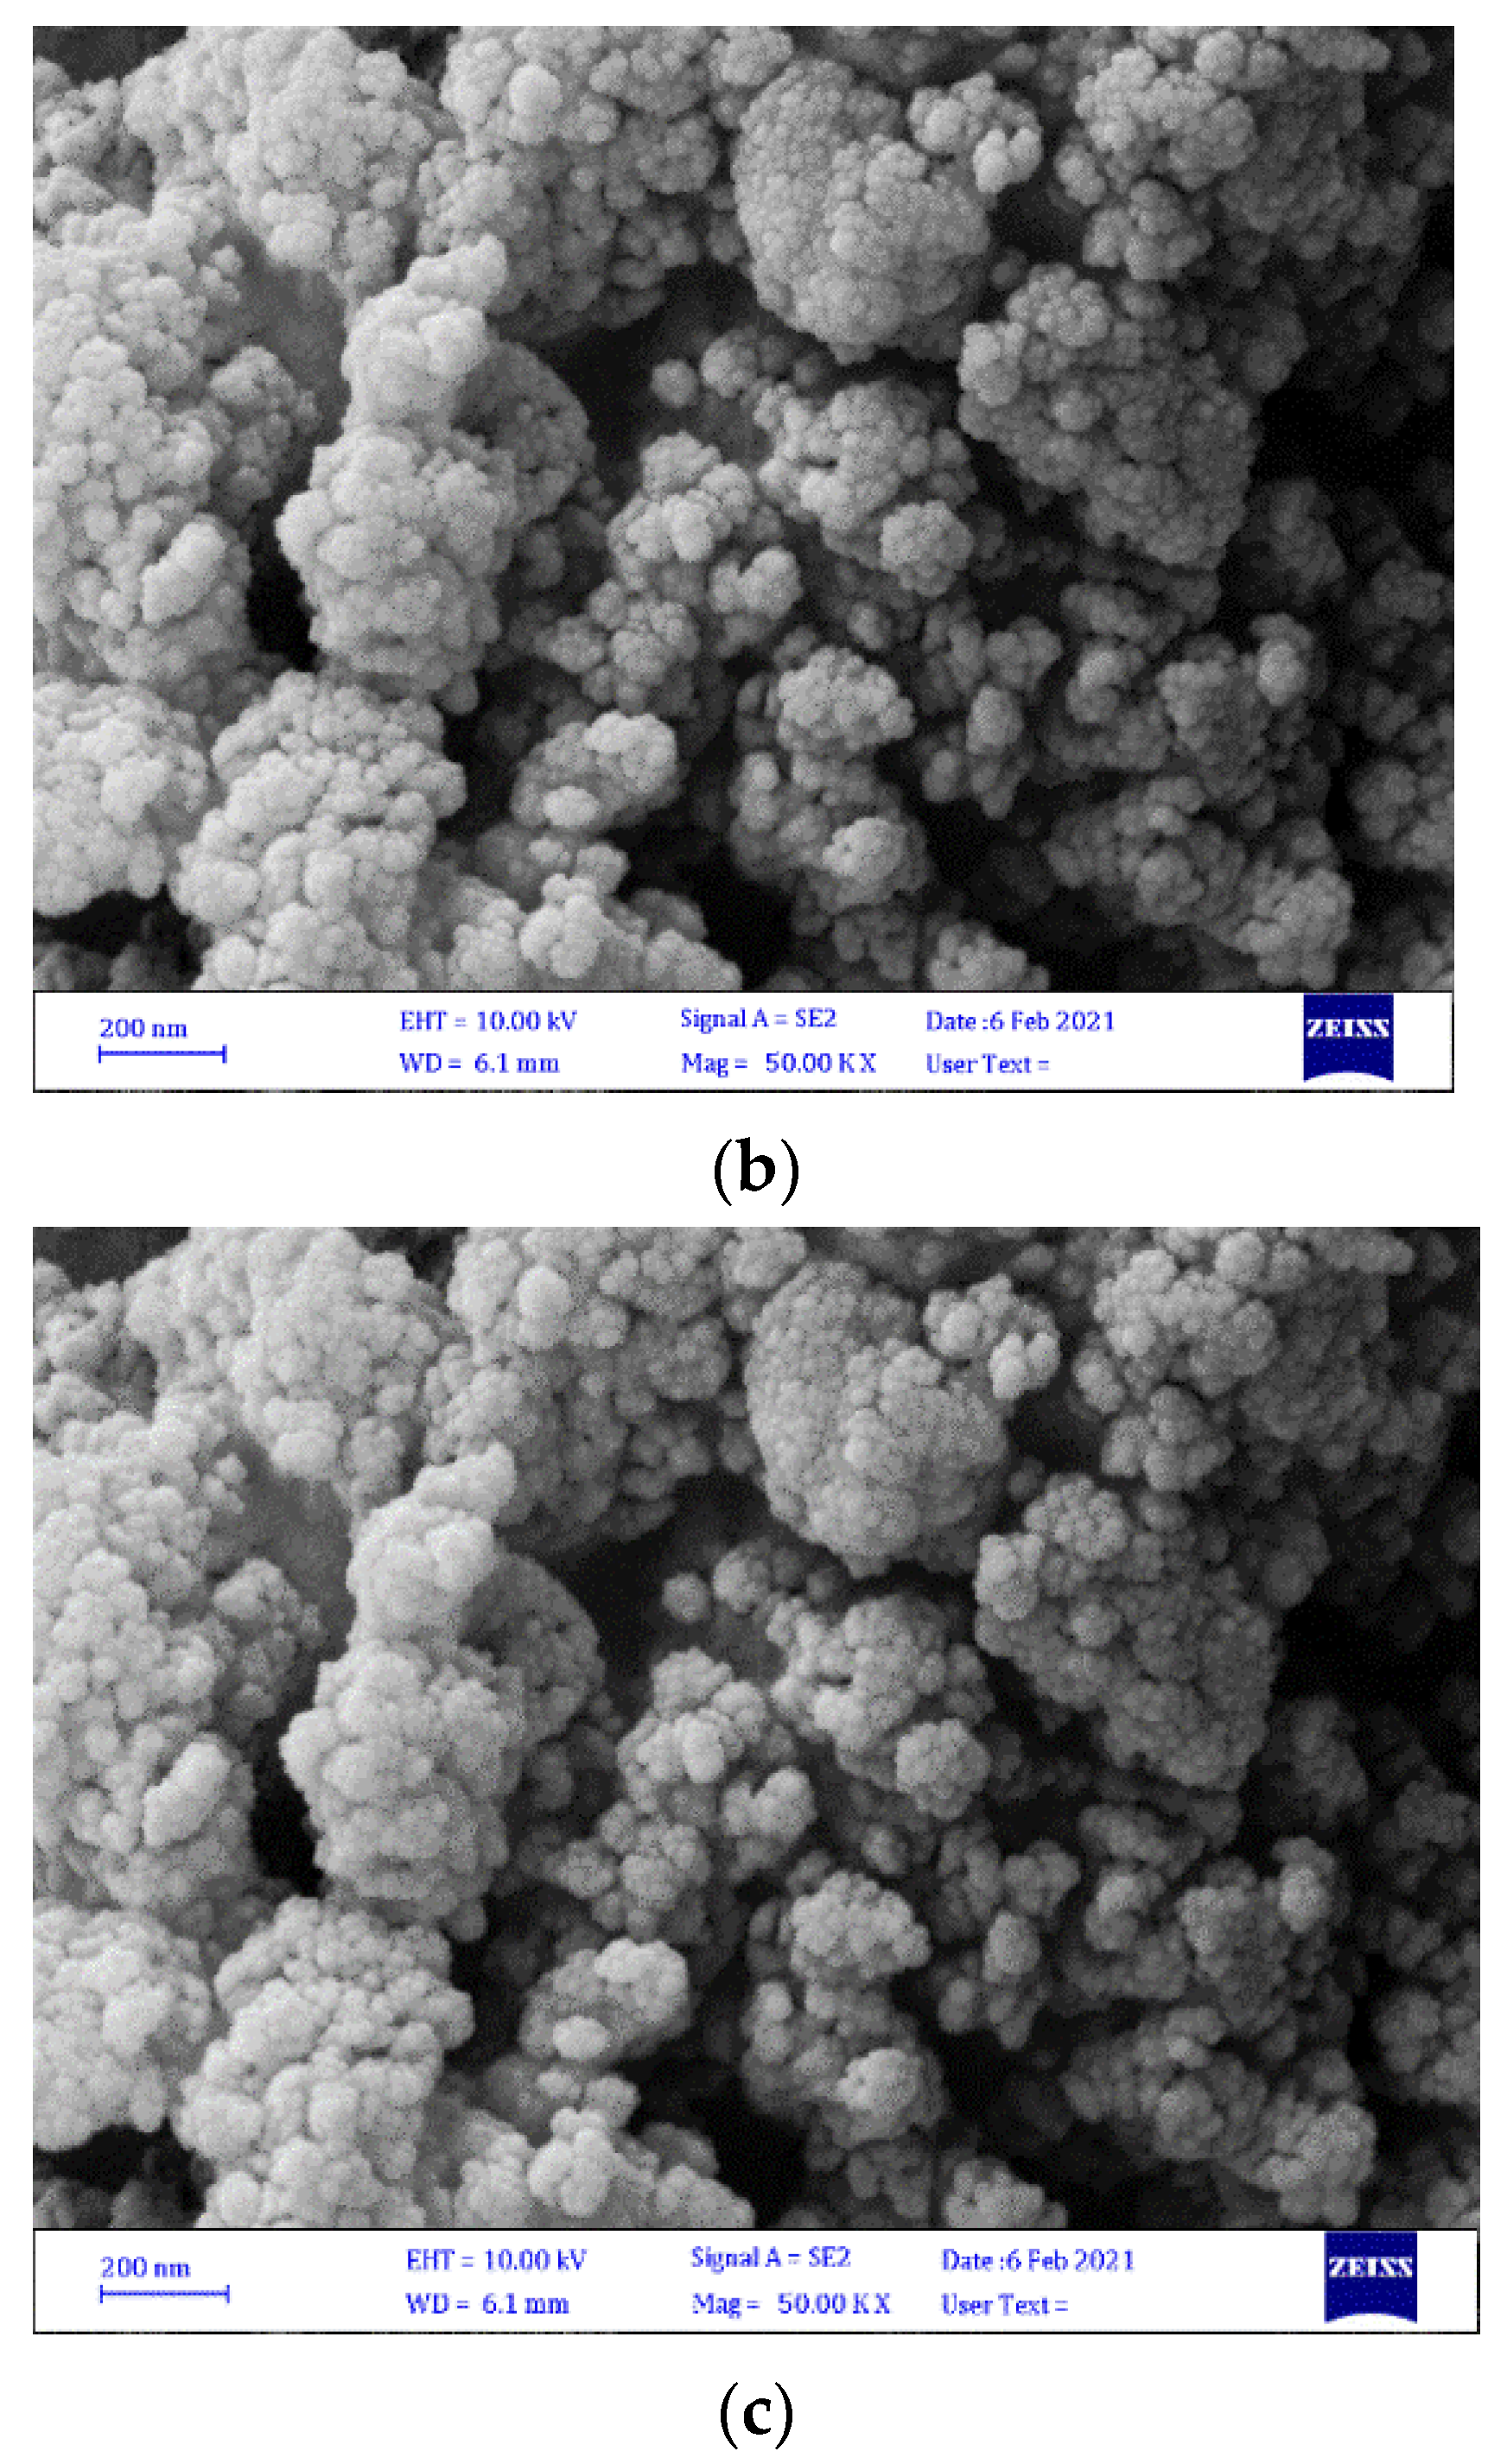
3.1.3. Scanning Electron Microscopy

Scanning electron microscopy (SEM) analysis (ZEISS model, Sigma V PEDS, and Oxford Instruments for mapping) was used to examine the morphology of TiO2/XG, including particle size, shape, and surface properties, before and after use. As shown in Figure 6, there is some agglomeration of TiO2/XG prior to treatment, which appears to be a cluster of irregularly shaped particles with a size of 24–40 nm. The images further show that after treatment (Figure 6b,c), the RR and RT dye adsorption completely covered the pores and surface.

3.1.4. X-ray Diffraction

The X-ray diffraction pattern (XRD) is one of the most valuable scientific instruments for determining the crystalline nature of synthetic materials. The test was carried out using an XRD device (Siemens model D500, Munich, Germany). Figure 7 shows the XRD pattern for TiO2/XG, visible at an angle from 10° < 2θ < 80°. The strongest peak was at 2θ = 25.28°, corresponding to TiO2. Other peaks were seen at about 37°, 48°, 52°, 63°, 69°, and 75°, which were related to the (004), (200), (211), (213), (116), and (215) planes of the anatase due to the presence of XG in the XRD pattern of TiO2/XG. After being used in the degradation of dyes, the small crystalline peaks disappeared, i.e., the loaded structures of TiO2/XG became entirely amorphous.
The average crystal size for TiO2/XG was 36.35 nm, calculated using Scherrer’s equation,
D = K λ β c o s θ
Where, D represents crystallite size; K, Scherrer constant (K = 0.94); λ, the wavelength of X-ray radiation (λ = 0.15418 nm); β, full width at half maximum (FWHM) of the diffraction peak to the corresponding crystallographic plane of anatase; and θ, the angle of the X-ray diffraction peak [35].

3.2. Adsorption and Photocatalytic Activity of the TiO2/XG Composites
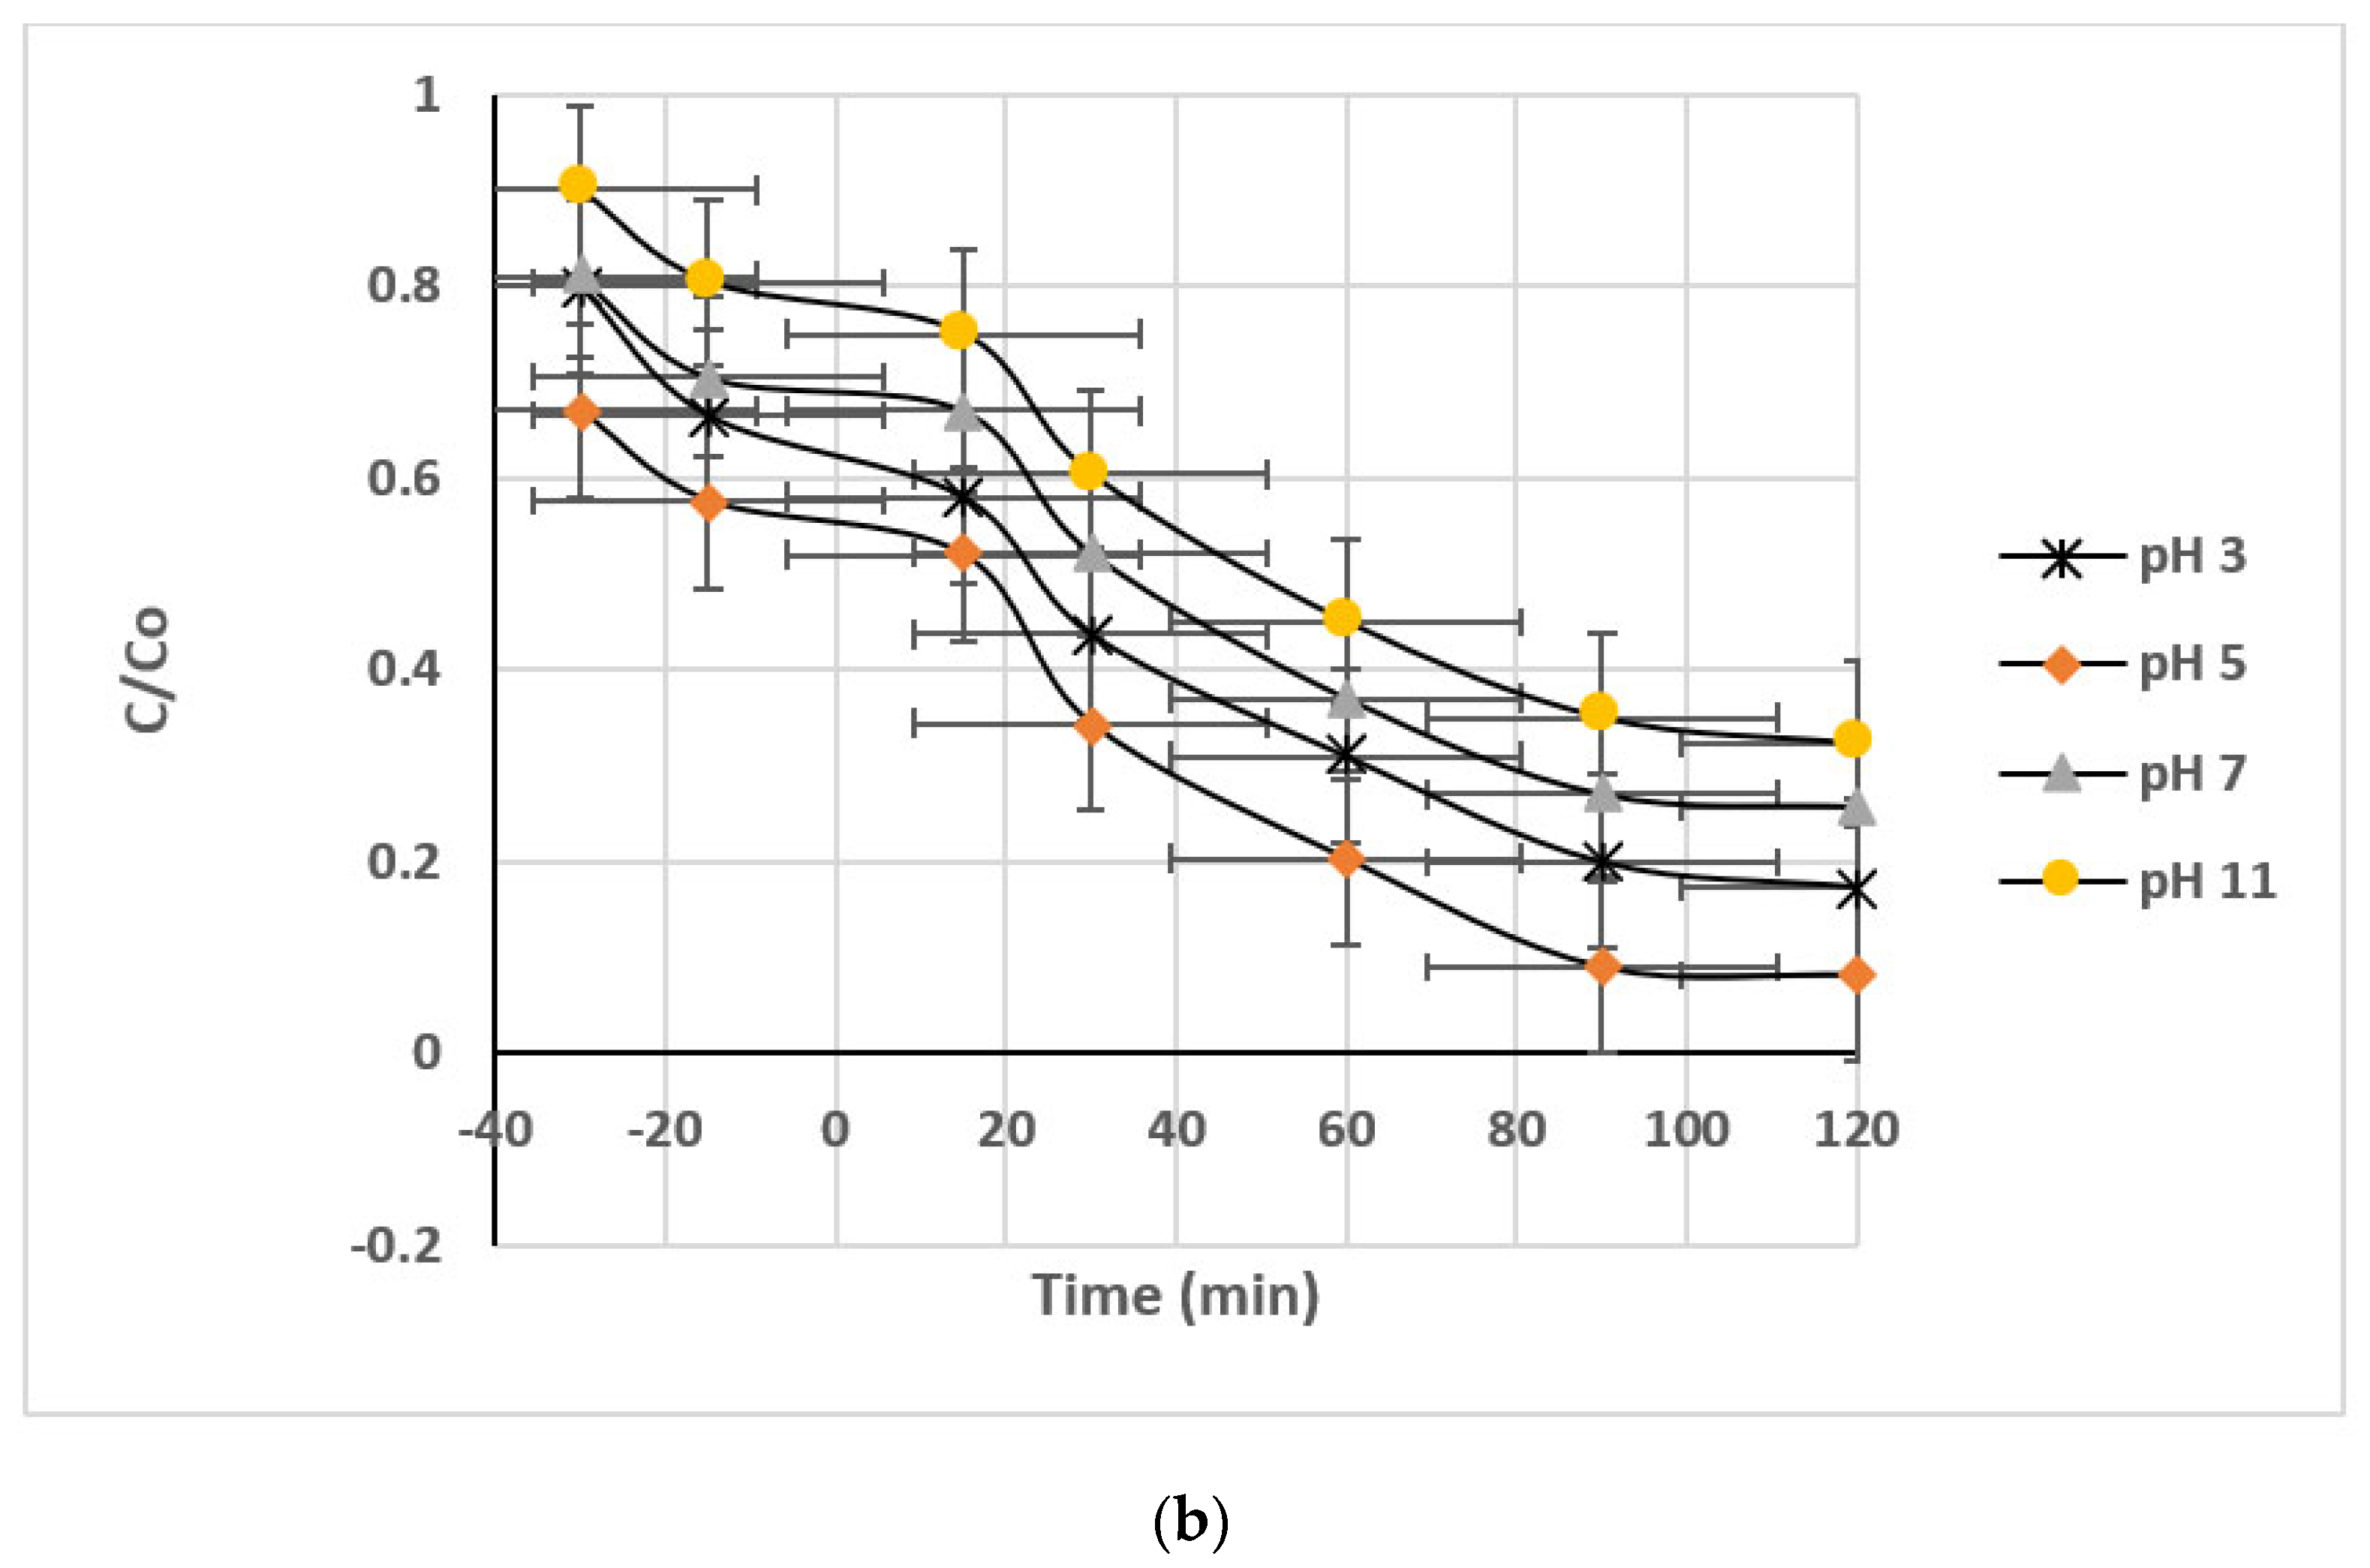
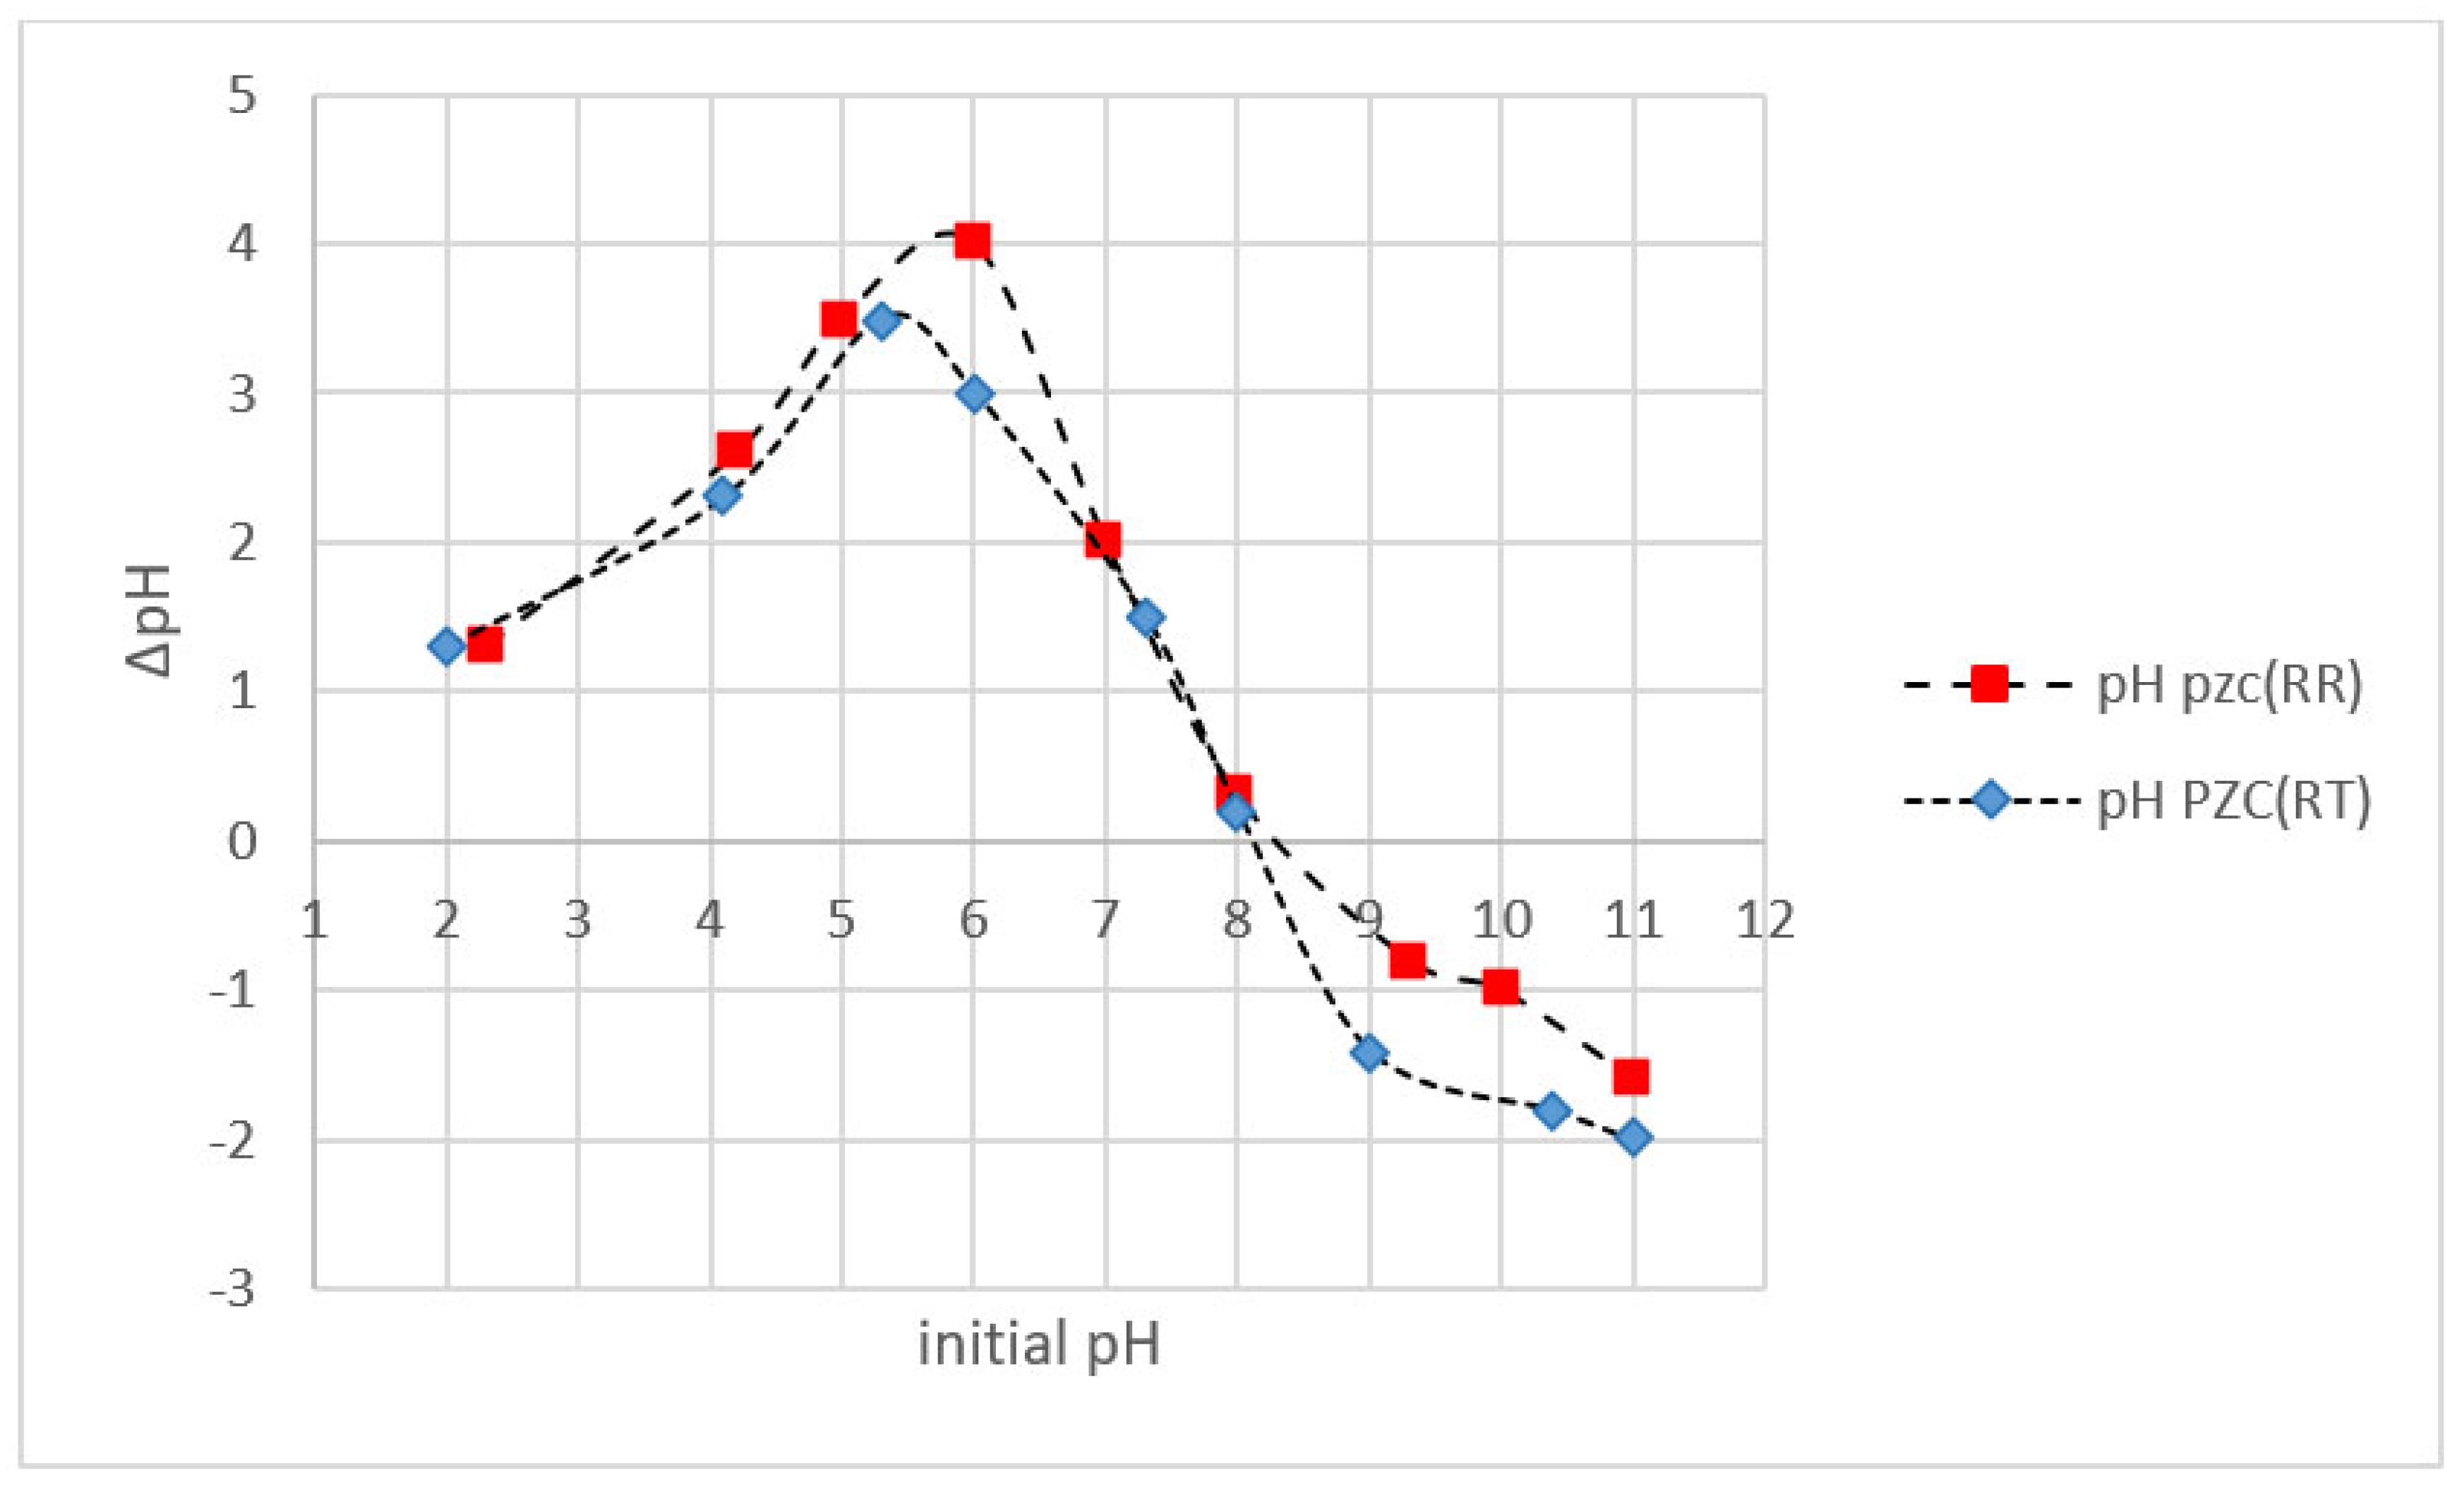
3.2.1. pH

The pH value is among the most essential factors influencing the elimination of pollutants due to its effect on the ionization of the pollutant and catalyst in the solution [36]. The results for the RR and RT dye removal efficiency via adsorption (first 30 min) and photodegradation using TiO2/XG at different values of pH (3, 5, 7, and 11) at 25 mg/L of initial dye concentration, 25 mg/L of TiO2/XG, and 400 mg/L of H2O2, are shown in Figure 8. According to the results, a slight degradation was observed in the darkness and increased by increasing irradiation time. This figure also shows that the degradation efficiency increased by increasing the pH value from 3 until it reached 5, then further increase decreased the removal percentage of RR and RT dye, respectively. The highest RR and RT dye removal efficiencies after 30 min were 31 and 42.2%, respectively, at pH 5. At an irradiation time of 120 min, the maximum removal efficiency was achieved at 98% and 92.8% for the RR and RT dyes, respectively. pH level change influenced the ionization degree and superficial charge of the adsorbent as well as the electrostatic interactions of the surface catalyst and the separation of functional groups on the catalyst’s active sites, altering the solution’s chemistry [37].
In acidic solutions (pH < 5), the photodegradation of the dye was retarded by the high concentration of protons, resulting in lower degradation efficiency. In an alkaline medium (pH > 10), on the other hand, the presence of hydroxyl ions neutralizes the acidic end-products that are produced by the photodegradation reaction [38]. This is associated with the surface’s ionization state, in line with the reactions below (Equations (4) and (5)), and in addition to the state of reactant dyes and acids and amines, among other products:
T i O H + H + T i O H 2 +
T i O H + O H O H T i O + H 2 O
A sudden drop in degradation was observed when the initial pH of the reaction mixture was kept at 11. The reactive blue dye substituents of an electron-donating group, such as—NH2 in the α-positions of the carbonyl group form intramolecular hydrogen bonds at high pH values [38]. Hence, the difference in the pH values can influence dye molecule adsorption onto the TiO2 surface, which is a crucial step in photocatalytic oxidation [28].
The pH zero-point charge (pHzpc) of TiO2/XG was determined using the method described in Mohseni-Bandpi et al. [39]. This conclusion was important in determining the surface charge of TiO2/XG against the solution, and their results are presented in Figure 9. The graph shows an intersection at 8.1 and 8.3 for the RT and RR dyes, respectively, demonstrating that at this pH level, there is a negative surface above TiO2/XG and a positive surface below.

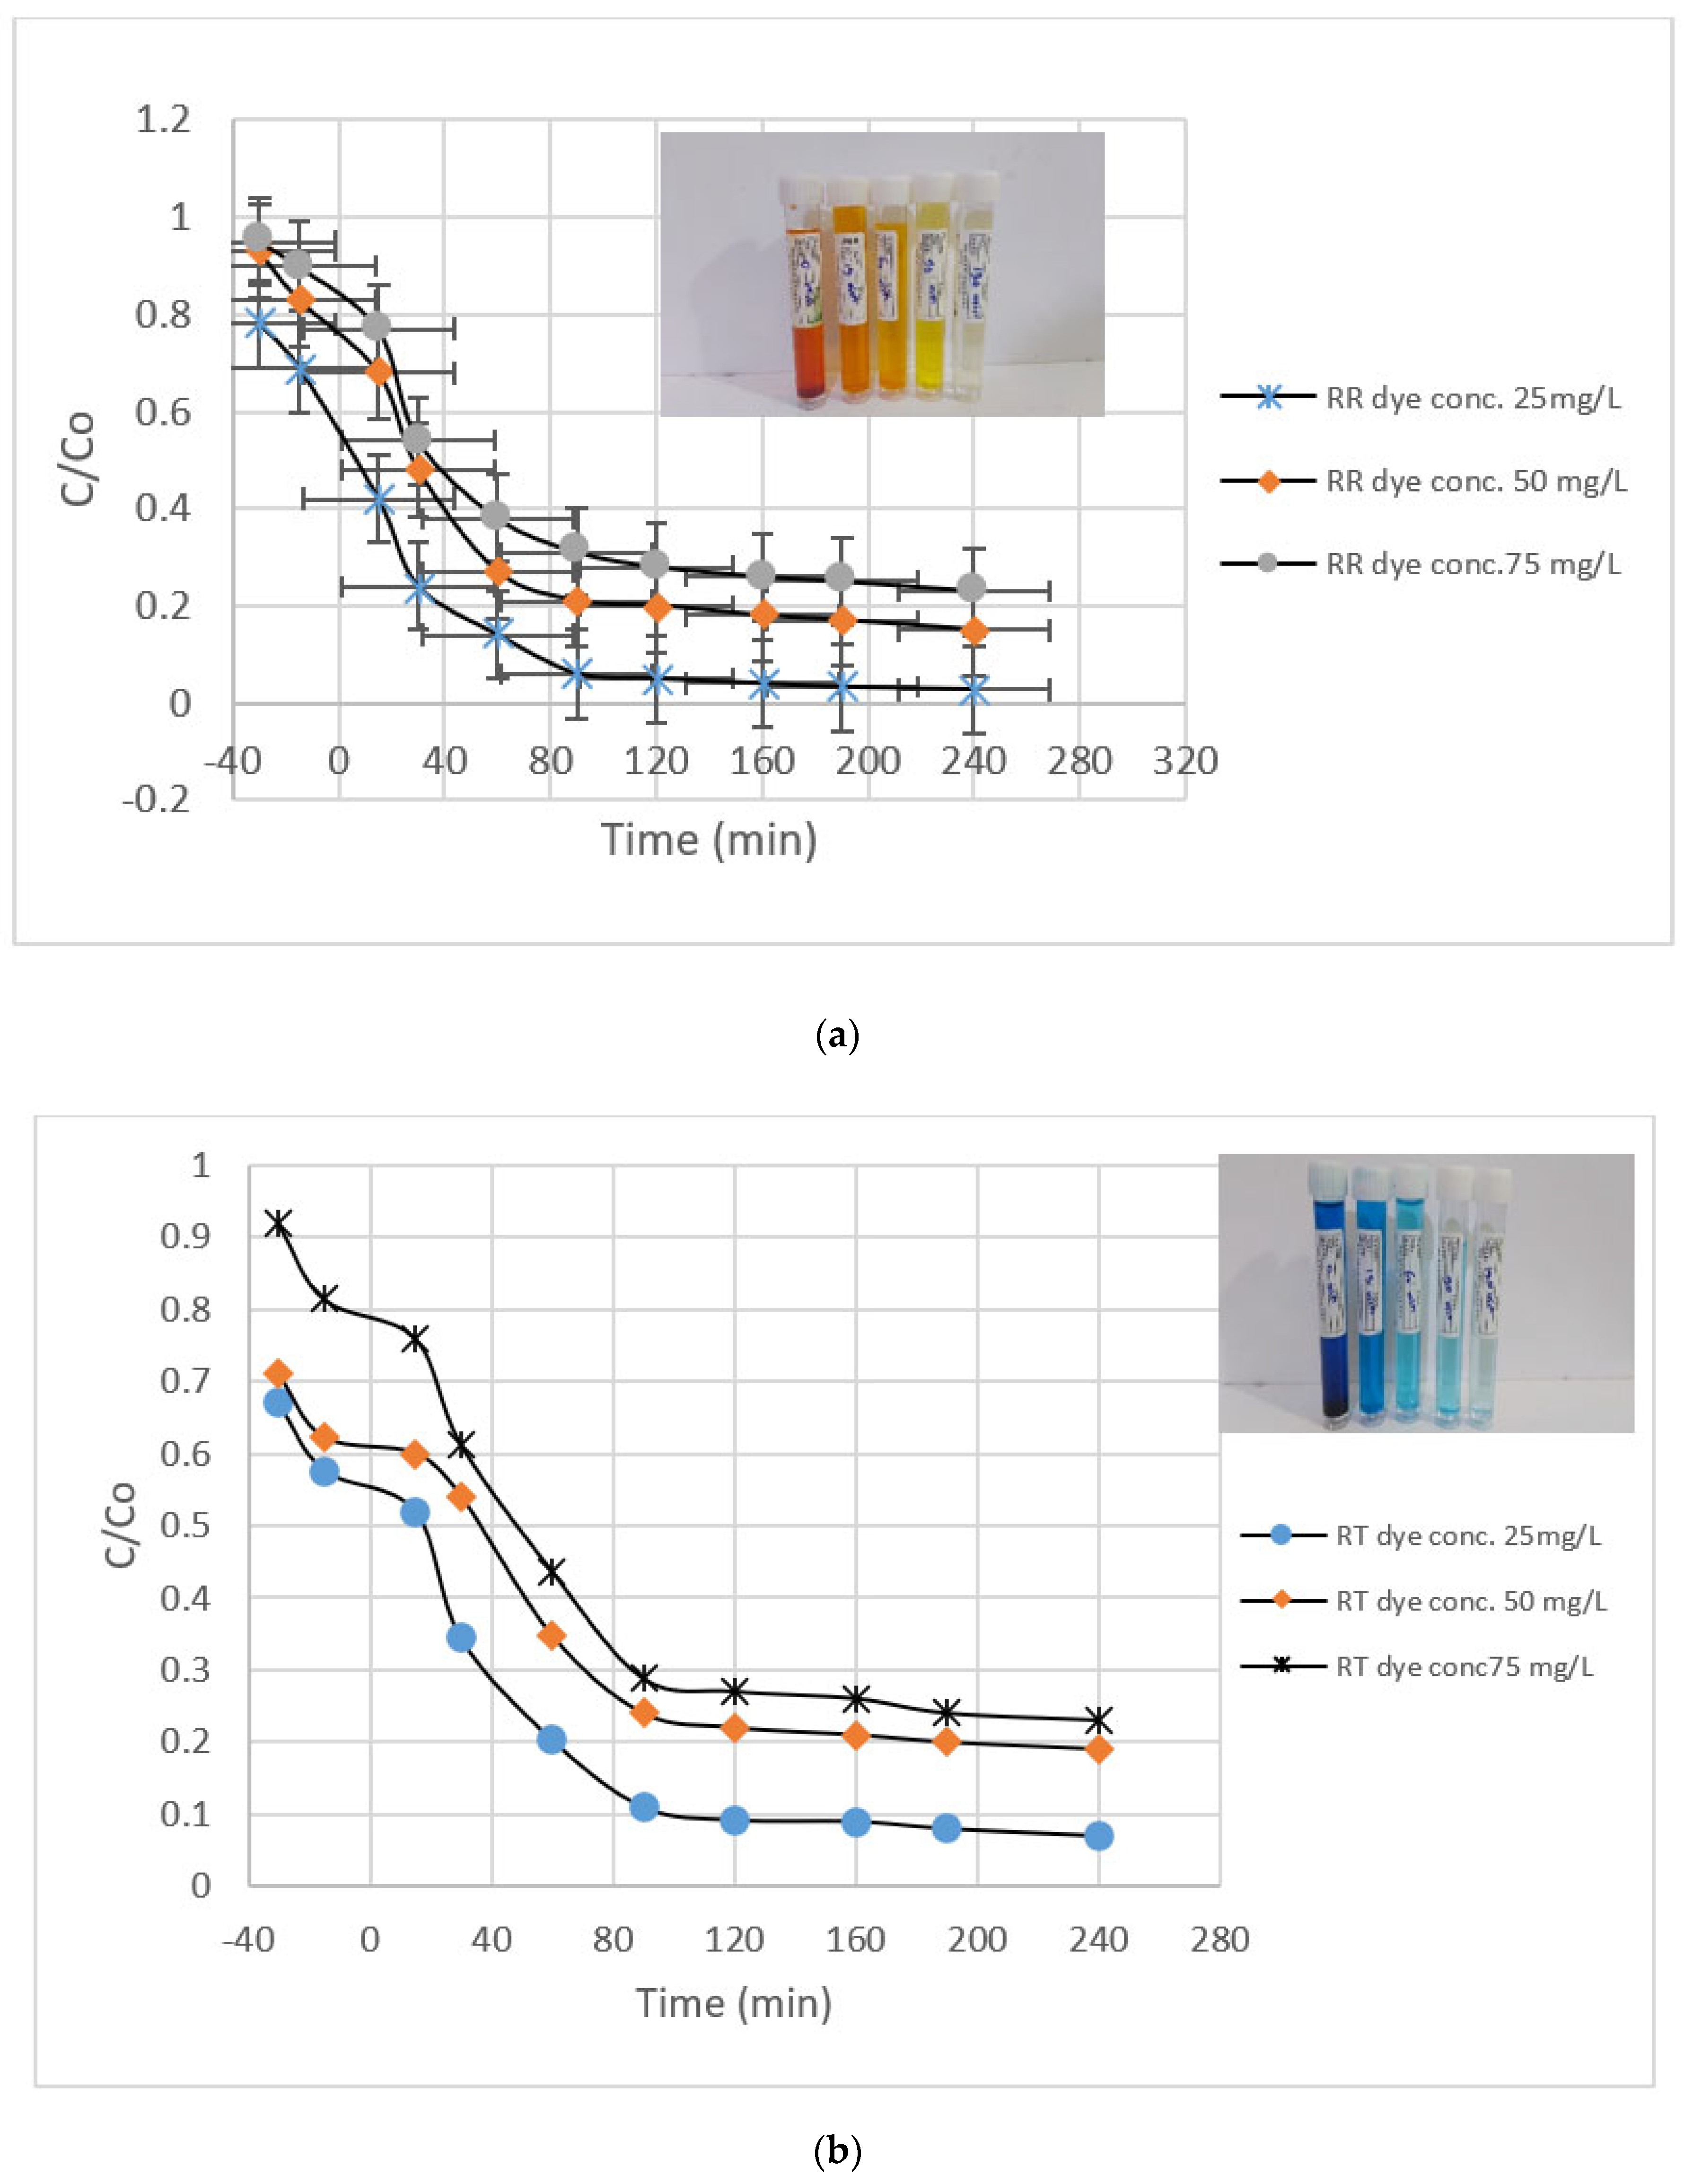
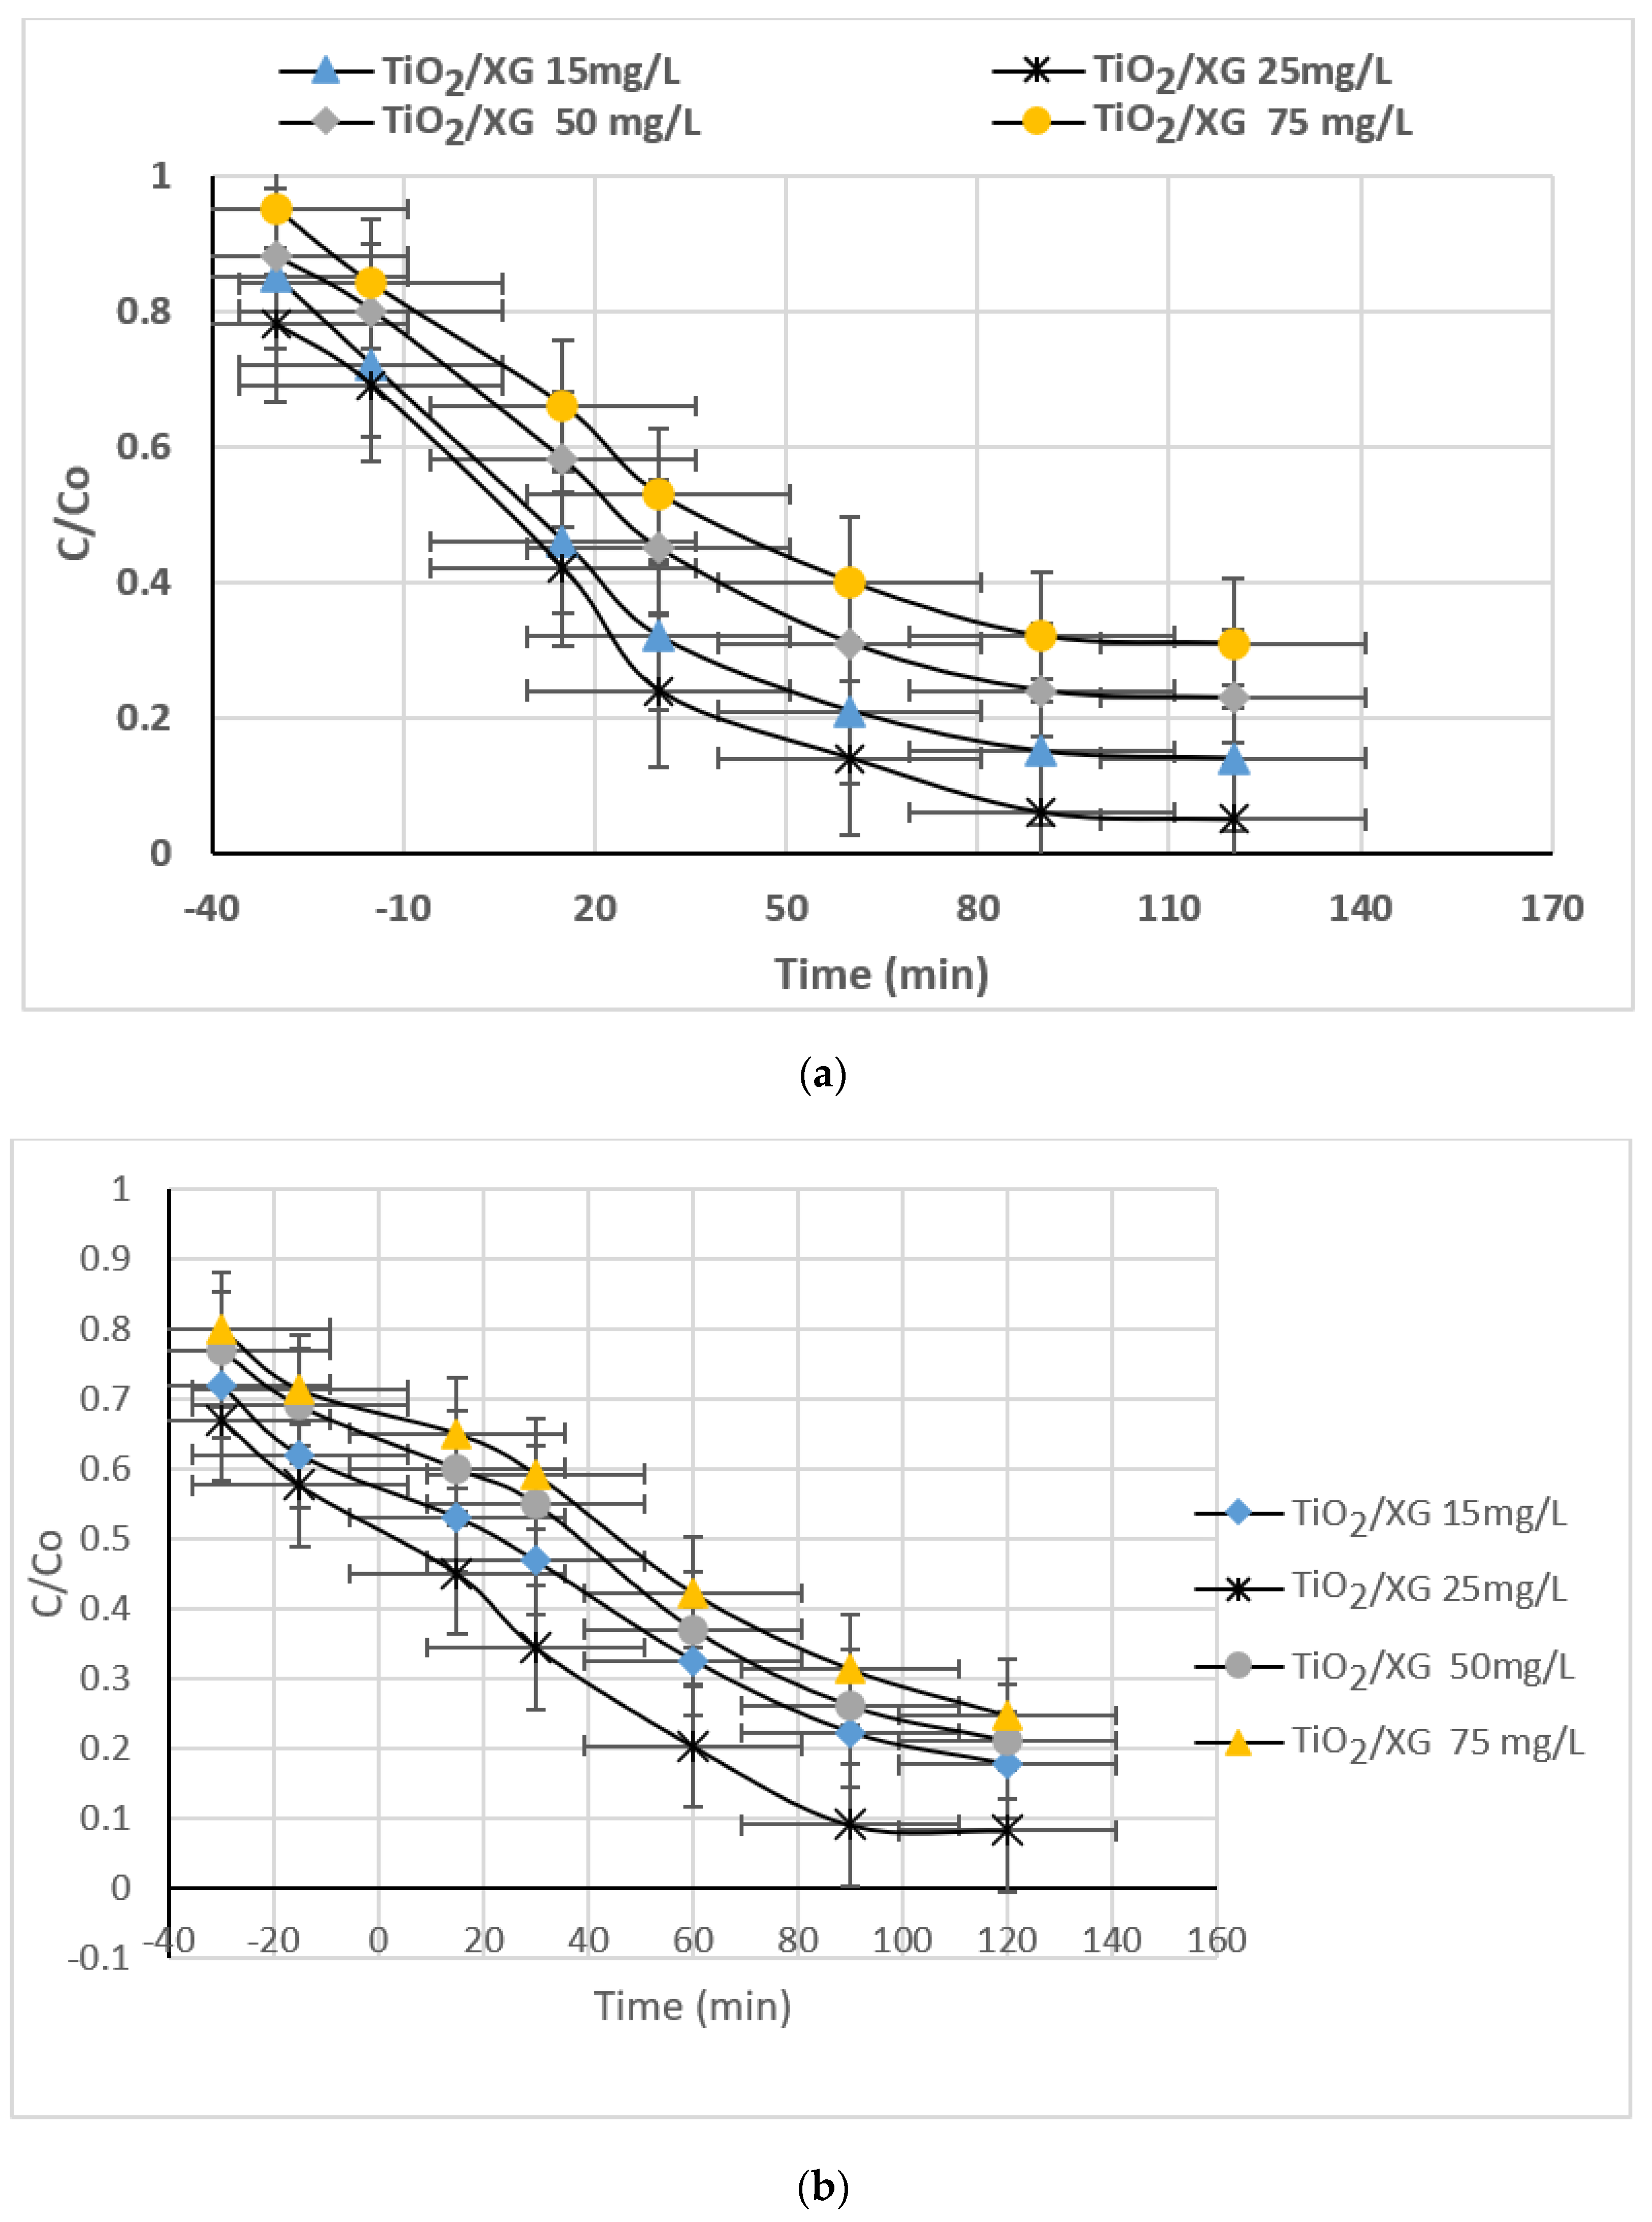
3.2.2. Dye Concentration and Time

To examine the effectiveness of TiO2/XG for RR and RT dye removal at different initial dye concentrations (25, 50, and 75), experiments were carried out at pH 5, 25 mg/L of TiO2/XG, a H2O2 concentration of 400 mg/L, and a 240 min reaction time. The results are presented in Figure 10. The decolorization efficiency declined as the initial RR and RT dye concentrations increased; this may have been because the dye molecules were increasingly adsorbed onto the surface of TiO2 with the increase in the initial dye concentration. Because there is no direct contact, it is possible that the significant dye adsorption inhibited the interaction between the dye molecules and the hydroxyl radicals or photogenerated holes. With more dye, light is absorbed by the dye molecules, meaning no photons can reach the surface of the photocatalyst, reducing the photocatalytic decolorization efficiency [40]. In addition, prolonging the time by up to 90 min increased the dye degradation, with maximum removal of 94 and 91 for the RR and RT dyes, respectively. The quantity of absorbed photons on the catalyst surface increases as the radiation time increases, promoting the photocatalytic process [41]. Again, increasing the catalyst concentration to an optimum level improved the degradation of the dye. Following that, the elimination percentage decreased. These results are in agreement with the findings of Inamuddin [24].

3.2.3. Effect of TiO2/XG

A series of experiments were carried out in which TiO2/XG concentrations (15, 25, 50, and 75) mg/L were varied while the remaining parameters remained constant. As displayed in Figure 11, adsorption data can be seen for reaction times of −30 to 0 min, in line with the 0–30 min adsorption time interval. Meanwhile, the 0–120 reaction time range represents the photodegradation data. Increasing the catalyst concentration from 15 to 25 mg/L led to a further increase in the RR and RT dye adsorption removal and photodegradation removal efficiencies. A further increase in the amount of TiO2/XG nanocomposite above 25 mg/L decreased the degradation rate. Additional TiO2/XG additions did not affect the degradation process and they merely widened the layer formed in the solution [24].

3.2.4. H2O2 Concentration

The H2O2 concentration is a significant factor in the degradation of dyes as it is the source of hydroxyl radicals. Figure 12 shows the variation in the RR and RT dye degradation from an aqueous solution at different H2O2 concentrations (200, 400, and 600 mg/L). It can be noticed from this figure that increasing the initial concentration of H2O2 from 200 to 400 mg/L increased the decolorization efficiency from 84 and 82.3% to 92.5 and 90.8% for RR and RT dyes, respectively, in line with Equations (6)–(8). Further increases in H2O2 concentration to 600 mg/L would reduce the decolorization efficiency, whereby high concentrations of H2O2 act as a radical scavenger according to Equations (9) and (10), and HO2 becomes predominant. Reduced concentration of H2O2 reduces the hydroxyl radicals (OH), leading to insufficient dye consumption and a reduction of the oxidation rate; this was also noted by [42,43].
TiO2(e) + H2O2 → TiO2 + OH + OH
O−2 + H2O2 → OH + OH + O2
H2O2 + hv → 2OH
H2O2 + OH → HO2 + H2O
HO2 + OH → H2O + O2

3.3. Photodegradation Kinetics

To examine the performance of solar photocatalytic processes for the degradation of RR and RT dyes from aqueous solution, kinetic analysis is essential for understanding the photodegradation process and reaction rate, which depend on the dynamic collaboration of dyes and the nanocomposite surface. A pseudo-first-order kinetics model is often used to show the reaction rate of a heterogeneous catalytic process, which can also be explained via the Langmuir–Hinshelwood (L–H) kinetic model [44,45,46].
ln C o C = k o b s .   t
where Kobs is the observed pseudo-first-order reaction rate constant (1/min), C and Co are, respectively, the dye concentrations (mg/L) following exposure time t and the dye concentrations at the start (mg/L), and t is the exposure time (min).
Plotting ln C o C t as a function of t from 0 to 120 min produces the kinetics results, as shown in Figure 13, and Table 2 gives the results for Kobs values as well as the regression coefficients (R2) of the linear plot equations. It can be seen that increasing the initial concentrations of the RR and RT dyes reduced the results for the constant degradation rate of Kobs. The finding from the kinetics model show that the kinetics pseudo-first-order model is an appropriate model to describe the reaction rate, and for all different concentrations, this model properly covered the results. Thus, the values of the explanation coefficients (R2 > 90%), and the reaction rate is reduced by increasing the RR and RT dye concentration. At high concentrations, due to the increased concentration of intermediate products, the number of active hydroxyl radicals was limited, and as a result, the constant degradation rate was decreased. This agrees with the experimental findings in Section 3.2.2 on how the initial RR and RT dye concentrations influence the dye removal efficiency.

4. Conclusions

In the present study, TiO2 immobilized on xanthan gum (denoted as TiO2/XG), prepared using the sol–gel dip-coating technique, was tested for the photocatalytic removal of RR and RT dyes under solar light, as identified using FTIR, XRD, SEM, and UV–Vis techniques. The best solar photocatalytic degradation rates, namely 92.5 and 90.8% at 25 mg/L of RR dye and RT dye, respectively, were achieved at pH 5 after an irradiation time of 120 min with 25 mg/L of TiO2/XG and 400 mg/L of H2O2. The application of immobilized TiO2 thus facilitates the recovery of materials while avoiding secondary pollutant problems involving the escape of a photo-catalyst into a water medium.
The results presented in this study confirm that the TiO2 particles enhance the mechanical and catalytic properties of XG and, thus, offers good potential for applications as a catalyst for degrading and eliminating organic pollutants of pharmaceutical origin that persist in the aqueous environment.

Author Contributions

A.I.A. and N.A.M.: editing, methodology, data analysis, and experiments. A.A.M.: methodology and supervision. T.J.A.-M.: writing, results and discussion, and editing. All authors have read and agreed to the published version of the manuscript.

Funding

This research received no external funding.

Institutional Review Board Statement

Not applicable.

Informed Consent Statement

Not applicable.

Data Availability Statement

The authors of this study confirm that the data supporting the findings of this study are available within the manuscript.

Acknowledgments

The authors are grateful for the financial and scientific support from the University of Baghdad and Al-Mustaqbal University.

Conflicts of Interest

The authors declare that they have no known competing financial interests or personal relationships that could have appeared to influence the work reported in this manuscript. The authors of this study declare no competing interests.

References

  1. Kang, Z.; Jia, X.; Zhang, Y.; Kang, X.; Ge, M.; Liu, D.; Wang, C.; He, Z. A review on application of biochar in the removal of pharmaceutical pollutants through adsorption and persulfate-based AOPs. Sustainability 2022, 14, 10128. [Google Scholar] [CrossRef]
  2. Al-Musawi, T.J.; Mengelizadeh, N.; Alwared, A.I.; Balarak, D.; Sabaghi, R. Photocatalytic degradation of Ciprofloxacin by MMT/CuFe2O4 nanocomposite: Characteristics, response surface methodology, and toxicity analyses. Environ. Sci. Pollut. Res. 2023, 30, 70076–70093. [Google Scholar] [CrossRef]
  3. Al-Mamun, M.R.; Kader, S.; Islam, M.S. Solar- TiO2 immobilized photocatalytic reactors performance assessment in the degradation of methyl orange dye in aqueous solution Environ. Nanotechnol. Monit. Manag. 2021, 16, 100514. [Google Scholar] [CrossRef]
  4. Muhmood, T.; Uddin, A. Fabrication of spherical-graphitic carbon nitride via hydrothermal method for enhanced photo-degradation ability towards antibiotic. Chem. Phys. Lett. 2020, 753, 137604. [Google Scholar] [CrossRef]
  5. Ali, H.Q.; Mohammed, A.A. Elimination of Congo red dyes from aqueous solution using Eichhornia Crassipes. Iraqi J. Chem. Pet. Eng. 2020, 21, 21–32. [Google Scholar] [CrossRef]
  6. Muhmood, T.; Xia, M.; Lei, W.; Wang F and Mahmood, A. Fe-ZrO2 imbedded graphene like carbon nitride for acarbose (ACB) photo-degradation intermediate study. Adv. Powder Technol. 2018, 29, 3233–3240. [Google Scholar] [CrossRef]
  7. Mahmood, A.; Muhmood, T.; Ahmad, F. Carbon nanotubes heterojunction with graphene like carbon nitride for the enhancement of electrochemical and photocatalytic activity. Mater. Chem. Phys. 2022, 278, 125640. [Google Scholar] [CrossRef]
  8. Mohammed, N.A.A.; Alwared, A.I.; Salman, M.S. Decolorization of reactive Yellow dye by advanced oxidation using continuous reactors. Iraqi J. Chem. Pet. Eng. 2020, 21, 1–6. [Google Scholar] [CrossRef]
  9. Ledakowicz, S.; Paździor, K. Recent achievements in dyes removal focused on advanced oxidation processes integrated with biological methods. Molecules 2021, 26, 870. [Google Scholar] [CrossRef]
  10. Hameed, F.M.; Mousa, K.M. Study on kinetic and optimization of continuous advanced oxidative decolorization of Brilliant reactive Red dye. Iraqi J. Chem. Pet. Eng. 2019, 20, 9–14. [Google Scholar] [CrossRef]
  11. Chaker, H.; Attar, A.E.; Djennas, M.; Fourmentin, S. A statistical modeling-optimization approach for efficiency photocatalytic degradation of textile azo dye using cerium-doped mesoporous ZnO: A central composite design in response surface methodology. Chem. Eng. Res. Des. 2021, 171, 198–212. [Google Scholar] [CrossRef]
  12. Yang, J.; Huang, R.; Cao, Y.; Wang, H.; Ivanets, A. Heterogeneous Fenton degradation of persistent organic pollutants using natural chalcopyrite: Effect of water matrix and catalytic mechanism. Environ. Sci. Pollut. Res. 2022, 29, 75651–75663. [Google Scholar] [CrossRef] [PubMed]
  13. Valadez-Renteria, E.; Oliva, J.; Navarro-Garcia, N.E.; Rodriguez-Gonzalez, V. Novel sustainable composites made of car’s waste and sodium titanate for the efficient photocatalytic removal of the bromophenol blue dye: Study under solar and UV–Vis light. Environ. Sci. Pollut. Res. 2022, 29, 76752–76765. [Google Scholar] [CrossRef] [PubMed]
  14. Bi, Y.; Liu, D. Rapid synthesis of recyclable and reusable magnetic TiO2@Fe3O4 for degradation of organic pollutant. Appl. Phys. A 2019, 125, 77. [Google Scholar] [CrossRef]
  15. Garcia, C.R.; Oliva, J.; Chavez, D.; Viesca-Villanueva, E.; Tejada-Velasquez, Y.; Mtz-Enriquez, A.I.; Diaz-Torres, L.A. Using a novel Sr2CeO4:Ni Photocatalyst for the degradation of the recalcitrant Congo Red dye under solar irradiation. Top. Catal. 2022, 65, 1102–1112. [Google Scholar] [CrossRef]
  16. Rana, A.G.; Minceva, M. Analysis of photocatalytic degradation of phenol with exfoliated graphitic carbon nitride and light-emitting diodes using response surface methodology. Catalysts 2021, 11, 898. [Google Scholar] [CrossRef]
  17. Ong, S.; Lee, C.; Zainal, Z.; Keng, P.; Ha, S. Photocatalytic degradation of basic and reactive dyes in both single and binary systems using immobilized TiO2. J. Fundam. Sci. 2009, 5, 2, 88–93. [Google Scholar] [CrossRef] [Green Version]
  18. Senthilnathan, J.; Philip, L. Photocatalytic degradation of lindane under UV and visible light using N-doped TiO2. Chem. Eng. J. 2010, 161, 83–92. [Google Scholar] [CrossRef]
  19. Wang, C.; Sun, R.; Huang, R.; Wang, H. Superior Fenton-like degradation of tetracycline by iron loaded graphitic carbon derived from microplastics: Synthesis, catalytic performance, and mechanism. Sep. Purif. Technol. 2021, 270, 118773. [Google Scholar] [CrossRef]
  20. Huang, R.; Yang, J.; Cao, Y.; Dionysiou, D.D.; Wang, C. Peroxymonosulfate catalytic degradation of persistent organic pollutants by engineered catalyst of self-doped iron/carbon nanocomposite derived from waste toner powder. Sep. Purif. Technol. 2022, 291, 120963. [Google Scholar] [CrossRef]
  21. Jouali, A.; Salhi, A.; Aguedach, A.; Lhadi, E.K.; El Krati, M.; Tahiri, S. Photo-catalytic degradation of polyphenolic tannins in continuous-flow reactor using titanium dioxide immobilized on a cellulosic material. Water Sci. Technol. 2020, 82, 1454–1466. [Google Scholar] [CrossRef] [PubMed]
  22. Dalto, F.; Kuźniarska-Biernacka, I.; Pereira, C.; Mesquita, E.; Soares, O.S.G.P.; Pereira, M.F.R.; Rosa, M.J.; Mestre, A.S.; Carvalho, A.P.; Freire, C. Solar light-induced methylene blue removal over TiO2/AC composites and photocatalytic regeneration. Nanomaterials 2021, 11, 3016. [Google Scholar] [CrossRef] [PubMed]
  23. Liu, W.; Li, Y.; Liu, F.; Jiang, W.; Zhang, D.; Liang, J. Visible-light-driven photocatalytic degradation of diclofenac by carbon quantum dots modified porous g-C3N4: Mechanisms, degradation pathway and DFT calculation. Water Res. 2019, 151, 8–19. [Google Scholar] [CrossRef] [PubMed]
  24. Inamuddin. Xanthan gum/titanium dioxide nanocomposite for photocatalytic degradation of methyl orange dye. Int. J. Biol. Macromol. 2019, 12, 1046–1053. [Google Scholar] [CrossRef]
  25. Abdel-Maksoud, Y.K.; Imam, E.; Ramadan, A.R. Sand supported TiO2 photocatalyst in a tray photo-reactor for the removal of emerging contaminants in wastewater. Catal. Today 2018, 313, 55–62. [Google Scholar] [CrossRef]
  26. Kaur, H.; Kaur, S.; Singh, J.; Rawat, M.; Kumar, S. Expanding horizon: Green synthesis of TiO2 nanoparticles using Carica papaya leaves for photocatalysis application. Mater. Res. Express. 2019, 6, 095034. [Google Scholar] [CrossRef]
  27. Zaier, M.; Vidal, L.; Garreau, S.H.; Balan, L. Generating highly reflective and conductive metal layers through a light-assisted synthesis and assembling of silver nanoparticles. Sci. Rep. 2017, 7, 12410. [Google Scholar] [CrossRef] [Green Version]
  28. Giwa, A.; Nkeonye, P.O.; Bello, K.A.; Kolawole, E.G.; Campos, A.M.F.O. Solar photocatalytic degradation of reactive Yellow 81 and reactive Violet 1 in aqueous solution containing semiconductor oxides. Int. J. Appl. Sci. Technol. 2012, 2, 90–105. [Google Scholar]
  29. Alobaidi, T.; Alwared, A.I. Biosynthetic of titanium dioxide nanoparticles using Zizyphus Spina-Christi leaves extract: Properties. J. Ecol. Eng. 2022, 23, 315–324. [Google Scholar] [CrossRef]
  30. Ansari, A.; Siddiqui, V.U.; Rehman, W.U.; Akram, M.K.; Siddiqi, W.A.; Alosaimi, A.M.; Hussein, M.A.; Rafatullah, M. Green synthesis of TiO2 nanoparticles using Acorus calamus leaf extract and evaluating its photocatalytic and in Vitro Antimicrobial Activity. Catalysts 2022, 12, 181. [Google Scholar] [CrossRef]
  31. Taghdiri, M.; Doolabi, S.D. Shift the photocatalytic activity of P25 TiO2 nanoparticles toward the visible region upon surface modification with organic hybrid of phosphotungstate. Int. J. Photoenergy 2022, 2020, 8870194. [Google Scholar] [CrossRef]
  32. Pervaiz, F.; Mushtaq, R.; Noreen, S. Formulation and optimization of terbinafine HCl loaded chitosan/xanthan gum nanoparticles containing gel: Ex-vivo permeation and in-vivo antifungal studies. J. Drug Deliv. Sci. Technol. 2021, 66, 102935. [Google Scholar] [CrossRef]
  33. Mecozzi, M.; Sturchio, E. Computer assisted examination of Infrared and near Infrared spectra to assess structural and molecular changes in biological samples exposed to pollutants: A case of study. J. Imaging 2017, 3, 11. [Google Scholar] [CrossRef] [Green Version]
  34. Dhanya, A.; Aparna, K. Synthesis and evaluation of TiO2/Chitosan based hydrogel for the adsorptional photocatalytic degradation of Azo and Anthraquinone dye under UV Light Irradiation. Procedia Technol. 2016, 24, 611–618. [Google Scholar] [CrossRef] [Green Version]
  35. Fardood, S.T.; Ramazani, A.; Golfar, Z.; Joo, S.W. Green synthesis of α-Fe2O3 (hematite) nanoparticles using Tragacanth Gel. J. Appl. Chem. Res. 2017, 3, 19–27. [Google Scholar]
  36. Maleki, A.; Moradi, F.; Shahmoradi, B.; Rezaee, R.; Lee, S.M. The photocatalytic removal of diazinon from aqueous solutions using tungsten oxide doped zinc oxide nanoparticles immobilized on glass substrate. J. Mol. Liq. 2019, 297, 111918. [Google Scholar] [CrossRef]
  37. Mansouri, L.; Sabelfeld, M.; Geissen, S.; Bousselmi, L. Catalysed Ozonation for removal of an endocrine-disrupting compound using the O3/Fenton reagents system. Environ. Tech. 2015, 36, 1721–1730. [Google Scholar] [CrossRef]
  38. Reza, K.M.; Kurny, A.; Gulshan, F. Parameters affecting the photocatalytic degradation of dyes using TiO2: A review. Appl. Water Sci. 2017, 7, 1569–1578. [Google Scholar] [CrossRef] [Green Version]
  39. Mohseni-Bandpi, A.; Al-Musawi, T.J.; Ghahramani, E.; Zarrabi, M.; Mohebi, S.; Vahed, S.A. Improvement of zeolite adsorption capacity for cephalexin by coating with magnetic Fe3O4 nanoparticles. J. Mol. Liq. 2016, 218, 615–624. [Google Scholar] [CrossRef]
  40. Daneshvar, N.; Salari, D.; Niaei, A.; Rasoulifard, M.H.; Khataee, A.R. Immobilization of TiO2 nano powder on glass beads for the photocatalytic decolorization of an azo dye C.I. Direct Red 23. J. Environ. Sci Health A Toxic Hazard. Subst. Environ. Eng. 2005, 40, 1605–1617. [Google Scholar] [CrossRef]
  41. Talebi, S.; Chaibakhsh, N.; Moradi-Shoeili, Z. Application of nanoscale ZnS/TiO2 composite for optimized photocatalytic decolorization of a textile dye. J. Appl. Res. Technol. 2017, 15, 378–385. [Google Scholar] [CrossRef] [Green Version]
  42. Durán, A.; Monteagudo, J.M. Solar photocatalytic degradation of reactive blue 4 using a Fresnel lens. Water Res. 2007, 41, 690–698. [Google Scholar] [CrossRef] [PubMed]
  43. Muruganandham, M.; Swaminathan, M. Solar driven decolorization of reactive Yellow 14 by advanced oxidation processes in heterogeneous and homogeneous media. Dye. Pigment. 2007, 72, 137–143. [Google Scholar] [CrossRef]
  44. Salarian, A.A.; Hami, Z.; Mirzaie, N.; Mohseni, S.M.; Asadi, A.; Bahrami, H.; Vosoughi, M.; Alinejad, A.; Zare, M. N-doped TiO2 nanosheets for photocatalytic degradation and mineralization of diazinon under simulated solar irradiation: Optimization and modeling using a response surface methodology. J. Mol. Liq. 2016, 220, 183–191. [Google Scholar] [CrossRef]
  45. Rastkari, N.; Eslami, A.; Nasseri, S.; Piroti, E.; Asadi, A. Optimizing parameters on nano photocatalytic degradation of Ibuprofen using UVC/ZnO processes by response surface methodology. Pol. J. Environ. Stud. 2017, 26, 785–794. [Google Scholar] [CrossRef]
  46. Nasseh, N.; Taghavi, L.; Barikbin, B.; Nasseri, M.A. Synthesis and characterizations of a novel FeNi3/SiO2/CuS magnetic nanocomposite for photocatalytic degradation of tetracycline in simulated wastewater. J. Clean. Prod. 2018, 179, 42–54. [Google Scholar] [CrossRef]
Figure 1. The dyes’ chemical structure. (a) Reactive turquoise; (b) reactive red.
Sustainability 15 10815 g001
Figure 2. Schematic of the TiO2/XG preparation.
Sustainability 15 10815 g002
Figure 3. Schematic representation of the solar-powered photo-oxidation process.
Sustainability 15 10815 g003
Figure 4. The band gap energy for TiO2/XG. (a) Absorption spectra for TiO2/XG nanoparticles, (b) direct band gap, (c) indirect band gap.
Sustainability 15 10815 g004aSustainability 15 10815 g004b
Figure 5. FTIR analysis for TiO2/XG.
Sustainability 15 10815 g005
Figure 6. SEM analysis for TiO2/XG. (a) TiO2/XG (before treatment), (b) TiO2/XG (RR dye treatment), (c) TiO2/XG (RT dye treatment).
Sustainability 15 10815 g006aSustainability 15 10815 g006b
Figure 7. XRD pattern of TiO2/XG.
Sustainability 15 10815 g007
Figure 8. RR and RT dyes’ removal percentage as a function of pH in the photocatalytic system. (a) RR dye, (b) RT dye.
Sustainability 15 10815 g008aSustainability 15 10815 g008b
Figure 9. pHpzc for TiO2/XG.
Sustainability 15 10815 g009
Figure 10. Dye degradation as a function of their concentration and time. (a) RR dye, (b) RT dye.
Sustainability 15 10815 g010
Figure 11. Effect of TiO2/XG concentration on the degradation of (a) RR dye and (b) RT dye degradation.
Sustainability 15 10815 g011
Figure 12. The influence of H2O2 concentration on the degradation of (a) RR dye and (b) RT dye.
Sustainability 15 10815 g012aSustainability 15 10815 g012b
Figure 13. The kinetic curves pseudo-first-order equation for RR dye and RT dye degradation at different initial concentrations.
Sustainability 15 10815 g013
Table 1. Properties of dyes used in this study.
ItemReactive TurquoiseReactive Red
Trade nameBlue 77Red 3B
OriginChinaChina
PhaseSolid/Powder Package 5 kgSolid/Powder Package 5 kg
Wavelength (nm)665540
Solubility g/L100–300100
Purity99%99%
CAS12236-86-170210-20-7
pH(1% aqueous solution)7 ± 0.57.2 ± 0.3
Molecular formulaC19H10Cl2N6Na2O7S2C41H25ClCuN14Na4O14S5
Molecular weight615.31289.0
Table 2. Reaction rate parameters for dyes decomposition in the solar photocatalytic process.
Dye ConcentrationFirst-Order for RR DyeFirst-Order For RT Dye
Removal % at 120 minR2Kobs (min−1)Removal % at 120 minR2Kobs (min−1)
2592.50.94240.018390.80.94280.0151
50770.92050.011740.94860.0094
75660.90660.0083700.94470.0085
Disclaimer/Publisher’s Note: The statements, opinions and data contained in all publications are solely those of the individual author(s) and contributor(s) and not of MDPI and/or the editor(s). MDPI and/or the editor(s) disclaim responsibility for any injury to people or property resulting from any ideas, methods, instructions or products referred to in the content.

