Article

Impact of Rock Fragment Shapes and Soil Cohesion on Runoff Generation and Sediment Yield of Steep Cut Slopes under Heavy Rainfall Conditions

1
State Key Laboratory of Geohazard Prevention and Geoenvironment Protection, Chengdu University of Technology, Chengdu 610059, China
2
Power China Chengdu Engineering Corporation Limited, Chengdu 611130, China
*
Author to whom correspondence should be addressed.
Sustainability 2023, 15(14), 10841; https://doi.org/10.3390/su151410841
Submission received: 2 May 2023 / Revised: 27 June 2023 / Accepted: 5 July 2023 / Published: 11 July 2023
(This article belongs to the Special Issue Slope Stability Analysis and Landslide Disaster Prevention)

Abstract

:
The erodibility and erosion resistance of Quaternary sediments play a pivotal role in both the hydrologic and erosion processes of soil cut slopes. To investigate the runoff and sediment yield of soil cut slopes along the Pai-Mo road, we performed indoor simulated rainfall experiments under a 50° steep slope and high rainfall intensity (120 mm/h), based on the area’s climatic characteristics and Quaternary sediment properties. The experiments included various rock fragment contents (30%, 40%, and 50%), different levels of rock fragment roundness (i.e., rounded gravel, angular gravel), and varying soil cohesion. The results indicated that the average infiltration rate of the uncemented rounded gravel soil slope (URGSS) was higher than that of the uncemented angular gravel soil slope (UAGSS), resulting in less runoff and a delayed initial runoff time. The runoff shear stress, runoff power, drag coefficient, and Reynolds number of the URGSS were smaller than those of the UAGSS. In contrast, the Froude number and flow velocity of the URGSS were larger, resulting in a stronger runoff erosion capacity. The sediment yield of the URGSS was approximately two times that of the UAGSS, and the cumulative sediment yield was about 20% higher. The cemented angular gravel soil slope (CAGSS) had a larger runoff rate, runoff shear stress, runoff power, and flow velocity than those of the UAGSS, leading to less sediment yield. Overall, a more rounded shape and a larger radius of curvature of the spherical particles resulted in stronger erosion, due to local turbulence. Therefore, the rill density and cumulative sediment yield of the steep alluvial cut slope were greater than that of the steep colluvial cut slope under heavy rainfall. Moreover, due to its strong cohesion, only raindrop splash erosion and inter-rill erosion occurred on the steep moraine cut slopes under heavy rainfall.

1. Introduction

Soil erosion is widely recongnized as a severe environmental threat, resulting in soil degradation and posing significant and extensive risks to freshwater and oceans [1,2]. The United Nations’ global soil resources report emphasizes soil erosion as global environmental and agricultural concern. Soil erosion is the result of a combination of natural factors and human activity [3]. Over the past 1000 years, human activities have emerged as the primary cause of soil erosion, accounting for 10 times more than those caused by all natural processes combined [4,5,6]. Such activities as farming, grazing, deforestation, afforestation, urban development, and construction projects alter climate conditions, soil characteristics, vegetation cover, and topography, thereby weakening the soil and intensifying soil erosion [7,8]. In 2012, the estimated annual average global soil erosion load was approximately 3.59 × 10¹⁰ t [9].
The launch of the “Western Development Strategy” and “Belt and Road Initiative” has facilitated China’s western mountainous regions to become key areas for implementing such large-scale national projects as railways, highways, hydropower, and oil and gas pipelines. The Tibetan Plateau, known as the roof of the world, has an average elevation of over 4000 m [10] and forms a subtropical monsoon climate with strong spatiotemporal variability of precipitation due to the large elevation difference with its periphery [11]. With its unique natural settings and complex topography, the Tibetan Plateau serves as the most critical ecological security barrier of China, and perhaps even Asia [12]. In addition to the variable terrain, complex geology, and sensitive environment, the road cut slope (a new landform created from human activity) is characterized by steep topography and has become one of the primary types of accelerated erosion caused by human activity in the region [13].
Soil erosion is predominantly influenced by rainfall intensity and slope gradient, which have been extensively studied through rainfall/scouring experiments, numerical simulations, and analytical solutions [14,15,16]. The effect of rainfall intensity on soil erosion is influenced by other factors, like soil properties, initial moisture content, and slope gradient [17,18,19]. It is widely accepted that higher rainfall intensity results in a higher peak flow of runoff, controlling the hydrologic response [20]. However, runoff and sediment yield increase with the increasing slope gradient [21,22], and start to decline when the slope reaches a critical gradient [23,24]. Numerous risk assessments and models based on abundant data collected over different slope gradients have demonstrated that slope gradient is a critical factor in controlling runoff and sediment yield [25,26,27].
In addition, the road cut slope consists of different Quaternary sediments, such as eluvial deposits, colluvial deposits, moraine deposits, and aeolian deposits, which are characterized by their highly heterogeneous material composition and great dispersion, with a loose structure, low mean cohesion, and lack of plant roots and organic matters. The erodibility and erosion resistance of Quaternary sediments are crucial factors affecting the hydrologic and erosion process of the road cut slope, including soil structure, soil cohesion, organic matter, and the size, shape, content, and position of rock fragments. Numerous studies have attempted to explore the effect of rock fragment size, content, and position on infiltration rate, runoff generation, and sediment yield, and the results have been widely reported [28,29,30]. Rock fragments that cover the soil surface, whether partially or completely embedded into topsoil, characterize the positions of rock [31,32]. In addition to the protection on soil surfaces, rock fragments in the soil profile also play a significant role in water conservation. Therefore, the runoff generation increases when rock fragments are embedded into topsoil, compared to those covering the soil surface [33,34]. Moreover, it is widely accepted that sediment yield decreases with the increase in rock fragment cover, regardless of whether the experiments are conducted with rainfall or scouring [35,36,37,38]. The runoff generation and sediment yield are larger for rock fragments partially embedded into topsoil than for those completely embedded into topsoil [39,40].
Rock fragments within the soil are characterized by their heterogeneous morphology, which includes rectangular, circular, spherical, and cylindrical shapes. These fragments are randomly distributed at spatial scales [41]. The shapes of rock fragments critically impact the dynamic nature between rock fragments and the surrounding soil matrix [42], thereby affecting the soil’s hydrological process. However, limited information is available on the interaction between the rock fragment shape and soil erosion on the steep road cut slope. De Figueiredo and Poesen [43] concluded that runoff generation was lower with rectangular (rather than circular) rock fragments for small rock fragments. In contrast, circular rock fragments were more effective in reducing runoff for larger fragments. Moreover, the effect of soil cohesion on soil erosion is also poorly understood.
In this study, we investigated a total of 78 cut slopes along the 67.22 km of Pai-Mo road in the Namcha Barwa region. Based on the information from our field investigation, we conducted a sequence of rainfall experiments to investigate the effects of rock fragment shape and soil cohesion on the infiltration rate, runoff generation, and sediment yield of steep road cut slopes under high rainfall intensity. Therefore, the objectives of the study were: (1) to examine hydrodynamic properties (such as infiltration rate, runoff rate, flow velocity, flow mode, and pattern) under different rock fragment shapes and soil cohesion; (2) to evaluate the effects of rock fragment shapes and soil cohesion on the sediment yield. Understanding the processes and influential factors of soil erosion plays a pivotal role in establishing a soil erosion model that can accurately detect and predict soil loss. This knowledge is of the utmost importance for effectively managing and reducing soil and water loss from cut slopes.

2. Materials and Methods
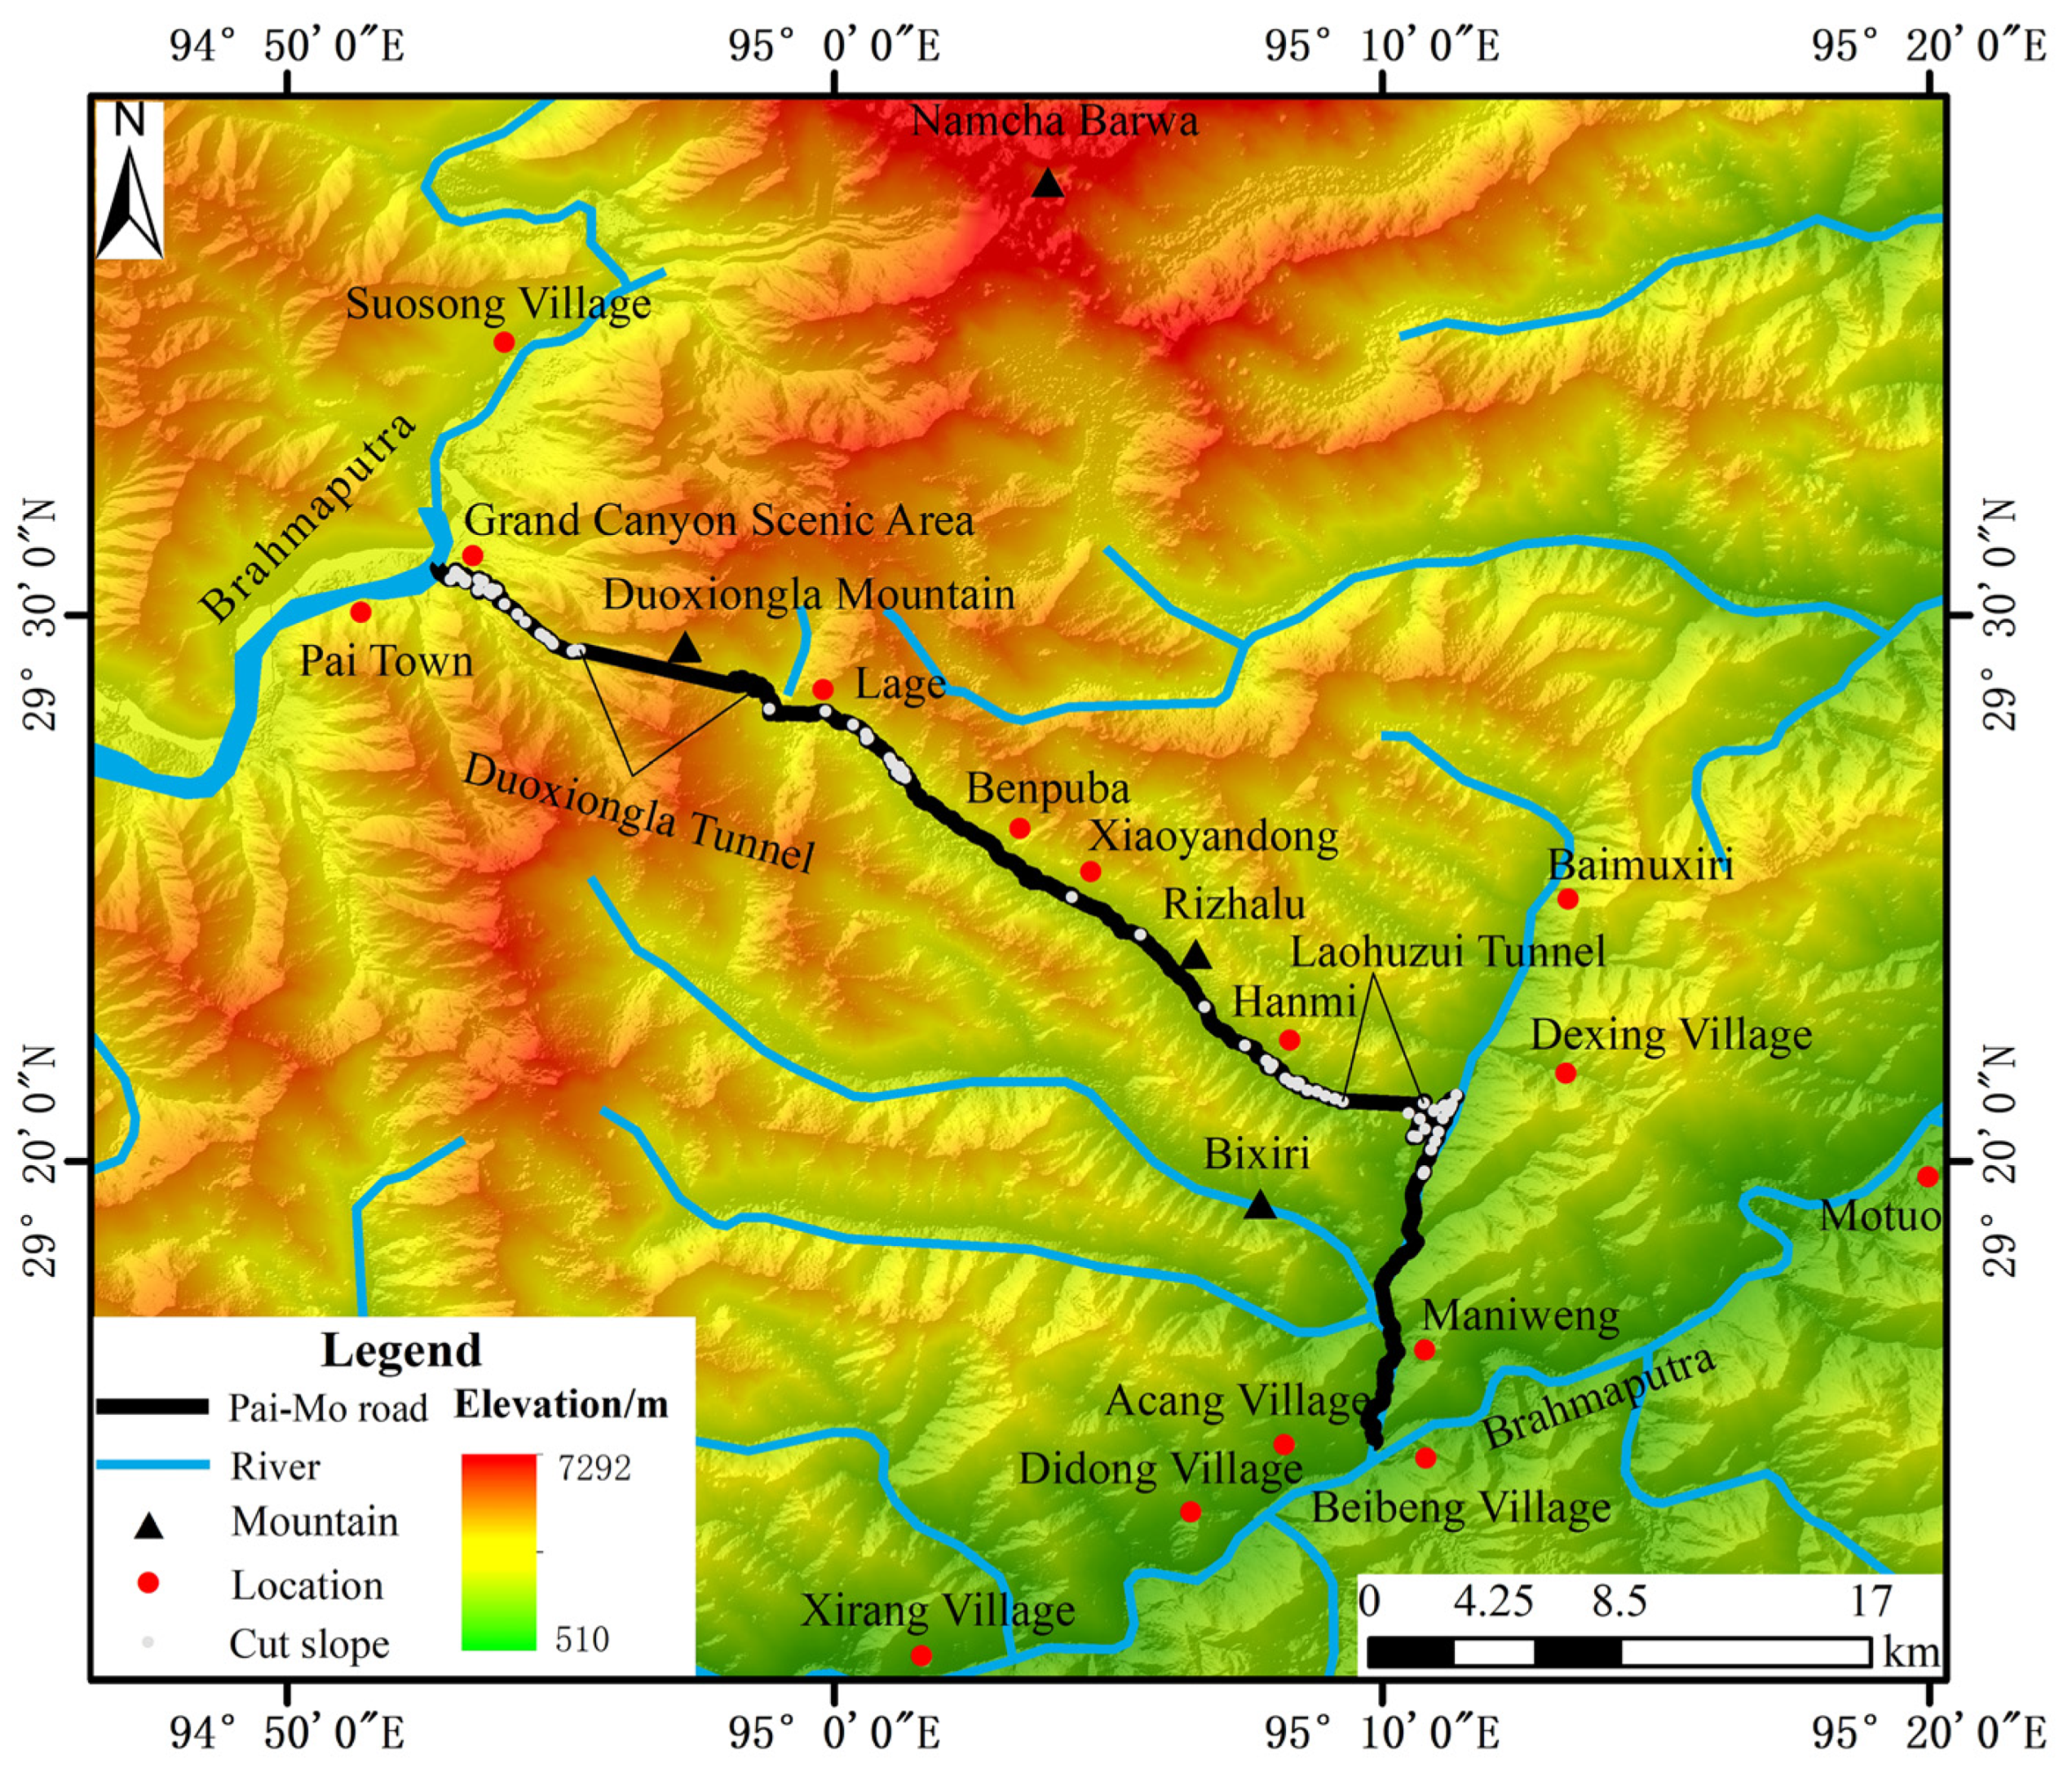
2.1. Study Area

The Pai-Mo road is located in Nyingchi City in the south-east of the Tibet Autonomous Region, which belongs to the lower reaches of the Brahmaputra River. The road commences from Pai Town in Nyingchi and traverses the Duoxiongla Mountain via a dedicated tunnel. From there, it meanders along the Duoxiong River Valley, passing through Lage, Hanmi, Laohuzui, and Ani Bridge, and eventually terminating at the Jiefang Bridge of Beibeng Village in Motuo County. The Pai-Mo road passes through the Brahmaputra Grand Canyon National Nature Reserve, with a total length of 67.22 km (Figure 1).
The Duoxiong River basin belongs to the Himalayan eastern tectonic junction area. The area features undulating terrains, deep river valleys, and steep mountains, and is known for experiencing the most significant uplift and erosion from the Tibetan Plateau. The highest elevation of the road is approximately 3654 m, at the entrance to the Duoxiongla Tunnel, and its lowest elevation is about 680 m, at the Jiefang Bridge (Figure 2). Notably, the entrance section of the Pai Town–Duoxiongla Tunnel involves an elevation gain and a road slope drop of 8.8%. The 52.2 km stretch between the Duoxiongla Tunnel exit and the Jiefang Bridge has an altitude difference of 2863 m and a road slope of 54.8‰. The project started in April 2014 and was completed in May 2021. Thus, the route from Nyingchi to Motuo County has been shortened from 352 km through Bomi County to 180 km through Pai Town.
In the lower reaches of the Brahmaputra River, 41 modern glaciers are distributed in a “palm-shaped” layout surrounding the Namcha Barwa, covering over 200 km2. The Duoxiongla Mountain boasts an array of glacially eroded landforms such as tindars, blade ridges, cirques, grooves, and glacial lakes. The entire northern slope is cut with the branch ditch etched from the erosion of two upstream and downstream glaciers, forming the Paiba ditch in a “Y” shape. On the other hand, the southern slope of the Duoxiong River presents a three-step ice erosion valley. After conducting on-site surveys, it was found that the Quaternary overburden layer in the region is widely distributed, with a multitype, thick, and complex material composition, and a hierarchical structure. It can be primarily classified into eluvial, colluvial, alluvial, moraine, and fluvial deposits. These formations result from the evolution of the multilevel terraces along the Brahmaputra River and the ancient, dammed lake accumulation formed by the river blockage due to glacial movement.
Pai Town is situated in the Daduka section of the mainstem of the Brahmaputra River, approximately 76 km downstream from the Milin Meteorological Station, which has an altitude of approximately 2950 m. According to the meteorological data of the Milin Meteorological Station from 1981 to date, the annual average temperature in the area has been 8.6 °C, with the extreme maximum and minimum temperatures recorded at 29.7 °C and −15.8 °C, respectively. The annual average rainfall is 702.1 mm, mainly concentrated from May to September, with a maximum daily rainfall of 81.8 mm, indicating a plateauing, temperate, semihumid climate. The Duoxiongla Mountains, situated at the confluence of the cold current from the continental plateau and the warm and humid airflow from the Indian Ocean, is known for its unpredictable climate and frequent fog, making it a notorious gateway to and from Motuo. The Duoxiongla River basin lies within the mountainous temperate zone and subtropical monsoon humid climate zone, receiving one of the highest annual rainfalls in China. The alpine area above Lage experiences precipitation mainly in the form of ice and snow, while the area below the Lage is dominated by rainfall. According to records from the Hanmi rainfall station (at an altitude of approximately 2200 m), the annual cumulative rainfall is about 3500 mm, with a maximum daily rainfall of 85 mm.

2.2. Characteristics of Cut Slopes along the Pai-Mo Road

A total of 78 large cut slopes along the Pai-Mo road are primarily distributed on both sides of the Duoxiongla Tunnel and Laohuzui Tunnel. The greatest concentration of these large cut slopes is found in the entrance section of the Pai Town–Duoxiongla Tunnel. There are 27 large cut slopes within a range of 8.09 km, accounting for 34.6% of the total slopes. However, the Lage–Hanmi segment of the road is relatively gentle, with only three large cut slopes distributed within the 17.70 km range, accounting for 3.8% of the total (as shown in Table 1).
The excavation of these cut slopes has been guided by material composition, cementation degree, and surface slope, with a slope ratio of 1:0.75–1:1.5 (Horizontal:Vertical (H:V)). A 2.0 m wide slope platform has also been established with every 10–12 m ascent. Among these cut slopes, the slopes of 50–60° are the most common, accounting for 46.1% of the total; the number of slopes of 40–50° comes next, comprising 34.2% of the total. Those with slopes of 20–30° and 60–70° are less common, and are likewise distributed less frequently (Figure 3).
The starting point of Pai-Mo road, located at the mouth of the Paibagou, is divided into three-level terraces at elevations of 3150 m, 3030 m, and 2950 m. The area between Pai Town and the Songlinkou mountain road (at an altitude of 2950–3280 m) comprises the Brahmaputra V and VI terraces, which were excavated from Pleistocene alluvial accumulation. Field sieving tests were conducted to characterize the particle size distribution. This subrounded to rounded cobbles soil (with boulders, gravel, and sand) has moderate relative compaction, no cementation, and high roundness, with the boulder group (>200 mm), cobble group (60–200 mm), gravel group (2–60 mm), sand group (0.075–2 mm), and fine-grained group (<0.075 mm) being found in a ratio of 25:15:27:30:3. The Duoxiongla Tunnel’s sides have a significant number of moraine accumulation layers of considerable thickness, primarily containing subround to subangular cobbles with extremely low clay content. The lithology of the rock fragment is mainly gneiss, and has medium roundness, with boulder group (>200 mm), cobble group (60–200 mm), gravel group (2–60 mm), sand group (0.075–2 mm), and fine-grained group (<0.075 mm) being recorded in a ratio of 28:20:24:25:3. Due to the age and long-term consolidation of moraine accumulation layer, the cohesion of these layers is high, with dense structure and strong erosion resistance, which results in no apparent fine trench erosion on the excavation slope. The colluvial deposits that are widely distributed on different sections of the Pai-Mo road (and contain mainly subangular to angular cobble soil layers) have a loose structure, no cementation, and low roundness, with boulder group (>200 mm), cobble group (60–200 mm), gravel group (2–60 mm), sand group (0.075–2 mm), and fine-grained group (<0.075 mm) being recorded in a ratio of 25:20:22:28:5 (Figure 4).

2.3. Experimental Equipment, Materials and Design

Simulated rainfall experiments were conducted in the rainfall simulation laboratory at Chengdu University of Technology from March to May 2022. During this period, runoff sediment samples were collected and analyzed to study the process and laws of sediment yield on slopes under different conditions of rock fragment embedding. The rainfall device used in experiments comprised a tripod, nozzle, pressure relief valve, water pipe, water pump, and water storage bag. The nozzle model was 1/2HH–50WSQ, produced by Spraying Systems of the United States, with an installation height of 3 m. The rainfall intensity was controlled by adjusting the water pressure through the pressure relief valve, ranging from 20 to 120 mm/h. The effective rainfall area had a diameter of 2 m, and the rainfall uniformity needed to exceed 80% in order to meet the accuracy requirements of artificial rainfall simulation [44]. To facilitate the collection of runoff and sediment, a 0.6 m length, 0.3 m width, and 0.2 m height steel trough was utilized in experiments. The bottom of the trough was evenly punched with a hole 5 mm in diameter, and a collecting groove was welded to the lower end of the trough (Figure 5).
According to the particle analysis of the cut slope along the Pai-Mo road, the average mass of the 2–60 mm rock fragment group was about 40%. The rock fragment content of the test slope was set to three gradients based on the mass ratio of 30%, 40%, and 50%. The maximum particle size of the sample was determined to be 60 mm, based on the simulated rainfall test conditions and the particle size range of the on-site hydraulic handling particles. Therefore, to investigate the impact of rock fragment shapes on runoff generation and sediment yield of cut slopes, we prepared the uncemented rounded gravel soil slope (URGSS) and uncemented angular gravel soil slope (UAGSS) by mixing commercial rounded and angular gravels, respectively. Based on the Krumbein [45] and Krumbein–Sloss [46] charts, the rounded gravels had rounded to well-rounded shapes with roundness values in the range of 0.7 ≤ R ≤ 0.9, and they also possessed medium sphericity, with values 0.5 ≤ S ≤ 0.7. In contrast, the commercial angular gravels exhibited angular to very angular shapes, with roundness values ranging from 0.1 to 0.3, and they were also of medium sphericity, with values in the range of 0.5 ≤ S ≤ 0.7. The rock fragments were evenly mixed according to different particle sizes: 60–40 mm, 40–20 mm, 20–10 mm, 10–5 mm, and 5–2 mm, in a mass ratio of 5:6:6:4:4. Furthermore, to investigate the impact of soil cohesion on runoff generation and sediment yield of cut slopes, we prepared the cemented angular gravel soil slope (CAGSS) by incorporating a 4% mass of cement. The CAGSS sample was prepared using 42.5 ordinary silicate cement and tested after 24 h of curing.
In addition, to eliminate potential interference, the sand and fine-grained particle (grains sizes < 2 mm) for all test samples were exclusively collected from the alluvial at K2+814 m of the Pai-Mo road, which is located within the plateau temperate semihumid climate zone. The soil had a bulk density of 1.2 g/cm3, a natural moisture content of approximately 11%, a sand content of 55%, a powder content of 17%, and a clay content of 28%. According to the soil texture classification standard of the U.S. Ministry of Agriculture, the soil texture is sandy clay loam, and its mechanical composition is mainly sand. After being naturally air-dried, the soil was sieved through a 2 mm sieve. Subsequently, a mass ratio of 70% sand and fine-grained particle (grains sizes < 2 mm) mixed with 30% rock fragments of different sizes in the range of 2–60 mm was recorded. Similarly, 60% sand and fine-grained particle (grains sizes < 2 mm) mixed with 40% rock fragments of different sizes in the range of 2–60 mm was recorded. Lastly, 50% sand and fine-grained particle (grains sizes < 2 mm) mixed with 50% rock fragments of different sizes in the range of 2–60 mm was recorded.
Based on the rainfall monitoring data along the Pai-Mo road, the rainfall intensity was set to 120 mm/h, to simulate the effect of aggressive rainfall. Due to the excavation angles of cut slopes along the Pai-Mo road being concentrated between 41 and 63° (with an average value of 51°), the test slope was designed to be 50°. A total of nine rainfall tests were conducted, and the experimental designs are shown in Table 2.

2.4. Experimental Procedure

(1) An experimental soil trough was constructed to imitate the natural permeable layer and prevent soil leakage from the drainage hole. A 1-cm-thick layer of gravel, with particle sizes ranging from 5 to 10 mm, was packed at the bottom of the soil trough, followed by a layer of fine permeable gauze. The required quality of soil and gravel was calculated based on the rock fragment content. They were loaded into the soil trough in layers with a thickness of 5 cm and the total thickness of 15 cm. Shaving treatment was performed between the layers to minimize the boundary effect between the soil layers. The soil bulk density was controlled at around 1.2 g/cm3 to maintain consistency with the natural state.
(2) To ensure the quality of sample preparation, digital image processing technology was used to control the variation in rock fragment-specific surface area and spatial arrangement among URGSS, UAGSS and CAGSS. The test was conducted when the difference was less than 3% (Table 3), and the spatial arrangement characteristics were similar. The following steps were performed: (1) Obtain the image data of the sample; (2) Perform geometry correction and airspace enhancement through Photoshop CS5; (3) Use binarization processing through Image J and Photoshop CS5 to remove excess noise, fill in the internal missing stones, generate fine binarized images, and obtain the spatial arrangement characteristics of rock fragments; (4) Read the number of rock fragment cells and calculate the rock fragment-specific surface area.
(3) The rainfall intensity in the four corners and center of the soil trough was measured using a rain gauge to calculate the average rainfall intensity and uniformity, ensuring that it met the design requirements.
(4) The sample was lightly sprinkled with a sprinkler kettle until the drainage hole began to seep. After this, the rainfall test was conducted by allowing the sample to stand for 12 h, ensuring that the soil moisture content and water distribution remained relatively consistent for each test.
(5) The initial runoff time was recorded with an accuracy of 0.01 s using a stopwatch after the start of simulated rainfall. The period from the start of rainfall until a stable water flow was observed on the slope was defined as the initial runoff generation time [47]. The rainfall continued for 30 min after a steady runoff was observed on the slope. Following the initial runoff generation, sediment runoff samples were collected at 2 min intervals using collecting flasks. KMnO4 solution was released from the top of the soil tank, and the time it took to descend through the bottom of the trough was recorded so as to determine the water flow velocity.
(6) After the slope generated runoff, a 30 min period was dedicated to surface runoff and sediment collection. The time was carefully recorded using a stopwatch. Samples were collected at intervals of 2 min, and the mass of sediment-containing runoff was measured using a highly precise electronic scale, with an accuracy of 0.1 g. Subsequently, the collected sample was allowed to stand for 8 h, facilitating the natural stratification of sediment and water. After this process, the supernatant was carefully poured out, and the wet sediment was extracted and placed into an aluminum box. In order to accurately quantify the sediment, it was subjected to a drying process in an oven at 105 °C for a duration of 8 h (Figure 6).

2.5. Data Analysis

The data was calculated and summarized using Excel 2019, while SPSS 25.0 was utilized for statistical analysis. The drawing was created using Origin 2018.
(1) When runoff was initially generated ( T 0 ), this unit referred to the time from the start of rainfall until the slope stabilizes the runoff generation. The unit of measurement was s.
(2) Runoff generation ( q ) is the production flow pooled by a constant rate over a period of time, and the unit was cm3. Runoff generation can be calculated using Equation (1):
q = M M ρ W
where  M  (g) is the total mass of muddy water containing sediment;  M  (g) is the dry weight of sediment; and  ρ W  (g/cm3) is the density of water.
(3) Runoff rate ( Q ) and sediment yield rate ( D ) are the runoff (mm/min) and sediment yield amount (g/(m2·min)) per unit time and area slope, respectively. They can be calculated as follows:
Q = q A T
D = M A T
where  A  (mm2) is the slope area, and  T  (min) is the rainfall time.
(4) Infiltration rate ( I ) is the amount of water that infiltrates the soil surface per unit time and unit area (mm/min), which can be calculated as follows:
I = i T cos θ q A T
where  θ  (°) is the slope, and  i  (mm/min) is the rainfall intensity.
(5) The average flow rate ( V ) is a critical parameter for slope hydrodynamics characteristics and was measured in cm/s. The flow velocity was measured using the dye KMnO4 tracer method, which is the maximum flow rate of the surface layer. According to this test’s slope runoff flow pattern, it is necessary to multiply the correction coefficient of 0.75 and convert it to the average flow rate.
(6) The average runoff depth ( h ) is the average water depth of the slope water flow. The unit was cm. It can be calculated as follows:
h = q V b t
where  b  (cm) is the width of the sink, and  t  (s) is the sampling time for runoff.
(7) Runoff shear stress ( τ ) is a parameter that quantifies the magnitude of soil erosion on slopes during runoff flow. It represents the main force that causes slope soil particles to separate and transport. It is measured using the unit of N/m2. It can be calculated as follows:
τ = ρ w g R q
where  g  is the acceleration of gravity (980 cm/s2), and  R  (cm) is the hydraulic radius. An approximation of the average runoff depth can replace the slope thin-layer water flow.
(8) Runoff power ( ω ) indicates the energy exerted by the flowing water per unit area and indicates its capacity to transport sediment. It has been a widely adopted parameter in many mature soil erosion models, expressed in the unit of W/m2, and can be calculated as follows:
ω = τ V
(9) The Reynolds number ( R e ) is a dimensionless parameter determined as the ratio of inertia to viscous force [48].  R e  < 500, 500 ≤  R e  ≤ 2000, and  R e  > 2000 indicate laminar flow, transition flow, and turbulent flow, respectively. The larger the Reynolds number, the greater the degree of slope flow turbulence, and thus the greater the erosion capacity. It can be calculated as follows:
R e = V R v
where  v  (cm2/s) is the viscosity coefficient of runoff, which is temperature dependent.
(10) The Froude number ( F r ) is determined as the ratio of inertia to gravitational forces [48],  F r  > 1,  F r  < 1,  F r  = 1 indicates the occurrence of jet flow, slow flow, and critical flow, respectively. In general, the larger the Froude number, the stronger the sand-carrying capacity of runoff. It can be calculated as follows:
F r = V g h
(11) The drag coefficient ( f ) reflects the friction to overland flow exerted by the soil, which is determined by rainfall intensity, soil structure, soil physical–chemical properties, and wave friction [49].
f = 8 g h J V
where  J  is a hydraulic slope, which can be replaced with an approximation of the sinusoidal value of the slope.

3. Results and Analysis

3.1. Erosion Characteristics

Based on digital image processing technology, we could extract the change in the specific surface area of rock fragments on slopes with different rock fragment shapes before and after rainfall. The increase in rock fragment content resulted in a greater change in rock fragment-specific surface area before and after rainfall. Furthermore, when comparing slopes with the same rock fragment content, the change in rock fragment-specific surface area in the UAGSS was slightly greater than the URGSS and CAGSS (Table 3).
Figure 7 shows the apparent rill erosion observed on the UAGSSs and the URGSSs following rainfall. In the early stage of rainfall, the slope water flow initiated the slope soil erosion at the toe of the slope, resulting in the formation of rills. As rainfall continued, the rills progressed upward along the slope and broadened on both sides due to runoff erosion. From the characteristics of slope erosion development, it was found that the UAGSS mainly developed one to two rills, exhibiting the characteristics of large-scale and deep-cut concentrated erosion of a single ditch. On the other hand, the URGSS formed deep-cut annular rills surrounding the rounded gravel, presenting the characteristics of scattered erosion with numerous rills but a small scale and shallow depth. Conversely, the CAGSS failed to present apparent slope erosion before and after the rainfall. Only raindrop splash erosion and rill erosion occurred, causing insignificant slope microtopography changes and less sediment yields.

3.2. Hydrodynamic Characteristics

3.2.1. Infiltration Characteristics

Figure 8 shows that the infiltration rate of the URGSSs and UAGSSs gradually decreased as rainfall time increased. The infiltration rate decreased rapidly between 6 and 12 min after the initial runoff generation on the slope. Between 12 and 30 min after runoff generation on the slope, the infiltration rate gradually stabilized, and the fluctuation range became narrow. In the early stage of runoff generation, the infiltration rate of the UAGSS and URGSS was similar. However, as rainfall continued, the infiltration rate of the URGSS gradually exceeded that of the UAGSS. The overall infiltration rate of the slope decreased with the increase in the rock fragment content, which can be attributed to the lower permeability of rock fragment compared to soil.
Compared with uncemented slopes, the average infiltration rate of CAGSS decreased, and the degree of the infiltration rate change was small, but the infiltration rate was significantly reduced. For instance, for the slope with 30% rock fragment content, the infiltration rate of CAGSS was reduced by 39.4% compared to the uncemented slope. This date indicated that slopes with soil cohesion rapidly reduced the soil infiltration capacity.

3.2.2. Runoff Generation Characteristics

The initial runoff time of the URGSS was significantly later than that of the UAGSS, and the gap between the two gradually decreased as the rock fragment content increased (Table 4). In contrast, the initial runoff time of the CAGSS decreased sharply compared to the UAGSS. However, the influence of cementation on the initial runoff time gradually decreased with increasing rock fragment content.
The runoff rate of URGSSs and UAGSSs changed with time in two stages: (1) a rapid increase stage, where the runoff rate increased rapidly when the initial runoff of the slope was about 14 min; however, the increase in the runoff rate gradually decreased with increasing rock fragment content; (2) a flat increase stage, where the runoff rate gradually tended toward a gentle increase trend and slowly increased with small fluctuations after 14 min of runoff generation. In contrast, the fluctuation amplitude of the runoff rate of the CAGSS with time decreased slightly. After stabilization, the runoff rate of the CAGSS was generally greater than the UAGSS, shown in Figure 9.
The average runoff rate of the UAGSS was greater than that of the URGSS, and the gap between the two gradually increased with the increase in rock fragment content. On the other hand, the average runoff rate of the CAGSS was greater than that of the UAGSS. The fluctuation amplitude of the average runoff rate enlarged with the increase in rock fragment content. The overall runoff rate of each slope increased with the increase in rock fragment content. The cumulative runoff gap between the UAGSS and URGSS was small at the beginning of the runoff. However, the gap between the two gradually broadened with increasing rainfall time (Figure 10), which was also observed between CAGSS and UAGSS.

3.2.3. Flow Velocity

In general, the flow velocity of each slope gradually decreased with time, which was consistent with the conclusion of many studies regarding the flow velocity change during rill erosion on slopes [50,51]. However, the flow velocity change trend of the uncemented slope significantly differed from that of the cemented slope.
In the early rainfall stage, the thin-layer water flow encountered less resistance because the slope was relatively flat, resulting in a large flow velocity. However, with the extension of rainfall time, the water flow energy consumption of the uncemented slope increased due to the increase in the amount of sediment carried by the water flow increase, resulting in the flow velocity fluctuating and decreasing. The rill erosion continued to develop, and the tortuosity of the rills increased, leading to the collapse of the rill walls and causing the sediment content of the runoff to grow rapidly. This process consumes much water flow energy, constantly decreasing flow velocity. In the later stage of rill development, the rill shape tended to be fixed, and the flow velocity stabilized. Therefore, the process of change in the URGSS and UAGSS can be roughly divided into two stages: (1) The stage of significant fluctuations occurred in the initial stage of rainfall runoff, characterized by a decrease in flow velocity, and accompanied by violent fluctuations; (2) The stage of gradual decline occurred in the later stage of rainfall runoff, where the fluctuation amplitude of flow velocity significantly reduced and showed a slow downward trend (as shown in Figure 11). This was because during the initial stage of rainfall, the slope surface was relatively smooth, resulting in less resistance to the thin-layer water flow on the slope surface and higher flow velocity.
However, the presence of soil cohesion in the CAGSS prevented the formation of rill erosion, unlike the UAGSS. Erosion on the CAGSS was limited to the areas between rills, resulting in a minimal change in shape. The surface of the CAGSS remained relatively flat, allowing for smoother water flow compared to UAGSS. Therefore, the flow velocity of the UAGSS was smaller than that of the CAGSS due to energy conservation principles.
The overall flow velocity change amplitude of CAGSS was smaller than that of the UAGSS. The flow velocity fluctuated with time in a jagged pattern and slowly decreased in the fluctuation. Figure 11 shows that the time for the flow velocity to stabilize became shorter as the rock fragment content increased. In addition, with the increase in rock fragment content, the slope flow velocity of the UAGSS and CAGSS decreased to varying degrees, and the runoff shear stress and runoff power increased to different degrees (Figure 12). Compared to the UAGSS under the same rock fragment content conditions, the flow velocity of the URGSS was larger, but the runoff shear stress and runoff power were less. However, compared to the UAGSS under the same rock fragment content conditions, the flow velocity, runoff shear stress, and runoff power of CAGSS were greater.

3.2.4. Flow Mode and Pattern

The drag coefficient is a function of water depth and flow velocity, which is directly proportional to water depth and inversely proportional to flow velocity. Table 5 presents that the drag coefficient of each slope increased with the increase in rock fragment content. Since the flow velocity of the URGSS was higher than the UAGSS, and the runoff rate and the water depth were lower, the drag coefficient of the URGSS was smaller than that of the UAGSS. In addition, slopes with soil cohesion had high shear strength, making it difficult for runoff to erode the slope to form rills. Thus, the slope remained relatively flat, and the drag coefficient of the CAGSS was minimal.
The Reynolds number range of each slope was 5.852–8.884, indicating a laminar flow mode. The Reynolds number of the URGSS was smaller than that of the UAGSS, and the Reynolds number of the UAGSS was smaller than that of the CAGSS. However, the effect of rock fragment shapes on Reynolds number was less significant than that of soil cohesion, indicating that the presence of cementation was the primary factor affecting the flow pattern of the slope water.
The Froude number is a function of flow velocity and water depth, which is proportional to the flow velocity and inversely proportional to the water depth. The Froude number range of each slope was between 3.152 to 9.863, and the flow pattern was a jet flow. The water depth was positively correlated with runoff, and the runoff rate of the URGSS was lower than that of the UAGSS. However, the flow velocity was larger, resulting in a greater Froude number for the URGSS. This finding indicated that the rock fragment shape was the main factor impacting the Froude number of the slope water flow, which determined the flow pattern. A higher roundness of rock fragments resulted in their being more easily eroded by the slope soil. In addition, compared to the CAGSS, rills in rainfall mainly eroded the UAGSS, and the slope water flow was concentrated in the rills. The runoff water depth was larger than that of the thin layer of the CAGSS, where the erosion between rills mainly occurred. Therefore, the water flow of CAGSSs was less impeded, leading to a larger flow velocity and Froude number.

3.3. Sediment Yield Characteristics

Figure 13 shows that raindrop splash and intertrench erosion phases occurred during early rainfall. The sediment yield difference between the UAGSSs and the URGSSs was relatively small, indicating that the rock fragment shapes had little effect on raindrop splattering and intertrench erosion. The peak sediment yield of the UAGSS occurred earlier than that of the URGSS, suggesting that the rill erosion occurred earlier on the former. The sediment yield of the CAGSS was much lower than the UAGSS. During the later rill erosion stage, the rock fragment shape had a greater influence, as the peak sediment yield and sediment yield after the peak of the URGSS was generally greater than the UAGSS, and the late sediment yield of the URGSS was about twice that of the UAGSS. Overall, the sediment yield of each uncemented slope with different rock fragment content showed an initial increase followed by a decrease over time. The increase in stone fragment content results in an overall decrease in sediment yield on the slope [35,37,52].
The cumulative sediment yield of the URGSS and UAGSS exhibited a pattern of initial slow increase, followed with a rapid increase, and then another period of slow increase. As the rock fragment content increased, the rate of increase in cumulative sediment yield became more stable, and the initial cumulative sediment yield was slightly higher. During the initial stage of runoff generation, the cumulative sediment yield of the UAGSS was greater than that of the URGSS. However, in the later stages of the runoff generation, the cumulative sediment yield of URGSS gradually surpassed that of the UAGSS. Furthermore, it was observed that the higher the rock fragment content, the earlier the exceedance occurred. This indicates that the rock fragment content had a greater impact on the erosion capacity of the rill on URGSS compared to the UAGSS. Overall, the cumulative sediment yield of the URGSS was approximately 20% higher than that of the UAGSS. On the other hand, the cumulative sediment yield of CAGSS increased slowly and steadily over time, although it remained significantly lower than that of UAGSS. Additionally, it was observed that the rock fragment content slightly impacted on the cumulative sediment yield of the CAGSS (Figure 14).

4. Discussion

The overall infiltration rate of the slope decreased with the increase in the rock fragment cover, which can be attributed to the lower permeability of rock fragment compared to soil [36]. This was because the rounded gravel’s surface was smoother, being similar to an ellipsoid, and creating more infiltration paths for priority flow, which led to a more effortless water flow to enter the soil body and increased the overall permeability of the slope [53]. As a result, the URGSS had a later initial runoff time and a lower runoff rate compared to the UAGSS. Moreover, angular gravels had more angular corners, uneven surfaces, and greater roughness than rounded gravels, which blocked runoff and increased the runoff curvature. When angular gravels exist in the rill bed, they increase the tortuosity of runoff [54], causing the flow of runoff to impede and the kinetic energy of runoff to consume more. As a result, the flow velocity on the slope of the angular gravel was smaller, but the runoff rate and runoff depth were larger (Table 4), resulting in a higher runoff shear stress and runoff power on the angular gravel soil slope. Because rill erosion occurred only when the runoff reached a certain magnitude, it occurred earlier on the UAGSS than on the URGSS. In the case of slopes with soil, cohesion rapidly reduced the soil infiltration capacity, so the CAGSS had an earlier initial runoff time and a higher runoff rate. The fixed soil grain of CAGSS improved its soil shear strength, which made it less susceptible to runoff erosion [55], resulting in a much lower sediment yield than the UAGSS.
The change in sediment yield over time was mainly determined using the development law of rainfall erosion. During the early rainfall stage, the slope’s thin-layer water flow carried away the sediment generated by the raindrop splashes and floating soil. As the water flow gradually removed the loose soil, the thin-layer water flow of the slope mainly caused layered soil erosion, resulting in a gradual stabilization of sediment yield and an overall decreasing trend, particularly in raindrop splash and rill erosion [56,57]. Rill erosion gradually develops with the extension of rainfall time, and the thin-layer water flow of the slope transitions from surface water flow to linear water flow. This change in water flow enhances the erosion capacity, leading to the expansion and development of rills. As the thin-layer of water flowing between rills converges, the runoff in rills increases, leading to an increase in erosion and sediment-carrying forces [58,59,60,61,62,63]. The erosion development mode includes the source erosion at the trench head, shear erosion at the bottom of the rills, and the erosion and collapse of the side of the rill walls, resulting in a rapid increase in sediment yield. As the development pattern of rills becomes stable, the sediment yield decreases correspondingly.
Rock fragments in the topsoil exists in embedded and semiembedded states (as illustrated in Figure 7), which was consistent with the site situation (as shown in Figure 4). The increase in rock fragment content led to a greater surface roughness of the slope, resulting in a more significant diversion and obstruction effect of gravel on the water flow [64,65]. Thus, the slope flow velocity decreased to varying degrees. As the runoff shear stress was proportional to the runoff and runoff depth, the runoff rate and runoff depth increased with the increase in rock fragment content (Table 4). Consequently, the runoff shear stress gradually increased with the increase in rock fragment content. In addition, the embedded rock fragments created local turbulence, which caused erosion to develop on the eroded side of the rock fragment, significantly increasing sediment yield [37]. After the test, the macroscopic erosion characteristics of the slope surface revealed that the angular gravel surface was uneven, with greater roughness. It closely adhered to the soil and was more prone to form deep and wide rills during the erosion and development of rills. The number of rills was small. Conversely, the surface of the rounded gravel was smooth, with less close adherence to the soil. Its shape was more regular, with a larger radius of curvature and greater intensity of local turbulence generated from the water flow. Therefore, it was easier to transport the soil around the rounded gravel, forming a small annular groove centered on it, and spreading over the slope, resulting in a sharp increase in sediment yield.
The paper has primarily focused on examining the characteristics of soil erosion processes in relation to varying rock fragment shapes and soil cohesion. Examining The main objective was to conduct a preliminary exploration of the impact of rock fragment shapes and soil cohesion on runoff generation and sediment yield of steep cut slopes under heavy rainfall conditions. However, the mechanism of rock fragment shape and soil cohesion affected soil erosion in steep cut slope remains unclear. Further experimentation at different slopes and rainfall intensities would provide additional insights into the extent of the impact of rock fragment shape and soil cohesion on runoff and sediment responses under more complex conditions. These findings would be crucial in developing the soil erosion model or establishing a relationship that accurately quantifies soil erosion on cut slopes while accounting for the variability in rock fragment shapes and soil cohesion. In addition, field evaluations are warranted to determine the impact of rock fragment shapes and soil cohesion on soil erosion in the natural environment on a larger scale. The implementation of large-scale application methods would help eliminate the effect of particle size on soil erosion responses.

5. Conclusions

Based on field surveys conducted on road cut slopes in the Namcha Barwa region, this study performed a series of rainfall experiments to investigate the effects of rock fragment shape and soil cohesion on the hydrodynamic and sediment yield characteristics of steep soil cut slopes under high rainfall intensity. Several key findings from this investigation, which are outlined below:
  • The steep URGSS developed numerous small annular rills around rounded gravels under high rainfall intensity. In contrast, the UAGSS that was composed of angular gravels had fewer rills. However, the CAGSS was not eroded under high rainfall intensity, with only raindrop splash and erosion between rills occurring.
  • The average infiltration rate of the URGSS was higher than that of the UAGSS, resulting in less runoff generation and a significantly later initial runoff time. With increasing rock fragment content, the difference in initial runoff time gradually decreased. The average infiltration rate of the CAGSS was significantly lower than that of the UAGSS, which led to more runoff and a much earlier initial runoff time.
  • The slope flow modes belonged to laminar flow, and the flow patterns were ‘jet flow’. The runoff shear stress, runoff power, drag coefficient, and Reynolds number of the URGSS were smaller than those of the UAGSS, resulting in a smaller resistance coefficient. However, the Froude number and flow velocity was larger, resulting in stronger runoff erosion capacities. The runoff shear stress, runoff power, Reynolds number, Froude number, and flow velocity of the CAGSS were larger than the UAGSS, and the resistance coefficient was smaller.
  • Rill erosion occurred earlier on the UAGSS compared to the URGSS. However, a more rounded shape and a larger radius of curvature of the rounded gravel resulted in stronger erosion due to local turbulence. The sediment yield of the URGSS was approximately twice that of the UAGSS, and its cumulative sediment yield was about 20% higher than the UAGSS. On the other hand, the CAGSS exhibited strong cohesion, leading to significantly lower sediment yield and cumulative sediment yield compared to the UAGSS.

Author Contributions

All authors significantly contributed to the research. Conceptualization, J.L. (Jing Luo); data curation, J.L. (Junhao Li), Y.H. and S.S.; formal analysis, J.L. (Junhao Li) and P.Y.; funding acquisition, X.P. and S.S.; methodology, J.L. (Jing Luo) and J.L. (Junhao Li); resources, X.P.; software, Y.D. and P.Y.; supervision, X.P. and J.L. (Jing Luo); visualization, J.L. (Junhao Li), P.Y. and S.S.; writing—original draft, J.L. (Jing Luo), P.Y. and J.L. (Junhao Li); writing—review and editing, J.L. (Jing Luo) and X.P. All authors have read and agreed to the published version of the manuscript.

Funding

This research was funded by [National Natural Science Foundation of China] grant number [42107212] and [Natural Science Foundation of Sichuan Province] grant number [2022NSFSC1145].

Institutional Review Board Statement

Not applicable.

Informed Consent Statement

Not applicable.

Data Availability Statement

Data are available upon request from the corresponding author.

Acknowledgments

We gratefully acknowledge the Power China Chengdu Engineering Corporation Limited for their financial support to field investigation.

Conflicts of Interest

The authors declare no conflict of interest.

References

  1. Borrelli, P.; Robinson, D.A.; Panagos, P.; Lugato, E.; Yang, J.E.; Alewell, C.; Wuepper, D.; Montanarella, L.; Ballabio, C. Land Use and Climate Change Impacts on Global Soil Erosion by Water (2015–2070). Proc. Natl. Acad. Sci. USA 2020, 117, 21994–22001. [Google Scholar] [CrossRef] [PubMed]
  2. Xiong, M.; Sun, R.; Chen, L. Effects of Soil Conservation Techniques on Water Erosion Control: A Global Analysis. Sci. Total Environ. 2018, 645, 753–760. [Google Scholar] [CrossRef] [PubMed]
  3. Burg, D.; Malkinson, D.; Katriel, G.; Wittenberg, L. Modeling the Dynamics of Soil Erosion and Vegetative Control—Catastrophe and Hysteresis. Theor. Ecol. 2015, 8, 67–79. [Google Scholar] [CrossRef]
  4. Hoffmann, T.; Erkens, G.; Cohen, K.M.; Houben, P.; Seidel, J.; Dikau, R. Holocene Floodplain Sediment Storage and Hillslope Erosion within the Rhine Catchment. Holocene 2007, 17, 105–118. [Google Scholar] [CrossRef]
  5. Macklin, M.G.; Jones, A.F.; Lewin, J. River Response to Rapid Holocene Environmental Change: Evidence and Explanation in British Catchments. Quat. Sci. Rev. 2010, 29, 1555–1576. [Google Scholar] [CrossRef]
  6. Yang, X.; Sun, W.; Li, P.; Mu, X.; Gao, P.; Zhao, G. Reduced Sediment Transport in the Chinese Loess Plateau Due to Climate Change and Human Activities. Sci. Total Environ. 2018, 642, 591–600. [Google Scholar] [CrossRef]
  7. Mushi, C.A.; Ndomba, P.M.; Trigg, M.A.; Tshimanga, R.M.; Mtalo, F. Assessment of Basin-Scale Soil Erosion within the Congo River Basin: A Review. Catena 2019, 178, 64–76. [Google Scholar] [CrossRef]
  8. Wen, X.; Deng, X. Current Soil Erosion Assessment in the Loess Plateau of China: A Mini-Review. J. Clean. Prod. 2020, 276, 123091. [Google Scholar] [CrossRef]
  9. Borrelli, P.; Robinson, D.A.; Fleischer, L.R.; Lugato, E.; Ballabio, C.; Alewell, C.; Meusburger, K.; Modugno, S.; Schütt, B.; Ferro, V.; et al. An Assessment of the Global Impact of 21st Century Land Use Change on Soil Erosion. Nat. Commun. 2017, 8, 2013. [Google Scholar] [CrossRef] [Green Version]
  10. Luo, D.L.; Jin, H.J.; He, R.X.; Wang, X.F.; Muskett, R.R.; Marchenko, S.S.; Romanovsky, V.E. Characteristics of Water-Heat Exchanges and Inconsistent Surface Temperature Changes at an Elevational Permafrost Site on the Qinghai-Tibet Plateau. J. Geophys. Res. Atmos. 2018, 123, 10057–10075. [Google Scholar] [CrossRef]
  11. Wu, G.; Liu, Y.; He, B.; Bao, Q.; Duan, A.; Jin, F.F. Thermal Controls on the Asian Summer Monsoon. Sci. Rep. 2012, 2, 404. [Google Scholar] [CrossRef] [PubMed] [Green Version]
  12. Fu, B.; Ouyang, Z.; Shi, P.; Fan, J.; Wang, X.; Zheng, H.; Zhao, W.; Wu, F. Current Condition and Protection Strategies of Qinghai–Tibet Plateau Ecological Security Barrier. Sci. Bull. 2021, 36, 1298–1306. [Google Scholar]
  13. Xu, Q.; Jiao, J.Y.; Yan, Q.Q.; Chen, Y.L.; Zong, X.T.; Lin, H. Progress and prospects of road erosion research. Soil Wat. Conserv. Bull. 2021, 41, 257–367. (In Chinese) [Google Scholar]
  14. Assouline, S.; Ben-Hur, M. Effects of Rainfall Intensity and Slope Gradient on the Dynamics of Interrill Erosion during Soil Surface Sealing. Catena 2006, 66, 211–220. [Google Scholar] [CrossRef]
  15. Han, L.; Jiao, J.; Jia, Y.; Wang, N.; Lei, D.; Li, L. Seed Removal on Loess Slopes in Relation to Runoff and Sediment Yield. Catena 2011, 85, 12–21. [Google Scholar] [CrossRef]
  16. Donjadee, S.; Chinnarasri, C. Effects of Rainfall Intensity and Slope Gradient on the Application of Vetiver Grass Mulch in Soil and Water Conservation. Inter. J. Sediment Res. 2012, 27, 168–177. [Google Scholar] [CrossRef]
  17. Huang, J.; Wu, P.; Zhao, X. Effects of Rainfall Intensity, Underlying Surface and Slope Gradient on Soil Infiltration under Simulated Rainfall Experiments. Catena 2013, 104, 93–102. [Google Scholar] [CrossRef]
  18. Ziadat, F.M.; Taimeh, A.Y. Effect of rainfall intensity, slope, land use and antecedent soil moisture on soil erosion in an arid environment: Factors affecting soil erosion in an arid environment. Land Degrad. Dev. 2013, 24, 582–590. [Google Scholar] [CrossRef]
  19. Liu, Y.J.; Yang, J.; Hu, J.M.; Tang, C.J.; Zheng, H.J. Characteristics of the Surface–Subsurface Flow Generation and Sediment Yield to the Rainfall Regime and Land–Cover by Long–Term in-Situ Observation in the Red Soil Region, Southern China. J. Hydrol. 2016, 539, 457–467. [Google Scholar] [CrossRef]
  20. Ran, Q.; Su, D.; Li, P.; He, Z. Experimental Study of the Impact of Rainfall Characteristics on Runoff Generation and Soil Erosion. J. Hydrol. 2012, 424–425, 99–111. [Google Scholar] [CrossRef]
  21. Fox, D.M.; Bryan, R.B. The Relationship of Soil Loss by Interrill Erosion to Slope Gradient. Catena 2000, 38, 211–222. [Google Scholar] [CrossRef]
  22. Nord, G.; Esteves, M. The Effect of Soil Type, Meteorological Forcing and Slope Gradient on the Simulation of Internal Erosion Processes at the Local Scale. Hydrol. Process. 2010, 24, 1766–1780. [Google Scholar] [CrossRef]
  23. Jin, C.A. Theoretical Study on Critical Erosion Slope Gradient. Acta Geograph. Sin. 1995, 50, 234–239. [Google Scholar]
  24. Liu, Q.Q.; Singh, V.P. Effect of Microtopography, Slope Length and Gradient, and Vegetative Cover on Overland Flow through Simulation. J. Hydrol. Eng. 2004, 9, 375–382. [Google Scholar] [CrossRef] [Green Version]
  25. Zhang, G.; Liu, B.; Liu, G.; He, X.; Nearing, M.A. Detachment of Undisturbed Soil by Shallow Flow. Soil Sci. Soc. Am. J. 2003, 67, 713–719. [Google Scholar] [CrossRef]
  26. Valmis, S.; Dimoyiannis, D.; Danalatos, N.G. Assessing Interrill Erosion Rate from Soil Aggregate Instability Index, Rainfall Intensity and Slope Angle on Cultivated Soils in Central Greece. Soil Tillage Res. 2005, 80, 139–147. [Google Scholar] [CrossRef]
  27. Wang, G.; Barber, M.E.; Chen, S.; Wu, J.Q. SWAT Modeling with Uncertainty and Cluster Analyses of Tillage Impacts on Hy-drological Processes. Stoch. Environ. Res. Risk Assess. 2014, 28, 225–238. [Google Scholar] [CrossRef]
  28. Brakensiek, D.L.; Rawls, W.J. Soil Containing Rock Fragments: Effects on Infiltration. Catena 1994, 23, 99–110. [Google Scholar] [CrossRef]
  29. Poesen, J.; De Luna, E.; Franca, A.; Nachtergaele, J.; Govers, G. Concentrated Flow Erosion Rates as Affected by Rock Fragment Cover and Initial Soil Moisture Content. Catena 1999, 36, 315–329. [Google Scholar] [CrossRef]
  30. Cousin, I.; Nicoullaud, B.; Coutadeur, C. Influence of Rock Fragments on the Water Retention and Water Percolation in a Calcareous Soil. Catena 2003, 53, 97–114. [Google Scholar] [CrossRef]
  31. Van Wesemael, B.; Mulligan, M.; Poesen, J. Spatial Patterns of Soil Water Balance on Intensively Cultivated Hillslopes in a Semi-arid Environment: The Impact of Rock Fragments and Soil Thickness. Hydrol. Process. 2000, 14, 1811–1828. [Google Scholar] [CrossRef]
  32. Abrahamsen, P. Preferential Flow in Daisy 2D Concept and Model for Tile Drained Soil; Københavns Universitet: Copenhagen, Denmark, 2011. [Google Scholar]
  33. Van Wesemael, B.; Poesen, J.; Kosmas, C.S.; Danalatos, N.G.; Nachtergaele, J. Evaporation from Cultivated Soils Containing Rock Fragments. J. Hydrol. 1996, 182, 65–82. [Google Scholar] [CrossRef]
  34. Poesen, J.; Ingelmo-Sanchez, F.; Mucher, H. The Hydrological Response of Soil Surfaces to Rainfall as Affected by Cover and Position of Rock Fragments in the Top Layer. Earth Surf. Process. Landf. 1990, 15, 653–671. [Google Scholar] [CrossRef]
  35. Cerdà, A. Effects of Rock Fragment Cover on Soil Infiltration, Interrill Runoff and Erosion: Effects of Rock Fragments on Soil Erosion. Eur. J. Soil Sci. 2001, 52, 59–68. [Google Scholar] [CrossRef]
  36. Mandal, U.K.; Rao, K.V.; Mishra, P.K.; Vittal, K.P.R.; Sharma, K.L.; Narsimlu, B.; Venkanna, K. Soil Infiltration, Runoff and Sediment Yield from a Shallow Soil with Varied Stone Cover and Intensity of Rain. Eur. J. Soil Sci. 2005, 56, 435–443. [Google Scholar] [CrossRef]
  37. Rieke-Zapp, D.; Poesen, J.; Nearing, M.A. Effects of Rock Fragments Incorporated in the Soil Matrix on Concentrated Flow Hydraulics and Erosion. Earth Surf. Process. Landf. 2007, 32, 1063–1076. [Google Scholar] [CrossRef]
  38. Wang, X.; Li, Z.; Cai, C.; Shi, Z.; Xu, Q.; Fu, Z.; Guo, Z. Hydrological Response of Sloping Farmlands with Different Rock Fragment Covers in the Purple Soil Area of China. J. Hydrol. Eng. 2013, 18, 446–456. [Google Scholar] [CrossRef]
  39. Wang, X.; Li, Z.; Cai, C.; Shi, Z.; Xu, Q.; Fu, Z.; Guo, Z. Effects of Rock Fragment Cover on Hydrological Response and Soil Loss from Regosols in a Semi–Humid Environment in South–West China. Geomorphology 2012, 151–152, 234–242. [Google Scholar] [CrossRef]
  40. Katra, I.; Lavee, H.; Sarah, P. The Effect of Rock Fragment Size and Position on Topsoil Moisture on Arid and Semi–Arid Hillslopes. Catena 2008, 72, 49–55. [Google Scholar] [CrossRef]
  41. Ma, D.; Shao, M. Simulating Infiltration into Stony Soils with a Dual–Porosity Model. Eur. J. Soil Sci. 2008, 59, 950–959. [Google Scholar] [CrossRef]
  42. Ingelmo, F.; Cuadrado, S.; Ibanez, A.; Hernandez, J. Hydric Properties of Some Spanish Soils in Relation to Their Rock Fragment Content: Implications for Runoff and Vegetation. Catena 1994, 23, 73–85. [Google Scholar] [CrossRef]
  43. De Figueiredo, T.; Poesen, J. Effects of Surface Rock Fragment Characteristics on Interrill Runoff and Erosion of a Silty Loam Soil. Soil Tillage Res. 1998, 46, 81–95. [Google Scholar] [CrossRef]
  44. Lv, J.; Luo, H.; Xie, Y. Effects of Rock Fragment Content, Size and Cover on Soil Erosion Dynamics of Spoil Heaps through Multiple Rainfall Events. Catena 2019, 172, 179–189. [Google Scholar] [CrossRef]
  45. Krumbein, W.C. Measurement and Geological Significance of Shape and Roundness of Sedimentary Particles. J. Sediment. Res. 1941, 11, 64–72. [Google Scholar] [CrossRef]
  46. Krumbein, W.C.; Sloss, L.L. Stratigraphy and sedimentation. Soil Sci. 1951, 71, 401. [Google Scholar] [CrossRef]
  47. Seeger, M. Uncertainty of Factors Determining Runoff and Erosion Processes as Quantified by Rainfall Simulations. Catena 2007, 71, 56–67. [Google Scholar] [CrossRef]
  48. Polyakov, V.O.; Nearing, M.A. Sediment Transport in Rill Flow under Deposition and Detachment Conditions. Catena 2003, 51, 33–43. [Google Scholar] [CrossRef] [Green Version]
  49. Wu, S.; Wu, P.; Feng, H.; Merkley, G.P. Effects of Alfalfa Coverage on Runoff, Erosion and Hydraulic Characteristics of Overland Flow on Loess Slope Plots. Front. Environ. Sci. Engin. China 2011, 5, 76–83. [Google Scholar] [CrossRef]
  50. Huang, Y.; Chen, X.; Li, F.; Zhang, J.; Lei, T.; Li, J.; Chen, P.; Wang, X. Velocity of Water Flow along Saturated Loess Slopes under Erosion Effects. J. Hydrol. 2018, 561, 304–311. [Google Scholar] [CrossRef]
  51. Moldovan, M.; Tăut, I.; Rebrean, F.A.; Szilard, B.; Arion, I.D.; Dîrja, M. Determining the Anti–Erosion Efficiency of Forest Stands Installed on Degraded Land. Sustainability 2022, 14, 15727. [Google Scholar] [CrossRef]
  52. Martínez-Zavala, L.; Jordán, A. Effect of Rock Fragment Cover on Interrill Soil Erosion from Bare Soils in Western Andalusia, Spain. Soil Use Manag. 2008, 24, 108–117. [Google Scholar] [CrossRef]
  53. Peng, X.; Shi, D.; Jiang, D.; Wang, S.; Li, Y. Runoff Erosion Process on Different Underlying Surfaces from Disturbed Soils in the Three Gorges Reservoir Area, China. Catena 2014, 123, 215–224. [Google Scholar] [CrossRef]
  54. Vermang, J.; Norton, L.D.; Huang, C.; Cornelis, W.M.; da Silva, A.M.; Gabriels, D. Characterization of Soil Surface Roughness Effects on Runoff and Soil Erosion Rates under Simulated Rainfall. Soil Sci. Soc. Am. J. 2015, 79, 903–916. [Google Scholar] [CrossRef]
  55. Yang, Q.; Gao, H.; Han, Y.; Li, Z.; Lu, K. Evolution of the Relationship between Runoff and Sediment Transport during Flood Event in the Chabagou Watershed of the Loess Plateau. Sustainability 2022, 14, 11573. [Google Scholar] [CrossRef]
  56. Di Stefano, C.; Ferro, V.; Pampalone, V.; Sanzone, F. Field Investigation of Rill and Ephemeral Gully Erosion in the Sparacia Experimental Area, South Italy. Catena 2013, 101, 226–234. [Google Scholar] [CrossRef]
  57. Nearing, M.A.; Norton, L.D.; Bulgakov, D.A.; Larionov, G.A.; West, L.T.; Dontsova, K.M. Hydraulics and Erosion in Eroding Rills. Water Resour. Res. 1997, 33, 865–876. [Google Scholar] [CrossRef]
  58. Shen, H.; Zheng, F.; Wen, L.; Han, Y.; Hu, W. Impacts of Rainfall Intensity and Slope Gradient on Rill Erosion Processes at Loessial Hillslope. Soil Tillage Res. 2016, 155, 429–436. [Google Scholar] [CrossRef]
  59. Fang, H.; Sun, L.; Tang, Z. Effects of Rainfall and Slope on Runoff, Soil Erosion and Rill Development: An Experimental Study Using Two Loess Soil. Hydrol. Process. 2015, 29, 2649–2658. [Google Scholar] [CrossRef]
  60. Dunkerley, D. Rain Event Properties in Nature and in Rainfall Simulation Experiments: A Comparative Review with Recommendations for Increasingly Systematic Study and Reporting. Hydrol. Process. 2008, 22, 4415–4435. [Google Scholar] [CrossRef]
  61. Auerswald, K.; Fiener, P.; Dikau, R. Rates of Sheet and Rill Erosion in Germany–A Meta–Analysis. Geomorphology 2009, 111, 182–193. [Google Scholar] [CrossRef]
  62. Wirtz, S.; Seeger, M.; Ries, J.B. Field Experiments for Understanding and Quantification of Rill Erosion Processes. Catena 2012, 91, 21–34. [Google Scholar] [CrossRef]
  63. Shi, Z.H.; Fang, N.F.; Wu, F.Z.; Wang, L.; Yue, B.J.; Wu, G.L. Soil Erosion Processes and Sediment Sorting Associated with Transport Mechanisms on Steep Slopes. J. Hydrol. 2012, 454–455, 123–130. [Google Scholar] [CrossRef]
  64. Poesen, J.W.; Torri, D.; Bunte, K. Effects of Rock Fragments on Soil Erosion by Water at Different Spatial Scales: A Review. Catena 1994, 23, 141–166. [Google Scholar] [CrossRef]
  65. Cagnoli, B.; Romano, G.P. Effects of Flow Volume and Grain Size on Mobility of Dry Granular Flows of Angular Rock Fragments: A Functional Relationship of Scaling Parameters. Geophys. Res. 2012, 117, B02207. [Google Scholar] [CrossRef]
Figure 1. Spatial distribution of large cut slopes along the Pai-Mo road.
Sustainability 15 10841 g001
Figure 2. Topographic profile map along the Pai-Mo road.
Sustainability 15 10841 g002
Figure 3. The slope gradient of cut slopes along the Pai-Mo Road.
Sustainability 15 10841 g003
Figure 4. Material composition characteristics of alluvial deposits, moraine deposits, and colluvial deposits cut slopes along the Pai-Mo road.
Sustainability 15 10841 g004
Figure 5. Schematic diagram of artificial rainfall simulation device.
Sustainability 15 10841 g005
Figure 6. Runoff and sediment collection process. (a) sediment runoff collection; (b) weighing of sediment runoff; (c) sediment drying; (d) weighing of dry sediment.
Sustainability 15 10841 g006
Figure 7. Erosion characteristics with different rock fragment shapes and soil cohesion.
Sustainability 15 10841 g007
Figure 8. The infiltration rate with different rock fragment shapes and soil cohesion. (a) 30% rock fragment content; (b) 40% rock fragment content; (c) 50% rock fragment content.
Sustainability 15 10841 g008
Figure 9. Runoff rate with different rock fragment shapes and soil cohesion: (a) 30% rock fragment content; (b) 40% rock fragment content; (c) 50% rock fragment content.
Sustainability 15 10841 g009
Figure 10. Cumulative runoff rate with different rock fragment shapes and soil cohesion: (a) 30% rock fragment content; (b) 40% rock fragment content; (c) 50% rock fragment content.
Sustainability 15 10841 g010
Figure 11. Flow velocity with different rock fragment shapes and soil cohesion: (a) 30% rock fragment content; (b) 40% rock fragment content; (c) 50% rock fragment content.
Sustainability 15 10841 g011
Figure 12. Hydrodynamic parameters with different rock fragments shape and soil cohesion: (a) Flow velocity; (b) Runoff power; (c) Runoff shear stress.
Sustainability 15 10841 g012
Figure 13. Sediment yield with different rock fragments shape and soil cohesion: (a) 30% rock fragment content; (b) 40% rock fragment content; (c) 50% rock fragment content.
Sustainability 15 10841 g013
Figure 14. Cumulative sediment yield with different rock fragments shape and soil cohesion: (a) 30% rock fragment content; (b) 40% rock fragment content; (c) 50% rock fragment content.
Sustainability 15 10841 g014
Table 1. Distribution of large cut slopes along the Pai-Mo Road.
LocationQuantityPercentage (%)Altitude (m)Distance (km)H:V (%)
Pai Town–Duoxiongla Tunnel entrance2734.62942–36548.098.8
Duoxiongla Tunnel exit–Lage1316.73187–35953.7510.88
Lage–Hanmi33.82115–317417.705.98
Hanmi–Laohuzui Tunnel entrance1417.91671–21273.4213.33
Laohuzui Tunnel exit–Beibeng Village2126.9750–221013.8810.52
Table 2. Experimental design table.
Test NoMaterial Composition (Impacting Factors)Slope Gradient (°)Rainfall
Intensity (mm·h−1)
Rock Fragment Content (%)Rock Fragment RoundnessSoil Cohesion Condition
1–1#30RoundedUncemented50120
1–2#40
1–3#50
2–1#30AngularUncemented
2–2#40
2–3#50
3–1#30AngularCemented
3–2#40
3–3#50
Table 3. Runoff hydraulics characteristics with different rock fragments shape and soil cohesion.
Rock Fragment Content (%)The Specific Surface Area of Rock Fragments
before Rainfall (%)
The Specific Surface Area of Rock Fragments
after Rainfall (%)
UAGSSURGSSCAGSSUAGSSURGSSCAGSS
30242722414326
40293228505047
50373834676650
Table 4. Initial runoff time and average runoff rate with different rock fragment shapes and soil cohesion.
Rock Fragment Content (%)Initial Runoff Time (s)Average Runoff Rate (mm·min−1)
UAGSSURGSSCAGSSUAGSSURGSSCAGSS
30112155321.1231.1161.189
4099123201.3181.1581.403
5091109181.3481.1901.433
Table 5. Drag coefficient, Reynolds number, and Froude number with different rock fragment shapes and soil cohesion.
Rock Fragment Content/%   Drag   Coefficient   ( f )   Reynolds   Number   ( R e )   Froude   Number   ( F r )
UAGSSURGSSCAGSSUAGSSURGSSCAGSSUAGSSURGSSCAGSS
300.0260.0140.0266.4135.8527.3617.3219.8637.103
400.0330.0160.0337.5856.1058.5086.4619.4226.281
500.1400.0520.0457.6757.1918.8843.1525.1825.450
Disclaimer/Publisher’s Note: The statements, opinions and data contained in all publications are solely those of the individual author(s) and contributor(s) and not of MDPI and/or the editor(s). MDPI and/or the editor(s) disclaim responsibility for any injury to people or property resulting from any ideas, methods, instructions or products referred to in the content.

