Article

Impact of Urbanization on Eco-Efficiency of Tourism Destinations

1
Tourism College, Northwest Normal University, Lanzhou 730070, China
2
Institute of Geographic Sciences and Natural Resources Research, Chinese Academy of Sciences, Beijing 100101, China
*
Authors to whom correspondence should be addressed.
Sustainability 2023, 15(14), 10929; https://doi.org/10.3390/su151410929
Submission received: 15 May 2023 / Revised: 9 July 2023 / Accepted: 10 July 2023 / Published: 12 July 2023
(This article belongs to the Section Sustainable Urban and Rural Development)

Abstract

:
Under the dual background of climate change and post-epidemic economic recovery, the study of the eco-efficiency of tourism destinations in the process of urbanization is critical to promoting the green and healthy development of tourism. This paper selects tourism destinations in 30 provinces of China in 2000–2019 as the research object, calculates the economic efficiency and eco-efficiency of China’s tourism destinations by constructing the Super-SBM (Slacks-Based Measure) model and visualizes the spatial distribution pattern and evolution trend of economic efficiency and eco-efficiency of China’s tourism destinations through spatial hotspot and center of gravity analysis. The coupling model is used to find the coupling relationship between the efficiency of China’s tourism destinations (economic efficiency and eco-efficiency) and urbanization. Finally, Tobit panel regression is used to find out how urbanization affects the eco-efficiency of tourism destinations. The results show that: (1) the eco-efficiency of tourism destinations in China is higher than the economic efficiency, as well as showing a downward trend. (2) The economic efficiency of tourism destinations in western China has increased while the eco-efficiency has declined. (3) China’s tourism destinations are undergoing the process of transformation and restructuring, and have not yet reached the decoupling standard. (4) On the whole, the improvement in urbanization is conducive to promoting the economic and environmentally sustainable development of tourism destinations. The main driving indicators are the living standards for urban residents, urban resources and environment, the industrial structure, and the role of the government. This study attempts to find a balance between the economic benefits and ecological impacts of tourism destinations and alleviate the real demand for the rapid economic recovery of tourism destinations in the post-epidemic era and the tension between human activities and the ecological environment. The research results are expected to provide a path for the healthy development of tourism destinations in the process of China’s new urbanization and provide a reference for tourism destinations in developing countries similar to China.

1. Introduction

Tourism is particularly important in achieving all 17 Sustainable Development Goals, specifically those on no poverty (SDGs1), decent work and economic growth (SDGs8) [1]. Every year, hundreds of millions of tourists participate in international and domestic travel, which is a global industry [2]. However, since the 20th century, climate change, mainly caused by carbon emissions, has attracted global attention [3]. Tourism is an environmentally dependent sector and the relationship is a fluid and changing one [4]. Research has found that the carbon emissions of the tourism industry account for 8% of global gas emissions, and this proportion will be even larger in the future. Specifically, the emissions increased from 3.9 to 4.5 GtCO2e, and the global carbon footprint was four times the previous estimate [5]. The government and businesses have realized that tourism development and activity as ‘business-as-usual’ are not sustainable for the environment, or for future economic development [4]. In addition, tourism destinations are a cluster of products and services, activities and experiences on the tourism value chain, which is a physical space and a fundamental unit of tourism analysis [6]. In the post-pandemic era, tourism destinations are entering a period of urgent economic growth [7]. The number of Chinese tourists during the Spring Festival holiday in 2023 was 308 million, a year-on-year increase of 23.1% [8]. It can be seen that tourism has been remarkable in its resilience to adverse economic events [4]. The rapid economic benefits of Chinese tourism destinations have prompted us to pay attention to their ecological issues, such as resource plunder and excessive tourism loads that have occurred before [9]. Due to fierce competition among tourism destinations, it is necessary to ‘stand out from the crowd’ in terms of economy and ecology [10]. This requires us to quickly find tools to balance the economy and ecology of tourism destinations. So, under this dual background, it is important to study the driving factors of the eco-efficiency of Chinese tourism destinations in the process of urbanization.
Tourism destinations have become the focus of attention and research for many countries and scholars, such as America [11], Thailand [12], Korea [13] and so on. The focus of attention mainly centers on the positive and negative impacts of ecological protection [14], negative environmental externality [15], positive economic and social externality [16], etc. The existing studies on the ecological problems of tourism destinations mainly focus on three aspects. The first is that resources are plundered in the development and operation of tourism destinations, and excessive environmental load poses a serious threat to the ecological environment [17], such as water pollution and water resource shortage [18], forest and vegetation destruction [19], soil pollution [20], climate change [21], etc. The second is the influencing factors that cause the ecological environment problems of tourism destinations [22], mainly including the construction of scenic facilities [23], social and economic factors [24], industrial structures [25], government environmental regulations [26], and tourist travel modes and behaviors [27]. The last is strategic research on the healthy development of tourism destinations [28], including establishing a digital model to optimize the indicator system of the sustainable development of tourism destinations [29], comparing the difference between the regional ecological footprint and the carrying capacity of tourism destinations to measure the degree of healthy development [30]. At present, some scholars have tried to find the balance between the economic benefits and ecological protection of tourism destinations from the various disciplines that are the study of eco-efficiency. For example, Xia Bing [31] has conducted a separate analysis of the eco-efficiency of tourism destinations when studying the tourism eco-efficiency of Gansu. However, research on the economic efficiency and eco-efficiency of tourism destinations caused by urbanization is still insufficient. To sum up, the existing research has made great efforts in the ecology of tourism destinations, which has greatly promoted research progress. The main consensus is as follows: firstly, there are indeed a large number of ecological and environmental issues in the pursuit of the maximum benefits for tourism destinations, but existing research has not revealed the extent and mechanism of their negative impact. Secondly, the development of tourism destinations is affected by the regional economy and various factors within those tourism destinations. Urbanization is an important factor affecting the eco-efficiency and economic efficiency of tourism destinations, but there is little research on how urbanization works and affects the economy and ecology of tourism destinations at present. Thirdly, in developing countries, there is little research on tourism destinations, although they are the focus of the tourism industry [32], and research on how to balance the economic benefits and ecological environment of tourism destinations still needs to be further explored. Therefore, for developing countries like China, it is an urgent issue to explore how to achieve economic growth in tourism destinations without affecting the ecological environment in the process of urbanization, which is of great significance for achieving sustainable economic and environmental development in China’s tourism destinations.
China is currently in a period of rapid urbanization development [33]. From the perspective of geography, urbanization refers to the transformation from non-urban areas to urban areas [34]. From the perspective of demography, urbanization refers to the continuous increase in the number of people living in urban areas [35]. From the perspective of the economy, urbanization represents the gradual transformation of agricultural activities into the upgrading of infrastructure and industry [36]. In 2014, China pointed out in the National New Urbanization Plan (2014–2020) that urbanization is an important driving force for economic development, has the greatest potential for domestic demand, and is an important consideration in terms of livelihood [37]. Urbanization has a significant impact on the ecological environment. Previous studies have shown that urbanization can not only improve the utilization rate of social resources [38] but also alleviate population pressure [39]. However, it inevitably leads to the excessive development of ecological resources [40], threatens biodiversity [41], and causes serious environmental pollution problems due to incomplete urban environmental infrastructure [42]. From this point of view, tourism destinations are closely related to the economy, environment, and urbanization [43]. A series of issues, such as how urbanization specifically works and affects the development of tourism destinations, and what is the impact mechanism of tourism destinations’ eco-efficiency, need to be further studied.
In the face of the existing knowledge gap, the research hypothesis and scientific questions of this paper are as follows.
Hypothesis 1.
The efficiency and spatial pattern of Chinese tourism destinations will inevitably change when they achieve a role transformation (from foreign reception to public consumption).
Hypothesis 2.
Urbanization will affect the eco-efficiency of tourism destinations through scale effects, technological effects, structural effects, environmental effects and government regulations.
This paper selects tourism destinations from 2000 to 2019 in China as the research object and calculates the efficiency (economic efficiency and eco-efficiency) by building a Super-SBM model, integrating the two major systems of economy and ecology. Through hotspot and center of gravity analysis, it visualizes the spatial and temporal distribution pattern and evolution track of the efficiency of China’s tourism destinations in 2000–2019. Through the coupling model, this paper reveals the coupling relationship between China’s urbanization and economic efficiency and eco-efficiency. Finally, tourism destinations are regarded as a complete ecological economic system. Through Tobit panel regression in econometrics, this paper studies the driving factors of China’s urbanization on the eco-efficiency of tourism destinations and the path of economic and environmentally sustainable development over a long time series. The innovation of this research is to regard tourism destinations as a complete eco-economic system that is no longer attached to the tourism industry and to study the economic elements and ecological elements of tourism destinations in the macro-region over a long period of time. The research results are expected to provide more targeted policy recommendations for the coordinated development of urbanization and tourism destinations in the process of China’s modernization and provide decision-making references for the green and healthy development of tourism destinations under the demand for global economic recovery.
The other parts of this article mainly include the following. Section 2 constructs the methodology, including the research objects and frameworks, methods and models, as well as the indicator system’s construction. Section 3 introduces the research results. Section 4 gives the conclusions and discussions. Section 5 introduces the implications and limitations.

2. Methodology

2.1. Research Object and Framework

2.1.1. Research Object

The object of this study is tourism destinations in China. Tourism destinations are all things that attract tourists to see and experience, including buildings and culture, as well as natural features, and attractions are primarily located (and drive visitation to) tourism destinations [2]. The development of tourism destinations in China has gone through a series of policy measures, from the Opinions of the State Council on Accelerating the Development of Tourism Industry in 2009 to the promulgation and implementation of the Tourism Law in 2013, and then to the proposal to ‘promote the reduction of ticket prices for key state-owned tourism destinations’ in 2018. It can be seen that tourism destinations have always been at the core of China’s tourism industry and have always been a focus of attention for the government and tourism authorities. After 2000, the development model of China’s tourism destinations gradually standardized [44]. Unlike vacation resorts in developed Western countries, Chinese tourism destinations are an important representative and carrier of tourism products and services [45]. And the projection of Chinese tourism destinations in geographical space shows the spatial attributes and interrelationships of tourism activities, mostly operated by the state or government [46]. Therefore, Chinese tourism destinations have particularity and typicality. In 2019, the COVID-19 epidemic fully broke out, which had a devastating impact on the development of tourism destinations, leading to the discontinuity of panel data. This research selects Chinese tourism destinations from 2000 to 2019 as the research object, and the research results aim to provide a ‘China plan’ for most developing countries in the process of urbanization. The distribution of tourism destinations in 2019 and the average number of tourism destinations from 2000 to 2019 are shown in Figure 1. It can be seen that the distribution of tourism destinations in China conforms to the population distribution characteristics of the Hu Huanyong Line. The Hu Huanyong Line is a population distribution line in China. The southeast of the line is a densely populated area, representing a higher level of urbanization, while the northwest is a sparsely populated area, representing a lower level of urbanization [47].

2.1.2. Framework

Based on research hypothesis 1, this paper conducted efficiency quantification and spatial analysis. Firstly, we calculated the carbon emissions of tourism destinations through the annual regional energy balance table and IPCC international standards. Secondly, the efficiency of tourism destinations in 30 provinces (excluding Tibet, Hong Kong, Taiwan and Macao) in China was quantified by constructing a Super-SBM model. Finally, the spatiotemporal distribution pattern and evolution trajectory of economic efficiency and eco-efficiency of Chinese tourism destinations were studied through hotspot and center of gravity analysis.
Based on research hypothesis 2, this paper conducted coupling analysis and regression analysis. Firstly, the coupling model was used to study the coupling relationship between urbanization and the efficiency of tourism destinations. Secondly, the Tobit panel regression method in econometrics was used to identify the influencing factors of urbanization on both the internal and external aspects of the tourism destinations system. Finally, based on the regression results, we proposed a green and healthy development path for tourism destinations in the process of urbanization.
The research framework is shown in Figure 2.

2.2. Methods and Models

2.2.1. Research Method

Hot spot analysis: Professor Getis and Professor Ord proposed the Getis Ord Gi* [48]. It is calculated for each factor area and compares the local sum of each factor and its adjacent factors with all factors, which is used to identify the clustering of cold spots (low value) and hot spots (high value) with statistical significance in the space [49]. The specific formula is expressed as follows:
G i * = j = 1 n φ i , j x j ( 1 n j = 1 n x j ) × j = 1 n φ i , j j = 1 n x j n ( 1 n j = 1 n x j ) 2 × n j = 1 n φ i , j 2 ( j = 1 n φ i , j ) 2 n 1
Among them, n is the number of elements, xj is the value of the jth element and G i * is the score of Z. The higher the Z value score is, the greater the clustering degree, in order to determine the aggregation degree of high and low values of economic efficiency and eco-efficiency in Chinese tourism destinations.
Center of gravity analysis: Center of gravity analysis originated from the concept of center of gravity in mechanics and was later introduced by scholars into the analysis of social sciences [50]. In the field of regional economics, the location of the center of gravity reflects the geographical center of the research object in the research area, and the movement track reflects the development trend of the research object, which can intuitively show the dynamic evolution process of the weighted center of gravity in the time dimension and spatial region [51]. The calculation formula is:
p i x i , y i = i = 1 n c e i x i i = 1 n c e i , i = 1 n c e i y i i = 1 n c e i
where p i x i , y i is the calculation result of center of gravity coordinates, c e i is the weight of regional points of all elements and x i and y i represents the horizontal and vertical coordinates of location i. This paper analyzes the migration trajectory of economic efficiency and eco-efficiency of tourism destinations through center of gravity analysis.
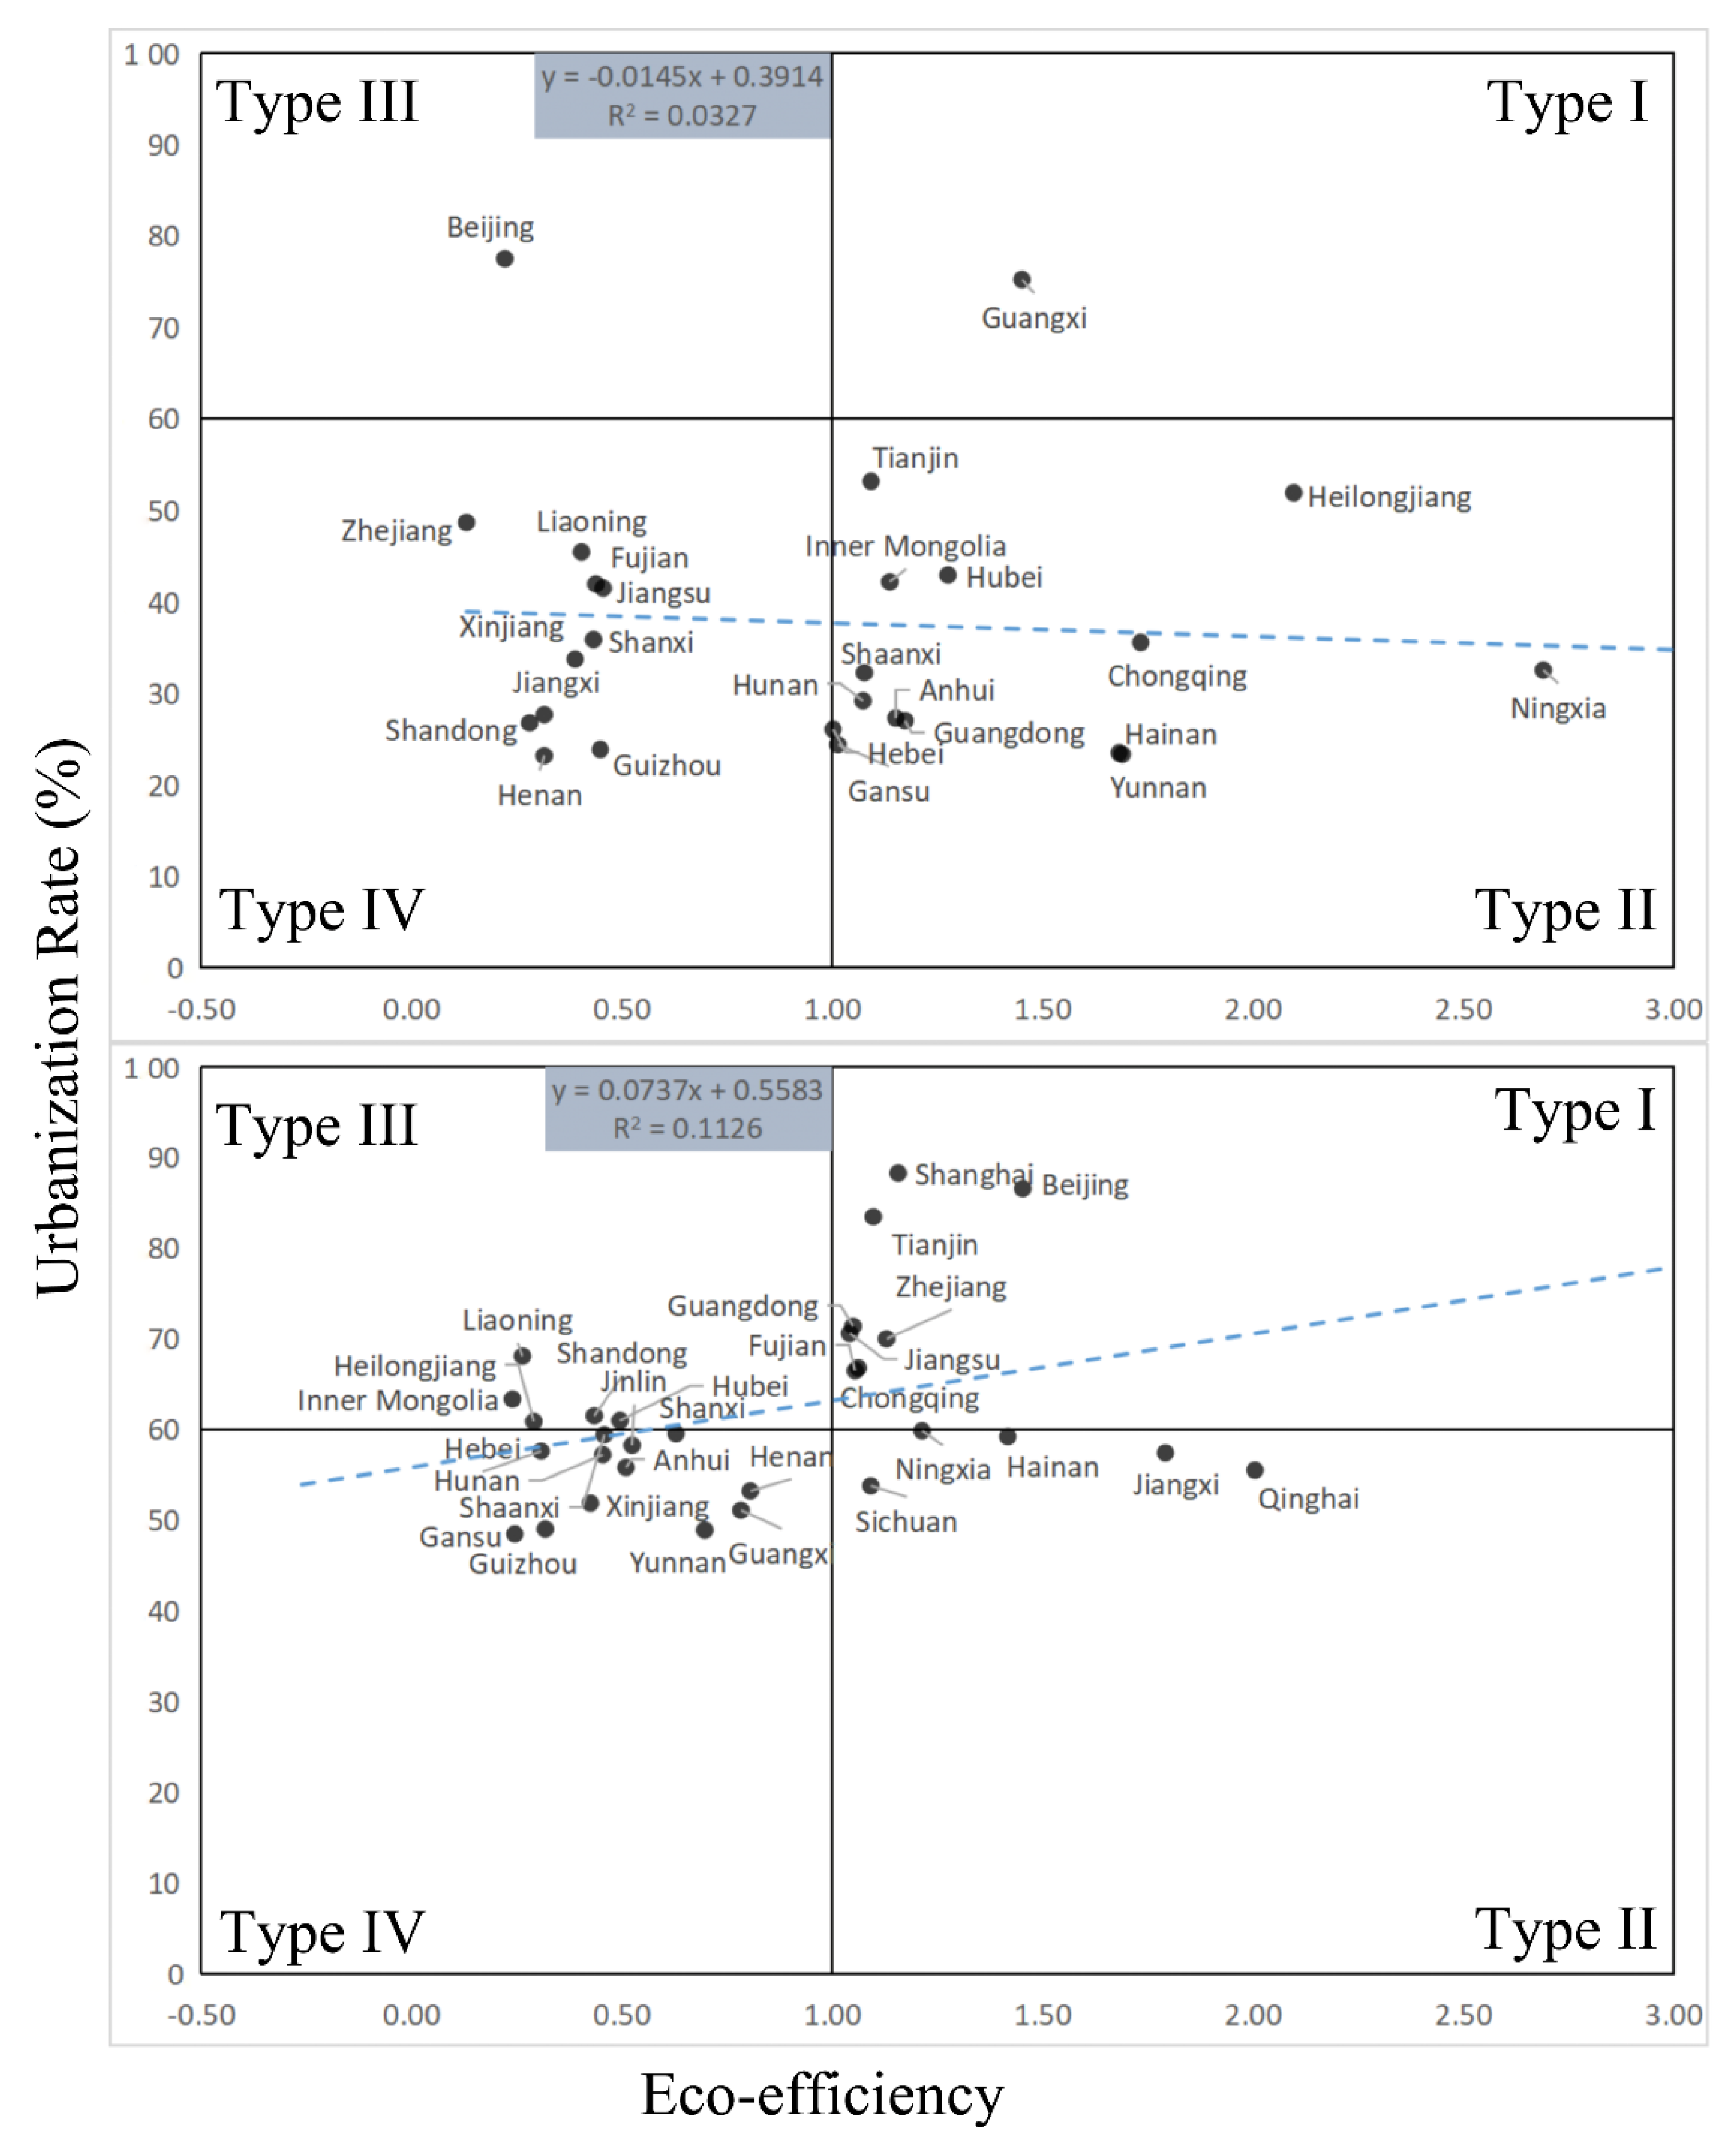
Coupling analysis: The degree of coupling represents the strength of the correlation and interaction between systems [52]. In recent years, coupling analysis has often been favored by economists for analyzing the interaction effects of multiple elements, industries and systems [53]. In this study, the urbanization (U) of Chinese tourist destinations in 2000 and 2019 was coupled with the economic efficiency (EE) and eco-efficiency (CE) of tourist destinations, respectively. Zheng defines more than 60% as high urbanization when classifying China’s urbanization [54]. Based on this, tourism destinations in China are divided into four types: type 1 is high-urbanization and high-efficiency (U > 0.6; EE, CE > 1), type 2 is low-urbanization and high-efficiency (U < 0.6; EE, CE > 1), type 3 is high-urbanization and low-efficiency (U > 0.6; EE, CE < 1) and type 4 is low-urbanization and low-efficiency (U < 0.6; EE, CE < 1).

2.2.2. Data Source

The annual Energy Balance Sheet by province, total energy amount and other energy consumption data used are derived from China Energy Statistical Yearbook [55]. The labor, number of tourism destinations and income are derived from China Tourism Statistical Yearbook [56]. Per Capita GDP, the urban population and the proportion of the tertiary industries are derived from China Statistical Yearbook [57]. Data on per capita daily domestic water consumption, number of beds in health institutions, urban green space, highway mileage and price index are derived from the National Bureau of Statistics of China [58]. Other sources of added value come from the China Environmental Statistics Yearbook [59]. The income is adjusted based on the Chinese consumer price index, with 2000 as the benchmark year.

2.2.3. Model

Super-SBM model: The SBM model solves the problem of input-output redundancy of the traditional DEA (Data Envelopment Analysis) model. However, the efficiency value calculated by this model is between 0 and 1. In practical applications, a large number of decision units are often 1, which brings difficulties in efficiency evaluation and weakens the significance of efficiency evaluation [60]. To avoid this phenomenon, Tone proposed a super-efficiency model based on the SBM model, allowing decision units greater than 1 and solving the problem of relaxation variables [61]. The formula is expressed as:
min ρ = 1 1 n i = 1 m s i x i k / 1 + 1 q 1 + q 2 r = 1 q 1 s r + y r k + r = 1 q 2 s t b y t k s . t .        x k = X λ + s ,   y k = Y λ s + ,   b k = b λ + s b λ 0 ,   s i 0 ,   s r + 0 ,   s t b 0
where ρ is the efficiency, which refers to economic efficiency and eco-efficiency, and xk and n are the input variable and number. yk and q1 are the output variable and number. bk and q2 are the undesired output variable and number. And ρ > 1 indicates that the decision-making unit is effective, while 0 < ρ < 1 indicates that the decision-making unit is relatively ineffective and requires improvement in input and output variables. We used the Formula (3) to calculate the efficiency of Chinese tourism destinations in 2000–2019.
Tobit regression model: The Super-SBM model above can measure the eco-efficiency of China’s tourism destinations, but further analysis is needed on which factors affect the eco-efficiency and how they specifically affect the tourism destinations system. Meanwhile, the lower limit of the efficiency value obtained by the super efficiency model is 0, which has truncation properties in data continuity. The Tobit model with maximum likelihood estimation can effectively solve the problem of data truncation, and strengthen the compatibility and stability of the model [62]. The Tobit model, also known as the constrained dependent variable model, the dependent variable is regressed under certain constraints. It was developed by James Tobin when studying the consumption of durable goods and is essentially an extension of the Probit regression model [63]. The regression model is as follows:
y i t * = α x i t + β T x i t + ε i t y i t = y i t * ,   y i t * 0 0 ,   y i t * 0   i = 1 , , N   a n d   t = 1 , , T ε i t ~ N 0 , σ 2
where y i t represents the explained variable, x i t represents the explanatory variable and ε i t represents the disturbance term. Use regression models to identify the influencing factors of urbanization on the eco-efficiency of tourism destinations in China.

2.3. Index System and Data Source

2.3.1. Economic Efficiency and Eco-Efficiency Index System of Tourism Destinations

At present, there is no unified standard for the index system of eco-efficiency and economic efficiency of tourism destinations at home and abroad [64]. According to the actual situation of the production and operation of the tourism destinations, combined with the Cobb Douglas production function, the indicator model for measuring the economic efficiency and eco-efficiency of tourism destinations is shown in Table 1.

2.3.2. Influencing Factor Index System

Assuming that China’s tourism destinations are a complete system, indicators that affect eco-efficiency within the system are called direct drivers, while indicators outside the system are called indirect drivers. In the first stage of regression, variables were selected according to the actual input-output process of tourism destinations and the second stage mainly discussed the impact of urbanization on the indicators. Therefore, we referred to the Evaluation Index System for New Urbanization and Quality Cities.
First stage regression: The internal eco-efficiency of tourism destinations is mainly influenced by the economic system, resource system, and environmental system [65]. The economic system mainly includes the income representing scale effects, the number of staff representing labor effects (Labor) and the investment representing capital effects. The environmental system includes garbage, wastewater emissions (ww), and CO2. The resource system includes water consumption (wu) and energy input (energy). The description of the first-stage regression variables is shown in Table 2.
To avoid one explanatory variable being linearly represented by other explanatory variables, namely the multicollinearity phenomenon, the variance inflation factor test can be used [66], as shown in Table 3. Generally speaking, 0 < VIF (Variance Inflation Factor) < 10 and 10 < VIF < 100, respectively, indicate that there is no multicollinearity and there is strong multicollinearity, while VIF > 100 indicates that there is serious multicollinearity [67]. As can be seen from Table 3, the maximum VIF was 4.91 and the average VIF was 3.01, which is less than 10. Therefore, there was no multicollinearity in the regression indicators, and regression analysis could be carried out.
Taking eco-efficiency as an example, the regression model expression of the first stage is:
E C = α 0 + α 1 l n I n c o m e + α 2 l n I n v e s t m e n t + α 3 C O 2 + α 4 L a b o r + α 5 E n e r g y + α 6 l n W a t e r u s e + α 7 l n W a s t e w a t e r + α 8 l n g a r b g e + ε i t
Second stage regression: The external drivers of the tourism destinations system are mainly analyzed from the economic and ecological environment. Economic factors include: urban population characteristics represented by population density (Popudensity), the proportion of the tertiary industry representing the industrial structure (Tertiary), social technology represented by technology market transaction volume (Techmarket), social security represented by the number of beds in health institutions (Beds), quality of life of urban residents represented by housing area (Housarea) and total postal-telecommunications business volume (Posts), the nationalization represented by the reception of international tourists (Tourists) and the government’s role (Govfinancial), represented by local fiscal expenditure [68]. The ecological environment elements include: the urban energy consumption represented by unit GDP energy consumption (GDPenergy) and SO2 energy consumption (GDPSO2), the urban resource environment represented by urban landscaping area (Landscaping) and per capita daily water consumption (PCWater) [69]. The specific indicator selection referred to the Chinese national standard New-type urbanization-Evaluation index system of quality city (GB/T 39497-2020) [70].
According to the regression results of the first stage, the indicators within the tourism destinations system that significantly affect the eco-efficiency are regarded as the explained variables of the second stage regression, and the regression analysis of three systems and five models is formed. The results of the second-stage regression multicollinearity test are shown in Table 4. All VIFs were less than 10, and the average VIF was 3.37, much less than 10. Through the multicollinearity test, the second-stage regression could be carried out.
Taking the income of tourism destinations as an explanatory variable in Model 1, for example, the regression model expression in the second stage is as follows:
l n L n c o m e = α 0 + α 1 l n P o p u d e n s i t y + α 2 T e r t i a r y + α 3 l n T e c h m a r k e t + α 4 B e d s + α 5 l n H o u s a r e a + α 6 l n P o s t s + α 7 G D P e n e r g y + α 8 G D P S O 2 + α 9 L a n d s c a p i n g + α 10 l n P C W a t e r + α 11 l n T o u r i s t s + α 12 l n G o v f i n a n c i a l + ε i t

3. Results

3.1. Overall Trend

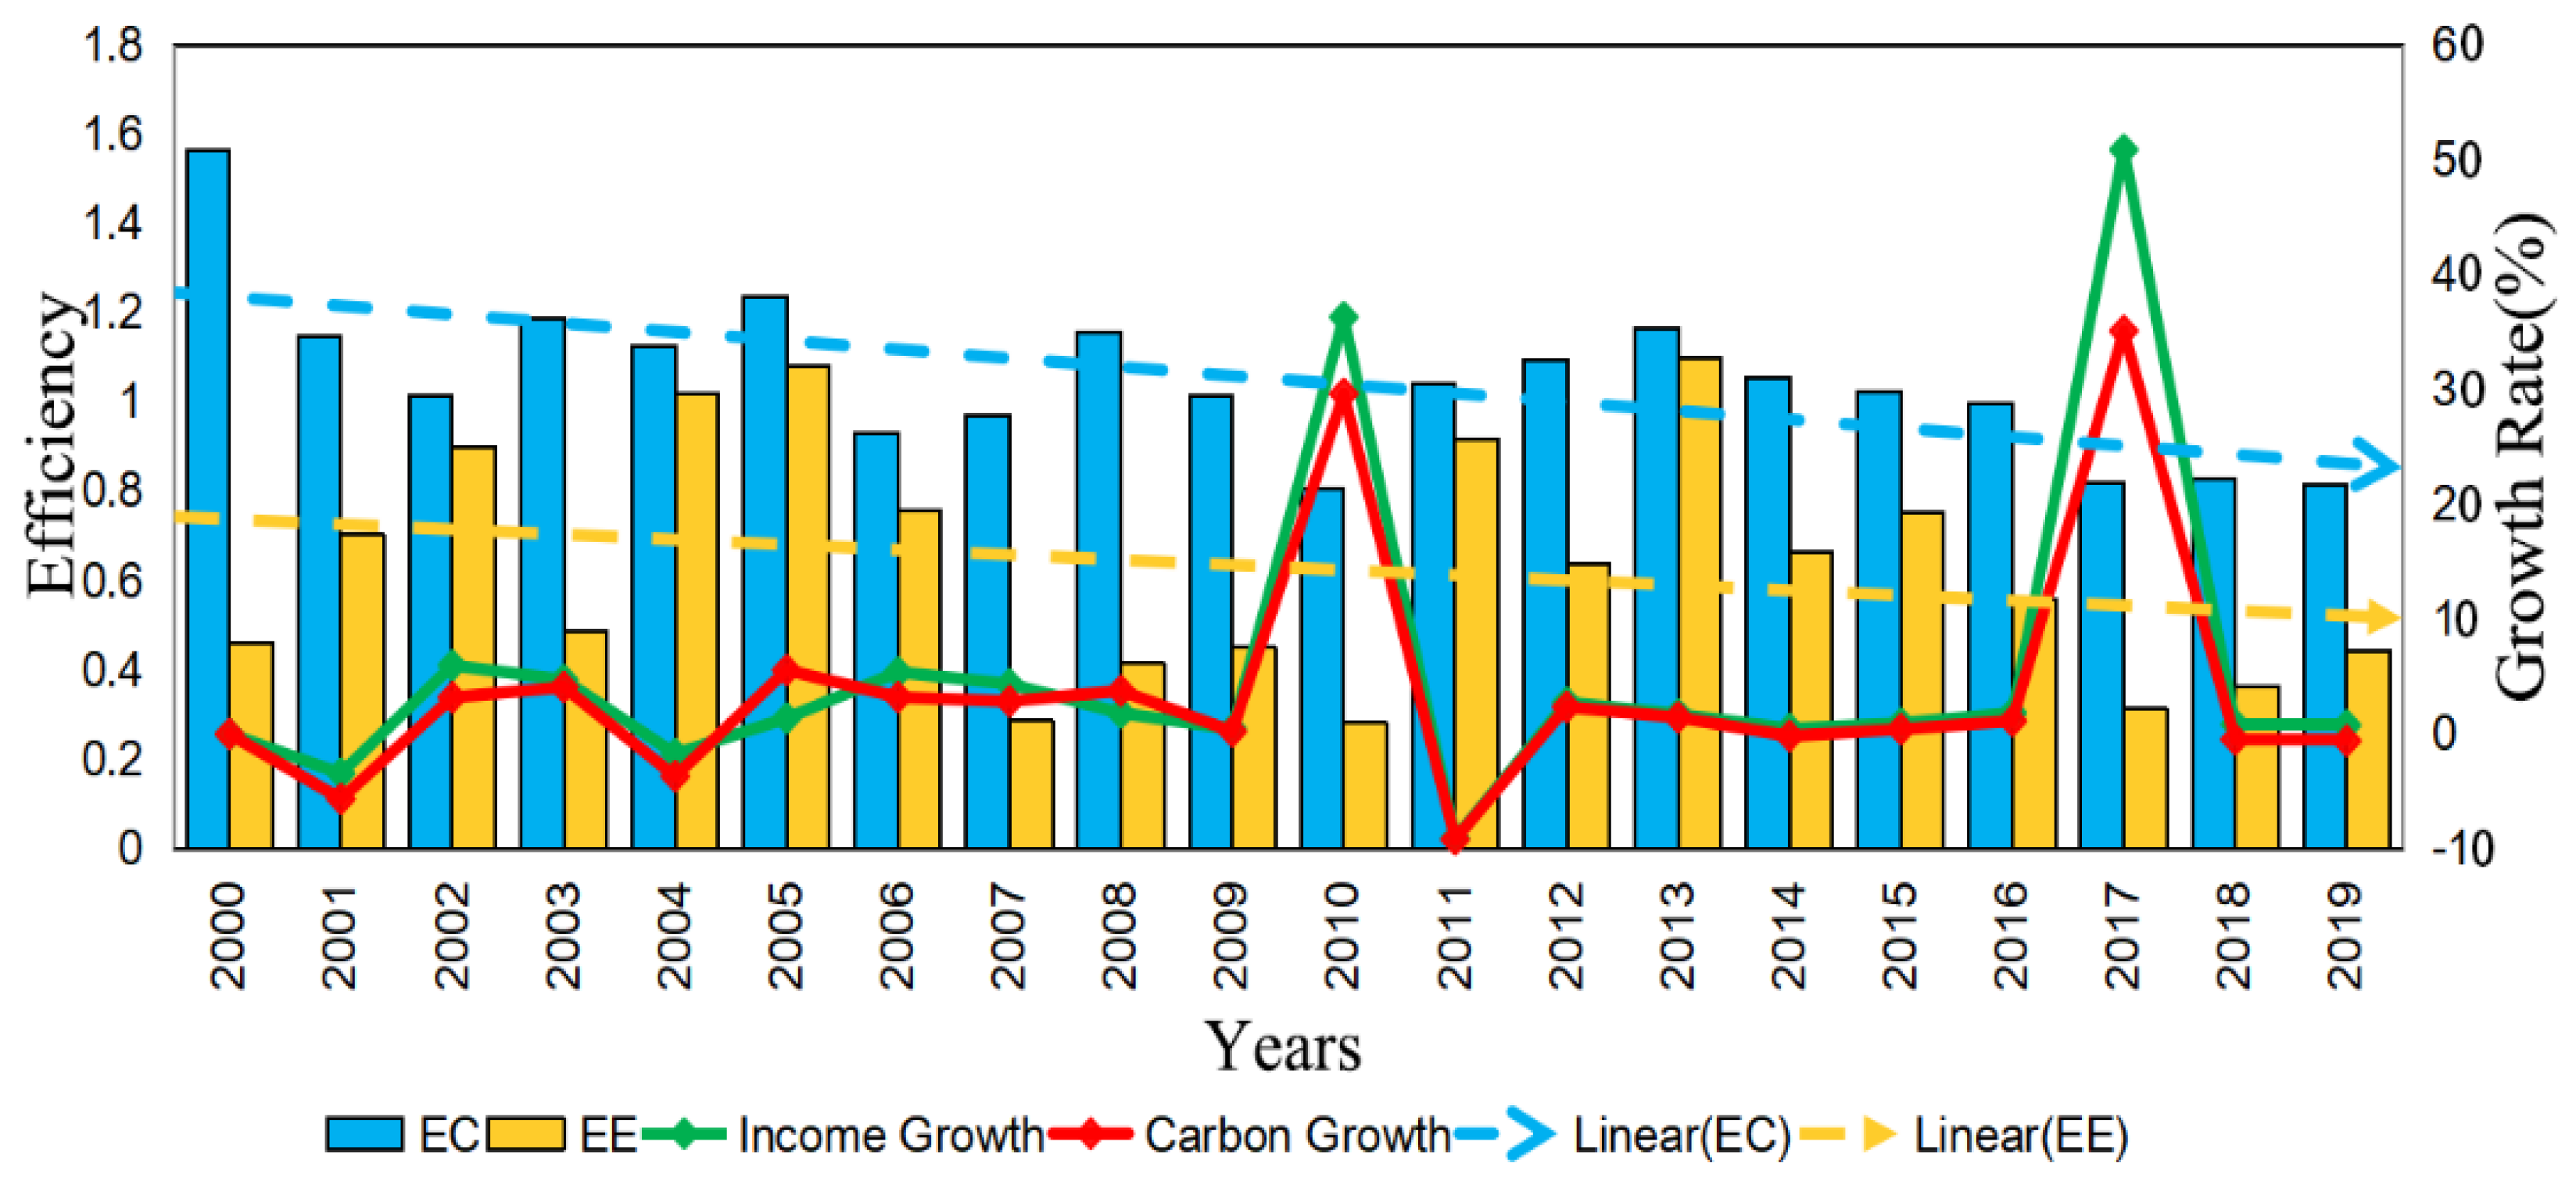
The income and carbon emissions of China’s tourism destinations have not yet met the decoupling standards. Figure 3 shows the value and trend of economic efficiency and eco-efficiency, growth rate of income and carbon emissions of Chinese tourist destinations from 2000 to 2019. From Figure 3, it can be seen that the growth rate of income in Chinese tourism destinations is highly consistent with the growth rate of carbon emissions, which is the same as the research results of the tourism industry. For example, when revealing the spatiotemporal differentiation of carbon emissions from regional tourism in China and its decoupling relationship with tourism economic growth, Xiong [71] found that carbon emissions are significantly increasing as income increases. When discussing the relationship between China’s tourism industry and carbon emissions, Zhang [72] found that the number of tourists and tourist income is positively correlated with tourism carbon emissions. In 1999, the standard for the classification and evaluation of the quality of tourism destinations was promulgated and implemented [73], in the following three years, the income and carbon emissions of China’s tourism destinations have shown positive growth. In 2010, the five southwestern provinces (Yunnan, Guizhou, Guangxi, Sichuan and Chongqing) of China suffered a severe drought that lasted for a long time [74], resulting in negative growth in overall income and carbon emissions of tourism destinations in 2011. From 2016 to 2017, online tourism platforms matured [75], and Chinese tourism destinations seized the opportunity to develop intelligent tourism destinations, resulting in a peak increase of 35.10% in tourism destinations’ income. The growth of carbon emissions means that, while minimizing the economic costs [21], measures should be taken for high-carbon activities in the tourism industry [4].
The eco-efficiency of Chinese tourism destinations was higher than the economic efficiency and showed a downward trend as shown in Figure 3. In terms of the eco-efficiency of tourism destinations, most tourism destinations relied on the ecological environment to develop, without large-scale development and excessive energy consumption in 2000. Therefore, the prospects for the eco-efficiency of tourism destinations were optimistic. In 2010, with the rapid growth of tourism destinations’ income and carbon emissions, eco-efficiency reached its lowest, indicating that China’s tourism destinations did not consider the negative impact on the ecological environment while vigorously developing the tourism destinations’ economy. According to previous research [76], environmental damage is irreversible and the tourism industry must follow the principle of sustainable development; economic development at the cost of sacrificing the environment will not last for too long.
The economic efficiency of tourism destinations in Figure 3 shows a fluctuating downward trend. In 2010, economic efficiency reached its lowest. The rapidly growing demand for tourism has led tourism destination operators to increase their investments without restraint. However, the economic benefits of tourism destinations are insufficient to compensate for the huge investment, resulting in a decrease in economic benefits. The economic benefits reached a peak in 2013, thanks to the mild recovery of China’s macro economy in 2013, the per capita tourism expenditure of urban residents reached a historic high, and the proportion of consumption in tourism destinations increased.

3.2. Spatial Distribution Pattern of Efficiency of Tourism Destinations

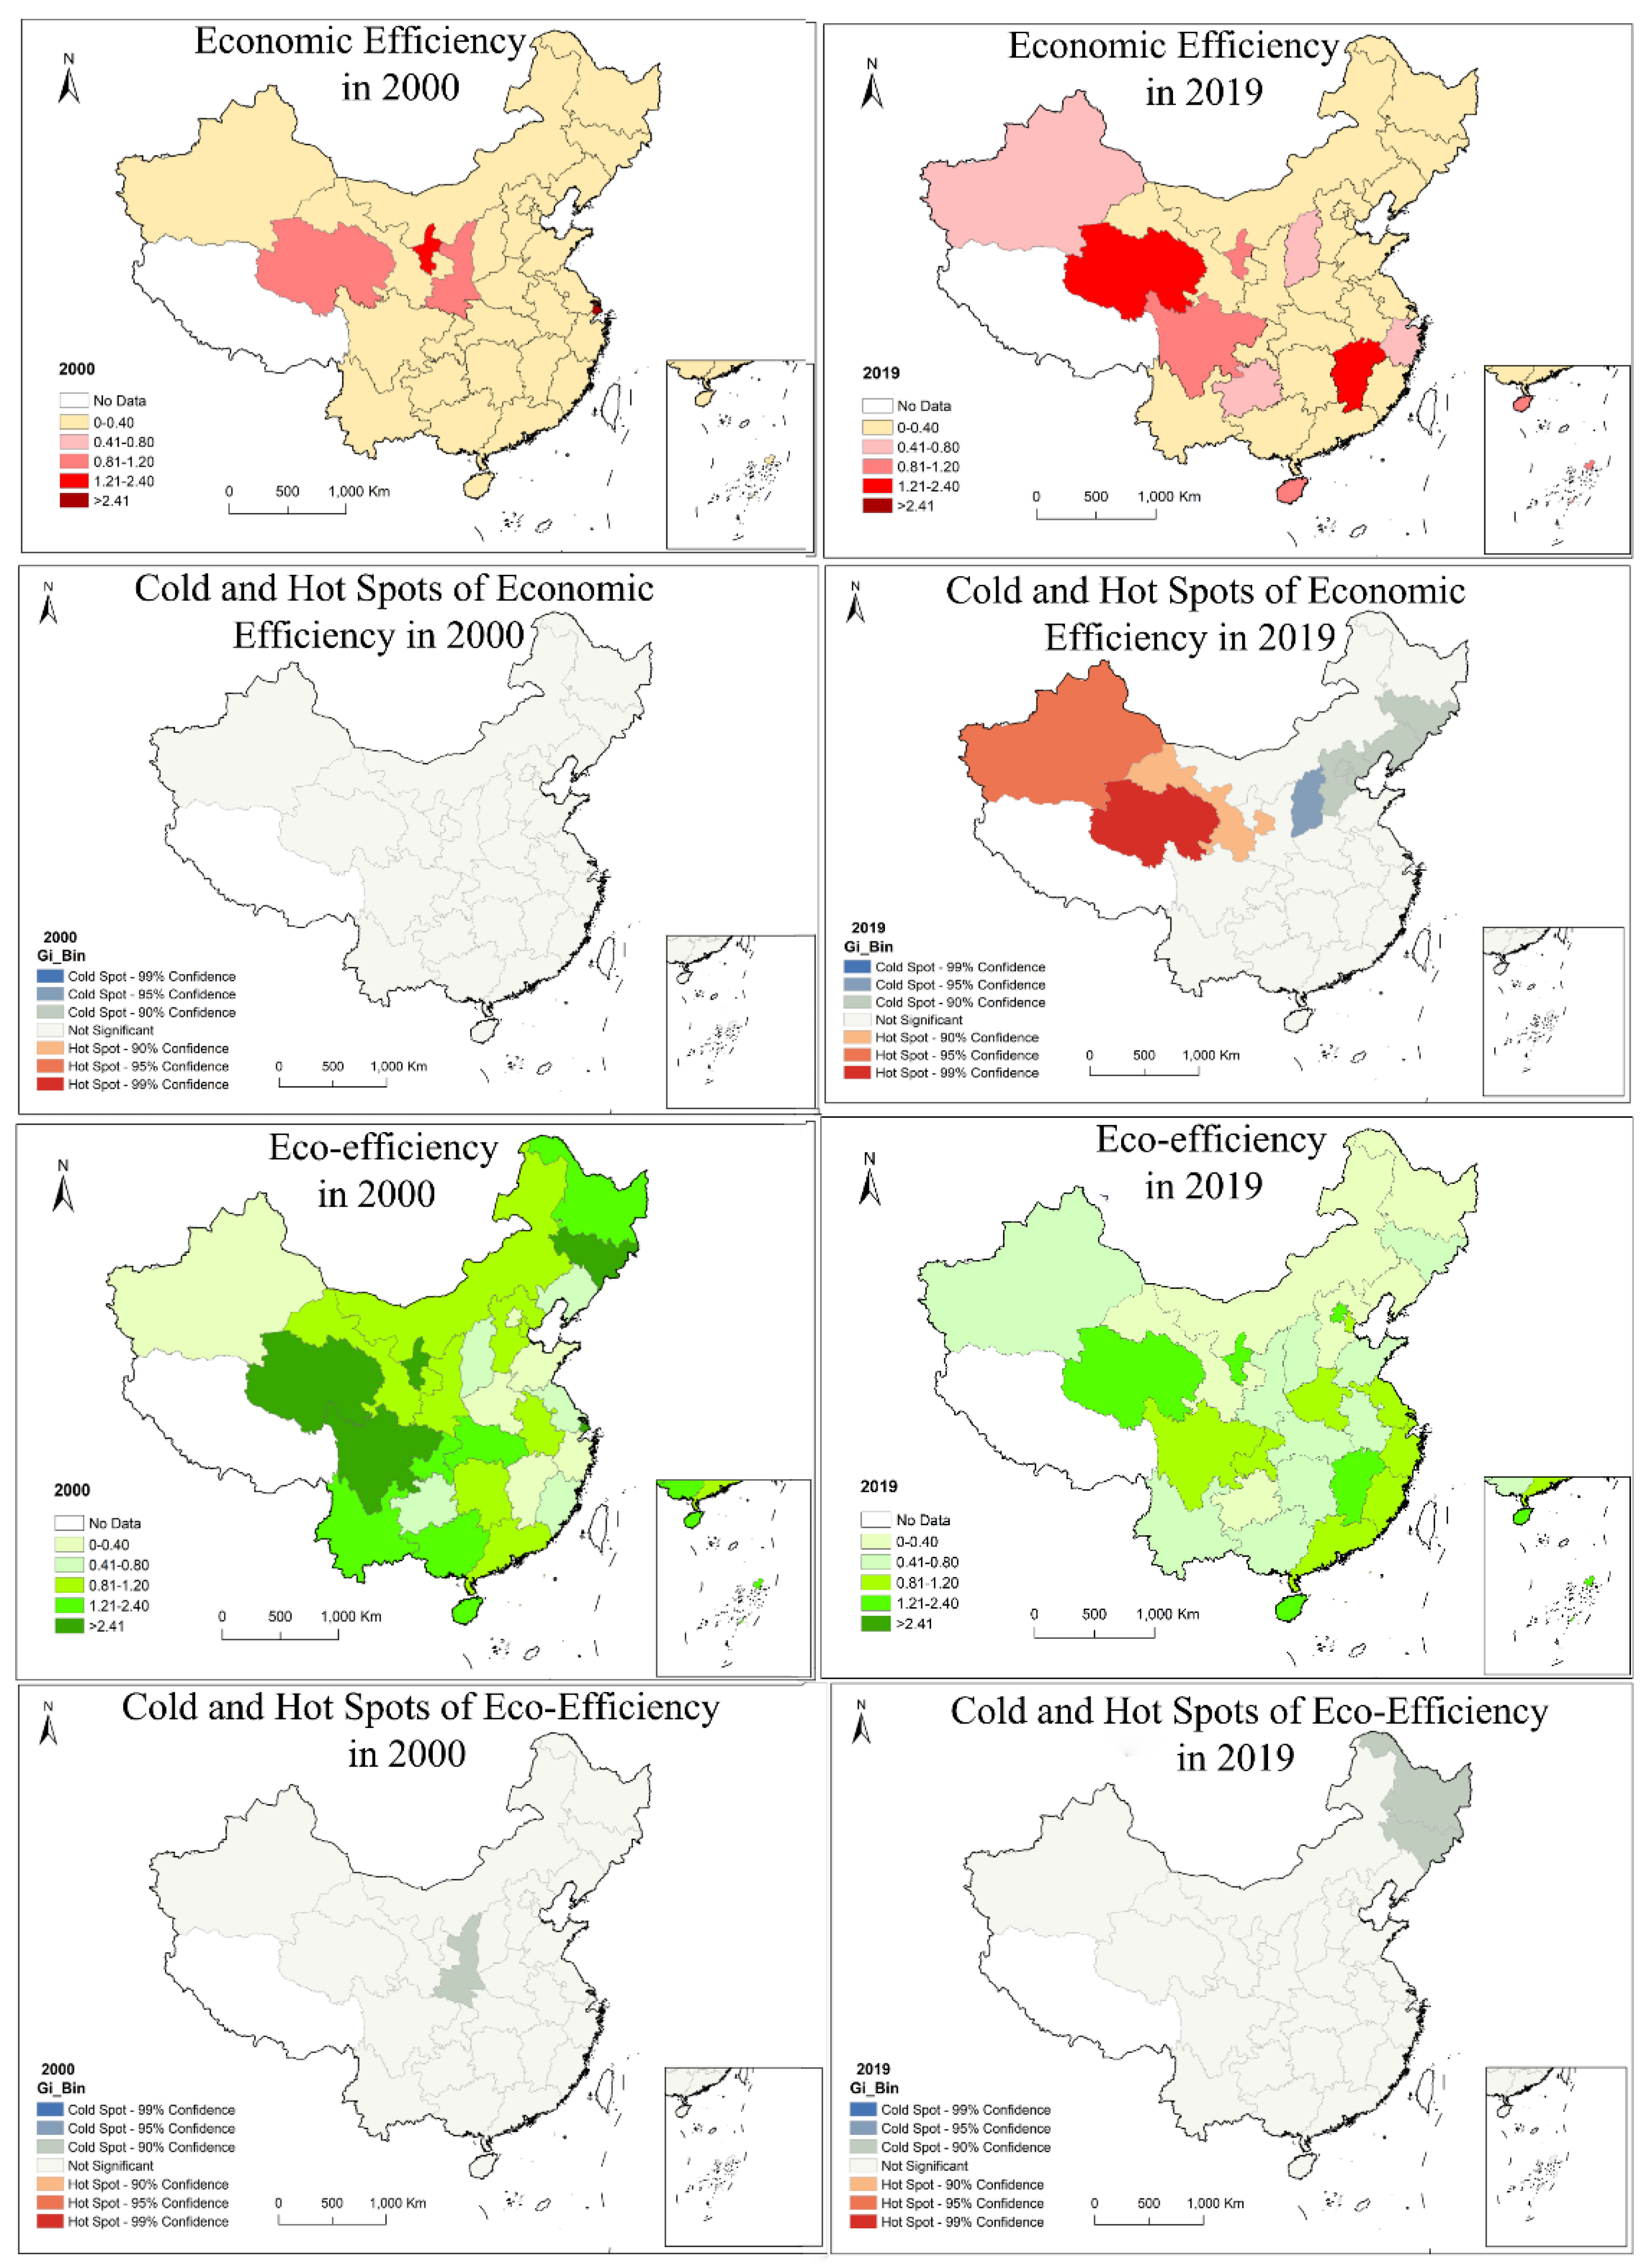
Figure 4 shows the spatial distribution of economic efficiency and eco-efficiency, as well as the distribution of cold and hot spots of Chinese tourist destinations in 2000 and 2019. It can be seen from Figure 4 that the high-efficiency areas (including economic efficiency and eco-efficiency) of China’s tourism destinations are concentrated in the northwest region represented by Qinghai and Ningxia provinces and the southeast region represented by Jiangxi province. The spatial pattern of eco-efficiency and economic efficiency of China’s tourism destinations is consistent, but the spatial agglomeration effect is not obvious. The western region is a high-efficiency zone, while the eastern and central regions are medium- and low-efficiency zones, respectively.
The economic efficiency of tourism destinations in western China has increased while the eco-efficiency has declined, as shown in Figure 4. Qinghai Province is the hot spot of eco-efficiency in China’s tourism destinations, benefiting from the rich tourism resources in the northwest [77]. The cold spot area is located in Shanxi Province, which is because the Beijing-Tianjin-Hebei region failed to coordinate a balanced relationship with the ecological environment while developing tourism destinations [78]. The cold and hot spots of economic efficiency in tourism destinations are not obvious, because there is no spillover effect in the space of economic efficiency.
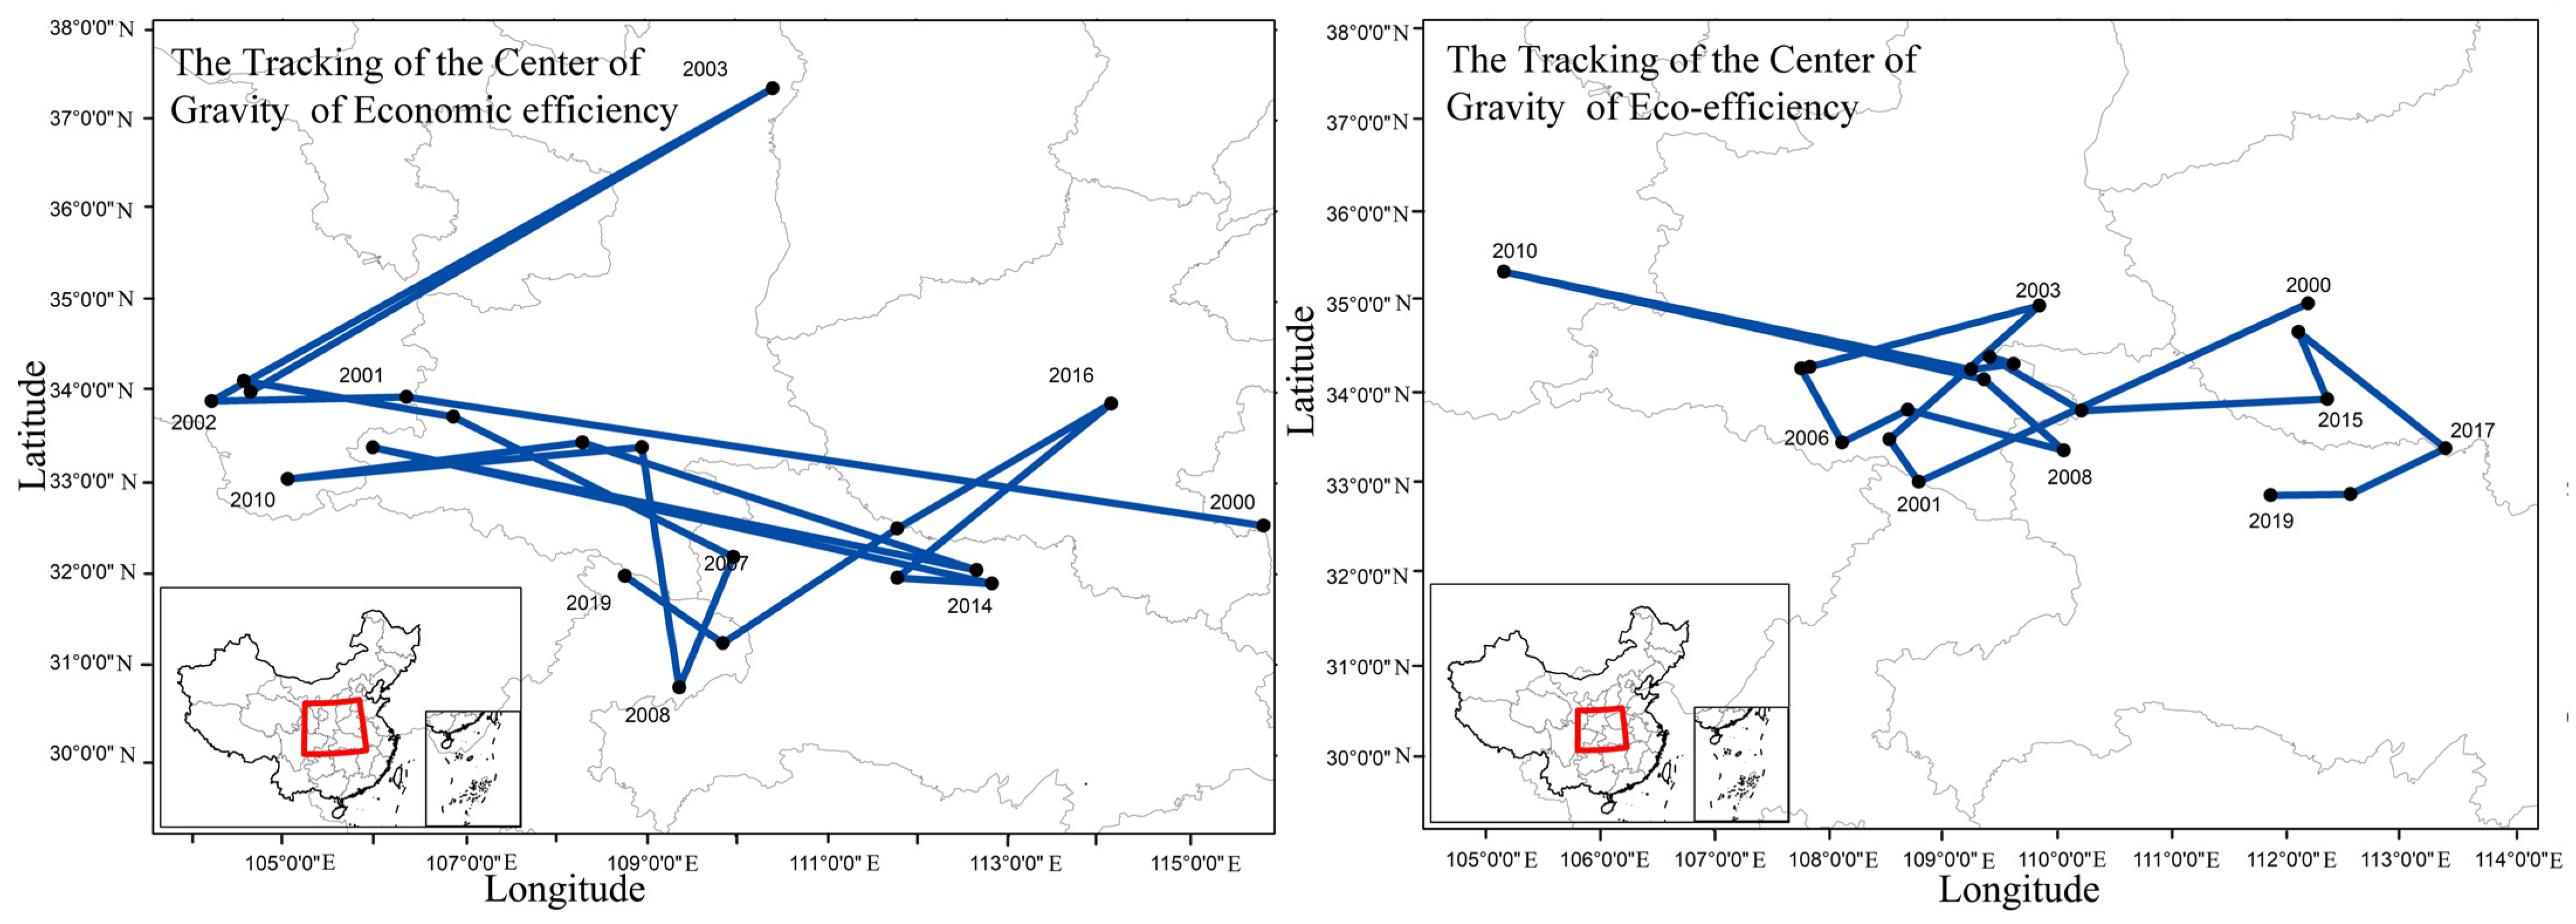
Figure 5 shows the tracking of the center of gravity of the economic efficiency and eco-efficiency of Chinese tourist destinations. The center of gravity of ecological and economic efficiency in Chinese tourism destinations has shifted from northwest to southeast. The center of gravity of the economic efficiency of China’s tourism destinations swings back and forth between the northwest and southeast, and finally inclines to the southeast, indicating that the regional economy has advantages for the development of tourism destinations. Because of the severe drought in five provinces in southwest China in 2010, the tractive force of fragile ecosystems on eco-efficiency dropped sharply, while the northwest region vigorously developed the reachability of tourism destinations, driving their economic benefits and moving the center of gravity of their eco-efficiency to the northwest. The overall movement trajectory of the eco-efficiency of tourism destinations has a greater east–west amplitude than a north–south amplitude. The center of gravity of eco-efficiency moves more between the east and west than between the north and south, which indicates that the north–south difference in the eco-efficiency of China’s tourism destinations is smaller than the east–west difference.

3.3. Coupling Analysis of Urbanization of Tourism Destinations with Economic Efficiency and Eco-Efficiency in China

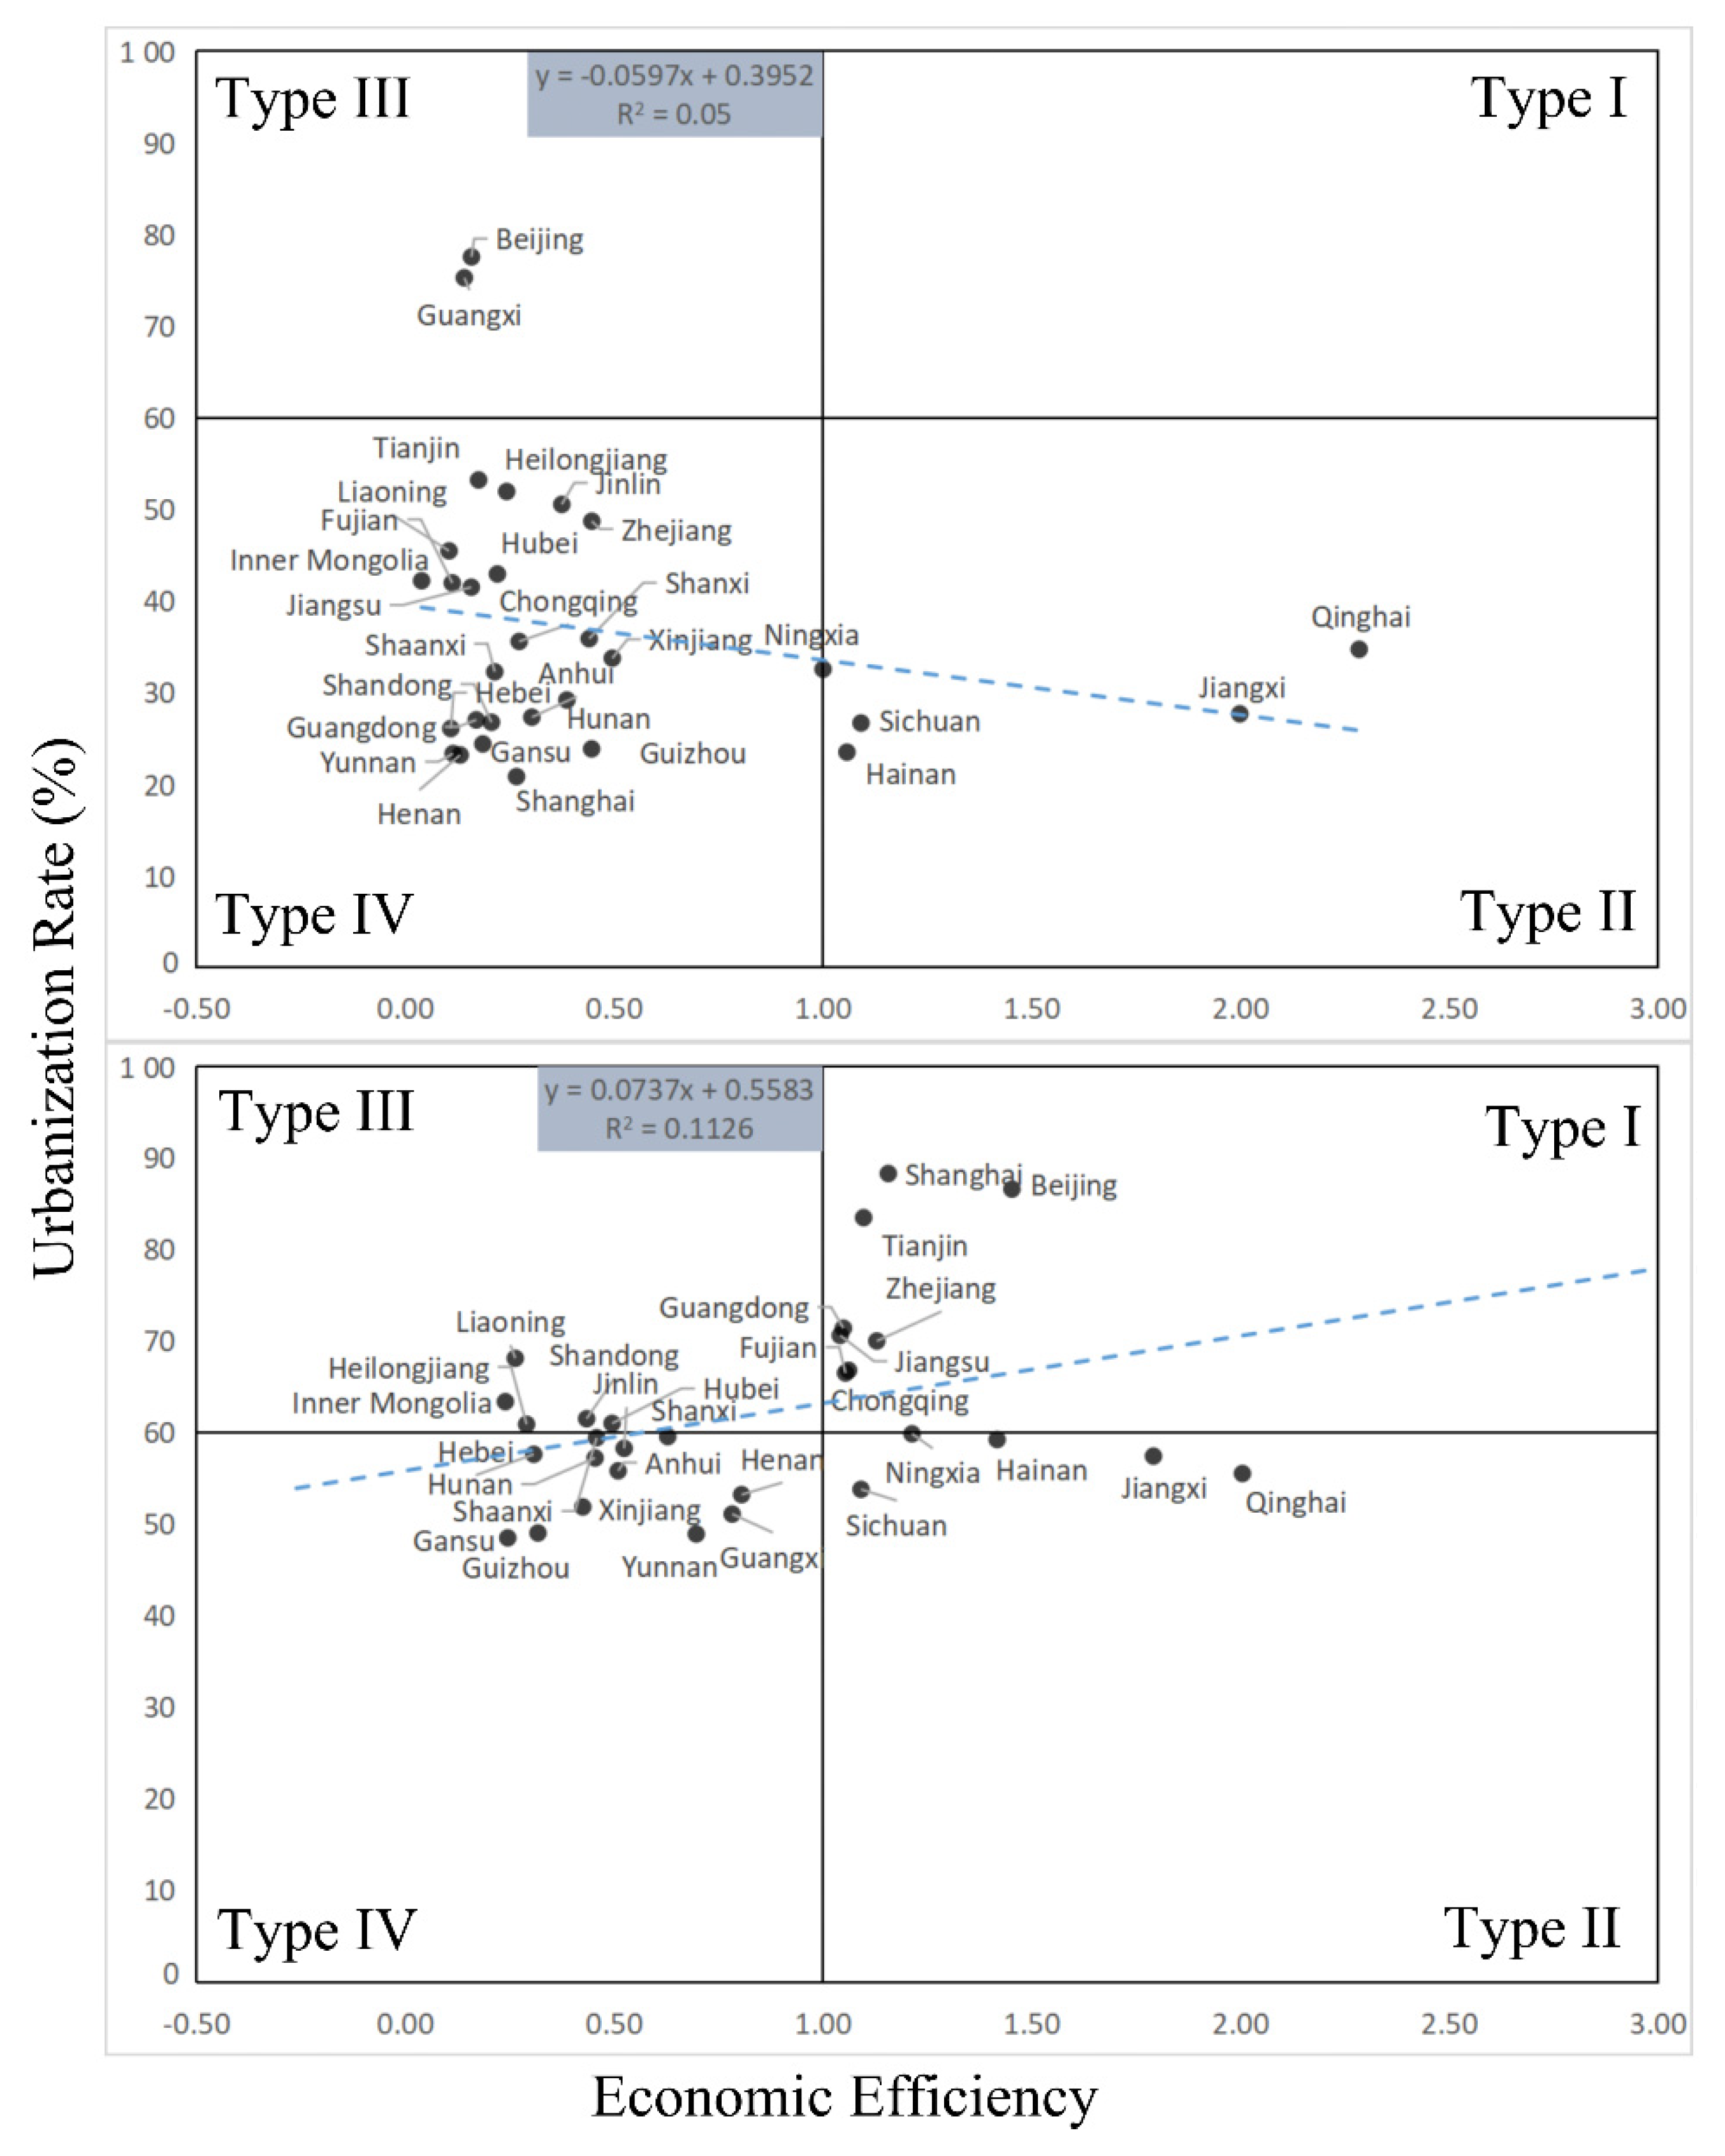
By coupling the urbanization of China in 2000 and 2019 with the economic efficiency and eco-efficiency of tourism destinations in Figure 6 and Figure 7, scatter analysis was conducted and linear correlations were found.
The efficiency of China’s tourism destinations (both economic efficiency and eco-efficiency) is expected to improve in the future. From 2000 to 2019, there was a significant improvement in urbanization in China, but this did not lead to an improvement in the economic efficiency of tourism destinations. This indicates that the development of tourism destinations has not caught up with the pace of urbanization on time, and there is a lag in the management structure and concept of the tourist attraction industry. In the overall coupling relationship, thanks to the development of urbanization in China, the number of provinces in the Type IV region has increased from 24 to 13. Ningxia is located at the junction of the four types. In the future, close attention should be paid to development trends, increasing the added value of tourism destinations’ income, controlling investment costs and improving economic efficiency.
Chinese tourism destinations have not yet reached the decoupling standard. The effect of urbanization on the eco-efficiency of Chinese tourism destinations has changed from a negative correlation in 2000 to a positive correlation in 2019, indicating that Chinese tourism destinations have undergone a rapid transformation process in the process of urbanization. In 2000, most tourism destinations in China’s provinces were classified as type II, indicating that, in the early 21st century, China’s urbanization development did not drive the eco-efficiency of tourism destinations. In 2019, most coastal cities entered type I zones, indicating the advanced management concepts and carbon reduction technologies of tourism destinations in developed cities in eastern China. This further indicates that cities with better economic development may first enter the latter half of the Kuznets curve.

3.4. Analysis of Driving Factors of Eco-Efficiency of Tourism Destinations in China

Tourism destinations often show different eco-efficiency at different times under the combined influence of multiple influencing factors [79]. This research regards Chinese tourism destinations as a complete system, identifying direct driving factors through first stage regression and indirect driving factors through second stage regression.

3.4.1. First-Stage Regression

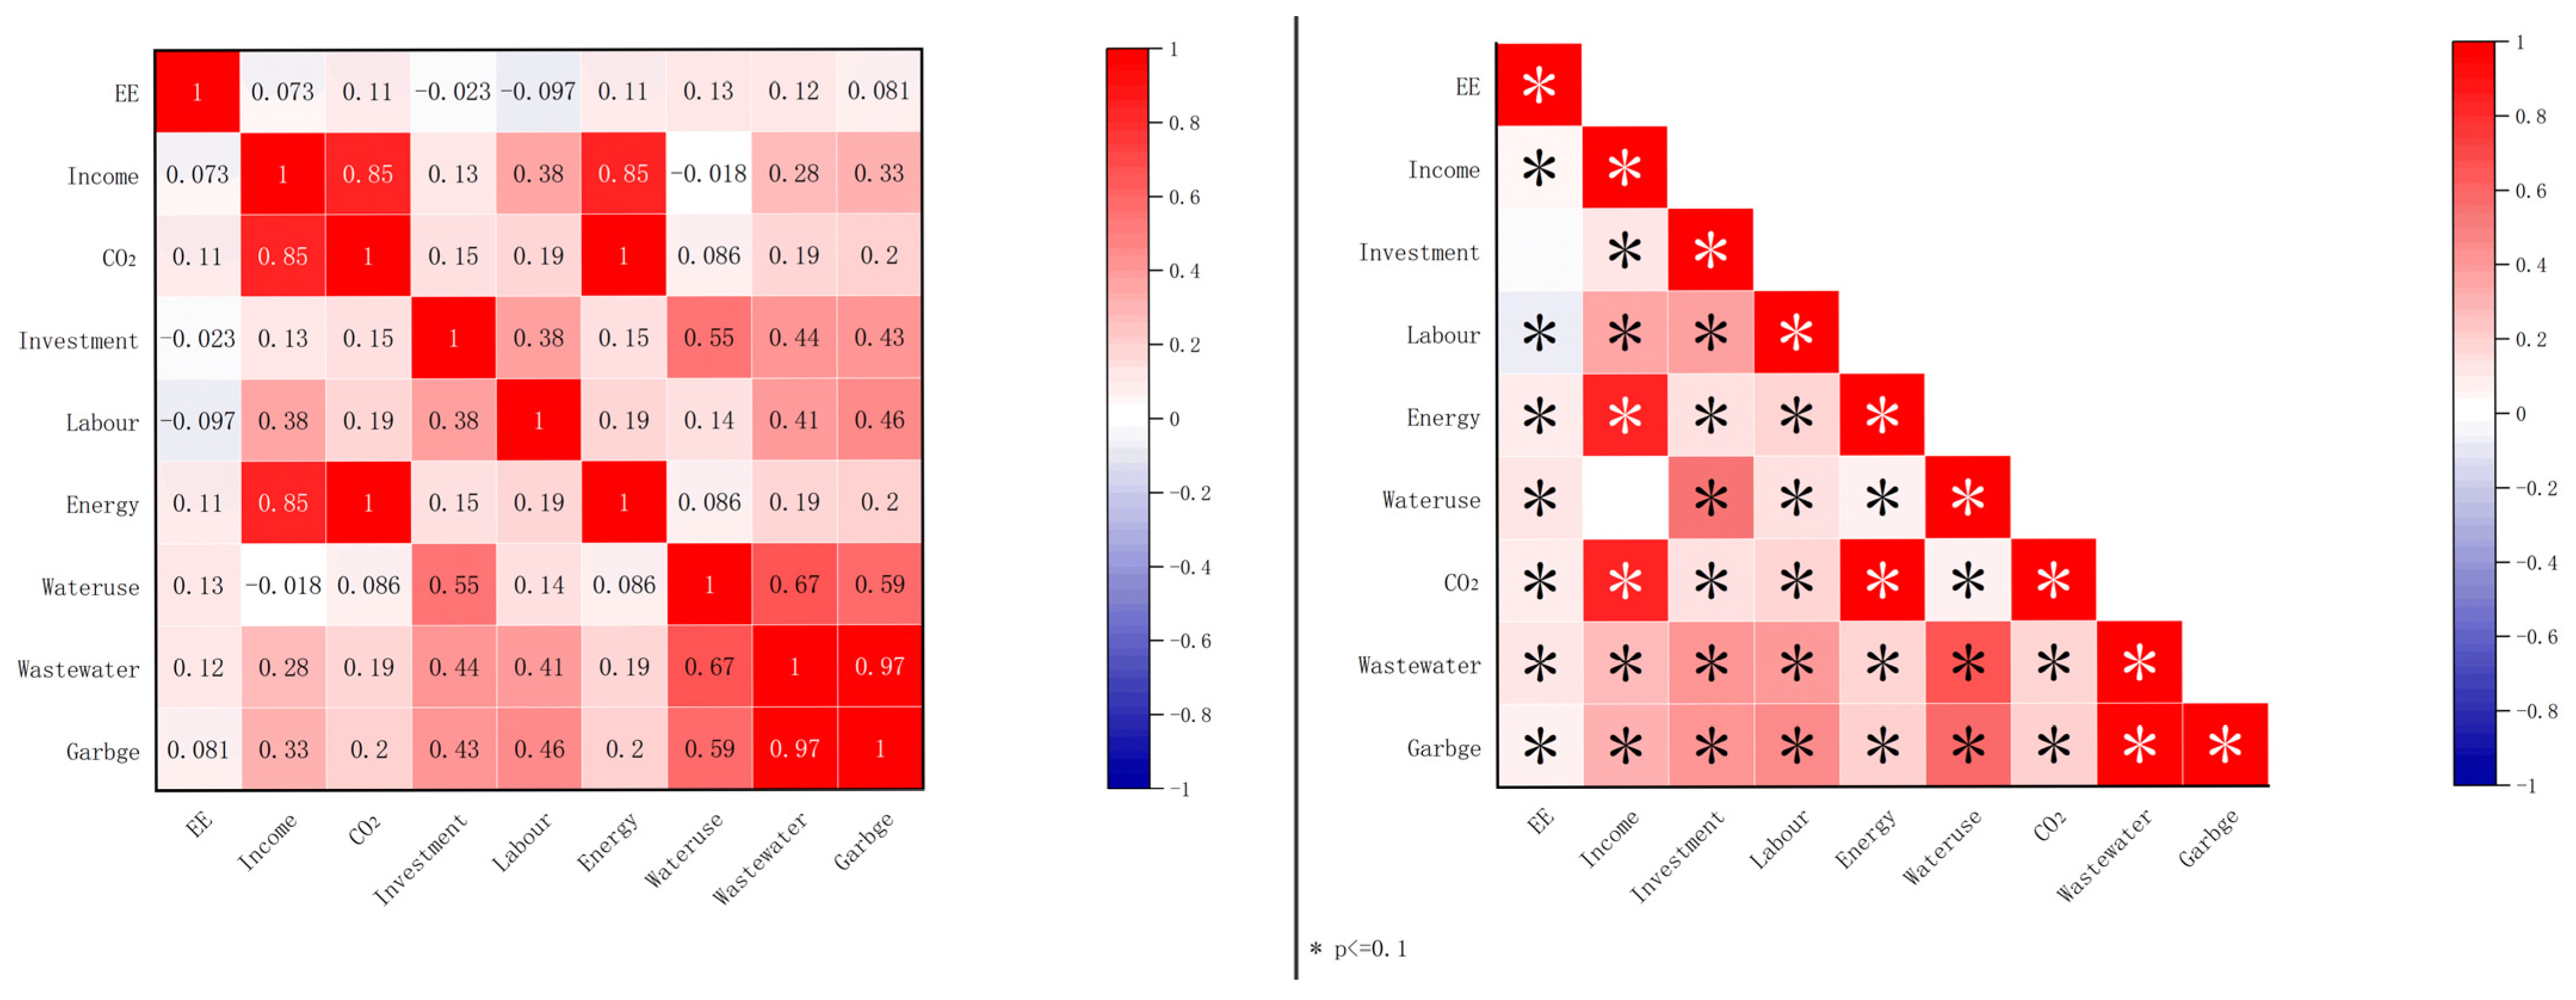
Stata 17.0-MP 64 software was used to carry out multicollinearity and autocorrelation tests among the indicators. All of them pass the tests, and the first stage of regression can be carried out. The Pearson correlation heat map and significance of the indicators in the first stage are shown in Figure 8, where the blue color block represents the negative correlation, while the red color block represents the positive correlation. The stronger the correlation, the darker the color block [80]. Passing 0.1 is expressed as * on the color block. It can be seen that the selected regression indicators in the first stage all have correlation and strong significance.
The income, labor, and investment of the tourism destinations are summarized as the system economic factors of the tourism destinations. The energy input of the tourism destinations is the energy factor, the water consumption of the tourism destinations is the resource factor and the carbon emissions, wastewater emissions and garbage disposal of the tourism destinations are the environmental factors. Table 5 shows the first-stage regression results.
The regression results show that, among the economic factors, the number of employees has a significant impact on the eco-efficiency of tourism destinations. As a labor-intensive industry, excessive personnel investment consumes a large number of funds and increases operational management costs, which harms the eco-efficiency of tourism destinations. Among the energy elements, there is a significant negative correlation between the amount of energy input of tourism destinations and eco-efficiency at 10%, indicating that a large amount of energy input will bring more carbon emissions, leading to a decrease in the eco-efficiency of tourism destinations. In environmental factors, unreasonable discharge of wastewater from tourism destinations directly increases ecological pressure, leading to a decrease in the eco-efficiency of tourism destinations. Therefore, the concept of water conservation should be advocated to promote the efficient recycling and utilization of wastewater.

3.4.2. Second-Stage Regression

Based on the regression results of the three different aspects of the first-stage factors, five models are established, respectively. Table 6 shows the first-stage regression results.
It was found that an overall improvement in urbanization promotes the eco-efficiency of tourism destinations.
Urban population development indicators: population density is an important indicator to measure the urbanization rate [81]. In this regression, population characteristics, represented by population density, show a significant positive correlation with the economy, resources and environmental factors of tourism destinations. The strongest positive correlation is in the discharge of wastewater from tourism destinations, followed by income, indicating that a dense resident population can stimulate demand-side reform and drive the development of tourism destinations.
Industrial structure: The higher the proportion of the tertiary industry, the more it can promote the position and role, and then indirectly expand the scale of the development of the tourism destinations industry, and make the operating income, employment, energy input and waste discharge of the tourism destinations show a growth trend. It is recommended to pay attention to the optimization strategy of the industrial structure of the tourism destinations while adjusting the overall industrial structure.
Technological: Technology is crucial for driving the high-quality development of urbanization [82]. The scientific and technological aspects represented by the turnover of the technology market are significantly negatively correlated with the economic factors and energy factors of tourism destinations and significantly positively correlated with the environmental factors. This is because, with the improvement in the technology, the development of tourism destinations is no longer limited to traditional models. The use of smart tourism destinations, that can achieve visual management and intelligent operation, requires a large amount of capital investment in the early stage and later maintenance. The cycle of withdrawing funds is long, which reduces income and employees.
Social security: Social security is a powerful institutional construction for the development of urbanization in China [83]. Social security, represented by the number of beds in health institutions, shows a significant positive correlation with the internal system indicators of tourism destinations, especially the discharge of garbage in environmental factors. This is because the social security system is conducive to the stability of the entire society and provides a harmonious environment for residents’ tourism.
Quality of life for urban residents: China’s new urbanization construction is solidly advancing, and the quality of life for residents is constantly improving [84]. The quality of life of residents, represented by the housing area of urban residents and the total amount of post and telecommunications business, has a major positive impact on the indicators within the system of tourism destinations, indicating that, with the improvement in people’s quality of life, the demand-side consumption capacity will significantly improve, significantly driving the increase in the operating income of the tourism destinations.
Urban resource and environment: Urbanization should be green ecological urbanization [85]. The resource and environment represented by urban landscaping area and per capita daily water consumption in the city has no significant impact on the income and employment of tourism destinations but mainly shows a significant negative correlation with environmental factors. The development model of resource-saving cities should be promoted.
Government role: On the one hand, the role of the government, represented by local financial expenditures, is significantly positively correlated with the income of tourism destinations. The effective implementation of government functions can stimulate tourists’ desire to travel [86], create a good market environment for tourism destination management, and promote the growth of tourism destinations’ income. On the other hand, the government’s role can effectively curb the discharge of garbage from tourism destinations. Measures such as simplifying the packaging of tourism products by the Chongqing government and officially launching garbage-free tourism destinations by the Guizhou government in 2013 have achieved good results.

4. Conclusions and Discussion

4.1. Conclusions

The theoretical significance of this paper is as follows. (1) This paper constructs an indicator system to evaluate the eco-efficiency and economic efficiency of tourism destinations through the Super-SBM model. (2) Tourism destinations are separated from the tourism industry to study the spatial evolution of elements in a multi-regional long time series. (3) This paper constructs a complete research framework for tourism destinations, which can provide ideas for the study of the eco-efficiency of other industries. The practical significance of this paper is as follows. (1) The quantifying of economic efficiency and eco-efficiency of tourism destinations in China, which can provide practical comparative significance for the efficiency of other industries in the tourism industry. (2) Through two-stage regression model construction, more targeted suggestions have been provided for the healthy development of the eco-efficiency of tourism destinations in the process of urbanization.
Based on research hypothesis 1, this article demonstrates the overall trend, spatial distribution pattern and spatiotemporal evolution characteristics of tourism destinations’ economic efficiency and eco-efficiency. Based on research hypothesis 2, it demonstrates the driving factors that affect the eco-efficiency of Chinese tourism destinations. The conclusion of this study is as follows.
From the perspective of the overall trend, the growth rate of income in Chinese tourism destinations is almost consistent with the growth rate of carbon emissions. The highly consistent growth rate of income and carbon emissions shows that China’s tourism destinations have not reached the decoupling standard at present. The eco-efficiency of tourism destinations is higher than the economic efficiency, and the overall trend is downward.
From the perspective of spatial pattern, the spatial agglomeration effect of the eco-efficiency and economic efficiency of China’s tourism destinations were not obvious from 2000 to 2019. The high-efficiency zone is distributed in Qinghai provinces with better environmental resources, which indicates that China’s tourism destinations are highly dependent on resources. The economic efficiency of tourism destinations in western China has increased while the eco-efficiency has declined. And the center of gravity has shifted from the northwest to the southeast.
From the perspective of coupling relationships, the results show that China’s tourism destinations are undergoing the process of transformation and restructuring, and have not yet reached the decoupling standard. In the course of urbanization, the development of tourism destinations should be given equal attention.
From the perspective of driving factors, the results show that the number of employees, energy input, and wastewater discharge within the system harm the eco-efficiency of tourism destinations, while the income has a direct positive effect. The living standards and resource environment of urban residents indirectly affect the eco-efficiency of tourism destinations by influencing their internal economic factors. Urban energy consumption reduces the eco-efficiency of tourism destinations by affecting their energy factors. Overall, urbanization helps to promote the improvement in the eco-efficiency of tourism destinations.

4.2. Discussion

Different from tourism, the eco-efficiency of tourism destinations is higher than the economic efficiency and shows a downward trend. Xia Bing [31] found that the eco-efficiency is lower than the economic efficiency when using input-output tables to study the eco-efficiency of Gansu’s tourism industry. However, the eco-efficiency of tourism destinations is superior to economic efficiency, which is in line with the development status of tourism destinations; most of them rely on the environment and the industrial structure of tourism destinations is not perfect and the quality of economic efficiency input and output is not high. The declining trend of tourism destinations shows that China’s tourism destinations are expected to take the lead in achieving decoupling through energy conservation and emission reduction measures. There is a strong correlation between tourism destinations and the spatial distribution of tourism. When Peng [87] studied the spatial pattern of China’s provincial tourism eco-efficiency, he found that the center of gravity of China’s tourism eco-efficiency is in Henan, which confirms the research and also shows that, as the core department of tourism, tourism destinations have consistent eco-efficiency in spatial distribution.
China’s tourism destinations have not reached the decoupling standard. There are signs of weak decoupling in China’s tourism industry according to previous research [71]. Among various regions, the decoupling in the eastern provinces is stronger, while the decoupling in the central and western regions is weaker [88]. However, the decoupling effect of tourism destinations in this paper have not been formed, and it is still in the first half of the environmental Kuznets curve. According to previous research, low carbon activities in tourism destinations are crucial for the economic transformation and sustainable development of the tourism industry [32]. Therefore, it is recommended to incorporate carbon accounting into the system for assessing performance in order to promote the construction of low-carbon tourism destinations [21].
Urbanization is conducive to improving the eco-efficiency of tourism destinations. According to previous studies, the factors that affect tourism eco-efficiency include the scale effect [89], the technical effect [90], the structural effect [91], the environmental effect and government regulations [92], which is consistent with the study findings of this paper. Urbanization promotes the scale effect of tourism destinations and technically improves tourism destinations by improving economic and social development. Ahmed et al. [93] found a causal relationship between the technological economy and carbon emission development in five South Asian countries. The development of urbanization can also promote the optimization of industrial structure and increase the proportion of tourism destination industries in the tourism industry. Shao et al. [94] found that economic changes and improving regionalization can be the main paths for a specific department to optimize an industrial structure. The positive impact of urbanization environmental effects and government regulations can easily indirectly affect the eco-efficiency of tourism destinations through environmental factors, economic factors and energy factors within the system.

5. Implications and Limitations

5.1. Implications

Based on the empirical research results of this article, the following suggestions are proposed: accelerate the construction of tourism destinations, reduce dependence on natural resources, and reach the decoupling standard as soon as possible. The government plans and develops tourism destinations through formal analysis, strategic planning, implementation and performance monitoring [10], as well as through increasing the economic benefits of tourism destinations through such measures as ticket reduction policies, toilet revolutionization, personalized services for individual tourists and the introduction of distinctive elements such as ethnic groups, literature and art, simultaneously.
Strengthen the spillover effect of efficient regions on surrounding provinces, reduce polarization and trickle-down phenomena, and form a coordinated and balanced development across the country. As the spillover effect is not obvious and the degree of spatial agglomeration is low, the government should advocate establishing a cooperation mechanism for trans-provincial tourism destinations, such as introducing a joint ticket mechanism for tourism destinations. Provinces with low-efficiency of tourism destinations should learn from advanced domestic and foreign management concepts and exchange experiences with surrounding provinces. For example, the management and operation personnel of tourism destinations in different provinces should go to the tourism destinations in more efficient provinces to carry out field visits, learn the management technology of intelligent tourism destinations, improve informatization, exchange tourist resources, establish joint training of employees and other measures.
Accelerate the transformation of tourism destinations from extensive development to high-quality development. The development of tourism destinations should focus on the harmonious coexistence between human beings and nature. Therefore, on the one hand, the government should accelerate the legislative progress in the ecological environment of tourism destinations based on their actual situation, pay attention to the implementation of policies and play a supervisory role in environmental protection issues for the public and public opinion institutions. On the other hand, tourist attraction management agencies should adjust their energy structure, advocate the use of new and clean energy and strengthen the cultivation of green plants in tourism destinations to increase carbon sinks [4]. Measures such as establishing resource rosters and encouraging tourists to jointly manage these should be implemented.
Within the tourism destinations system, the income of the tourism destinations should be increased, and the number of employees, energy input and wastewater discharge should be reduced. Outside the tourism destination system, the industrial structure should be optimized, the quality of life of urban residents should be improved and the scientific and technological role of the government should be improved. Enterprises in tourism destinations should consider improving the infrastructure of the tourism destinations, replacing excessive human capital with an intelligent tourism destinations management system, optimizing the wastewater discharge system and recycling the wastewater by grade for toilet water and vegetation irrigation in the tourism destinations. The regional government should take regional economic and social development as the primary development goal and promote urbanization. Tourists should reduce the purchase of overpackaged foods and avoid discarding rubbish [21].

5.2. Limitations

This paper studied the overall trend and space–time pattern of the efficiency of Chinese tourism destinations in 2000–2019. It also analyzed the coupling relationship between urbanization and tourism destinations’ efficiency, and looked for the driving factors of urbanization on tourism destinations’ eco-efficiency. Although discoveries have been made, there are still limitations. When building the indicator system of driving factors of eco-efficiency of tourism destinations, the Chinese national standard, New-type urbanization-Evaluation index system of quality city (GB/T 39497-2020), was taken as the main reference, but almost all of these indicators are economic and ecological environment factors. However, due to China’s vast territory and significant differences in resource endowments among provinces, geographical factors and climate factors at different latitudes and longitudes were not included in the indicator system. In future research, indicators such as geography, climate, society and culture will be included in the indicator system for measuring the eco-efficiency of tourism destinations, which will help researchers provide more targeted suggestions for improving the eco-efficiency of Chinese tourism destinations.

Author Contributions

Conceptualization, S.D. and B.X.; data curation, J.Z.; formal analysis, B.X. and J.Z.; funding acquisition, D.B. and S.D.; investigation, J.Z.; methodology, B.X. and J.Z.; resources, S.D.; software, B.X.; supervision, D.B. and S.D.; writing—original draft, D.B. and J.Z.; writing—review and editing, S.D. and B.X. All authors have read and agreed to the published version of the manuscript.

Funding

This work was supported by the Science & Technology Fundamental Resources Investigation Program of China (2022FY101904), the National Natural Science Foundation of China (42201321, NSFC-MFST 32161143029), the China Postdoctoral Science Foundation: 2021M703179.

Institutional Review Board Statement

Not applicable.

Informed Consent Statement

Not applicable.

Data Availability Statement

The data presented in this study are available in Yearbook of China Tourism Statistics, which can be found at the website: https://navi.cnki.net/knavi/yearbooks/index, accessed on 15 March 2023.

Acknowledgments

The authors would like to thank the editor and reviewers for their insightful comments and suggestions.

Conflicts of Interest

The authors declare no conflict of interest.

References

  1. UNWTO. Tourism and the Sustainable Development Goals—Journey to 2030; UNWTO: Madrid, Spain, 2017. [Google Scholar]
  2. Peter, M. Tourism Impacts, Planning and Management; Taylor and Francis: Abingdon, UK, 2015. [Google Scholar]
  3. Ho, D.T. Carbon dioxide removal is an ineffective time machine. Nature 2023, 616, 9. [Google Scholar] [CrossRef] [PubMed]
  4. Cooper, C. Essentials of Tourism; SAGE: Thousand Oaks, CA, USA, 2021. [Google Scholar]
  5. Lenzen, M.; Sun, Y.-Y.; Faturay, F.; Ting, Y.-P.; Geschke, A.; Malik, A. The carbon footprint of global tourism. Nat. Clim. Change 2018, 8, 544. [Google Scholar] [CrossRef] [Green Version]
  6. UNWTO. Glossary of Tourism Terms|UNWTO. 2008. Available online: https://www.unwto.org/glossary-tourism-terms (accessed on 9 July 2023).
  7. Wang, L.-E.; Tian, B.; Filimonau, V.; Ning, Z.; Yang, X. The impact of the COVID-19 pandemic on revenues of visitor attractions: An exploratory and preliminary study in China. Tour. Econ. 2022, 28, 153–174. [Google Scholar] [CrossRef]
  8. 308 Million Domestic Tourism Trips during the 2023 Spring Festival Holiday. 2023. Available online: http://www.gov.cn/xinwen/2023-01/27/content_5738862.htm#1 (accessed on 27 April 2023).
  9. Liao, Z.; Jin, M.; Ren, P.; Luo, Y. Research on Scenic Spot’s Sustainable Development Based on a SD Model: A Case Study of the Jiuzhai Valley. Sustainability 2014, 6, 4632–4644. [Google Scholar] [CrossRef] [Green Version]
  10. Morrison, A.M. Managing and Marketing Tourism Destinations; Taylor and Francis: Abingdon, UK, 2018. [Google Scholar]
  11. Kolar, T. Conceptualising tourist experiences with new attractions: The case of escape rooms. Int. J. Contemp. Hosp. Manag. 2017, 29, 1322–1339. [Google Scholar] [CrossRef]
  12. Gong, J.; Detchkhajornjaroensri, P.; Knight, D.W. Responsible tourism in Bangkok, Thailand: Resident perceptions of Chinese tourist behaviour. Int. J. Tour. Res. 2019, 21, 221–233. [Google Scholar] [CrossRef]
  13. Lee, E. Types and Characteristics of Tourist attractions in the Central Region: Focusing on New Scenic Spot Classification Criteria. J. Korean Geogr. Soc. 2019, 54, 35–49. [Google Scholar]
  14. Shi, H.; Shi, T.; Liu, Q.; Wang, Z. Ecological Vulnerability of Tourism Scenic Spots: Based on Remote Sensing Ecological Index. Pol. J. Environ. Stud. 2021, 30, 3231–3248. [Google Scholar] [CrossRef]
  15. Ding, H.; He, M.; Deng, C. Lifecycle approach to assessing environmental friendly product project with internalizing environmental externality. J. Clean. Prod. 2014, 66, 128–138. [Google Scholar] [CrossRef]
  16. Hu, W.; Liu, J.; Li, M.; Zhu, L. Exploration of Substitute Industry for Shanxi’s Coal Economy: On the Path of Key Scenic Spots Propelling Regional Economic Development. China Popul. Resour. Environ. 2016, 26, 168–176. [Google Scholar]
  17. Zhang, R.; Pu, L. Influence of tourism development on the eco-environment of tourist attractions and countermeasures for tourism development management. J. Environ. Prot. Ecol. 2020, 21, 2323–2332. [Google Scholar]
  18. Ma, D.; Xia, H.L. Analysis of the impact of water pollution on tourism activities in tourist attractions under the concept of ecological environment protection. Fresenius Environ. Bull. 2021, 30, 9966–9971. [Google Scholar]
  19. Zhu, F.; Shen, W.; Diao, J.; Li, M.; Zheng, G. Integrating cross-sensor high spatial resolution satellite images to detect subtle forest vegetation change in the Purple Mountains, a national scenic spot in Nanjing, China. J. For. Res. 2020, 31, 1743–1758. [Google Scholar] [CrossRef] [Green Version]
  20. Han, W.; Chen, X. Magnetic Properties of Topsoils and Their Environmental Implications in Kanas Scenic Spot of Xinjiang, China. Soils 2019, 51, 185–194. [Google Scholar]
  21. Susanne, B.; John, H. Climate Change and Tourism: From Policy to Practice; Taylor and Francis: Abingdon, UK, 2012. [Google Scholar]
  22. Liu, L. Impacts of tourism development and tourist activities on environment in scenic ecotourism spots. Appl. Ecol. Environ. Res. 2019, 17, 9347–9355. [Google Scholar] [CrossRef]
  23. Yang, M.-Y.; Van Coillie, F.; Hens, L.; De Wulf, R.; Ou, X.-K.; Zhang, Z.-M. Nature conservation versus scenic quality: A GIS approach towards optimized tourist tracks in a protected area of Northwest Yunnan, China. J. Mt. Sci. 2014, 11, 142–155. [Google Scholar] [CrossRef]
  24. Wang, J. Study on spatial econometrics of regional economic development under development of ecological. Fresenius Environ. Bull. 2020, 29, 9511–9521. [Google Scholar]
  25. Ye, X.; Miao, L. Research on Decision-Making Based on the Three-Party Evolutionary Game of Tourists, Tourist attractions, and Government. J. Organ. End User Comput. 2022, 34, 23. [Google Scholar] [CrossRef]
  26. Huang, T.; Liu, J.L.; Tang, N.; Zhang, T. The influence of values and scenic spot’s policy on tourists’ environmentally responsible behavior: An extended theory of planned behavior model. J. Arid Land Resour. Environ. 2018, 32, 88–94. [Google Scholar]
  27. Bai, S.Z.; Han, F.L. Tourist Behavior Recognition through Scenic Spot Image Retrieval Based on Image Processing. Trait. Du Signal 2020, 37, 619–626. [Google Scholar] [CrossRef]
  28. Fan, Q.; Sun, T. Discussion on the Sustainable Development of Scenic Spots. In Proceedings of the 2nd International Conference on Engineering and Business Management, Wuhan, China, 22–24 March 2011. [Google Scholar]
  29. Li, X.; Zhang, J.; Jiang, N.; Zhao, T.; Yang, F. An Evaluation Method of Scenic Spots Based on Location Check-in Data and Classified Information of Tourist attractions. J. Geomat. Sci. Technol. 2015, 32, 405–411. [Google Scholar]
  30. Jian-dong, Z.; Hao, W. Study on environmental capacity of the city tourist attractions based on sustainable development: A case study of Yangzhou Slender West Lake tourist attractions. J. Yangzhou Univ. 2009, 30, 95–99. [Google Scholar]
  31. Xia, B.; Dong, S.; Li, Z.; Zhao, M.; Sun, D.; Zhang, W.; Li, Y. Eco-Efficiency and Its Drivers in Tourism Sectors with Respect to Carbon Emissions from the Supply Chain: An Integrated EEIO and DEA Approach. Int. J. Environ. Res. Public Health 2022, 19, 6951. [Google Scholar] [CrossRef] [PubMed]
  32. McKercher, B.; Prideaux, B. Tourism Theories, Concepts and Models; Goodfellow: Delson, QC, Canada, 2020. [Google Scholar]
  33. Ren, Y. The Upgrading of Urbanization and China’s New Urbanization. Urban Plan. Forum 2016, 2, 66–71. [Google Scholar]
  34. Zhu, J.G.; Xu, J.W.; Li, X.J.; Lou, F.; Chen, Y. Impact of Land Urbanization and Population Urbanization on Economic Growth in China. Sci. Geogr. Sin. 2020, 40, 1654–1662. [Google Scholar]
  35. Brown, L.M.; Graham, C.H. Demography, traits and vulnerability to urbanization: Can we make generalizations? J. Appl. Ecol. 2015, 52, 1455–1464. [Google Scholar] [CrossRef] [Green Version]
  36. Shuai, L.I.; Guangjun, X.U. An urbanization model of the opening Chinese economy. J. Beijing Univ. Chem. Technol. 2006, 33, 78–81. [Google Scholar]
  37. Chen, M.; Ye, C.; Lu, D.; Sui, Y.; Guo, S. Cognition and construction of the theoretical connotations of new urbanization with Chinese characteristics. J. Geogr. Sci. 2019, 29, 1681–1698. [Google Scholar] [CrossRef] [Green Version]
  38. Chen, M.; Lu, D.; Zha, L. The comprehensive evaluation of China’s urbanization and effects on resources and environment. J. Geogr. Sci. 2010, 20, 17–30. [Google Scholar] [CrossRef]
  39. UNESCO. Regional Office for Education in Asia and the Pacific. Population, migration and urbanization. Bull. Unesco Reg. Off. Educ. Asia Pac. 1982, 23, 289–313. [Google Scholar]
  40. Luo, W.; Bai, H.; Jing, Q.; Liu, T.; Xu, H. Urbanization-induced ecological degradation in Midwestern China: An analysis based on an improved ecological footprint model. Resour. Conserv. Recycl. 2018, 137, 113–125. [Google Scholar] [CrossRef]
  41. Singh, H.; Garg, R.; Karnatak, H.C.; Roy, A. Spatial landscape model to characterize biological diversity using R statistical computing environment. J. Environ. Manag. 2018, 206, 1211–1223. [Google Scholar] [CrossRef] [PubMed]
  42. Liang, W.; Yang, M. Urbanization, economic growth and environmental pollution: Evidence from China. Sustain. Comput. Inform. Syst. 2019, 21, 1–9. [Google Scholar] [CrossRef]
  43. Yang, Y. Agglomeration Density and Labor Productivity in China’s Tourism Industry. Int. J. Tour. Res. 2016, 18, 434–446. [Google Scholar] [CrossRef]
  44. Zhu, H.; Chen, X.L. Space Distribution Structure of A-grade Scenic Spot in China. Sci. Geogr. Sin. 2008, 28, 607–615. [Google Scholar]
  45. Li, H.; Li, D.; Dong, X.; Xu, N. Spatial patterns of 5A-level tourist attractions and their network attention degrees in China. J. Arid Land Resour. Environ. 2019, 33, 178–184. [Google Scholar]
  46. Zhang, G.-H.; Yuan, H.-Y.; Duan, R.-X.; Dong, Y.-L. Multiscale analysis of the spatiotemporal differences and the influencing factors of the high-level in China. J. Nat. Resour. 2022, 37, 2672–2687. [Google Scholar]
  47. Chen, M.; Gong, Y.; Li, Y.; Lu, D.; Zhang, H. Population distribution and urbanization on both sides of the Hu Huanyong Line: Answering the Premier’s question. J. Geogr. Sci. 2016, 26, 1593–1610. [Google Scholar] [CrossRef]
  48. Peeters, A.; Zude, M.; Käthner, J.; Ünlü, M.; Kanber, R.; Hetzroni, A.; Gebbers, R.; Ben-Gal, A. Getis-Ord’s hot- and cold-spot statistics as a basis for multivariate spatial clustering of orchard tree data. Comput. Electron. Agric. 2015, 111, 140–150. [Google Scholar] [CrossRef]
  49. Bornmann, L.; de Moya Angeon, F. Hot and cold spots in the US research: A spatial analysis of bibliometric data on the institutional level. J. Inf. Sci. 2019, 45, 84–91. [Google Scholar] [CrossRef]
  50. Yan, Y.; Qu, J.; Hao, X.; Yue, S. Characterizing spatial-temporal changes of heat waves in China using center of gravity analysis. Phys. Geogr. 2017, 38, 379–391. [Google Scholar] [CrossRef]
  51. Zhang, Y.; Zhang, J.; Yang, Z.; Li, J. Analysis of the distribution and evolution of energy supply and demand centers of gravity in China. Energy Policy 2012, 49, 695–706. [Google Scholar] [CrossRef]
  52. Chu, Y.; Zhao, Z. Coupling analysis on the top 100 tourist attractions system and tourism industry development in China. J. Arid Land Resour. Environ. 2013, 27, 187–190. [Google Scholar]
  53. Lan, Z.H.; Ping, Y.X.; Fang, H.; Hui, S.; Rong, W.C.; Jiao, G.J. Analysis and forecast of coupling situation among tourism industry-economic development-ecological environment in Xinjiang. Arid Land Geogr. 2020, 43, 1146–1154. [Google Scholar]
  54. Zheng, D.C.; Liu, W.X.; Li, X.X.; Lin, Z.Y.; Jiang, H. Research on carbon emission diversity from the perspective of urbanization. Appl. Ecol. Environ. Res. 2018, 16, 6643–6654. [Google Scholar] [CrossRef]
  55. China’s Economic and Social Big Data Research Platform. Available online: https://data.cnki.net/yearBook/single?id=N2022060061 (accessed on 1 April 2023).
  56. China’s Economic and Social Big Data Research Platform. Available online: https://data.cnki.net/yearBook/single?id=N2018020050 (accessed on 1 April 2023).
  57. China’s Economic and Social Big Data Research Platform. Available online: https://data.cnki.net/yearBook/single?id=N2021110004 (accessed on 1 April 2023).
  58. The National Bureau of Statistics of China. Available online: https://data.stats.gov.cn/easyquery.htm?cn=C01 (accessed on 9 April 2023).
  59. China’s Economic and Social Big Data Research Platform. Available online: https://data.cnki.net/yearBook/single?id=N2021030182 (accessed on 1 April 2023).
  60. Huang, C.-W.; Chen, H.-Y.; Ting, C.-T. Using a network data envelopment analysis model to assess the efficiency and effectiveness of cultural tourism promotion in Taiwan. J. Travel Tour. Mark. 2017, 34, 1274–1284. [Google Scholar] [CrossRef]
  61. Yong, L.I.U.; Zhi-Xiang, L.I.; Jing, L.I. Environmental Efficiency Assessment Based on SBM-NS Model. Math. Pract. Theory 2009, 39, 25–30. [Google Scholar]
  62. Louzada, F.; Ferreira, P.H. Modified inference function for margins for the bivariate clayton copula-based SUN Tobit Model. J. Appl. Stat. 2016, 43, 2956–2976. [Google Scholar] [CrossRef]
  63. Song, W. Distribution-free test in Tobit mean regression model. J. Stat. Plan. Inference 2011, 141, 2891–2901. [Google Scholar] [CrossRef]
  64. Wang, Z. Jokhang Scenic Spot Bearing Capacity Evaluation Index System Construction. Chin. Agric. Sci. Bull. 2012, 28, 187–192. [Google Scholar]
  65. Li, Y.; Zhang, L. Ecological efficiency management of tourism based on carbon footprint analysis. Int. J. Low-Carbon Technol. 2020, 15, 550–554. [Google Scholar] [CrossRef]
  66. Ullah, M.I.; Aslam, M.; Altaf, S.; Ahmed, M. Some New Diagnostics of Multicollinearity in Linear Regression Model. Sains Malays. 2019, 48, 2051–2060. [Google Scholar] [CrossRef]
  67. Kroll, C.N.; Song, P. Impact of multicollinearity on small sample hydrologic regression models. Water Resour. Res. 2013, 49, 3756–3769. [Google Scholar] [CrossRef]
  68. Wang, R.; Xia, B.; Dong, S.; Li, Y.; Li, Z.; Ba, D.; Zhang, W. Research on the Spatial Differentiation and Driving Forces of Eco-Efficiency of Regional Tourism in China. Sustainability 2021, 13, 280. [Google Scholar] [CrossRef]
  69. Hu, M.J.; Ding, Z.S.; Li, Z.J.; Zhou, N.X.; Li, X.; Zhang, C. Tourism ecological welfare and driving factors from the perspective of ecological efficiency: A case study of Changzhou City. Acta Ecol. Sin. 2020, 40, 1944–1955. [Google Scholar]
  70. GB/T 39497-2020; New-type urbanization—Evaluation index system of quality city. China National Institute of Standardization: Beijing, China, 2020.
  71. Xiong, G.B.; Deng, J.H.; Ding, B.G. Characteristics, decoupling effect, and driving factors of regional tourism’s carbon emissions in China. Environ. Sci. Pollut. Res. 2022, 29, 47082–47093. [Google Scholar] [CrossRef]
  72. Zhang, J.; Zhang, Y. Tourism and regional carbon emissions: City-level evidence from China. Tour. Rev. 2023, 78, 888–906. [Google Scholar] [CrossRef]
  73. National Standard Retrieval: National Standard Information Public Service Platform. Available online: https://std.samr.gov.cn/search/std?q=GB%2FT%2017775-2003 (accessed on 9 July 2023).
  74. Wang, W.; Wang, W.J.; Li, J.S.; Wu, H.; Xu, C.; Liu, T. The Impact of Sustained Drought on Vegetation Ecosystem in Southwest China Based on Remote Sensing. Procedia Environ. Sci. 2010, 2, 1679–1691. [Google Scholar] [CrossRef] [Green Version]
  75. Huang, S.; Wei, X. Offline versus online travel experience sharing: The national profile of China. Int. J. Cult. Tour. Hosp. Res. 2019, 13, 183–189. [Google Scholar] [CrossRef] [Green Version]
  76. Yao, Z.; Chen, T. Tourism Eco-efficiency Model and an Empirical Research. China Popul. Resour. Environ. 2015, 25, 113–120. [Google Scholar]
  77. Tian, D.; Liu, J.; Zhong, L.; Wang, R.; Wang, J. Research on eco-tourism image positioning: Case of Qinghai Lake. J. Arid Land Resour. Environ. 2012, 26, 181–188. [Google Scholar]
  78. Guo, J.K.; Wang, S.B.; Wang, H. Comprehensive Measure of the Regional Advantages of National Scenic Area. Econ. Geogr. 2017, 37, 187–195. [Google Scholar]
  79. Zha, J.; Dai, J.; Xu, H.; Zhao, C.; Tan, T.; Li, Z. Assessing efficiency and determinants of tourist attractions based on a two-subprocess perspective: A case of Chengdu, southwestern China. J. Destin. Mark. Manag. 2021, 19, 100542. [Google Scholar] [CrossRef]
  80. Xianglin, L.U. Canonical Correlation Analysis of Input-output of Chinese Tourism Development. J. Anhui Agric. Sci. 2007, 35, 3721–3722. [Google Scholar]
  81. Liu, Y.H.; Gao, C.C.; Lu, Y.Y. The impact of urbanization on GHG emissions in China: The role of population density. J. Clean. Prod. 2017, 157, 299–309. [Google Scholar] [CrossRef]
  82. Xu, Y.; Zhang, R.; Fan, X.; Wang, Q. How does green technology innovation affect urbanization? An empirical study from provinces of China. Environ. Sci. Pollut. Res. 2022, 29, 36626–36639. [Google Scholar] [CrossRef]
  83. Jin, H.; He, Y.; Zhao, C. Social Security Expenditure, Demographic Structural Changes, and Urban-Rural Income Gap in China: Evidence from the Provincial Data. Rev. De Cercet. Si Interv. Soc. 2018, 62, 254–277. [Google Scholar]
  84. Dai, W.; He, J. Comprehensive Evaluation on the Quality of Population Urbanization and Its Policy Implication: A Case of Anhui Province. Urban Stud. 2020, 27, 32–36. [Google Scholar]
  85. Shuancheng, L.I.; Zhiqiang, Z.; Yanglin, W. Urbanization Process and Effects of Natural Resource and Environment in China: Research Trends and Future Directions. Prog. Geogr. 2009, 28, 63–70. [Google Scholar]
  86. Zhao, P.; Duan, B.Y.-C.; Zhang, Y.; Yang, Y.; Zhang, W.; Fang, Y.; Liu, Y. A comparison of the early impact of government restriction and risk perception on tourist attraction demand during the COVID-19 pandemic. Asia Pac. J. Tour. Res. 2022, 27, 1286–1303. [Google Scholar] [CrossRef]
  87. Peng, H.; Zhang, J.; Lu, L.; Tang, G.; Yan, B.; Xiao, X.; Han, Y. Eco-efficiency and its determinants at a tourism destination: A case study of Huangshan National Park, China. Tour. Manag. 2017, 60, 201–211. [Google Scholar] [CrossRef]
  88. Weng, G.; Li, C.; Pan, Y.; Li, J. Decoupling Effect and Influencing Factors of Carbon Emissions in China’s Tourism Industry. Geogr. Geo-Inf. Sci. 2021, 37, 114–120. [Google Scholar]
  89. Liobikiene, G.; Butkus, M. Scale, composition, and technique effects through which the economic growth, foreign direct investment, urbanization, and trade affect greenhouse gas emissions. Renew. Energy 2019, 132, 1310–1322. [Google Scholar] [CrossRef]
  90. Li, T.C.; Shi, Z.Y.; Han, D.R. Research on the impact of energy technology innovation on total factor ecological efficiency. Environ. Sci. Pollut. Res. 2022, 29, 37096–37114. [Google Scholar] [CrossRef]
  91. Hong, Z.; Wang, L.; Zhang, C. Influencing factors of regional tourism eco-efficiency under the background of green development in the western China. Acta Ecol. Sin. 2021, 41, 3512–3524. [Google Scholar]
  92. Jiang, Z.Q. Action mechanism of environmental institution on urban ecological efficiency. J. Environ. Prot. Ecol. 2022, 23, 2474–2484. [Google Scholar]
  93. Ahmed, K.; Shahbaz, M.; Kyophilavong, P. Revisiting the emissions-energy-trade nexus: Evidence from the newly industrializing countries. Environ. Sci. Pollut. Res. 2016, 23, 7676–7691. [Google Scholar] [CrossRef] [PubMed]
  94. Shao, L.G.; Yu, X.; Feng, C. Evaluating the eco-efficiency of China’s industrial sectors: A two-stage network data envelopment analysis. J. Environ. Manag. 2019, 247, 551–560. [Google Scholar] [CrossRef]
Figure 1. Average distribution of tourism destinations from 2000 to 2019 and distribution of tourism destinations in 2019.
Sustainability 15 10929 g001
Figure 2. The Framework.
Sustainability 15 10929 g002
Figure 3. Overall trends of eco-efficiency and economic efficiency of tourism destinations in China in 2000–2019 (EC is the abbreviation for eco-efficiency; EE is the abbreviation for economic efficiency).
Sustainability 15 10929 g003
Figure 4. The spatial distribution of tourist destinations efficiency and hotspots in China in 2000 and 2019.
Sustainability 15 10929 g004
Figure 5. The track of the center of gravity of economic efficiency and eco-efficiency of Chinese tourism destinations in 2000–2019 (The red box represents the range projected by the main view on the map of China).
Sustainability 15 10929 g005
Figure 6. Coupling relationship between economic efficiency and urbanization of China’s tourism destinations in 2000 and 2019 (The blue dotted line indicates the trend of the coupling of urbanization rate and economic efficiency).
Sustainability 15 10929 g006
Figure 7. Coupling relationship between eco-efficiency and urbanization of China’s tourism destinations in 2000 and 2019 (The blue dotted line indicates the trend of the coupling of urbanization rate and eco-efficiency).
Sustainability 15 10929 g007
Figure 8. Pierce correlation heatmap and significance of the first-stage regression indicators.
Sustainability 15 10929 g008
Table 1. Index system of efficiency of tourism destinations in China.
IndicatorUnit
Economic efficiencyInputThe original value of fixed assetsTen thousand CNY
Number of employeesTen thousand people
OutputIncomeTen thousand CNY
Eco-efficiencyInputThe original value of fixed assetsTen thousand people
Total number of employeesTen thousand CNY
Energy input10 k tons of standard coal
Water consumption10 k tons
OutputIncomeTen thousand CNY
Undesirable outputWaste water discharge10 k tons
Garbage discharge10 k tons
SO2 emissionsTon
Carbon emissionsTon
Table 2. Descriptive statistical results of regression indicators in the first stage.
VariableObsMeanStd. Dev.MinMax
EC6001.051.170.089.08
EE6000.631.360.0115.77
lnIncome60011.611.823.4616.72
lnInvestment60012.231.434.9915.15
CO26004.5112.970.01258.03
lnLabor6009.101.333.0412.11
lnEnergy6009.911.642.1715.04
lnWateruse6005.643.23−3.5410.34
lnWastewater6005.643.23−3.5410.34
Garbge6006.361.80−0.1610.58
Table 3. The first stage regression index multicollinearity test.
VariableVIF1/VIF
lnInvestment4.910.20
lnEnergy4.030.25
lnWastewater3.960.25
lnLabor3.350.30
Garbage1.870.54
lnWateruse1.570.64
CO21.400.71
Mean VIF3.01
Table 4. Multicollinearity test of regression indicators in the second stage.
VariableVIF1/VIF
lnGovfinancial8.790.11
lnHousarea8.150.12
lnTechmarket3.800.26
Beds3.680.27
lnTourists3.160.32
lnPosts2.540.39
Landscaping2.330.43
Tertiary2.060.48
lnPopudensity2.040.49
lnPCWater1.380.73
GDPSO21.340.75
GDPenergy1.200.83
Mean VIF3.37
Table 5. Results of the first stage regression.
TypeECConf.z
Economic factorslnIncome0.212.36 **
lnLabor−0.28−4.51 ***
lnInvestment−0.01−0.16
Energy factorslnEnergy−0.13−1.75 *
lnWateruse0.021.20
Environmental factorsCO20.012.82 ***
lnWastewater−0.26−5.15 ***
Garbge0.046.55 ***
_cons3.788.56 ***
Note: *, ** and *** represent significance at levels 0.1, 0.05 and 0.01, respectively.
Table 6. Second-stage regression results.
lnIncome lnLabor lnEnergy Garbage lnWastewater
Demographic characteristicsPopulation density0.184.24 ***0.112.80 ***0.091.95 *−0.42−1.330.215.05 ***
Industrial structureThe proportion of tertiary industry1.732.41 **1.422.25 **2.903.81 ***24.554.99 ***−0.81−1.21
TechnologicalTechnology market turnover−0.15−3.98 ***−0.14−4.25 ***−0.22−5.62 ***1.425.39 ***0.102.90 ***
Social securityNumber of beds in health institutions0.023.03 ***0.023.50 ***0.033.97 ***0.307.07 ***0.01−1.18
Quality of life for urban residentsHousing area of urban residents0.605.98 ***0.384.36 ***0.413.80 ***0.89−1.28−0.03−0.31
Total postal and telecommunications business0.464.12 ***0.09−1.000.758.37 ***3.096.15 ***0.485.47 ***
Urban energy consumptionGDP energy consumption0.047.24 ***0.01−1.430.058.66 ***−0.05−1.31−0.01−1.51
GDPSO2 energy consumption0.344.76 ***0.111.82 *0.557.23 ***5.0810.00 ***0.8412.39 ***
Urban resource and EnvironmentalUrban landscaping area−0.02−1.94 *−0.01−0.89−0.02−2.40 **0.224.08 ***0.00−0.58
Per capita daily living water consumption in cities0.392.51 **0.16−1.18−0.10−0.574.043.56 ***1.036.86 ***
InternationalizationReception of international tourists0.040.780.163.85***0.153.084 ***−0.24−0.730.112.62 ***
The role of governmentLocal fiscal expenditure0.292.171 **0.292.04 **−0.01−0.07−2.88−4.10 ***0.757.33 ***
Note: *, ** and *** represent significance at levels 0.1, 0.05 and 0.01, respectively.
Disclaimer/Publisher’s Note: The statements, opinions and data contained in all publications are solely those of the individual author(s) and contributor(s) and not of MDPI and/or the editor(s). MDPI and/or the editor(s) disclaim responsibility for any injury to people or property resulting from any ideas, methods, instructions or products referred to in the content.