Abstract
Wi-Fi-based indoor positioning systems are becoming increasingly prevalent in digital transitions; therefore, ensuring accurate and robust positioning is essential to supporting the growth in demand for smartphones’ location-based services. The indoor positioning system on a smartphone, which is generally based on Wi-Fi received signal strength (RSS) measurements or the fingerprinting comparison technique, uses the K-NN algorithm to estimate the position due to its high accuracy. The fingerprinting algorithm is popular due to its ease of implementation and its ability to produce the desired accuracy. However, in a practical environment, the Wi-Fi signal strength-based positioning system is highly influenced by external factors such as changes in the environment, human interventions, obstacles in the signal path, signal inconsistency, signal loss due to the barriers, the non-line of sight (NLOS) during signal propagation, and the high level of fluctuations in the RSS, which affects location accuracy. In this paper, we propose a method that combines pedestrian dead reckoning (PDR) and Wi-Fi fingerprinting to select a k-node to participate in the K-NN algorithm for fingerprinting-based IPSs. The selected K-node is used for the K-NN algorithm to improve the robustness and overall accuracy. The proposed hybrid method can overcome practical environmental issues and reduces the KNN algorithm’s complexity by selecting the nearest neighbors’ search space for comparison using the PDR position estimate as the reference position. Our approach provides a sustainable solution for indoor positioning systems, reducing energy consumption and improving the overall environmental impact. The proposed method has potential applications in various domains, such as smart buildings, healthcare, and retail. The proposed method outperforms the traditional KNN algorithm in our experimental condition since its average position error is less than 1.2 m, and provides better accuracy.
1. Introduction
The indoor positioning system (IPS), focused on smartphones [1,2], has many possible utilizations that benefit from location-based services (LBS) [3]. LBS in a smartphone provides mobile applications with location information using two systems, the Global Positioning System (GPS) for outdoor measurements and IPS for indoor measurements. The IPS is necessary to locate the user’s position inside a building where the GPS signal is unavailable. The popular IPS uses different technologies, including an inertial sensor technology, infrared, ultra-wide band (UWB), ultrasound technology, and radio technology (Wi-Fi/BLE–RSSI). BLE and Infrared technology works only for short ranges, requires LOS, and sets up an environment with additional hardware, which is not cost-effective. Ultrasound technology is significantly affected by the climate. The UWB technology-based IPS shows strong resistance to interference and penetration. UWB devices were high-cost, and very few smartphones supported UWB technology.
The LBS provides either the current or last known location for various applications in a smartphone that is subscribed for service. The subscribing application often offers customizing information, navigation, or map services based on the LBS’s position. The LBS is utilized [3,4,5] in smart buildings [6], medical clinic routing, the healthcare industry [7,8], travel booking, food delivery, customized advertising, in-house stock route, contact tracking in popular locations (like the airport, malls, etc.), to find routes to reach a destination, in shopping malls to find bargains, airports, museums tours, etc. Indoor positioning systems (IPS) and location-based services (LBS) play an important role in enhancing the sustainability of smart buildings. These sustainable indoor localization technologies [9] enable smartphones to provide accurate and real-time locations of people, assets, and equipment within a building, allowing for an efficient use of space and resources. By accurately tracking the location of people and assets, building managers can optimize energy usage, lighting, and heating, ventilation and air-conditioning (HVAC) systems to reduce waste and minimize carbon emissions. Location-based services in smart buildings provide valuable information about occupancy, traffic flow, and space utilization, which can be used to optimize building operations and improve sustainability. LBS can also enable smart automation systems [10] to respond to occupancy, bring in energy-efficiency automation, improve safety, and reduce accidents, especially in industrial or hazardous environments, where the precise location of people and equipment is critical for safety, and other contextual factors, allowing for the more efficient use of resources.
The Wi-Fi (IEEE 802.11) radio-propagation-based sustainable indoor positioning system is vital due to the low-cost hardware, use of existing infrastructure, and adaptability at scale among smartphone users due to its wide availability and ease of implementation. The positioning method, which uses the received signal strength indicator (RSSI) measuring technique [4,5] usually depends on the environmental factors, the placement of the access points, the surrounding structure, and signal interference. Since there is often a trade-off between accuracy, robustness, and practicability in the design of location-based services, RSSI-measurement-based IPS [11,12] is one of the most commonly used methods. RSSI is widely preferred due to its cost-effective approach and acceptable accuracy. The issues encountered by IPS in the practical environment are weak signals, NLOS, wireless channel variations, multi-path fading, the absence of adequate RSSI values of access points already being deployed in an indoor environment, barriers such as walls, floors, humans, or even temporary blocks like furniture in indoor environments, an inaccurate floor map that requires frequent updates, changes in access point position, changes in indoor environment that lead to an invalid fingerprint dataset. The Wi-Fi RSSI-based localization algorithm mainly depends on radio propagation behavior. The RSSI is used by the range-based algorithms to compute the distance between nodes since RSSI measurements are simple to use and consume less power compared to other methods. Trilateration, triangulation, and fingerprinting [13,14,15] are the most widely used RSSI-based localization techniques.
The trilateration/triangulation [4,5] algorithm uses the RSSI measurement technique to calculate the distance between the source access point and the receiving device. When there are more than three source signals available at a point, a triangle interfering point is formed to estimate the receiving device position. The radio propagation measurement technique requires the line of sight (LOS) [12,16] between the source and the receiving device (R). Any intervention in the signal’s path will create an NLOS, which affects the radio propagation, as depicted in Figure 1, and subsequently affects the IPS accuracy.
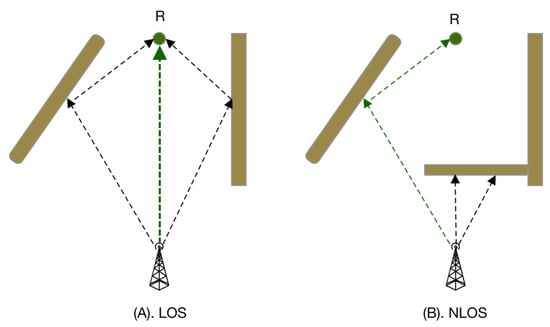
Figure 1.
Signal propagation path with LOS vs. NLOS (A) Signal propagation path with LOS. (B) Signal propagation path with NLOS.
The fingerprint-algorithm-based positioning is famous due to the practical viability of placement of the access points and the ability to use existing access point infrastructure, and is easily implementable using in-built smartphone sensors. The fingerprint-based IPS, which uses radio propagation strength-matching with pre-recorded RSSI value, does not require the LOS. The fingerprint method assumes a that complete radio map of every indoor geomantic coordination the user will travel is available and stored in the dataset.
The Wi-Fi fingerprinting-based IPS provides fine-grained localization based on RSSI measurement, and is susceptible to variations caused by external factors. The fingerprint algorithm conducts a KNN pattern-matching with the radio map stored during the position estimation. It requires the same intensity of radio propagation strength to match the pre-recorded value. If there are any changes in the access point location or newly introduced hindrances, these will affect the fingerprint algorithm’s accuracy. The fingerprint algorithm will also become more complex when implemented for a larger space and multiple locations since the matching algorithm must be compared with the entire fingerprint dataset to estimate the location.
The IPS-based on RSSI will not be useful where not enough radio propagation signals are available. This zone/area is called the dead zone [16,17], and Inertial Measurement Units (IMU) sensor-based positioning is used to overcome this positioning inconsistency. PDR [16,18,19], which uses the IMU sensor for distance measurement, has a drift error, and accumulates over distance and time. The PDR system performs very well for the short range of measurements and produces the desired accuracy. The practical IPS should be robust to identify the noise and a hybrid algorithm should be used to combine multiple techniques to estimate a user’s indoor position.
The proposed method presents a novel approach to address these challenges and improve the accuracy of sustainable IPS. The key contribution of the proposed technique that combines Wi-Fi fingerprinting and PDR is to mitigate the impact of external factors on indoor positioning accuracy by taking advantage of both methods and mitigating their respective limitations, resulting in an improved positioning accuracy and reliability. This method also reduces the KNN fingerprint algorithm’s complexity when implemented for multiple buildings/floors by selecting the neighborhood node’s limited set for comparison and identifying the floor and building. This paper addresses the important research gap of the RSSI weaknesses in a practical environment and proposes a solution to improve the robustness of fingerprint-based IPS. The proposed method selects the K nodes that are unaffected by the practical impediment and uses it in the K-NN Fingerprint [13] comparison to compute the user’s location and reduce the complexity of the algorithm by the fixed number of neighbors for comparison. In this paper, we focus on the sustainability of IPS in smart buildings and IoT applications, and the proposed approach improves the accuracy and robustness of IPS in real-world scenarios.
The remaining paper was organized as follows: Section 2 presents related work, Section 3 presents the current indoor positioning system and its drawbacks, Section 4 presents the proposed method of KNN selection for an RSSI-based indoor positioning system (KNN-SIPS), Section 5 presents the experimental setup and results, Section 6 presents the discussion and Section 7 presents the conclusion.
2. Related Work
The WIFI fingerprint technique [9,13,14] has been more widely used than any other sustainable indoor positioning method due to its advantages. The fingerprint-based indoor positioning system achieves an accuracy in the range of 2–5 m [13] for the wireless local area network (WLAN) RSS using the KNN comparison/probabilistic method with the recorded offline data. However, the accuracy deteriorates and increases to 40 m under practical circumstances [12]. The main factors in this deterioration are signal propagation behavior [12], path changes due to the NLOS [16], or eternal blocks in the path under practical conditions. All these factors will highly influence the RSSI signal measuring IPS, such as the trilateration/triangulation algorithm.
The LOS [16] or eternal block does not affect the fingerprint-based [15] positioning system, as this is considered during the offline record phase. It has a distance error range from 2 to 3 m in normal circumstances, without any new barriers to the access points. Nevertheless, the fingerprinting methodology’s accuracy is affected by any new obstacles, such as temporary or permanent constructions after the fingerprint dataset is recorded, any moment of furniture or access point location, and even human intervention [5,20] in the line of the signal [21,22,23]. Any change that occurs in the IPS environment after the offline phase would require that the fingerprint radio map is recreated by repeating the offline recording phase [13,18], which is cumbersome. These changes cannot be compensated during the training process and must be resolved while running the matching algorithm with the fingerprint dataset using the K-NN matching algorithm [24,25,26].
The RADAR [27] IPS tracks and locates the user’s indoor movement using radio frequency (RF) by recording and analyzing RSSI data at numerous access points are placed to offer overlapping coverage near the user. The RADAR provides an accuracy of 4 m with 50% probability, as the accuracy is low and has low robustness due to signal weakness, and is unreliable. In comparison to RADAR, our proposed method combines Wi-Fi fingerprinting and PDR to leverage the strengths of both techniques. By incorporating PDR for anomaly node detection, the proposed method can overcome the limitations of RADAR and enhance the overall accuracy and robustness of the system.
Horus [28] is a lightweight probabilistic technique that uses the location-clustering category method to reduce the algorithm’s computational complexity and address wireless channel variations. The main drawback [29] of this technique is that it provides robustness only to one-storey buildings [30,31]. UnLoc [31] and HALLWAY [31] based their work on Wi-Fi landmarking, where each landmark or room in the building is labeled (such as a corridor, living room, etc.) and mapped with the set of Wi-Fi access points with its signal strength range. The method UnLoc, HALLWAY has low accuracy and is affected by practical issues. The virtual compass (VC) [32] uses Wi-Fi signal-strength-based distance measuring techniques [33], which are affected by NLOS, multi-path fading, and signal hindrance, which results in low accuracy of 10 m and low robustness.
The Wi-Fi fingerprint technique requires a radio map specific to that environment to be recorded and expects the access point position to be the same as that in the training/recording phase [21,22], without any alterations. The floating error [16] in the fingerprinting method is caused by the Wi-Fi signal noise and multipath interference. It requires the maintenance of a correct radio map fingerprint dataset [24] to periodically estimate the precise position [16,34]. The location-aware map [9] uses the conscious position, camera image, and fusion of the [35] inertial sensor to solve this venture in a practical world.
In comparison to existing IPS such as Horus, UnLoc, HALLWAY, VC, other IPS using Wi-Fi fingerprint techniques have limitations in terms of accuracy, robustness, resilience, and applicability to specific building structures. In contrast, the proposed method offers novel contributions to address each limitation by introducing a robust anomaly node [20] detection mechanism by combining Wi-Fi fingerprinting and PDR, leveraging their complementary abilities to enhance sustainable indoor positioning with improved accuracy, resilience, and robustness in various building structures. The experimental results have demonstrated the effectiveness of the proposed method in improving IPS accuracy and reducing the impact of anomaly nodes.
3. The Current Indoor Positioning System
3.1. Wi-Fi Trilateration and Fingerprinting Method
The most common indoor positioning system uses RSSI is the trilateration [5,36] and fingerprint [24] method. Both methods use the K-NN algorithm to estimate the location. For the trilateration algorithm, the K is selected to be higher than three and as large as possible based on the Wi-Fi access points’ placement. In both methods, a higher K value (the number of nodes selected for the K-NN algorithm), reduces the noise in the output as it obtains an average, as shown in Equation (1). The trilateration method estimates the position, as shown in Figure 2, using the KNN algorithm. Selecting the K value to be larger than a certain point does not improve the algorithm’s accuracy [12] even when adequate access points are available. It is essential to select the neighboring AP [37] without any noise to participate in the KNN algorithm and improve the location accuracy. In trilateration-based IPS, the current location is estimated as follows:
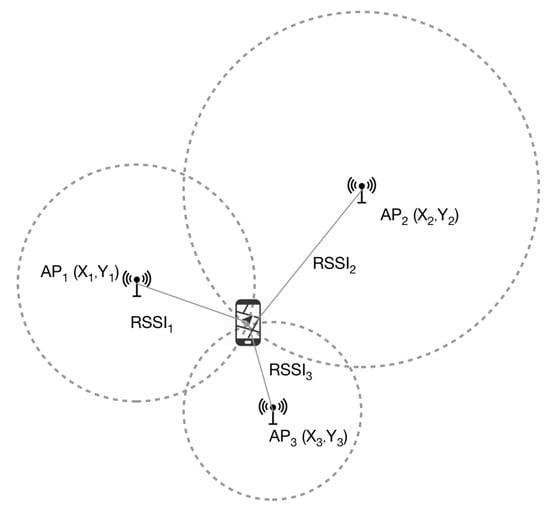
Figure 2.
Trilateration-based localization.
In Equation (1), is the current location, k is the number of nodes participating in the K-NN algorithm is the access point coordinate values.
Use of the Wi-Fi fingerprinting approach [5] to identify the user’s location has attracted much attention, since this method needs no line-of-sight from the access point’s signal. This method considers any irreversible distortion in the signal, blocks the signal during the offline/training phase and, therefore, does not rely on the LOS. The fingerprint-based positioning has a training/offline phase and an online phase, as shown in Figure 3. During the training phase, the indoor environment location’s radio map fingerprinting is recorded and saved in the centralized data storage.
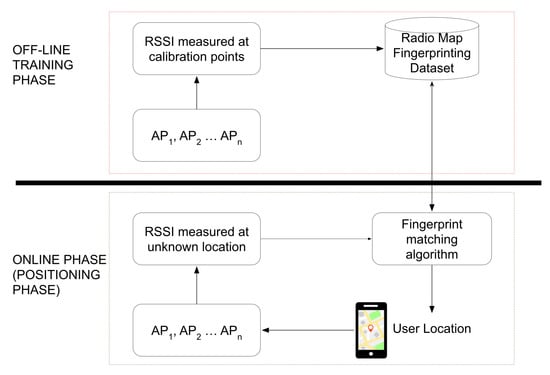
Figure 3.
Wi-Fi fingerprinting using K-NN for indoor positioning estimates.
During the offline phase, the recorded fingerprinting dataset takes account of LOS or other permanent barriers to the access point’s radio signal. A user’s indoor position can be estimated in the online phase by matching the RSSI values using the KNN matching algorithm. The offline phase takes a lot more time to collect all RSSI values in every position. If there are any adjustments in the Wi-Fi access point system or location, then all offline calibrations need to be repeated [35,38] and the process becomes cumbersome.
3.2. Pedestrian Dead Reckoning (PDR) Localization—Using Inertial Sensor of Smartphone
In an indoor positioning system [39], covering the entire area with adequate signals for every corner is very difficult, even with the careful placement of access points. An indoor environment where a sufficient number of signals from access points are inaccessible is known as a dead zone [40]. The positioning algorithm based on the RSSI measuring technique would no longer operate in these locations. Throughout the dead zone, the last known location of the Wi-Fi indoor positioning algorithm is used, along with the PDR system [40], to estimate the indoor location of the smartphone device. The PDR [17,19,41,42] system calculates the position by using the smartphone’s Inertial Measurement Units (IMU) sensors [43] (such as the gyroscope, accelerometer/step counter, and magnetometer sensor), as shown in Figure 4. The accelerometer/step counter is used to count the number of steps the user has taken from the last known position, a gyroscope to know the device’s orientation, and a magnetometer to determine the walking direction.
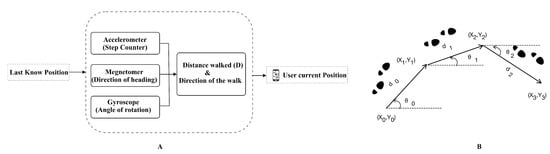
Figure 4.
(A) Estimation of position using the PDR method. (B) PDR Tracking using IMU sensors.
The PDR method estimates the walking distance (D) from the last known location using Equation (2) as follows:
where number-of-steps denotes the number of counted steps during the walk, determined using IMU sensors [41]; step-length denotes the length of the steps. The walking direction of the person is tracked using the IMU sensor [42] like a compass/magnetometer. In the PDR method, the current position is estimated using the distance walked and the user’s direction. Nevertheless, the main downside of the PDR method is that it only provides reasonable precision for a short range. For this reason, in the proposed method, the PDR location is computed based on the last known location computed by fingerprinting technique for a maximum of 8 steps, which is an approximately 2.5–4 M distance [43]. At each step, any change in direction () is continuously tracked, as shown in Figure 4B, using the sensor magnetometer compass. The PDR location estimate considers the number of steps, step length, and change in direction at each step. The PDR system’s distance error for the short range of up to 8 M is around 4 M. The step-length denotes the size of the steps. Generally, step length is estimated using the static method or a dynamic method. The static method is simple to calculate, whereas the dynamic method provides a more robust step-length measurement. The static method assumes that any step detected has the same step length, and, surprisingly, is the constant human natural walking step length [20]. In the static method, the step length is calculated using Equation (3) [39,44,45], which measures the mobile phone acceleration signal (using the accelerometer) to determine the step frequency at time t, as shown below:
where h is the height of the pedestrian, denotes the step frequency coefficient, denotes the step constant h, and denotes the step constant. The average step length [41] for adults is approximately 0.75 m (2.5 feet). However, this can vary depending on the user’s height, gender, and walking speed.
The adaptive method uses the mobile phone’s sensors to compute the step length of the user based on their walking pattern. The adaptive method is generally considered more accurate than the static method, as it can account for individual differences in gait and walking speed. To calculate step length using the adaptive method, the mobile phone’s accelerometer data are used to identify the steps and compute the step length based on the walking pattern of a user.
One common approach is to use a zero-velocity update (ZUPT) algorithm [18,46], which detects when the user is stationary and resets the step length and step count estimations. The step length can then be estimated based on the acceleration [47] data during each step. The ZUPT algorithm is used in PDR systems to detect when the user is stationary and reset the step count and step length estimation. This is important because errors can accumulate in the step length estimation and step count when the user is not moving, leading to inaccuracies in the estimated position. The ZUPT algorithm works by detecting periods of zero velocity in the accelerometer data. When the user is stationary, the acceleration data should be close to zero in all three dimensions (x, y, z). The algorithm detects these periods of zero velocity by comparing the magnitude of the acceleration data to a threshold value. If the magnitude is below the threshold for a certain period of time, the algorithm assumes that the user is stationary and resets the step count and step length estimation.
The ZUPT algorithm is widely used since it has a lower average displacement error and standard deviation compared with Static, Weinberg, and Fuqiang Gu methods. The ZUPT method proposes a straightforward solution, as shown in Algorithm 1, which illustrates a correlation between the values of the maximum, minimum, and average step length acceleration. Figure 4B depicts the PDR vector tracking using the IMU sensors. The method uses the step detection method to estimate the constant factor . This method involves first detecting steps using an initial step length estimate based on the height of the user and then adjusting the step length estimate by minimizing the variation between expected and real step lengths. The optimal value of is then taken as the number of previous steps that are used to estimate the current step length. The algorithm starts from the last known position , and estimates the step length L(i) and the number of steps S(i) to in a direction (i) to estimate the new location ; the process is repeated with the new last known position to estimate the complete trajectory of the travel.
| Algorithm 1 ZUPT algorithm for estimating step length, step count, and position |
|
4. The Proposed Method: KNN Selection for RSSI-Based Indoor Positioning System (KNN-SIPS)
In a practical environment, achieving sustainable indoor positioning is complex. The Wi-Fi-based positioning system suffers from substantial errors due to many external factors, such as signal inconsistency, signal loss caused by the external barrier, and the NLOS propagation signal [20,34] weakness.
The proposed Algorithm 2 selects the K nodes that are not affected and uses the in the KNN fingerprinting comparison algorithm [24,48], as shown in Figure 5, to improve accuracy. The proposed method conducts sensor fusion by continuously estimating the position using the IMU sensor and the PDR method. This estimated position is considered as the reference location to select K nodes (access points) from the list of scanned access points.
| Algorithm 2 Pseudocode for K Node selection for K-NN algorithm |
|
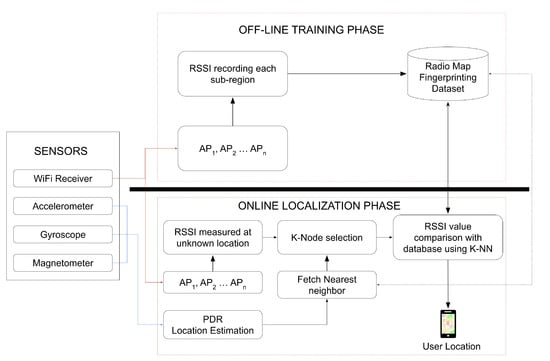
Figure 5.
Wi-Fi fingerprinting using Selected KNN for indoor positioning estimate.
Where AP is an access point, is the scanned access point list and is the RSSI values of the access point . “K” is the number of the scanned Wi-Fi access points where we are conducting the position estimation. is the subset of nodes from the list of scanned Wi-Fi access points that are not affected by any practical hindrance, selected using “K selection for KNN algorithm”. The algorithm computes the current location continuously using the PDR method . The PDR has been configured to have a maximum number of steps, counted as 8, to limit the PDR measure to a short distance of up to 4–6 m from the last known locations. Any change in direction within these 8 steps is continuously tracked using the magnetometer sensor of IMU. The proposed approach takes advantage of PDR’s short-range desired accuracy, and the algorithm limits the use of PDR reference location up to 8 steps or 4–6 M. The estimated location takes the number of steps into account, along with the step length and the change in direction, as explained in Section 3.2. The estimated location is considered as the reference point to obtain the list of the neighbor cell access points with its RSSI min and max value of within the threshold , which depends on the PDR error rate value for short-range distances of up to 4 m [14].
The parallel algorithm scans the access point list from the current location . Each scanned access point’s RSSI value is evaluated to check its occurrence within the neighboring cell for the same access point’s values. Any access point RSSI value that falls within the range is added as a selected K nodes list to participate in the KNN matching algorithm of the fingerprinting [49] technique. The proposed KNN fingerprint matching algorithm uses the selected node, which has no or less noise, to compute the smartphone user’s location. The results of the experiment demonstrate that the proposed algorithm improves the traditional fingerprinting method’s location accuracy and robustness to handle the practical environment.
5. Experimental Setup and Results
The first experiment was conducted on the testbed environment to understand the RSSI behavior in an open and complex environment. The open space environment provides an LOS between the signal transmission and the receiver, without any barrier in the signal’s path. In contrast, the complex environment has NLOS due to barriers in the path and human interventions. It does not provide LOS for the signal, which is closer to the realistic indoor environment’s reflection. We measured the RSSI propagation signal at a constant distance in open space and complex environments and plotted the graph to see the signal error in the complex environment. We can observe that the error difference in RSSI signal propagation ranges from 10 to 50 dBM, and the distance error is within the range of 4–12 m, as shown in Figure 6.
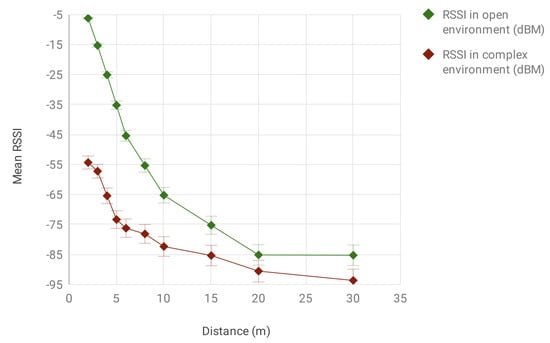
Figure 6.
RSSI behavior in the LOS vs. NLOS environment.
Figure 7 demonstrates the second experiment testbed under experimental conditions to test the KNN-SIPS algorithm. The details of the dataset collected during the offline phase of fingerprinting algorithm in the testbed environment are as follows:
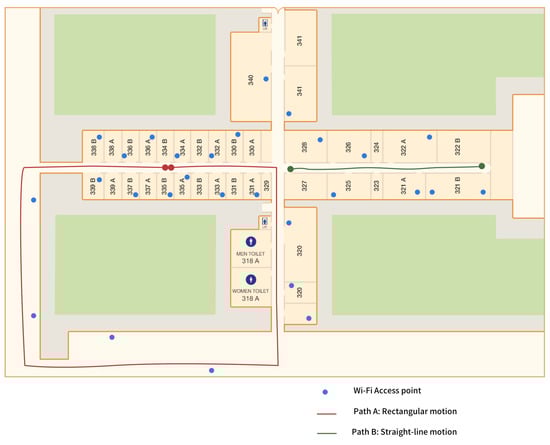
Figure 7.
Floor plan of the testbed with the placement of the access point.
- The testbed area measures m2 in dimension and is divided into cells of m2 to form 1160 cells.
- All the divided cells were labeled with space IDs ranging from 1 to 1160.
- A total of 52 access points were deployed in the testbed. Each access point was surrounded by a complex environment in different LOS and NLOS conditions.
- At each cell, four scans of Wi-Fi RSSI values were measured using an Android app running on a standard Android smartphone that used the inbuilt Wi-FI scanning functionality, and the mean value was recorded in the database, along with the space ID, which acts as the reference point.
- The offline phase recording considers preexisting LOS and NLOS conditions. The collected dataset against each cell provides good coverage for the fingerprinting algorithm. The real-world indoor environment ensures the generalization of the proposed framework.
- The dataset the location coordinate (X, Y), space ID representing a cell, and a list of scanned access points. The scanned access point has a unique identifier key, and its value .
- The collected dataset is processed under human supervision to ensure quality; for ethical considerations, we obtained informed consent, protecting privacy and complying with legal guidelines.
The Wi-Fi fingerprint [35] radio map is generated with a displacement of every 2 m using the training phase around the floor. The experiment was performed using the fingerprinting technique and the KNN-SIPS approach was used to find the mobile device’s current location at different locations within the testbed area, as shown in Table 1. There were multiple human barriers in the testbed area, which affected the Wi-Fi access point’s radio signals. The K with scanned access points with an RSSI value higher than −85 dBm was used in the KNN algorithm since an RSSI with a lesser value will not significantly change the position estimation.

Table 1.
Comparison of fingerprint algorithm (FP) vs. the proposed algorithm (SIP-KNN).
Table 1 depicts a comparison between the standard fingerprinting algorithm vs. the proposed method, along with its distance error. We have shown the test data, where the proposed algorithm has superior accuracy for comparison. The offline/training phase data were collected in each divided cell of mm and the scanned access points list was recorded, along with its RSSI values, scanned cell position (X, Y), and space ID for the identification of an individual cell in the testbed area. The offline collected data were saved in the centralized radio map dataset.
The standard fingerprinting algorithm scans the access points list and their RSSI values in the online phase for comparison with the centralized data using the KNN matching algorithm. The proposed algorithm selects only limited Knodes (access points) from the list of scanned access points using the estimated position of the target node, using the PDR method as the reference point. The algorithm considers the close neighbor cell access point (up to 4 m as a threshold T, which is the maximum error rate of the PDR positioning method for a short range), along with its RSSI values. Each scanned access point’s RSSI value is checked with the min and max value of the considered neighborhood cell RSSI to select any access point RSSI that falls within this range. Using the selected K access point, the target node position estimate was made using the KNN matching fingerprint algorithm within the PDR reference point. Therefore, the complexity and energy consumption of the position estimation algorithm of the target node are low. Table 1 also presents the online phase distance error, a comparison between the standard fingerprinting algorithm and the proposed algorithm.
The difference between the estimated location and the actual position in a position estimate system is represented by the distance error (DE), as illustrated in the below Equations (4) and (5):
The fingerprinting position [49,50] has an average distance error in the range from 8 to 28 m, which is caused by the temporary barriers/obstacles in the LOS of the access point’s RSS. By comparison, the suggested method has an average distance error in the range from 1.2 to 4 m, as depicted in Figure 8. The proposed method selects the nodes from the K list of scanned access points to participate in the KNN algorithm. The proposed algorithm continues tracking using the PDR method to estimate user location, which acts as the reference location. Using the reference location, it fetches the neighborhood cells’ RSSI minimum and maximum location value, comparing and eliminating any access point value that does not fall within the range of the neighborhood access point RSSI value. This approach not only improves the accuracy of indoor positioning systems but also contributes to the sustainability of smart buildings by reducing the need for frequent updates to the fingerprint dataset, thereby minimizing energy consumption and waste. Additionally, it fetches the closest neighbor fingerprinting dataset to check the matching fingerprint from the neighborhood subset, further improving the precision of the system while reducing its environmental impact.
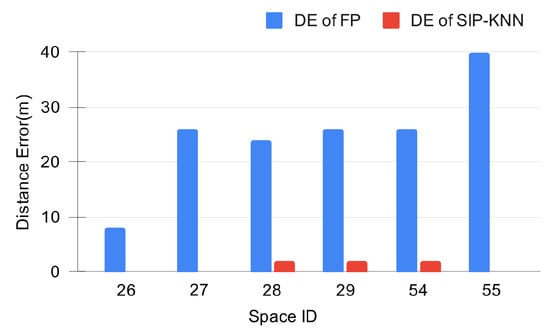
Figure 8.
Distance Error of fingerprint algorithm (FP) vs. the proposed algorithm (SIP-KNN).
By examining the average location error for both the fingerprint algorithm (without anomaly nodes and with an increase in number of anomaly nodes/NLOS) and the proposed algorithm (with anomaly nodes), Figure 9 provides a comprehensive understanding of the performance improvement achieved by the proposed algorithm in the presence of anomaly nodes. In Figure 9, the red line depicts the effect of the anomaly node due to NLOS in fingerprinting-based IPS localization error, compared with the absence of the anomaly node given by the blue line. The red line clearly indicated that, with the increase in the number of anomaly nodes/NLOS, the localization error drastically increases. This visualization allows for a direct comparison of the impact of anomaly nodes on the fingerprinting algorithm’s performance. Additionally, the green line represents the localization error of our proposed algorithm, which exhibits lower error rates compared to the Wi-Fi fingerprint IPS with anomaly nodes. These findings clearly demonstrate the effectiveness and robustness of our proposed algorithm, highlighting its potential advantages over existing fingerprinting methods.
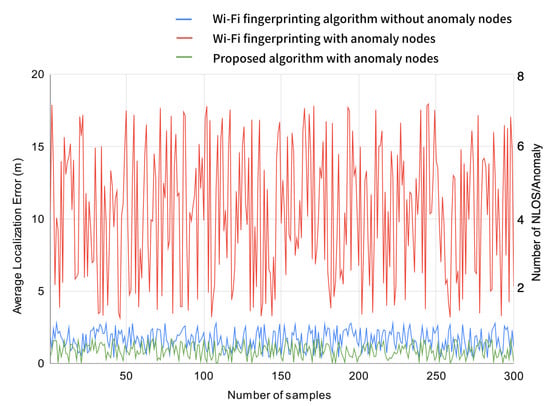
Figure 9.
Average Location Error of fingerprint algorithm (FP) without anomaly nodes/with an increase in NLOS vs. the proposed algorithm with anomaly nodes.
6. Discussion
In the testbed environment, the system’s effectiveness was assessed along the pathways (Path A, Path B), Table 2 provides path details about the number of direction changes from the start to end of the path, the total distance covered by each path, and the number of unique scanned access point RSSIs along the path. In the testbed, along with Path A and Path B, as shown in Figure 7, we set up multiple barriers and human interventions along the signal propagation path. The mean distance error is determined by averaging the DE for all positions in the travel direction. From Figure 9, the proposed method is shown to have fewer location errors and better accuracy when compared with the standard fingerprinting algorithm. The mean distance error rises proportionately with the increase in the number of barriers/blocks to the radio signal, as depicted in Table 3. By tracking the direction and monitoring over time, we can determine whether the change in the environment is transient (like a person walking by the access point) or by a permanent factor (such as a new construction, or a change in the location of the access point). This will show when to return to the offline recording phase over time.
Table 2.
Path Detals of Experiment Testbed.
Table 3.
Mean Distance Error (m) vs. Number of affected Node in K-NN.
Table 4 presents a comparison of standard WLAN IPS and shows that most of the position algorithm accuracy is affected in the practical scenario when the signal propagation of access points to the receiving is retarded and the overall accuracy of the IPS system goes up to 40 m. The RADAR [27] uses radio frequency (RF) recording and processing signal strength by combining empirical measurements with signal propagation modeling to estimate the position. This method expects no change in the environment from the recording, and any alterations to the surroundings or the location of the access point will affect the positioning accuracy. Horus [28] works based on probabilistic techniques, which estimate the position based on the scanned access point list, and calculates each location’s probability in the radio map set based on the given observation sequence from this access. If the access point at the top of the list is affected by environmental changes, the algorithm compromises the accuracy of the position estimate. UnLoc [29] and HALLWAY [29] work manually by marking the space or the room during the offline phase recording of RF signals when there is no change in the environment or temporary blocks in the path signal propagation after offline recordings. The VC [29] works on the RSSI-based distance measuring technique, and the algorithm requires an LOS without any change in the access point location from the initial access point position. The proposed method (KNN-SIPS) addresses the root cause of signal weakness post-recording due to anomaly/affected nodes in the positioning system by selecting the K node that is not affected to participate in the KNN comparison algorithm. The proposed method shows that it is resilient to any change in the environment and produces an accuracy of 2–4 m under these conditions. The proposed system overcomes this issue, reduces the fingerprint KNN algorithm’s complexity, and produces the desired robustness and accuracy. The deployed method depends on the last known position (LKP) and considers the LKP error via threshold (TDR) for a short distance. The error of the LKP beyond the TDR for the short-range will influence the positioning estimate’s accuracy.
Table 4.
Comparison of Standard WLAN IPS vs. Proposed System.
7. Conclusions
Location-based services for an indoor environment are necessary and help to estimate a smartphone user’s location in an indoor environment. Due to the Wi-Fi signal coverage area, RSSI-based LBS are simple to implement, accessible, and comprehensive, where the Wi-Fi fingerprinting techniques are becoming a popular algorithm in indoor positioning. In the practical scenario, when implementing the fingerprint algorithm for multiple floors and locations, the complexity of running the algorithm is high since the KNN matching algorithm must compare fingerprints with all data in the dataset and, in the presence of new, temporary, or permanent obstacles [20,23], the K-NN fingerprinting method generates a high distance error. This condition requires a repetition of the offline phase, a laborious and tedious process.
The proposed method of combining PDR and Wi-Fi fingerprinting for anomaly node detection in indoor positioning systems has practical relevance in various domains. For example, it can be applied in the field of indoor navigation, enabling users to determine their location accurately and reliably, even in complex indoor environments. This has implications for a range of applications such as logistics, emergency response, and retail, where indoor navigation plays a crucial role. In addition, the proposed method can be used to enhance location-based services (LBS) that rely on indoor positioning systems. By providing more accurate and reliable location data, the proposed method can improve the quality and effectiveness of LBS applications in various domains, such as in-house stock routes, smart buildings, contact tracking, clinical routing, and healthcare. Furthermore, the proposed method can be used to improve the performance of autonomous robots and drones in indoor environments, enabling them to navigate safely and accurately. Overall, the practical relevance of this proposed method is significant and has the potential to make a meaningful impact in a range of real-world applications, ultimately supporting the sustainability of indoor environments.
In the KNN algorithm, larger K values reduce the overall error by increasing accuracy. Beyond a certain K value, this does not help to enhance the system’s accuracy. The system’s accuracy can be enhanced by selecting the K-appropriate nodes, avoiding the affected nodes to estimate the position using the fingerprint algorithm. The proposed KNN-SIPS approach selects the optimal K nodes with no or less noise for the K-NN fingerprinting algorithm to compute the current location, thereby improving the accuracy of the location estimate. This reduces the algorithm’s complexity by reducing the search space using the PDR method location as a reference position. Future research could explore the application of our method in large-scale indoor environments and evaluate its performance. Overall, our work contributes to the advancement of sustainable indoor positioning systems and provides a solid foundation for further research in this field.
Author Contributions
Conceptualization, B.B.; methodology, B.B.; software, B.B.; validation, B.B. and S.M.; formal analysis, B.B.; investigation, B.B.; resources, B.B.; data curation, B.B.; writing—original draft preparation, B.B.; writing—review and editing, B.B. and S.M.; visualization, B.B.; supervision, S.M. All authors have read and agreed to the published version of the manuscript.
Funding
This research received no external funding.
Institutional Review Board Statement
Not applicable.
Informed Consent Statement
Not applicable.
Data Availability Statement
Not applicable.
Conflicts of Interest
The authors declare no conflict of interest.
References
- Guo, X.; Ansari, N.; Hu, F.; Shao, Y.; Elikplim, N.; Li, L. A survey on fusion-based indoor positioning. IEEE Commun. Surv. Tutor. 2019, 22, 566–594. [Google Scholar] [CrossRef]
- Martin, E.; Vinyals, O.; Friedl, G.; Bajcsy, R. Precise indoor localization using smart phones. In Proceedings of the 18th ACM International Conference On Multimedia, Firenze, Italy, 25–29 October 2010; pp. 787–790. [Google Scholar]
- Junglas, I.; Watson, R. Location-based services. Commun. ACM 2008, 51, 65–69. [Google Scholar] [CrossRef]
- Sadowski, S.; Spachos, P. Rssi-based indoor localization with the internet of things. IEEE Access 2018, 6, 30149–30161. [Google Scholar] [CrossRef]
- Davidson, P.; Piche, R. A survey of selected indoor positioning methods for smartphones. IEEE Commun. Surv. Tutor. 2016, 19, 1347–1370. [Google Scholar] [CrossRef]
- Zhuang, H.; Zhang, J.; C. B., S.; Muthu, B. Sustainable smart city building construction methods. Sustainability 2020, 12, 4947. [Google Scholar] [CrossRef]
- Farahsari, P.; Farahzadi, A.; Rezazadeh, J.; Bagheri, A. A survey on indoor positioning systems for iot-based applications. IEEE Internet Things J. 2022, 9, 7680–7699. [Google Scholar] [CrossRef]
- Zhang, C.; Ding, J.; Zhan, J.; Sangaiah, A.; Li, D. Fuzzy Intelligence Learning Based on Bounded Rationality in IoMT Systems: A Case Study in Parkinson’s Disease. IEEE Trans. Comput. Soc. Syst. 2022. [Google Scholar] [CrossRef]
- Liu, T.; Zhang, X.; Zhang, H.; Tahir, N.; Fang, Z. A structure landmark-based radio signal mapping approach for sustainable indoor localization. Sustainability 2021, 13, 1183. [Google Scholar] [CrossRef]
- Sangaiah, A.; Javadpour, A.; Ja’fari, F.; Zavieh, H.; Khaniabadi, S. SALA-IoT: Self-Reduced Internet of Things with Learning Automaton Sleep Scheduling Algorithm. IEEE Sens. J. 2023. [Google Scholar] [CrossRef]
- Sadowski, S.; Spachos, P.; Plataniotis, K. Memoryless techniques and wireless technologies for indoor localization with the internet of things. IEEE Internet Things J. 2020, 7, 10996–11005. [Google Scholar] [CrossRef]
- Whitehouse, K.; Karlof, C.; Culler, D. A practical evaluation of radio signal strength for ranging-based localization. Acm Sigmobile Mob. Comput. Commun. Rev. 2007, 11, 41–52. [Google Scholar] [CrossRef]
- Basri, C.; El Khadimi, A. Survey on indoor localization system and recent advances of WIFI fingerprinting technique. In Proceedings of the 2016 5th International Conference On Multimedia Computing And Systems (ICMCS), Marrakech, Morocco, 29 September–1 October 2016; pp. 253–259. [Google Scholar]
- Jia, B.; Huang, B.; Gao, H.; Li, W.; Hao, L. Selecting critical WiFi APs for indoor localization based on a theoretical error analysis. IEEE Access 2019, 7, 36312–36321. [Google Scholar] [CrossRef]
- He, S.; Chan, S. Wi-Fi fingerprint-based indoor positioning: Recent advances and comparisons. IEEE Commun. Surv. Tutor. 2015, 18, 466–490. [Google Scholar] [CrossRef]
- Yang, Z.; Wu, C.; Liu, Y. Locating in fingerprint space: Wireless indoor localization with little human intervention. In Proceedings of the 18th Annual International Conference On Mobile Computing And Networking, Istanbul, Turkey, 22–26 August 2012; pp. 269–280. [Google Scholar]
- Sung, Y. RSSI-based distance estimation framework using a Kalman filter for sustainable indoor computing environments. Sustainability 2016, 8, 1136. [Google Scholar] [CrossRef]
- Zhang, R.; Yang, H.; Höflinger, F.; Reindl, L. Adaptive zero velocity update based on velocity classification for pedestrian tracking. IEEE Sens. J. 2017, 17, 2137–2145. [Google Scholar] [CrossRef]
- Pratama, A.; Hidayat, R. Smartphone-based pedestrian dead reckoning as an indoor positioning system. In Proceedings of the 2012 International Conference On System Engineering And Technology (ICSET), Bandung, Indonesia, 11–12 September 2012; pp. 1–6. [Google Scholar]
- Bonthu, B.; Subaji, M. An effective algorithm to overcome the practical hindrance for Wi-Fi based indoor positioning system. Open Comput. Sci. 2020, 10, 117–123. [Google Scholar] [CrossRef]
- Ahmad, N.; Sahibuddin, S. Effect of people around user to WLAN indoor positioning system accuracy. In Proceedings of the 2017 Palestinian International Conference On Information And Communication Technology (PICICT), Gaza, Palestine, 8–9 May 2017; pp. 17–21. [Google Scholar]
- Wu, C.; Yang, Z.; Zhou, Z.; Qian, K.; Liu, Y.; Liu, M. PhaseU: Real-time LOS identification with WiFi. In Proceedings of the 2015 IEEE Conference On Computer Communications (INFOCOM), Hong Kong, China, 26 April–1 May 2015; pp. 2038–2046. [Google Scholar]
- Fu, Y.; Chen, P.; Yang, S.; Tang, J. An indoor localization algorithm based on continuous feature scaling and outlier deleting. IEEE Internet Things J. 2018, 5, 1108–1115. [Google Scholar] [CrossRef]
- Amirisoori, S.; Daud, S.M.; Ahmad, N.A.; Abd Aziz, N.S.; Sa’at, N.I.; Noor, N.Q. Wi-Fi based indoor positioning using fingerprinting methods (KNN algorithm) in real environment. Int. J. Future Gener. Commun. Netw. 2017, 10, 23–36. [Google Scholar] [CrossRef]
- Umair, M.; Ramana, K.; Dongkai, Y. An enhanced K-Nearest Neighbor algorithm for indoor positioning systems in a WLAN. In Proceedings of the 2014 IEEE Computers, Communications And IT Applications Conference, Toronto, ON, Canada, 27 April–2 May 2014; pp. 19–23. [Google Scholar]
- Yadav, R.; Bhattarai, B.; Gang, H.; Pyun, J. Trusted k nearest bayesian estimation for indoor positioning system. IEEE Access 2019, 7, 5148–5149. [Google Scholar] [CrossRef]
- Bahl, P.; Padmanabhan, V. RADAR: An in-building RF-based user location and tracking system. In Proceedings of the IEEE INFOCOM 2000. Conference on Computer Communications. Nineteenth Annual Joint Conference of The IEEE Computer And Communications Societies (Cat. No. 00CH37064), Tel Aviv, Israel, 26–30 March 2000; Volume 2, pp. 775–784. [Google Scholar]
- Youssef, M.; Agrawala, A. The Horus WLAN location determination system. In Proceedings of the 3rd International Conference on Mobile Systems, Applications, and Services, Helsinki, Finland, 18–22 June 2023; pp. 205–218. [Google Scholar]
- Liu, H.; Darabi, H.; Banerjee, P.; Liu, J. Survey of wireless indoor positioning techniques and systems. IEEE Trans. Syst. Man Cybern. Part Appl. Rev. 2007, 37, 1067–1080. [Google Scholar] [CrossRef]
- Youssef, M.; Agrawala, A. Handling samples correlation in the horus system. In Proceedings of the IEEE Infocom 2004, Hong Kong, China, 7–11 March 2004; Volume 2, pp. 1023–1031. [Google Scholar]
- Al Nuaimi, K.; Kamel, H. A survey of indoor positioning systems and algorithms. In Proceedings of the 2011 International Conference On Innovations in Information Technology, Abu Dhabi, United Arab Emirates, 25–27 April 2011; pp. 185–190. [Google Scholar]
- Banerjee, N.; Agarwal, S.; Bahl, P.; Chandra, R.; Wolman, A.; Corner, M. Virtual compass: Relative positioning to sense mobile social interactions. In Proceedings of the Pervasive Computing: 8th International Conference, Pervasive 2010, Helsinki, Finland, 17–20 May 2010; pp. 1–21. [Google Scholar]
- Lim, C.; Volakis, J.; Sertel, K.; Kindt, R.; Anastasopoulos, A. Indoor propagation models based on rigorous methods for site-specific multipath environments. IEEE Trans. Antennas Propag. 2006, 54, 1718–1725. [Google Scholar] [CrossRef]
- Bose, A.; Foh, C. A practical path loss model for indoor WiFi positioning enhancement. In Proceedings of the 2007 6th International Conference On Information, Communications & Signal Processing, Singapore, 10–13 December 2007; pp. 1–5. [Google Scholar]
- Xia, S.; Liu, Y.; Yuan, G.; Zhu, M.; Wang, Z. Indoor fingerprint positioning based on Wi-Fi: An overview. Isprs Int. J. Geo-Inf. 2017, 6, 135. [Google Scholar] [CrossRef]
- Ge, X.; Qu, Z. Optimization WIFI indoor positioning KNN algorithm location-based fingerprint. In Proceedings of the 2016 7th IEEE International Conference On Software Engineering And Service Science (ICSESS), Beijing, China, 26–28 August 2016; pp. 135–137. [Google Scholar]
- Xue, W.; Hua, X.; Li, Q.; Yu, K.; Qiu, W. Improved neighboring reference points selection method for Wi-Fi based indoor localization. IEEE Sens. Lett. 2018, 2, 1–4. [Google Scholar] [CrossRef]
- Liu, H.; Gan, Y.; Yang, J.; Sidhom, S.; Wang, Y.; Chen, Y.; Ye, F. Push the limit of WiFi based localization for smartphones. In Proceedings of the 18th Annual International Conference On Mobile Computing And Networking, Istanbul, Turkey, 22–26 August 2012; pp. 305–316. [Google Scholar]
- Xiao, Z.; Wen, H.; Markham, A.; Trigoni, N. Robust indoor positioning with lifelong learning. IEEE J. Sel. Areas Commun. 2015, 33, 2287–2301. [Google Scholar] [CrossRef]
- Sun, Z.; Mao, X.; Tian, W.; Zhang, X. Activity classification and dead reckoning for pedestrian navigation with wearable sensors. Meas. Sci. Technol. 2008, 20, 015203. [Google Scholar] [CrossRef]
- Huu, K.N.; Seong-Won, S.; Song, C.G.; Lee, S.W. A step detection and step length estimation method based on different holding styles estimation. KCC 2015, 359–361. [Google Scholar]
- Chen, R.; Pei, L.; Chen, Y. A smart phone based PDR solution for indoor navigation. In Proceedings of the 24th International Technical Meeting of The Satellite Division of The Institute of Navigation (ION GNSS 2011), Portland, OR, USA, 20–23 September 2011; pp. 1404–1408. [Google Scholar]
- Chen, L.; Wu, E.; Jin, M.; Chen, G. Intelligent fusion of Wi-Fi and inertial sensor-based positioning systems for indoor pedestrian navigation. IEEE Sens. J. 2014, 14, 4034–4042. [Google Scholar] [CrossRef]
- Gu, F.; Khoshelham, K.; Yu, C.; Shang, J. Accurate step length estimation for pedestrian dead reckoning localization using stacked autoencoders. IEEE Trans. Instrum. Meas. 2018, 68, 2705–2713. [Google Scholar] [CrossRef]
- Ang, J.L.; Lee, W.K.; Ooi, B.Y.; Ooi, T.W. An IPS evaluation framework for measuring the effectiveness and efficiency of indoor positioning solutions. In Information Science and Applications 2017: ICISA 2017 8; Springer: Singapore, 2017; pp. 688–697. [Google Scholar]
- Scarlett, J. Enhancing the performance of pedometers using a single accelerometer. Appl. Note Analog. Devices 2007, 41, 1–16. [Google Scholar]
- Kang, W.; Han, Y. SmartPDR: Smartphone-based pedestrian dead reckoning for indoor localization. IEEE Sens. J. 2014, 15, 2906–2916. [Google Scholar] [CrossRef]
- Dai, P.; Yang, Y.; Wang, M.; Yan, R. Combination of DNN and improved KNN for indoor location fingerprinting. Wirel. Commun. Mob. Comput. 2019, 2019, 4283857. [Google Scholar] [CrossRef]
- Hoang, M.; Zhu, Y.; Yuen, B.; Reese, T.; Dong, X.; Lu, T.; Westendorp, R.; Xie, M. A soft range limited K-nearest neighbors algorithm for indoor localization enhancement. IEEE Sens. J. 2018, 18, 10208–10216. [Google Scholar] [CrossRef]
- Xie, Y.; Wang, Y.; Nallanathan, A.; Wang, L. An improved K-nearest-neighbor indoor localization method based on spearman distance. IEEE Signal Process. Lett. 2016, 23, 351–355. [Google Scholar] [CrossRef]


Disclaimer/Publisher’s Note: The statements, opinions and data contained in all publications are solely those of the individual author(s) and contributor(s) and not of MDPI and/or the editor(s). MDPI and/or the editor(s) disclaim responsibility for any injury to people or property resulting from any ideas, methods, instructions or products referred to in the content. |
© 2023 by the authors. Licensee MDPI, Basel, Switzerland. This article is an open access article distributed under the terms and conditions of the Creative Commons Attribution (CC BY) license (https://creativecommons.org/licenses/by/4.0/).