Article

Experimental Investigation on Thermal Conductivity of Straw Boards Based on the Temperature Control Box—Heat Flux Meter Method

1
School of Civil Engineering, Harbin Institute of Technology, Harbin 150090, China
2
Key Lab of Structures Dynamic Behavior and Control of the Ministry of Education, Harbin Institute of Technology, Harbin 150090, China
*
Author to whom correspondence should be addressed.
Sustainability 2023, 15(14), 10960; https://doi.org/10.3390/su151410960
Submission received: 27 May 2023 / Revised: 30 June 2023 / Accepted: 11 July 2023 / Published: 13 July 2023
(This article belongs to the Special Issue Sustainable Structures and Construction in Civil Engineering)

Abstract

:
Straw boards are the environmentally-friendly and sustainable materials used for building envelopes. To validate a novel alternative test method of thermal conductivity (λ), temperature control box–heat flux meter method (TCB-HFM), and better understand the thermal properties of straw boards, experimental investigation on two types of straw boards using such a method was carried out. Moreover, the control test via the conventional guarded hot plate method (GHP) was conducted to provide a benchmark. Results show that the fluctuation amplitudes of the temperature difference and heat flux density for the TCB-HFM during the steady state are much smaller than a generally acceptable limitation of 5%, and a 5.9% deviation of λ between the two test methods is in a reasonable range. It is indicated that the TCB-HFM can be regarded as an alternative test method to conduct investigations on the thermal properties of materials. Furthermore, the correlation between density and λ is explored and expressed by a linear fitting formula with the determination coefficient (R2) of 0.9193, and the formula is verified to have the feasibility to predict the λ of different types of straw bio-based materials.

1. Introduction

As one of the most high-yield agricultural wastes, straw has many advantages, such as low thermal conductivity, sustainability, low cost, waste reusing, and environmental protection, which contributes to the potential use for envelopes in green buildings. The relevant research about straw bio-based material shows that such material used for envelopes can benefit indoor comfort by adjusting indoor temperature and relative humidity [1,2], in which the straw bio-based material mainly includes straw bales and straw composites. Consequently, thermal properties, as well as some other key physical properties relating to building envelope performances of straw bio-based materials, have been widely concerned in recent years [3].
Thermal conductivity is the parameter that intuitively describes the insulation capacity of materials, which attracts most of the research attention. For the straw bales produced from the straws in the field by compression and baling, previous studies have reported that a range of thermal conductivity varies from 0.033 W/(m·K) to 0.19 W/(m·K), and it is found that the variability can be caused by the types of straw, fiber orientation, ambient temperature, relative humidity, and especially the density [4,5,6,7,8,9,10,11,12,13]. Such studies involve straw types of wheat, rice, barley, and rice, fiber orientations including perpendicular and parallel to the heat flow, ambient temperature ranging from 10 °C to 40 °C, relative humidity varying from 10% to 80%, and density within the range of 35 kg/m3~350 kg/m3. As for the straw composites manufactured from short straw fibers and binders that are generally molded as boards by pressing, the influence factors on thermal conductivity are similar to those of the straw bales but with an extra factor of binder type. The densities of straw composites cover a wider range compared with those of the straw bales, with a maximum value of 700 kg/m3 [14]. Higher density usually results in greater thermal conductivity. For instance, the thermal conductivity of a pozzolanic straw composite with a density of 661 kg/m3 is 0.146 W/(m·K) [15]. On the whole, the densities of straw bio-based materials involved in current studies are still in a small range. However, as the straw bio-based material is gradually applied in building envelopes, the requirement for load-bearing capacity presents, which promotes the development of such material towards higher density. Thus, investigations on the thermal properties of high-density straw bio-based materials are in demand to complement the gaps of the existing studies and serve for engineering applications.
At present, the steady-state experimental investigations on the thermal properties of insulation materials are mainly performed based on three test methods, the heat flux meter method, guarded hot plate method, and hot box method, respectively [16]. The corresponding test methods and principles have been specified in international and Chinese standards including ISO 8301: 1991 and GB/T 10295-2008 [17,18], ISO 8302: 1991 and GB/T 10294-2008 [19,20], and ISO 8990: 1994 and GB/T 13475-2008 [21,22]. Among the above three methods, the guarded hot plate method (GHP) is relatively straightforward and most commonly used for the measurement of thermal conductivity of small plate specimens, as used in [5,23,24]. The 0.3 m and 0.5 m are the most common dimensions of the specimen diameter or side length. For larger dimensions, it is hard to keep the specimens attached closely to the surfaces of heating and cooling units as the initial unevenness of the specimen surfaces is easier to happen on large-dimension specimens, and it is difficult to match the proper apparatus for such large-dimension specimens. In addition, the specimens with a large thickness are also not applicable to the test apparatus of GHP. Thus, the straw bales to be tested in previous studies are usually resized to match the requirement of the corresponding apparatus [23]. The heat flux meter method used in [4,25] is conventionally used for thermal property measurements of boards or walls in situ since the required temperature difference can be formed by warmer indoor environments and cooler outdoor environments. The bigger temperature difference between the indoor and outdoor environment leads to a more significant heat flow through the specimen and a smaller error effect, which means such a method relies closely on the test environment. As for the hot box method used in [8], it is usually implemented for thermal property investigation of boards or walls in the lab. Not only the guard hot box method but also the calibrated hot box method, the total heat flux that needs to be measured is determined according to the heating power, so the heat flux loss error is inevitable. For the guard hot box method, the error is reduced by setting a guard box and a metering box, but the error cannot be eliminated completely. While for the calibrated hot box method, an error calibration has to be performed before tests [26]. To sum up, the heat flux meter method or the hot box method is not the first choice for carrying out the thermal property tests of straw bio-based materials efficiently.
This study proposes an alternative test method of thermal conductivity and focuses on the thermal properties of straw boards, including a paper straw board (PSB) and five wheat straw strand boards (WSSBs) that can be regarded as an improved plate-shaped straw bale and a type of plate-shaped straw composite. Compared with the straw bio-based materials studied in previous works, the densities of the PSB and WSSBs in this study are greater, which contributes to a larger load-bearing capacity and more possibilities in engineering applications. The alternative test method refers to the temperature control box—heat flux meter method (TCB-HFM), which comes from a combination of the hot box method and the heat flux meter method with complementary advantages. The feasibility of such a test method is validated by comparing the monitored parameters, such as temperature difference and heat flux density, as well as the results of thermal conductivities with those of the guarded hot plate method (GHP), which is used to provide a control test. This study contributes to providing an alternative test method of thermal conductivity for relevant researchers and revealing the correlation between straw boards with different specifications and their thermal properties, which benefits the application of straw bio-based materials.

2. Experimental Program

2.1. Test Specimens

Figure 1 shows the PSBs of a specification and WSSBs of five specifications used for test specimen sampling. For the PSB, an improved plate-shaped straw bale, the inner straws are stacked and compacted along the length of the board, and the slurry overflows from the straw with the process of compaction and becomes the natural binder distributing among the straws. To provide restraint for inner straws and enhance the board integrality, surface strength, and smoothness, as well as protect the inner straws from the external environment, the paper made of high-density pulp is used to implement complete cladding, which makes the PSB more convenient to the application compared with the traditional straw bales. As for the WSSB, it is a type of plate-shaped straw composite manufactured from mixed smashed wheat straw fibers and the binder of isocyanate resin by compacting along the thickness of the board [27]. The isocyanate resin is a kind of healthy binder with no harmful gases such as formaldehyde released. The specification details of the straw boards are listed in Table 1, and the label of the board with different specifications is determined by the type and thickness d of it. As shown in the table, the densities of the PSB58 and WSSB12~WSSB25 are greater than the maximum densities of the straw bale and straw composite in previous studies [9,14], as stated in the Introduction.
The dimensions of a test specimen are 300 mm × 300 mm × d, and the test specimens are cut from the discontinuous portions away from the edges of the boards. For the control test conducted via GHP, only the WSSB25 specimens are tested as an example, and the two same specimens are tested simultaneously with no additional repeated tests. As for the tests performed via TCB-HFM, specimens covering all board specifications are in Table 1. The number of specimens for each board specification is determined by the error magnitude, which is introduced in detail as follows. Two specimens with the same specification are tested first, and the error between the result of each specimen and the average result is compared with 10%. If the errors are within that limitation, the number of specimens is no longer increased. Otherwise, the third same specimen is tested, and the error between the result of each specimen and the average result for three specimens is compared with 15%. Analogously, if the errors are within the limitation, the number of specimens is no longer increased. Otherwise, the fourth same specimen is being tested, and so on. The WSSB specimens are labeled, for instance, “WT−t12−2”, which refers to WSSB, thermal properties, 12 mm thickness, and the second of the same specimens. For the PSB specimens, the label is shown as “PT−t58−1”. The label “WT−t25*” is for the specimen of the control test.

2.2. Test Method and Apparatus

As shown in Figure 2a, the GHP tests with two specimens were conducted using the CD−DR3030 thermal conductivity tester (Shenyang Ziwei Mechanical and electrical equipment Co., LTD., Shenyang, China), and the test principle is presented in Figure 2b. For the actual apparatus, the cooling units, specimens, metering and guard surface plates, and metering and guard section heaters shown in Figure 2b are closely next to each other from the sides to the middle. Moreover, the dimensions of the metering section are 150 mm × 150 mm in this study. The standards [19,20] that the test method is based on have been stated in the Introduction, and the theory of the two-specimen test is expressed by Equation (1). The total heat flux Φ is determined by the heating power of the metering section heater, and the temperature difference ΔT is determined by the monitored values of thermocouples on the surfaces of heating and cooling units. Those two parameters are the items to be measured in the GHP test. The temperatures of the heating and cooling units are set as 40 °C and 30 °C, respectively. Furthermore, the correction factor of thermal conductivity λ for the apparatus is 0.909. After starting the apparatus, the data record proceeds with a frequency of once a minute. As the heat transfer tends to be steady gradually, the sampling begins automatically and is performed five times with an interval of 5 min and lasts 20 min in total.
λ = Φ d 2 A m Δ T
where Φ is the total heat flux; d is the thickness of the specimen; Am is the metering area; ΔT is the temperature difference between the hot-side and cold-side surfaces of a specimen.
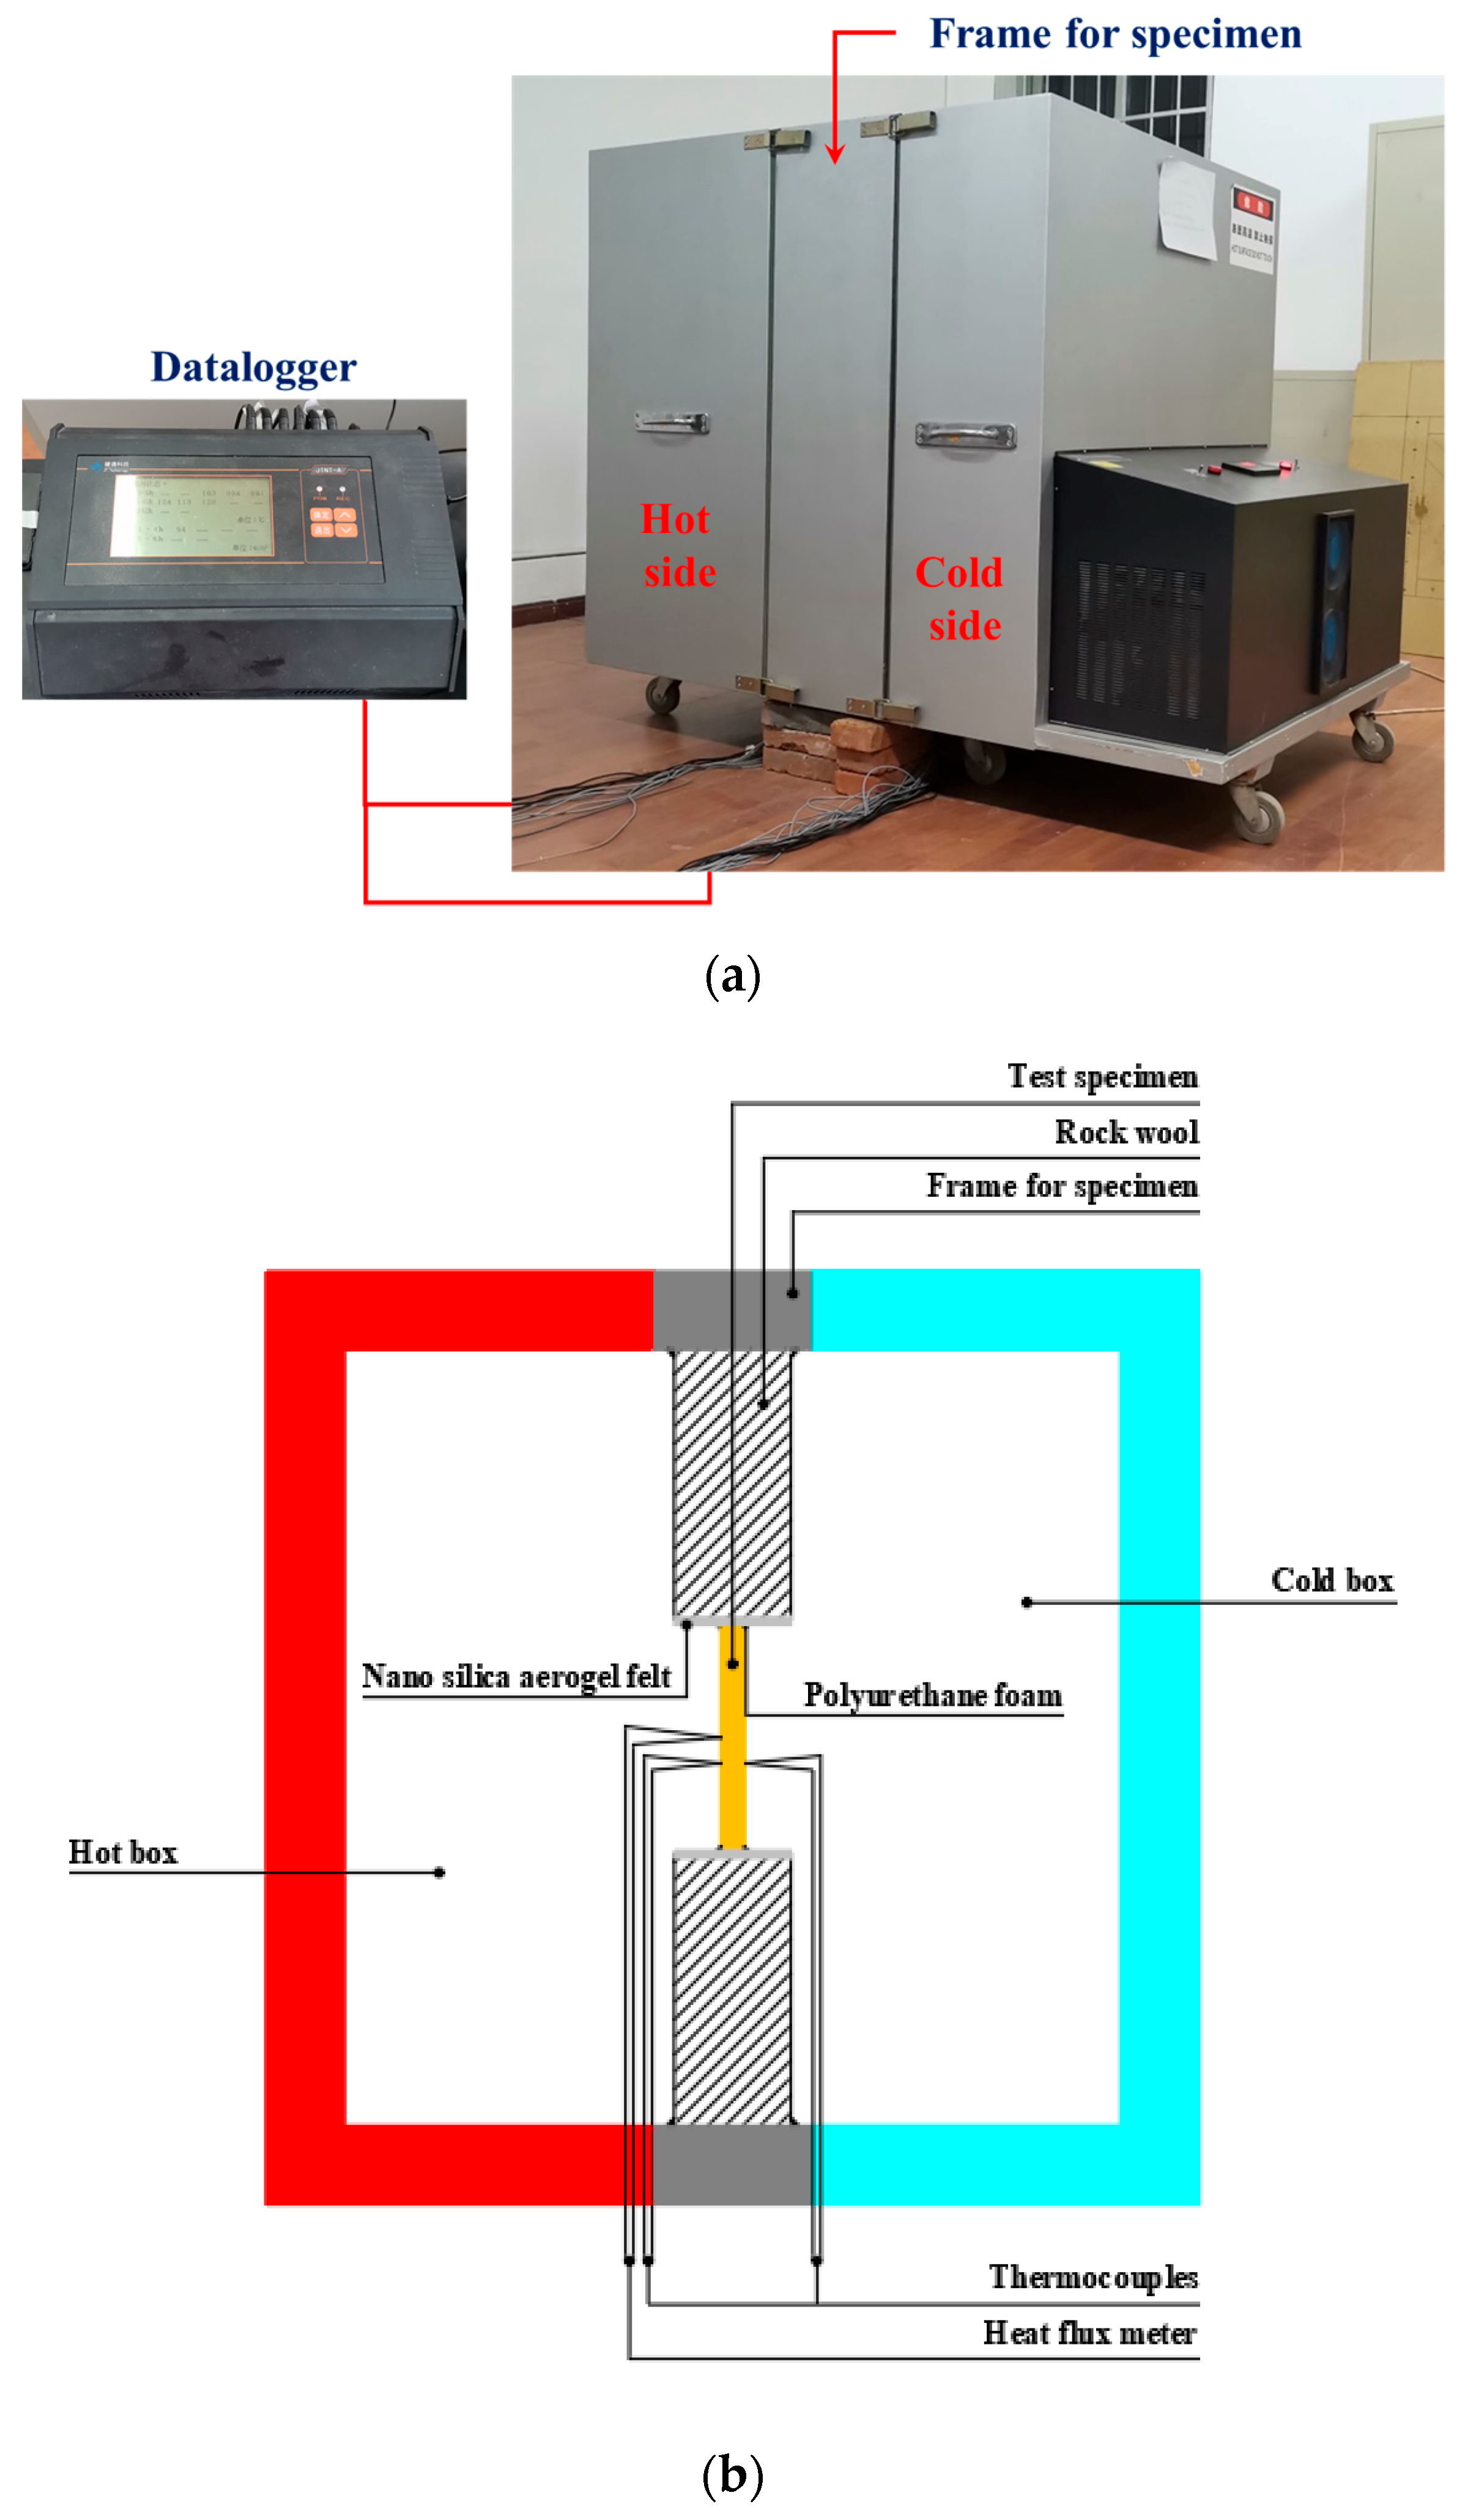
Figure 3 shows the test apparatus and principle for TCB-HFM, and the arrangement details of the heat flux meter (HFM) and thermocouples are demonstrated in Figure 4. As shown in the figures, the specimen is embedded in a 1000 mm × 1000 mm × 150 mm rock wool block with a 300 mm × 300 mm square perforation in the center, which is embedded in the specimen frame, and the gaps between the specimen and the surrounding rock wool are sealed off using the nano-silica aerogel felt and polyurethane foam. An HFM with the resolution, measurement range, and standard uncertainty caused by the apparatus resolution of 0.1 W/m2, 0~2000 W/m2, and 0.028867 W/m2 is arranged on the hot side of the specimen to measure the heat flux density q through the specimen center, while three thermocouples for each side with the resolution, measurement range, and standard uncertainty caused by the apparatus resolution of 0.1 °C, −50~120 °C, and 0.028867 °C are arranged around the center to collect the temperature differences ΔT between the two surfaces of the specimen. Vaseline and aluminum foil tapes are used to attach and fix the HFM and thermocouples to the corresponding monitored locations. Different from the test theory of the hot box (Equation (2)), the heating power does not need to be measured to determine the total heat flux Φ in this test since the hot box in Figure 3 is only used to provide a steady and controllable temperature difference condition, while the heat flux density is accurately determined according to the records of the HFM. To generate significant heat flux through the specimen, the air temperatures of the hot side and cold side chambers, which can be adjusted by the number of cooling fans in work and the power of the heating unit, are set as Ti = 30 °C and Te = 5 °C, respectively. As the limited record duration of the datalogger is 180 min, the data record starts when the steady state comes, and the record frequency is once a minute, the same as that of the GHP test. The data from the last 20 min are used for statistical analysis and comparison with the results of the GHP test. The λ can be finally determined according to the theory of heat flux meter method expressed by Equation (3), in which the ΔT is the average for three monitored locations of thermocouples shown in Figure 4a. The test theory of TCB-HFM is clear, and the operation is simple. Meanwhile, the TCB-HFM can be used for specimens that are thicker compared with the GHP, is limited by the apparatus, and also can apply to performing the thermal property investigation of large-dimension wall specimens, which is conducive to the full use of experimental equipment resources.
λ = d · K
K = Φ A · Δ T
λ = d R
R = Δ T q
where R is the thermal resistance; q is the heat flux density; K is the thermal transmittance; A is the area of the specimen perpendicular to the direction of heat flux.

3. Experimental Results

3.1. Validation of the Temperature Control Box—Heat Flux Meter Method

3.1.1. Experimental Results for the Guarded Hot Plate Method

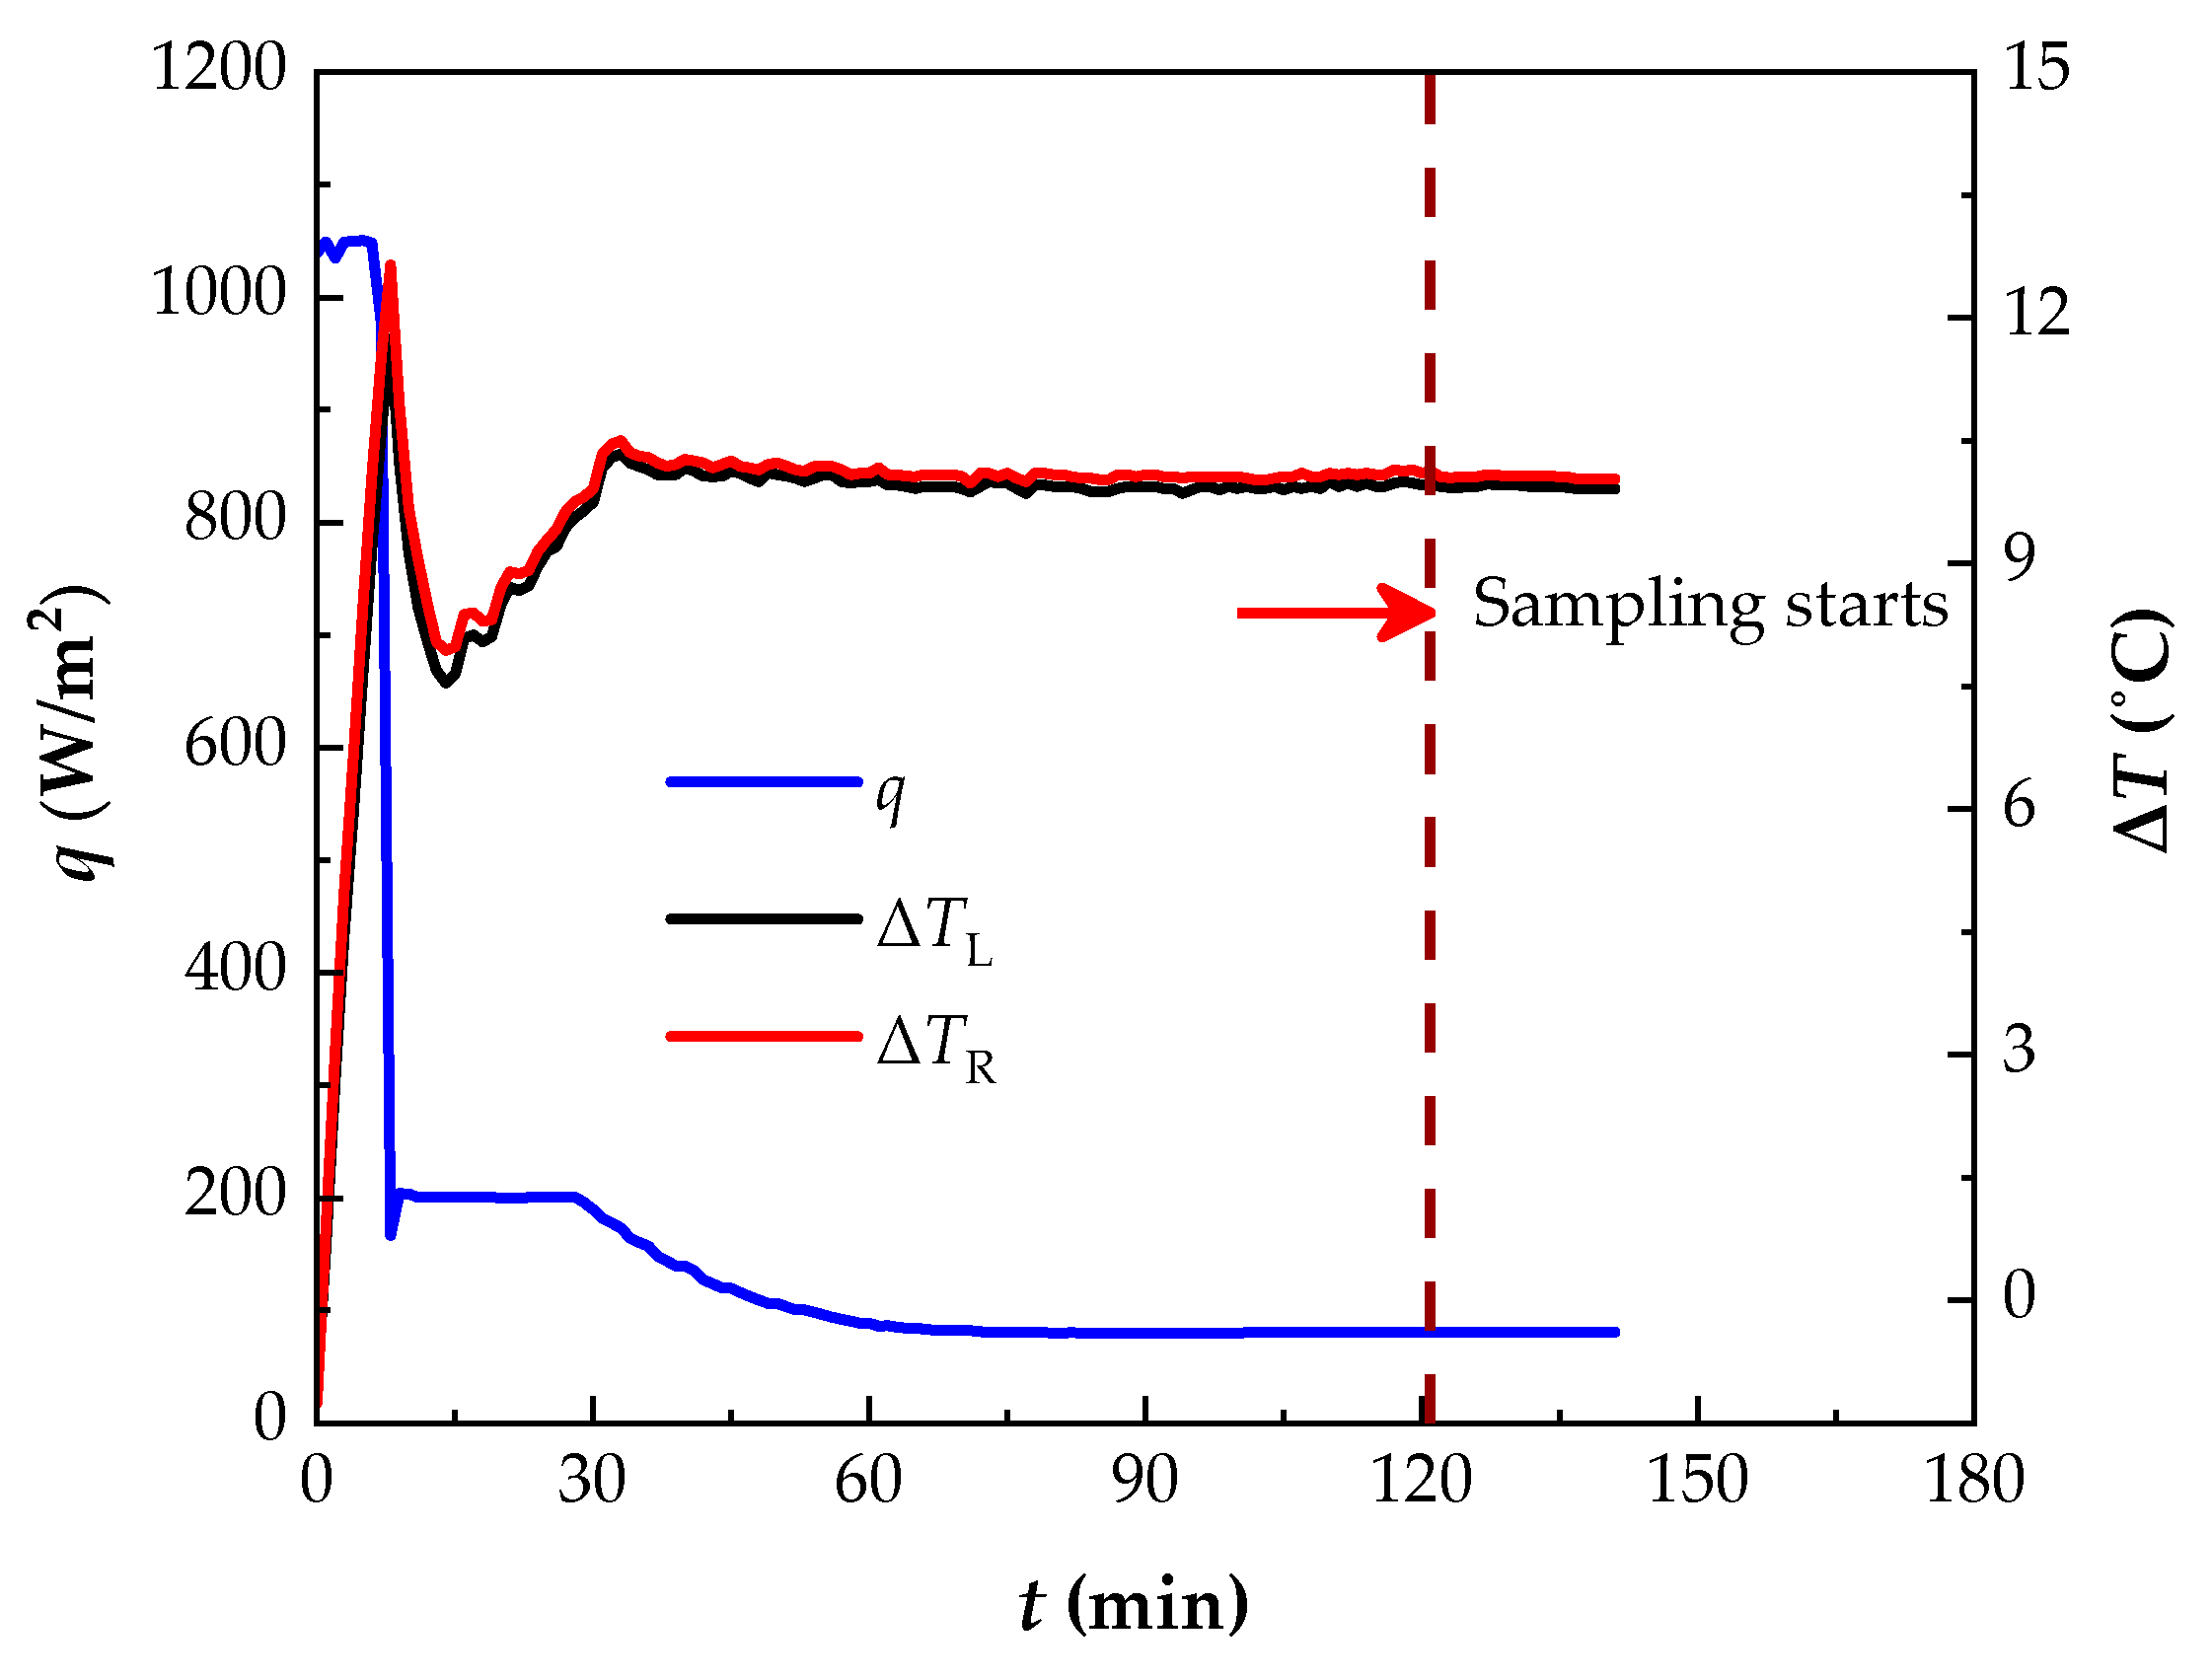
The sampling results of specimen WT−t25* for the GHP test are summarized in Table 2. Based on the data in the table, Equation (2), and the correction factor, the thermal conductivity λ of WSSB25 is determined to be 0.185 W/(m·K). The measurement uncertainty of λ caused by the measuring apparatus resolution is 0.000263 W/(m·K). To make a better comparison with the results of the TCB-HFM test, the monitored parameters are converted into q and ΔT according to Equation (4), and the two parameters are taken as the uniform items for the following analyses and comparisons, which are shown versus record time t in Figure 5. It can be noticed that the q and ΔT sharply decrease and increase, respectively, at the preliminary stage of the test and then gradually tend to be steady. About 70 min after the test begins, the heat transfer comes to a steady state. The sampling starts from the 121st minute, and we focus on the data for the last 20 min from then on. The statistical results for that duration, such as the coefficient of variation (COV) and maximum deviation from the average (MDA), are listed in Table 3. It is found that the COV and MDA are very small, which indicates that the fluctuation of q and ΔT is slight during the sampling stage.
Φ d 2 A m Δ T = q d Δ T

3.1.2. Experimental Results for the Temperature Control Box—Heat Flux Meter Method and Method Validation

The q and ΔT of specimens WT−t25−1 and WT−t25−2 for the TCB-HFM tests are directly monitored by the arranged HFM and thermocouples and presented versus t in Figure 6. To raise the comparability of the test results between GHP and TCB-HFM, the same coordinate ranges in Figure 5 are used in Figure 6. It can be seen that significantly greater q and ΔT of the specimens WT−t25−1 and WT−t25−2 are shown compared with those of the specimen WT−t25*, which attributes to the greater temperature difference between the hot side and the cold side for the initial setting of TCB-HFM tests. In addition, the fluctuation amplitudes of q and ΔT are slightly bigger than those shown in Figure 5, which can be for the reason that, unlike the GHP test, the heating and cooling units are not tightly next to the specimen for the TCB-HFM test. For further comparison, Table 4 shows the statistical results of data recorded during the last 20 min. It is found that the COV and MDA are small, with maximums of 0.70% and 1.41%, respectively, although slightly greater than that of the specimen WT−t25* shown in Table 3. In addition, it is demonstrated that the data fluctuation amplitudes are much smaller than a generally acceptable limitation of 5%, and the fluctuations are not unidirectional (see Figure 7), which verifies the steady state and data credibility of the sampling stage. Based on Equation (1) and the data in Table 4, the average of λ for specimens WT−t25−1 and WT−t25−2 is finally determined as 0.196 W/(m·K), having a 5.9% deviation from the result of the GHP test. The magnitudes of the data fluctuation and deviation from the result of the control test are in a reasonable range, which indicates that the TCB-HFM can be regarded as an alternative test method to conduct investigations on the thermal properties of materials.

3.2. Thermal Property of Straw Boards

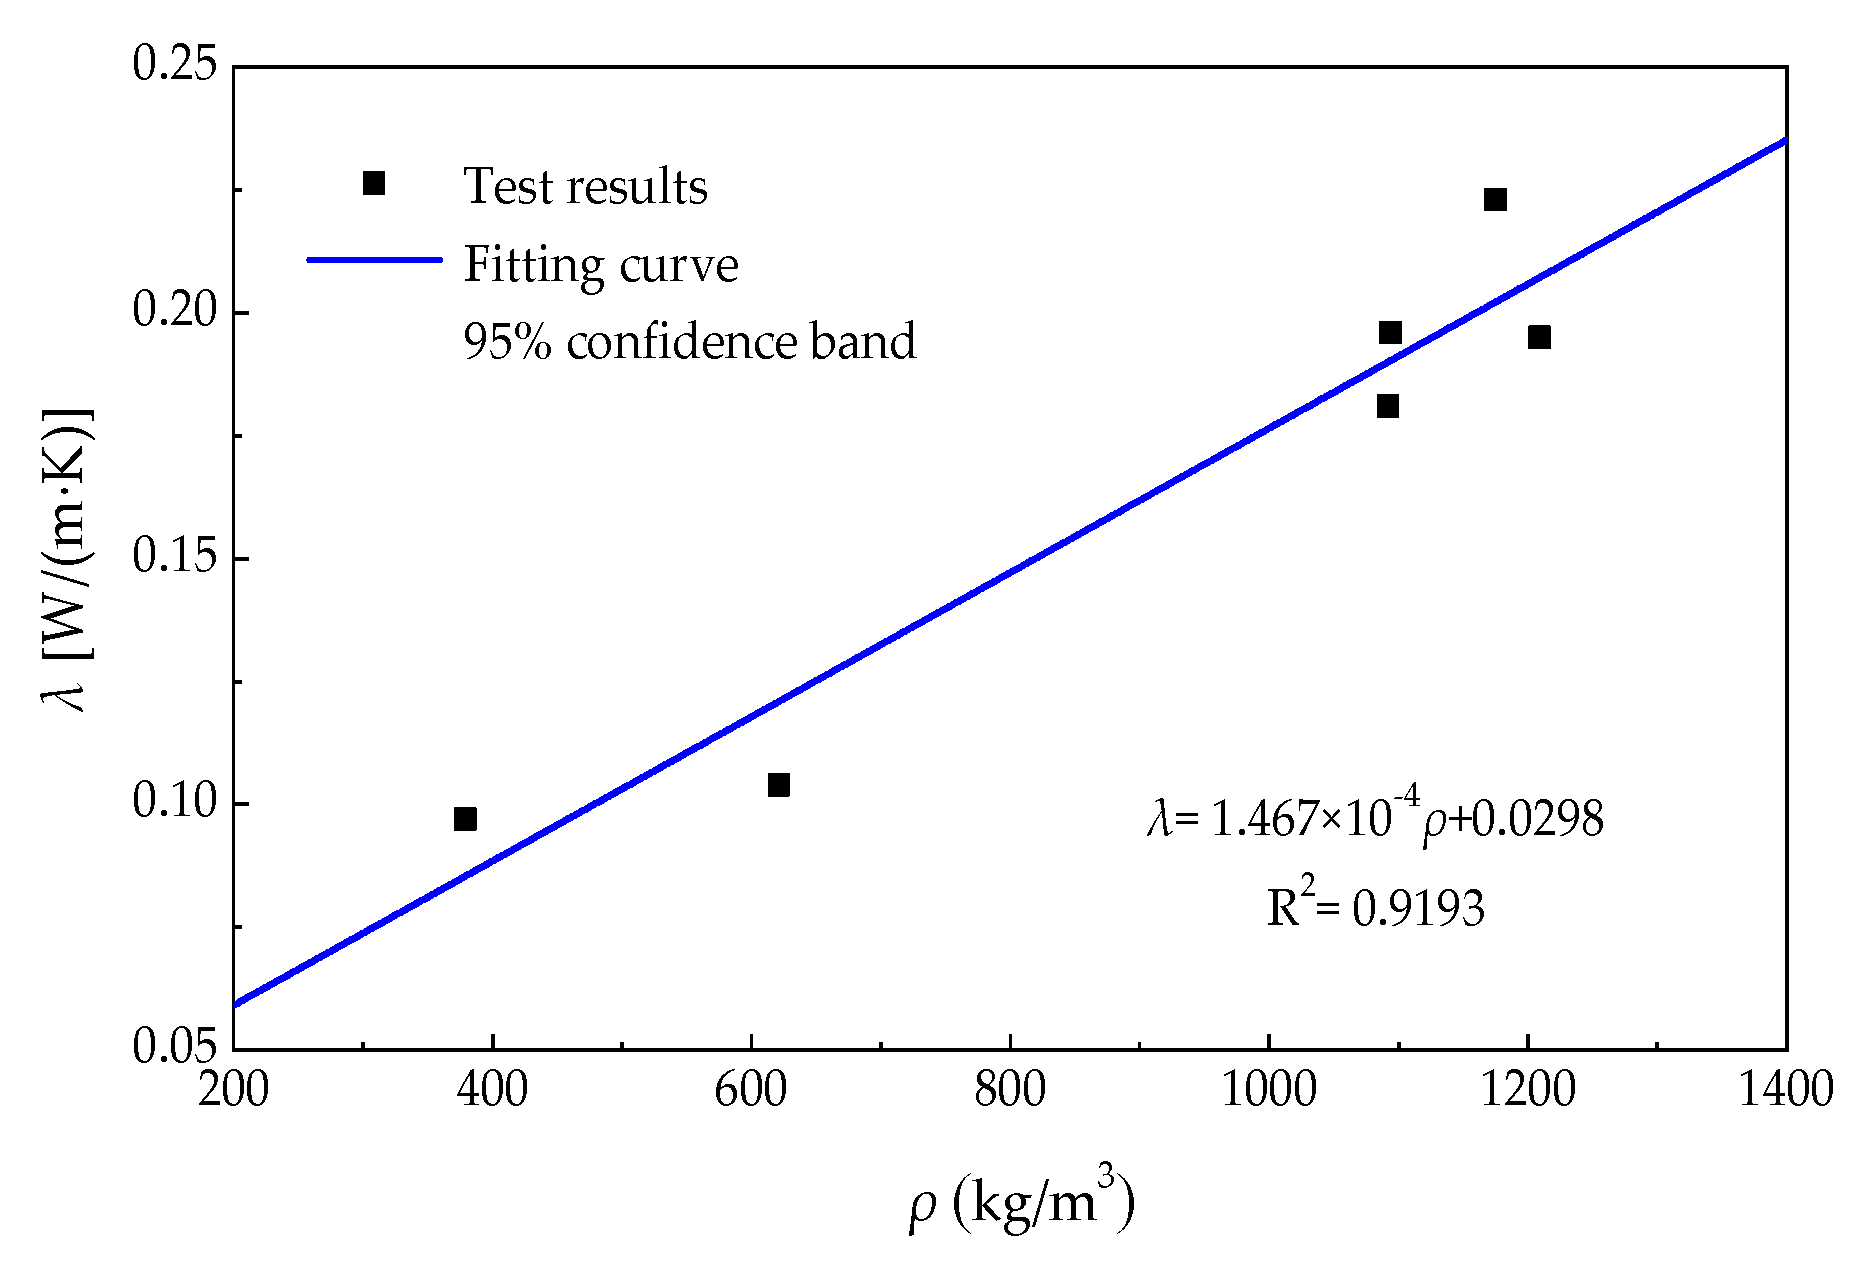
Analogously, the thermal property tests of the straw boards with other specifications were carried out via TCB-HFM. The experimental statistical results are summarized in Table 5. It can be noticed that the data fluctuation amplitudes have no abnormalities and are all within 3%, with the maximum MDA for ΔT and q being 1.95% and 2.77%, respectively. Considering the densities of straw boards of different specifications shown in Table 1, it is found that the λ of WSSB12, WSSB15, WSSB18, and WSSB25, which have higher densities, is obviously greater than that of the low-density WSSB30 and PSB58. Thus, a linear correlation between ρ and λ is assumed, and the proposed fitting formula is expressed as Equation (5). Figure 7 shows the fitting curve and λ test results versus ρ. It can be seen that the data scatters of test results evenly distribute on both sides of the fitting curve and are all in the range of the 95% confidence band. The coefficient of determination R2 of the fitting formula is equal to 0.9193, which demonstrates the significant correlation between ρ and λ of straw boards in this study. Therefore, the fitting formula can be useful for relevant researchers and designers to understand the thermal conductivities of such materials when thermal tests are not available. It should be noted that the above λ prediction formula is developed based on the test specimens that are conditioned in the lab environment with the temperature and relative humidity of 19 °C and 29%, respectively. In the case that the straw boards are used in an environment that is significantly different from that lab environment, the prediction results could have some deviation from the actual values.
λ = 1.467 × 10 4 ρ + 0.0298
where ρ is in kg/m3, and λ is in W/(m·K).

4. Discussion

The advantages of the proposed alternative test method, TCB-HFM, can be concluded by comparing it with the commonly used steady-state test methods stated in the Introduction for investigating the thermal properties of insulation materials. Compared to the heat flux meter method, the hot box used for providing a steady and controllable temperature difference condition in the TCB-HFM tests makes the specimen in an enclosed space. This contributes to avoiding reliance on the indoor and outdoor temperature difference and eliminating the effect of ambient temperature and relative humidity on measuring results of thermal conductivity. Compared to the guarded hot plate method, the TCB-HFM can be used for measuring the thermal conductivity of plate-shaped specimens with relatively small dimensions and applies to the thermal property investigation on large-dimension wall specimens. Thus, such a method makes it more convenient to perform a series of investigations on thermal properties from a material to the corresponding member and is conducive to the full use of experimental equipment resources. In contrast with the hot box method, the monitoring of heat flux in the TCB-HFM no longer relies on recording the heating power but derives from the readings of the heat flux meters. Such a method leaves out the process of considering the error between the heat flux and the heating power and is more concise.
As for the proposed fitting formula for predicting the thermal conductivity of such straw bio-based materials by the density, i.e., Equation (5), it is developed based on the analysis of the material characteristics and ambient factors. The factors that affect the thermal conductivity can be concluded as straw bio-based material characteristics and ambient conditions, including the types of straw and binder, fiber orientation, ambient temperature, relative humidity, and density, as stated in the Introduction. In this study, the types of straw and binder are relatively single, the straw fibers are all scattered without a specific direction, and the effect of ambient temperature and relative humidity is negligible since the tests are conducted in the enclosed apparatus and the same lab environment. Thus, the material density is the most related to the thermal conductivity of such straw bio-based material in this study, and it is reasonable to propose a fitting formula for predicting the thermal conductivity based on the density. Moreover, similar correlations between the density and thermal conductivity of straw bio-based materials have also been concluded in the relative references [7,23].
To compare the thermal conductivities of the straw boards with those of other straw bio-based materials and investigate the applicability of the fitting formula, the data scatters for the λ of straw bales and composites from the previous studies [4,8,9,13,15,25,28] are shown in Figure 8 versus ρ. As stated in the Introduction, the densities of straw bales and composites in previous studies are within a small range. It can be seen from the figure that most of the straw boards concerned in this study have higher densities and λ compared with previous studies, which widens the cover range of the straw bio-based materials of known relation between λ and ρ. In addition, the data from the references are obtained from different lab environments that involve ambient temperatures from 10 °C to 35 °C and relative humidity from 40% to 50%. These two variables mainly affect the moisture content of a specimen tested with non-enclosed apparatus [5] and finally influence the specimen’s density. The straw types include rice, wheat, bean, et al. The fiber orientation for the straw bales is random, and the binder types of the straw composites include liquid glass, methylene diphenyl diisocyanate resin, clay, cement, et al. The corresponding data scatters distribute on both sides of the fitting curve and are all in the 95% confidence band range, similar to the data scatters for the test results in this study. It is indicated that the fitting formula has the feasibility to predict the λ of more types of straw bio-based materials. Moreover, the density is dominant among several factors that have effects on the thermal conductivity of straw bio-based materials. The thermal properties of straw bio-based materials with different density specifications need to be studied in a later study to extend the data set. Thus, the formula for λ prediction can be further perfected and used in relevant research and engineering design.

5. Conclusions

To validate the TCB-HFM method used for thermal property tests, understand the thermal conductivity of two types of straw boards, and reveal the correlation between straw boards with different specifications and their thermal properties, experimental investigations on two types of boards using both the TCB-HFM and GHP methods were carried out, in which the experimental results of the GHP test were taken as the benchmark. The findings of this study contribute to providing an alternative method to the thermal conductivity test, which can be used for specimens that are thicker compared with the GHP and can also apply to performing the thermal property investigation of large-dimension wall specimens. The proposed λ prediction formula provides a reference for the thermal conductivities of straw bio-based materials when thermal tests are not available to the relevant researchers and designers. This benefits the application of such materials. The main conclusions from this study are summarized as follows.
  • The fluctuation amplitudes of the monitored parameters, including q and ΔT, for the TCB-HFM tests during the steady state are much smaller than a generally acceptable limit of 5%, although slightly bigger than those for the GHP test. Moreover, the 5.9% deviation of the λ between the two test methods is within a reasonable range. The TCB-HFM is verified as an alternative test method to conduct investigations on the thermal properties of materials.
  • The λ of two types of straw boards that include six specifications in total is obtained via the TCB-HFM tests, in which the maximum fluctuation amplitudes for ΔT and q are 1.95% and 2.77% for all specimens during the steady state. Based on the experimental results, the correlation between the ρ and λ for such material is found and expressed by a linear fitting formula with the determination coefficient R2 of 0.9193.
  • The test results for λ of other straw bio-based materials in previous studies are compared with the fitting curve. It is found that the fitting formula has the feasibility to predict the λ of more types of straw bio-based materials, and the density is dominant among several factors that have effects on the thermal conductivity of straw bio-based materials.

Author Contributions

Conceptualization, K.S. and C.Z.; methodology, K.S.; software, K.S.; validation, K.S.; formal analysis, K.S.; investigation, K.S.; resources, Y.W.; data curation, K.S.; writing—original draft preparation, K.S.; writing—review and editing, C.Z.; visualization, K.S.; supervision, C.Z. and W.Z.; project administration, C.Z. and Y.W.; funding acquisition, C.Z. All authors have read and agreed to the published version of the manuscript.

Funding

This research was funded by the National Key R&D Program of China, grant number 2019YFD1101005, and the China State Construction Engineering Corporation, grant number CSCEC-2020-Z-58-2.

Institutional Review Board Statement

Not applicable.

Informed Consent Statement

Not applicable.

Data Availability Statement

The data presented in this study are available on request from the corresponding author.

Conflicts of Interest

The authors declare no conflict of interest.

References

  1. Tlaiji, G.; Ouldboukhitine, S.; Pennec, F.; Biwole, P. Thermal and mechanical behavior of straw-based construction: A review. Constr. Build. Mater. 2022, 316, 125915. [Google Scholar] [CrossRef]
  2. Shi, L.Y.; Zhang, H.B.; Li, Z.X.; Man, X.; Wu, Y.; Zheng, C.; Liu, J. Analysis of moisture buffering effect of straw-based board in civil defence shelters by field measurements and numerical simulations. Build. Environ. 2018, 143, 366–377. [Google Scholar] [CrossRef]
  3. Liu, L.; Li, H.; Lazzaretto, A.; Manente, G.; Tong, C.; Liu, Q.; Li, N. The development history and prospects of biomass-based insulation materials for buildings. Renew. Sustain. Energy Rev. 2017, 69, 912–932. [Google Scholar] [CrossRef]
  4. Cascone, S.; Evola, G.; Gagliano, A.; Sciuto, G.; Baroetto Parisi, C. Laboratory and in-situ measurements for thermal and acoustic performance of straw bales. Sustainability 2019, 11, 5592. [Google Scholar] [CrossRef] [Green Version]
  5. Ashour, T. The Use of Renewable Agricultural By-Products as Building Materials. Ph.D. Thesis, Benha University, Moshtohor, Egypt, 2003. [Google Scholar] [CrossRef]
  6. Beck, A.; Heinemann, U.; Reidinger, M.; Fricke, J. Thermal Transport in Straw Insulation. J. Build. Phys. 2004, 27, 227–234. [Google Scholar] [CrossRef]
  7. Vejeliene, J. Processed straw as effective thermal insulation for building envelope constructions. Eng. Struct. Technol. 2012, 4, 96–103. [Google Scholar] [CrossRef]
  8. Shea, A.; Wall, K.; Walker, P. Evaluation of the thermal performance of an innovative prefabricated natural plant fibre building system. Build. Serv. Eng. Res. Technol. 2013, 34, 369–380. [Google Scholar] [CrossRef] [Green Version]
  9. Wei, K.; Lv, C.L.; Chen, M.Z.; Zhou, X.; Dai, Z.; Shen, D. Development and performance evaluation of a new thermal insulation material from rice straw using high frequency hot-pressing. Energy Build. 2015, 87, 116–122. [Google Scholar] [CrossRef]
  10. Conti, L.; Barbari, M.; Monti, M. Steady-State thermal properties of rectangular straw-bales (RSB) for building. Buildings 2016, 6, 44. [Google Scholar] [CrossRef] [Green Version]
  11. D’Alessandro, F.; Bianchi, F.; Baldinelli, G.; Rotili, A.; Schiavoni, S. Straw bale constructions: Laboratory, in field and numerical assessment of energy and environmental performance. J. Build. Eng. 2017, 11, 56–68. [Google Scholar] [CrossRef]
  12. Gallegos-Ortega, R.; Magaña-Guzmán, T.; Reyes-López, J.A.; Romero-Hernández, M.S. Thermal behavior of a straw bale building from data obtained in situ. A case in Northwestern México. Build. Environ. 2017, 124, 116–122. [Google Scholar] [CrossRef]
  13. Sabapathy, K.A.; Gedupudi, S. Straw bale based constructions: Measurement of effective thermal transport properties. Constr. Build. Mater. 2019, 198, 182–194. [Google Scholar] [CrossRef]
  14. Dušek, J.; Jerman, M.; Podlena, M.; Böhm, M.; Černý, R. Sustainable composite material based on surface-modified rape straw and environment-friendly adhesive. Constr. Build. Mater. 2021, 300, 124036. [Google Scholar] [CrossRef]
  15. Ratiarisoa, R.V.; Magniont, C.; Ginestet, S.; Oms, C.; Escadeillas, G. Assessment of distilled lavender stalks as bioaggregate for building materials: Hygrothermal properties, mechanical performance and chemical interactions with mineral pozzolanic binder. Constr. Build. Mater. 2016, 124, 801–815. [Google Scholar] [CrossRef]
  16. Zhou, Y.P.; Trabelsi, A.; Mankibi, M.E. A review on the properties of straw insulation for buildings. Constr. Build. Mater. 2022, 330, 127215. [Google Scholar] [CrossRef]
  17. ISO 8301:1991; Thermal Insulation—Determination of Steady-State Thermal Resistance and Related Properties—Heat Flow Meter Apparatus. International Organization for Standardization: Geneva, Switzerland, 1991. Available online: https://www.iso.org/standard/15421.html (accessed on 10 July 2023).
  18. GB/T 10295-2008; Thermal Insulation—Determination of Steady-State Thermal Resistance and Related Properties—Heat Flow Meter Apparatus. Chinese Standard: Beijing, China, 2008. Available online: https://www.codeofchina.com/standard/GBT10295-2008.html (accessed on 10 July 2023).
  19. ISO 8302:1991; Thermal Insulation—Determination of Steady-State Thermal Resistance and Related Properties—Guarded Hot Plate Apparatus. International Organization for Standardization: Geneva, Switzerland, 1991. Available online: https://www.iso.org/standard/15422.html (accessed on 10 July 2023).
  20. GB/T 10294-2008; Thermal Insulation—Determination of Steady-State Thermal Resistance and Related Properties—Guarded Hot Plate Apparatus. Chinese Standard: Beijing, China, 2008. Available online: https://www.codeofchina.com/search/default.html?page=1&keyword=GB/T%2010294-2008 (accessed on 10 July 2023).
  21. ISO 8990:1994; Thermal Insulation—Determination of Steady-State Thermal Transmission Properties—Calibrated and Guarded Hot Box. International Organization for Standardization: Geneva, Switzerland, 1994. Available online: https://www.iso.org/standard/16519.html (accessed on 10 July 2023).
  22. GB/T 13475-2008; Thermal Insulation—Determination of Steady-State Thermal Transmission Properties—Calibrated and Guarded Hot Box. Chinese Standard: Beijing, China, 2008. Available online: https://www.codeofchina.com/search/default.html?page=1&keyword=GB/T%2013475-2008 (accessed on 10 July 2023).
  23. Costes, J.-P.; Evrard, A.; Biot, B.; Keutgen, G.; Daras, A.; Dubois, S.; Lebeau, F.; Courard, L. Thermal Conductivity of Straw Bales: Full Size Measurements Considering the Direction of the Heat Flow. Buildings 2017, 7, 11. [Google Scholar] [CrossRef] [Green Version]
  24. Douzane, O.; Promis, G.; Roucoult, J.; Le, A.D.T.; Langlet, T. Hygrothermal performance of a straw bale building: In situ and laboratory investigations. J. Build. Eng. 2016, 8, 91–98. [Google Scholar] [CrossRef]
  25. Bakatovich, A.; Davydenko, N.; Gaspar, F. Thermal insulating plates produced on the basis of vegetable agricultural waste. Energy Build. 2018, 180, 72–82. [Google Scholar] [CrossRef] [Green Version]
  26. Sun, K.; Zheng, C.R.; Wang, X.D. Thermal performance and thermal transmittance prediction of novel light-gauge steel-framed straw walls. J. Build. Eng. 2023, 67, 2352–7102. [Google Scholar] [CrossRef]
  27. GB/T 21723-2008; Wheat/Rice-Straw Particleboard. Chinese Standard: Beijing, China, 2008.
  28. Liuzzi, S.; Rigante, S.; Ruggiero, F.; Stefanizzi, P. Straw based materials for building retrofitting and energy efficiency. Key Eng. Mater. 2016, 678, 50–63. [Google Scholar] [CrossRef]
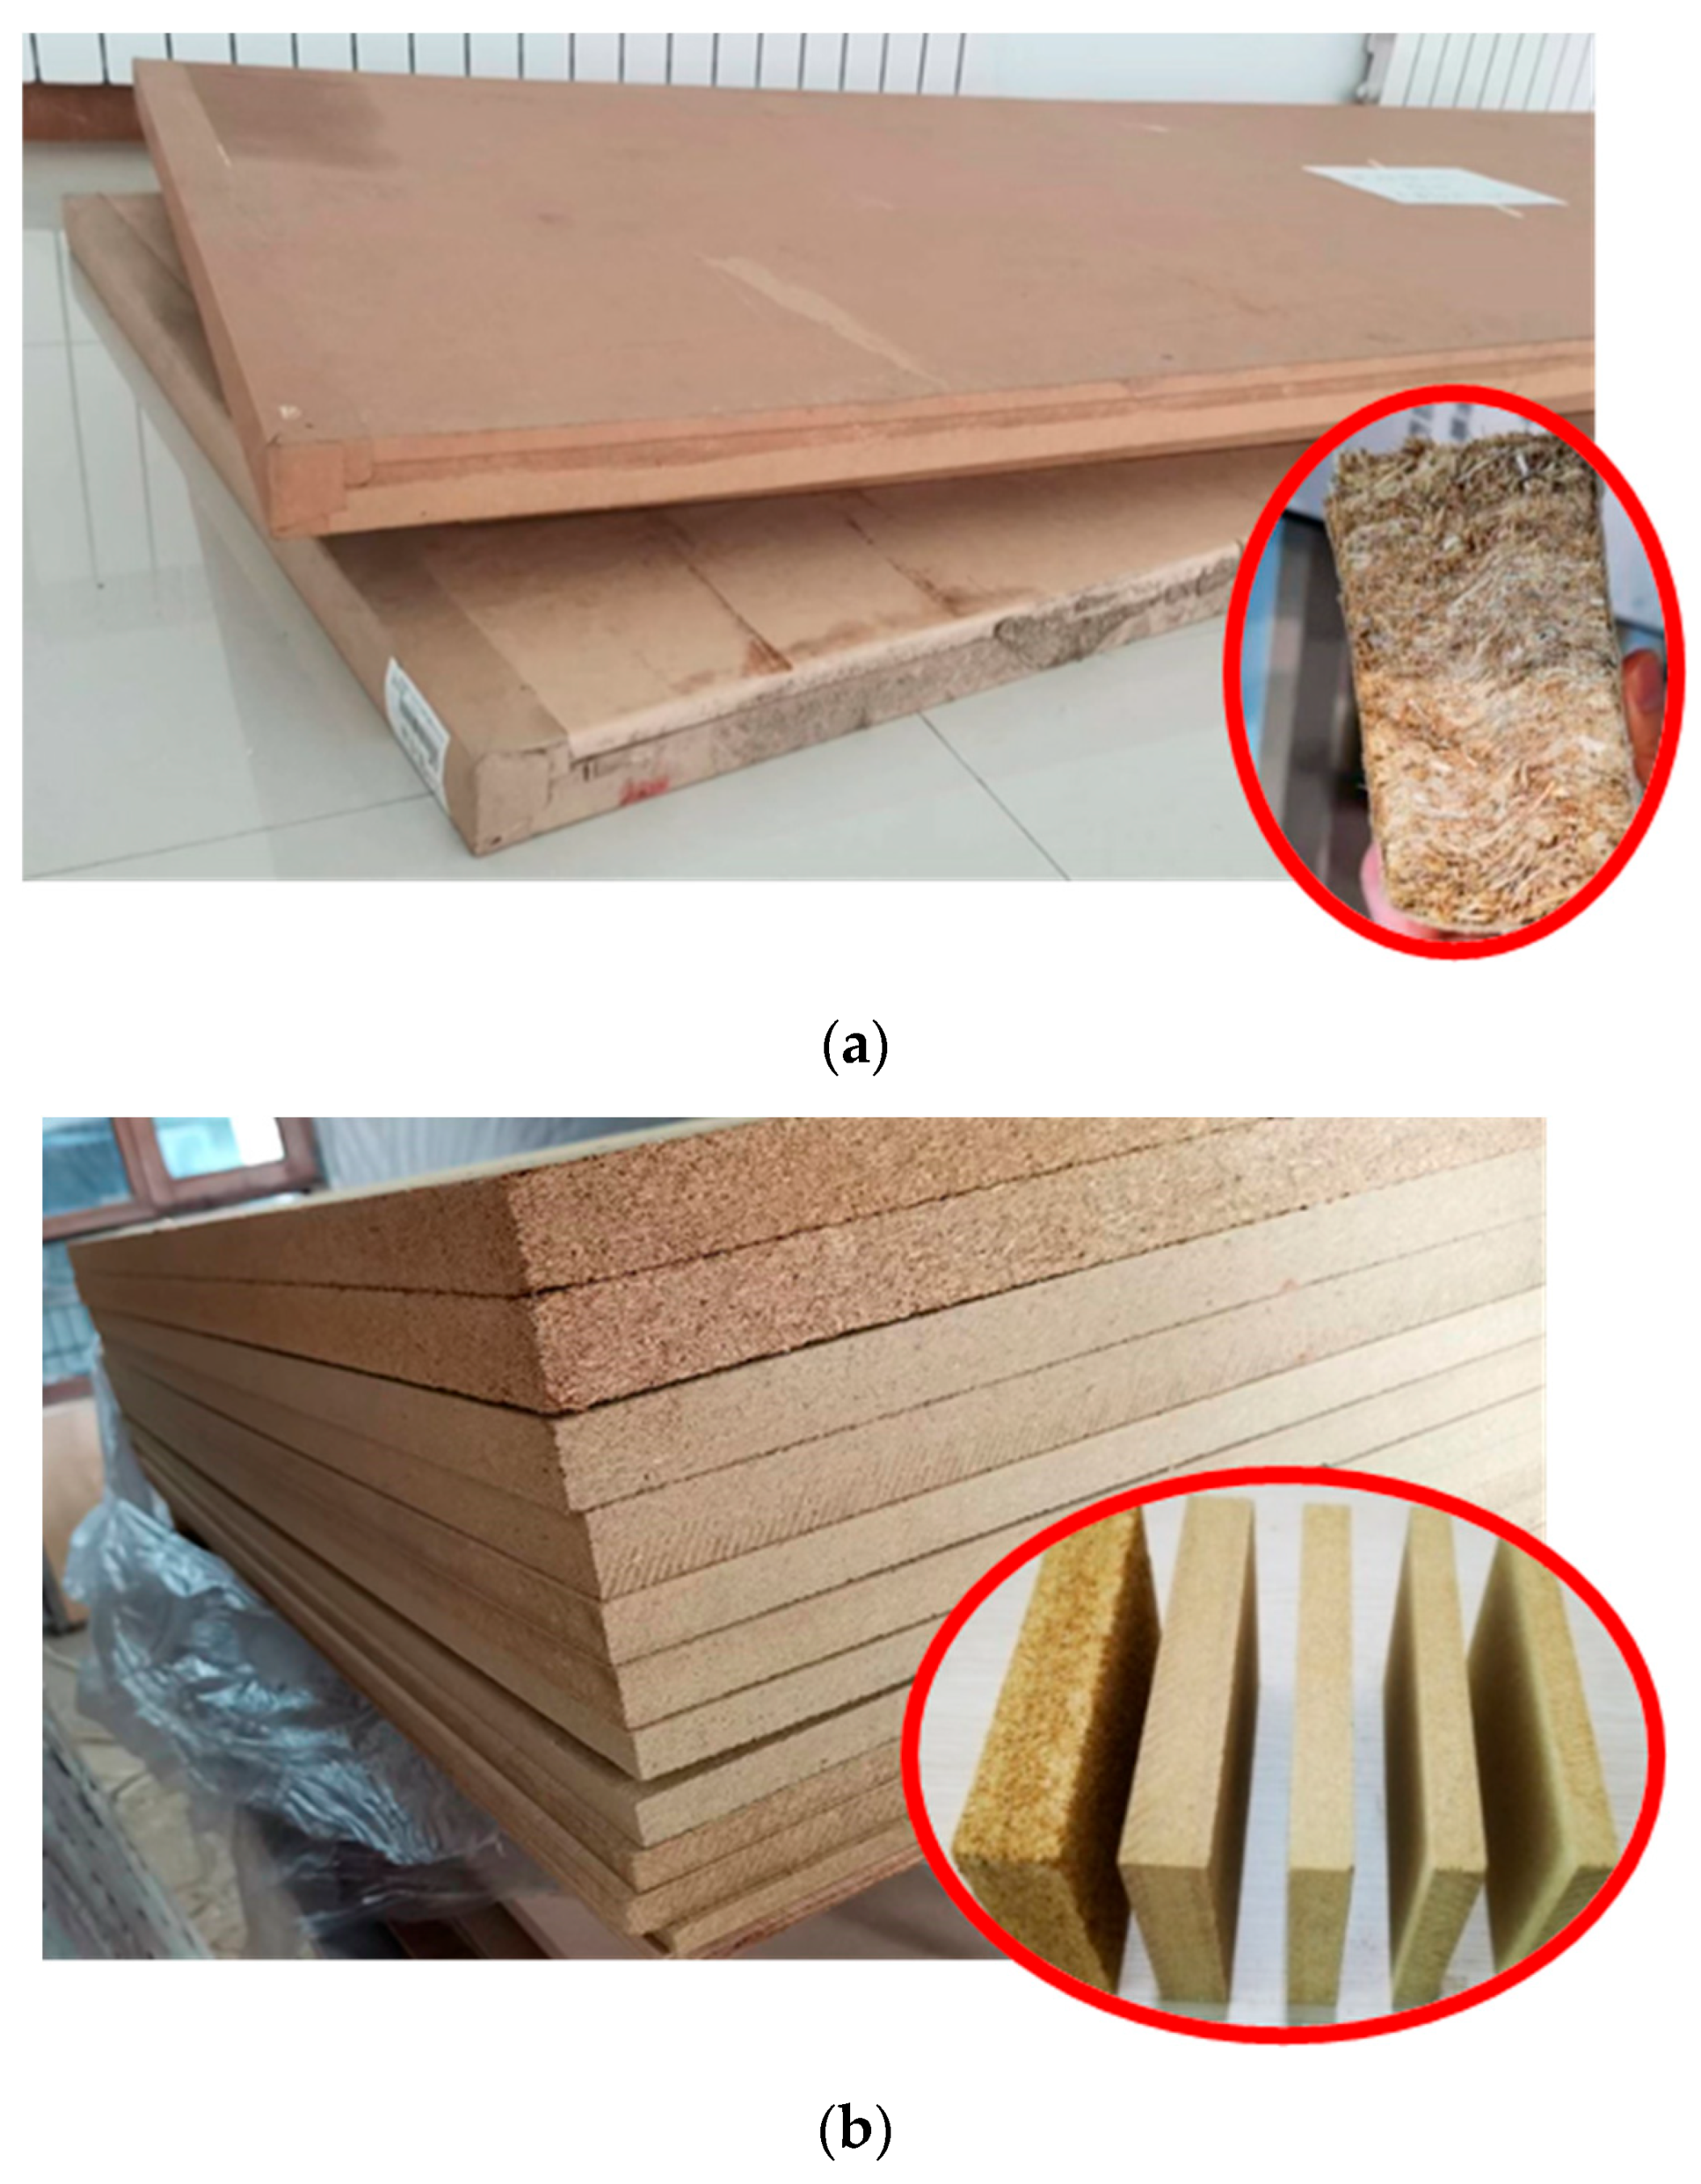
Figure 1. Straw boards for test specimen sampling: (a) PSBs; (b) WSSBs.
Sustainability 15 10960 g001
Figure 2. Test apparatus and principle for GHP: (a) CD−DR3030 thermal conductivity tester; (b) test principle.
Sustainability 15 10960 g002
Figure 3. Test apparatus and principle for TCB-HFM: (a) JTRG−1 hot box and JTNT−A datalogger connected with the heat flux meter and thermocouples; (b) test principle.
Sustainability 15 10960 g003
Figure 4. Arrangement details of the heat flux meter and thermocouples: (a) schematic diagram; (b) actual arrangement.
Sustainability 15 10960 g004
Figure 5. q and ΔT versus t for specimen WT−t25*.
Sustainability 15 10960 g005
Figure 6. q and ΔT versus t for specimens WT−t25−1 and WT−t25−2.
Sustainability 15 10960 g006
Figure 7. Fitting curve and λ test results versus ρ.
Sustainability 15 10960 g007
Figure 8. λ of straw bales and composites from the previous studies [4,8,9,13,15,25,28] versus ρ.
Sustainability 15 10960 g008
Table 1. The specification details of a PSB and five WSSBs.
LabelDimensions: Length l × Width w × Thickness d
(mm × mm × mm)
Nominal Density
ρn (kg/m3)
Actual Density
ρ (kg/m3)
PSB583000 × 1200 × 58400379
WSSB122440 × 1220 × 1212001209
WSSB152440 × 1220 × 1511001092
WSSB182440 × 1220 × 1811001175
WSSB252440 × 1190 × 2511001094
WSSB302440 × 1220 × 30620621
Table 2. Sampling results of specimen WT−t25*.
Sample NumberTemperature or Temperature Difference for the Left Specimen (°C)Temperature or Temperature Difference for the Right Specimen (°C)Φ (W)
Metering Section Surface Plate TL1Cooling Unit Surface Plate TL2ΔTLMetering Section Surface Plate TR1Cooling Unit Surface Plate TR2ΔTR
139.93829.9799.95940.10429.97910.1253.641
239.94730.0099.93840.06030.00210.0583.642
339.94930.0009.94940.06329.99610.0673.642
439.94930.0199.93040.06430.01110.0533.642
539.95030.0409.91040.06730.03510.0323.642
Average39.94730.0099.93840.07230.00510.0673.642
Table 3. Statistical results of q and ΔT for specimen WT−t25*.
Thermal ParameterAverageCoefficient of Variation (COV)Maximum Deviation from the Average (MDA)
q80.932 W/m20.01%0.03%
ΔTL9.935 °C0.21%0.33%
ΔTR10.059 °C0.19%0.66%
Table 4. Statistical results of q and ΔT for specimens WT−t25−1 and WT−t25−2.
SpecimenThermal ParameterAverageCoefficient of Variation (COV)Maximum Deviation from the Average (MDA)
WT−t25−1q105.729 W/m20.68%1.39%
ΔT111.943 °C0.50%1.20%
ΔT213.167 °C0.50%1.27%
ΔT313.795 °C0.67%0.76%
WT−t25−2q108.733 W/m20.69%1.26%
ΔT113.971 °C0.40%0.92%
ΔT215.214 °C0.70%1.41%
ΔT314.019 °C0.48%0.85%
Note: The subscript of “ΔT” corresponds to the number of the thermocouple shown in Figure 4a.
Table 5. Statistical results of thermal parameters derived from the TCB-HFM tests.
SpecimenMDA for ΔTMDA for qλ [W/(m·K)]λavg [W/(m·K)]
WT−t12−11.92%0.99%0.1770.195
WT−t12−21.79%1.40%0.198
WT−t12−31.94%1.49%0.193
WT−t15−11.67%1.18%0.1800.181
WT−t15−21.38%1.11%0.182
WT−t18−11.18%0.77%0.1990.223
WT−t18−21.95%1.12%0.231
WT−t18−31.60%0.90%0.215
WT−t25−11.27%1.39%0.2040.196
WT−t25−21.41%1.26%0.189
WT−t30−11.35%0.97%0.1010.104
WT−t30−21.02%0.62%0.107
ST−t58−11.22%2.15%0.0950.097
ST−t58−21.36%2.77%0.100
Note: λavg refers to the average of λ.
Disclaimer/Publisher’s Note: The statements, opinions and data contained in all publications are solely those of the individual author(s) and contributor(s) and not of MDPI and/or the editor(s). MDPI and/or the editor(s) disclaim responsibility for any injury to people or property resulting from any ideas, methods, instructions or products referred to in the content.