

The Effect of Corporate Resource Abundance on the Transformation and Upgrading of Manufacturing Enterprises from the Perspective of Whole Process Innovation
Abstract
:1. Introduction
- ➢
- First, the promotion effect of enterprise resource abundance on the transformation and upgrading of manufacturing enterprises has not been examined from a micro perspective.
- ➢
- Second, the analysis of the heterogeneous effect of different types of enterprise resource abundance on transformation and upgrading in the manufacturing industry needs to be further deepened.
- ➢
- Third, most studies only stay at the basic level, and there are few attempts to explore transformation and upgrading from the perspective of mechanism research. In addition, while the significance of technological innovation for transformation and upgrading has been highlighted by a large body of literature [11,12], there has been a lack of exploration into the “bridge role” of technological innovation in the process of linking resource abundance with the transformation and upgrading of the manufacturing industry.
- ➢
- Does resource abundance stimulate the transformation and upgrading of manufacturing enterprises, and why?
- ➢
- Going further, how does the resource abundance in various types of enterprises differ in its contribution to their transformation and upgrading?
- ➢
- What are the underlying mechanisms within the process? To what extent does technological innovation exert a mediating effect at different stages?
- Innovation investment intensity (innovation input).
- Innovation direction (innovation process).
- Innovation quantity (innovation output).
- ➢
- First, differently from previous works [13,14], this paper pioneers the development of four enterprise type models to investigate the impact of corporate resource abundance on transformation and upgrading, based on the resource-based view. By adopting a unique perspective, this research sheds light on the transformation and upgrading of microenterprises, thus expanding the existing literature on the factors influencing corporate transformation and upgrading.
- ➢
- Second, prior studies mainly identify the driving factors of enterprise transformation and upgrading [15,16]. Nevertheless, in-depth analysis of the mechanisms by which organizational resource factors affect transformation and upgrading is scarce. This paper addresses this research gap by employing a mediation model to investigate the relationship among corporate resources, innovation, and transformation and upgrading. It not only highlights the significance of corporate resources as catalysts for transformation and upgrading, but also introduces a new paradigm for understanding the intricate mechanisms by which strategic corporate resources impact corporate transformation and upgrading.
- ➢
- Third, while previous literature has extensively examined the impact of strategic resource attributes on innovation models within enterprises [17], a comprehensive understanding of the entire innovation process remains unexplored. By integrating the literature on technological innovation with a resource-based view, this paper innovatively introduces the whole innovation process into the model to investigate the mechanisms and boundary conditions related to resource abundance that impact the transformation of manufacturing enterprises. Our findings enrich the theoretical research on enterprise transformation and upgrading and provide further enlightenment for managers to help them make reasonable but innovative strategic and high-quality transformation and upgrading decisions.
2. Literature Review
2.1. The Determinants of Corporate Transformation and Upgrading
2.2. The Impact of Corporate Resource Abundance
3. Research Hypothesis
3.1. Four Strategic Resource Enterprise Types
3.2. Resource-Based Innovation Model
3.3. Analysis of the Impact of Resource Abundance on Enterprise Transformation and Upgrading
3.4. Analysis of the Channels of Resource Abundance for Enterprise Transformation and Upgrading
3.4.1. Mediating Role of Innovation Investment Intensity
3.4.2. The Mediating Role of Innovation Direction
3.4.3. The Mediating Role of Innovation Output
4. Methodology
4.1. Sample and Data Collection
4.2. Measures
4.2.1. Dependent Variable
4.2.2. Independent Variable
4.2.3. Mediating Variables
4.2.4. Control Variables
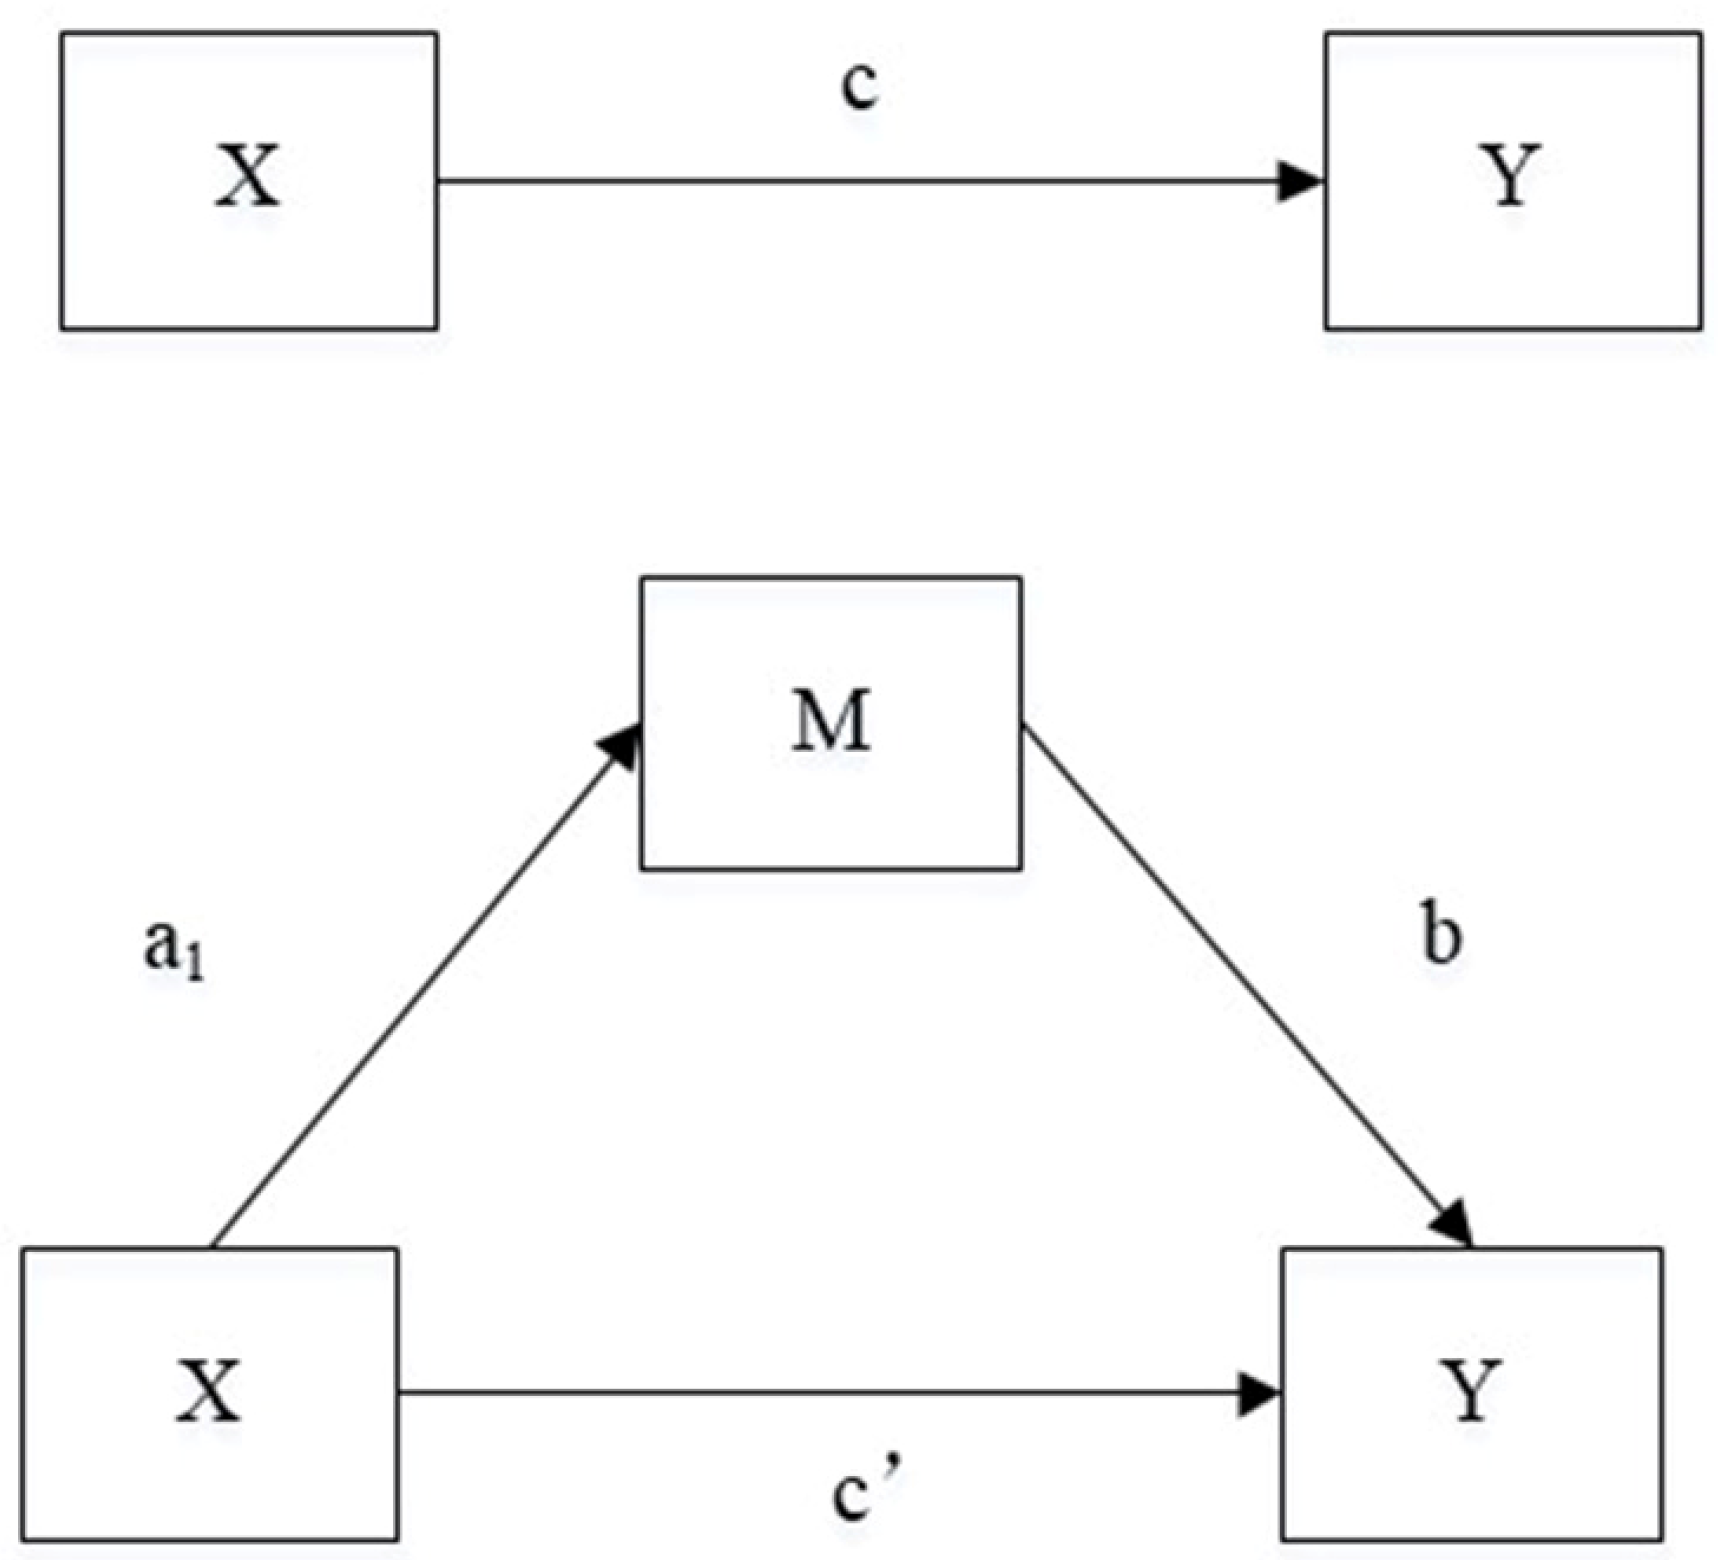
4.3. Methods of Analysis
- (1)
- After the regression between resource abundance (X) and enterprise transformation and upgrading (Y), we can check to see if c is significant. If it is significant, we proceed to the second-step regression. Otherwise, the analysis is not further conducted.
- (2)
- After the regression between resource abundance (X) and technological innovation (M), we can check to see if a is significant.
- (3)
- Resource abundance (X) and technological innovation (M) are regressed with enterprise transformation and upgrading (Y). If both a and b are significant, and c′ is not significant, it means that there is a full mediating effect. If c′ is still significant but decreases, it implies that there is a partial mediating effect. If at least one of a and b is not significant, then a Sobel test is needed. If it is significant, it implies that there is a mediation effect. Otherwise, there is no mediation effect.
5. Empirical Results
6. Robustness Tests
7. Conclusions and Discussion
7.1. Conclusions
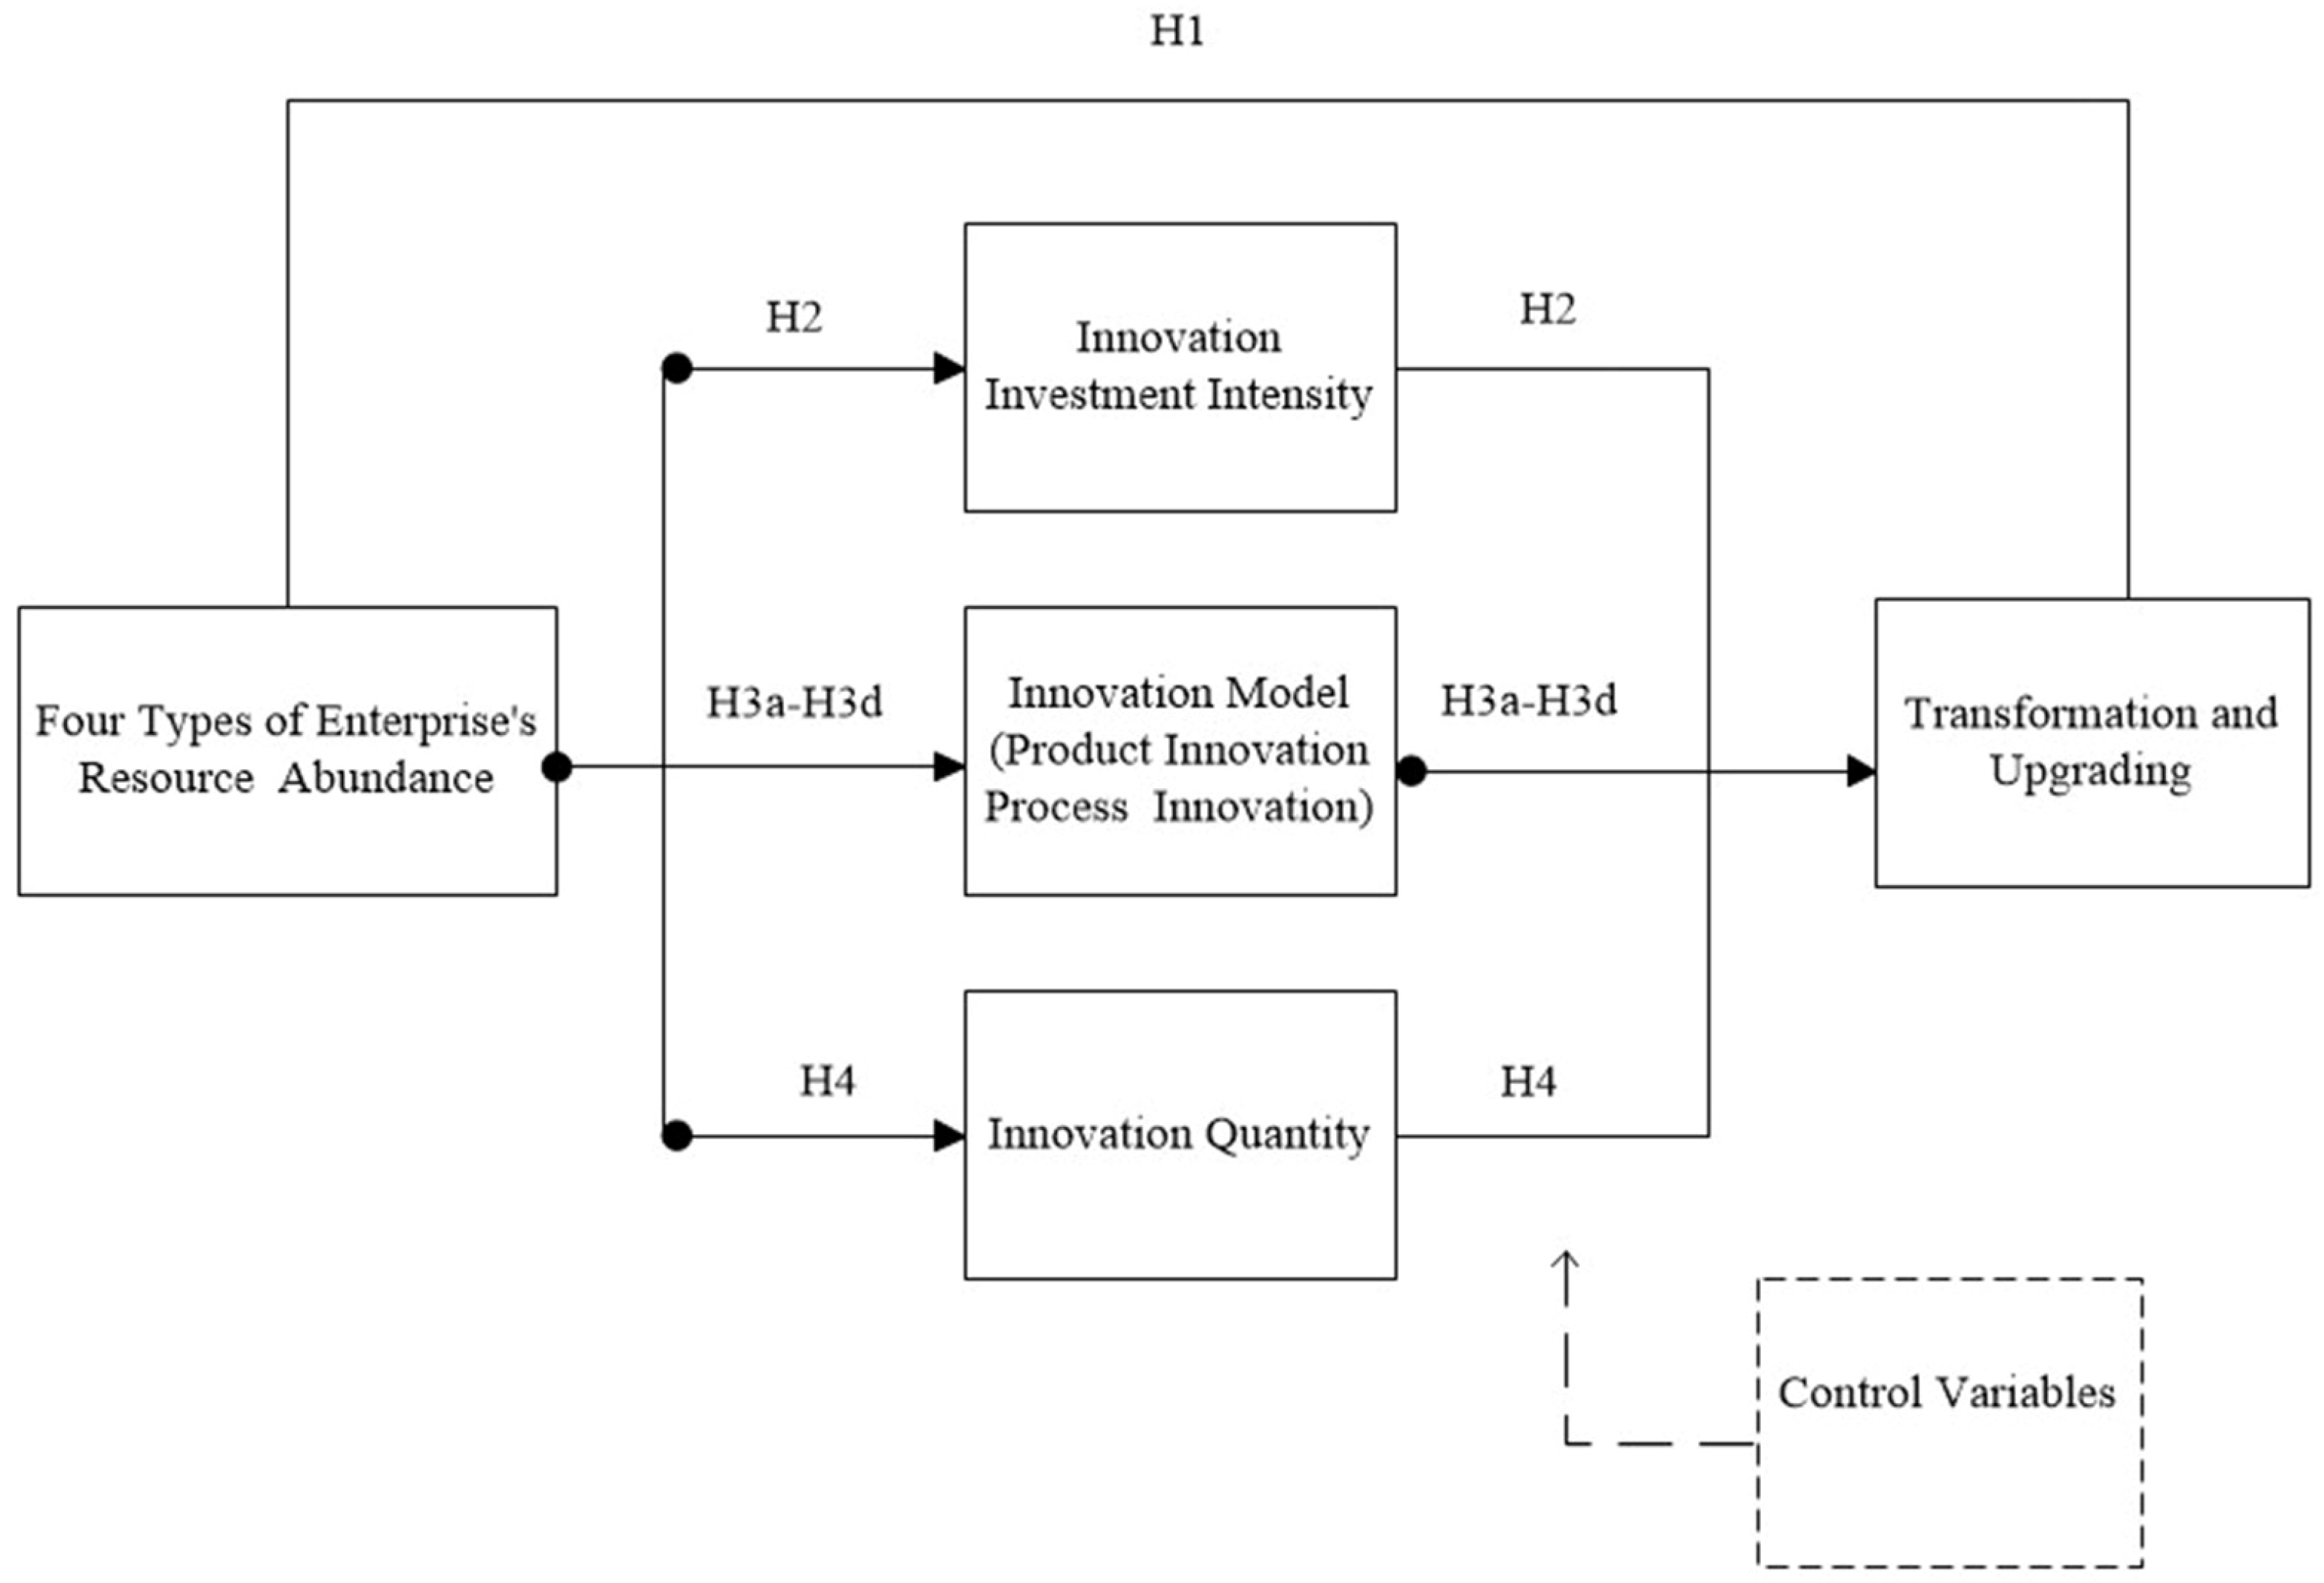
- (1)
- Resource abundance has a significant positive impact on enterprise transformation and upgrading. H1 was verified. The result agreed with [81].
- (2)
- Regarding innovation input, innovation investment intensity serves as a crucial pathway for manufacturing companies to achieve transformation and upgrading. H2 was verified. The result was aligned with Peng et al. [82].
- (3)
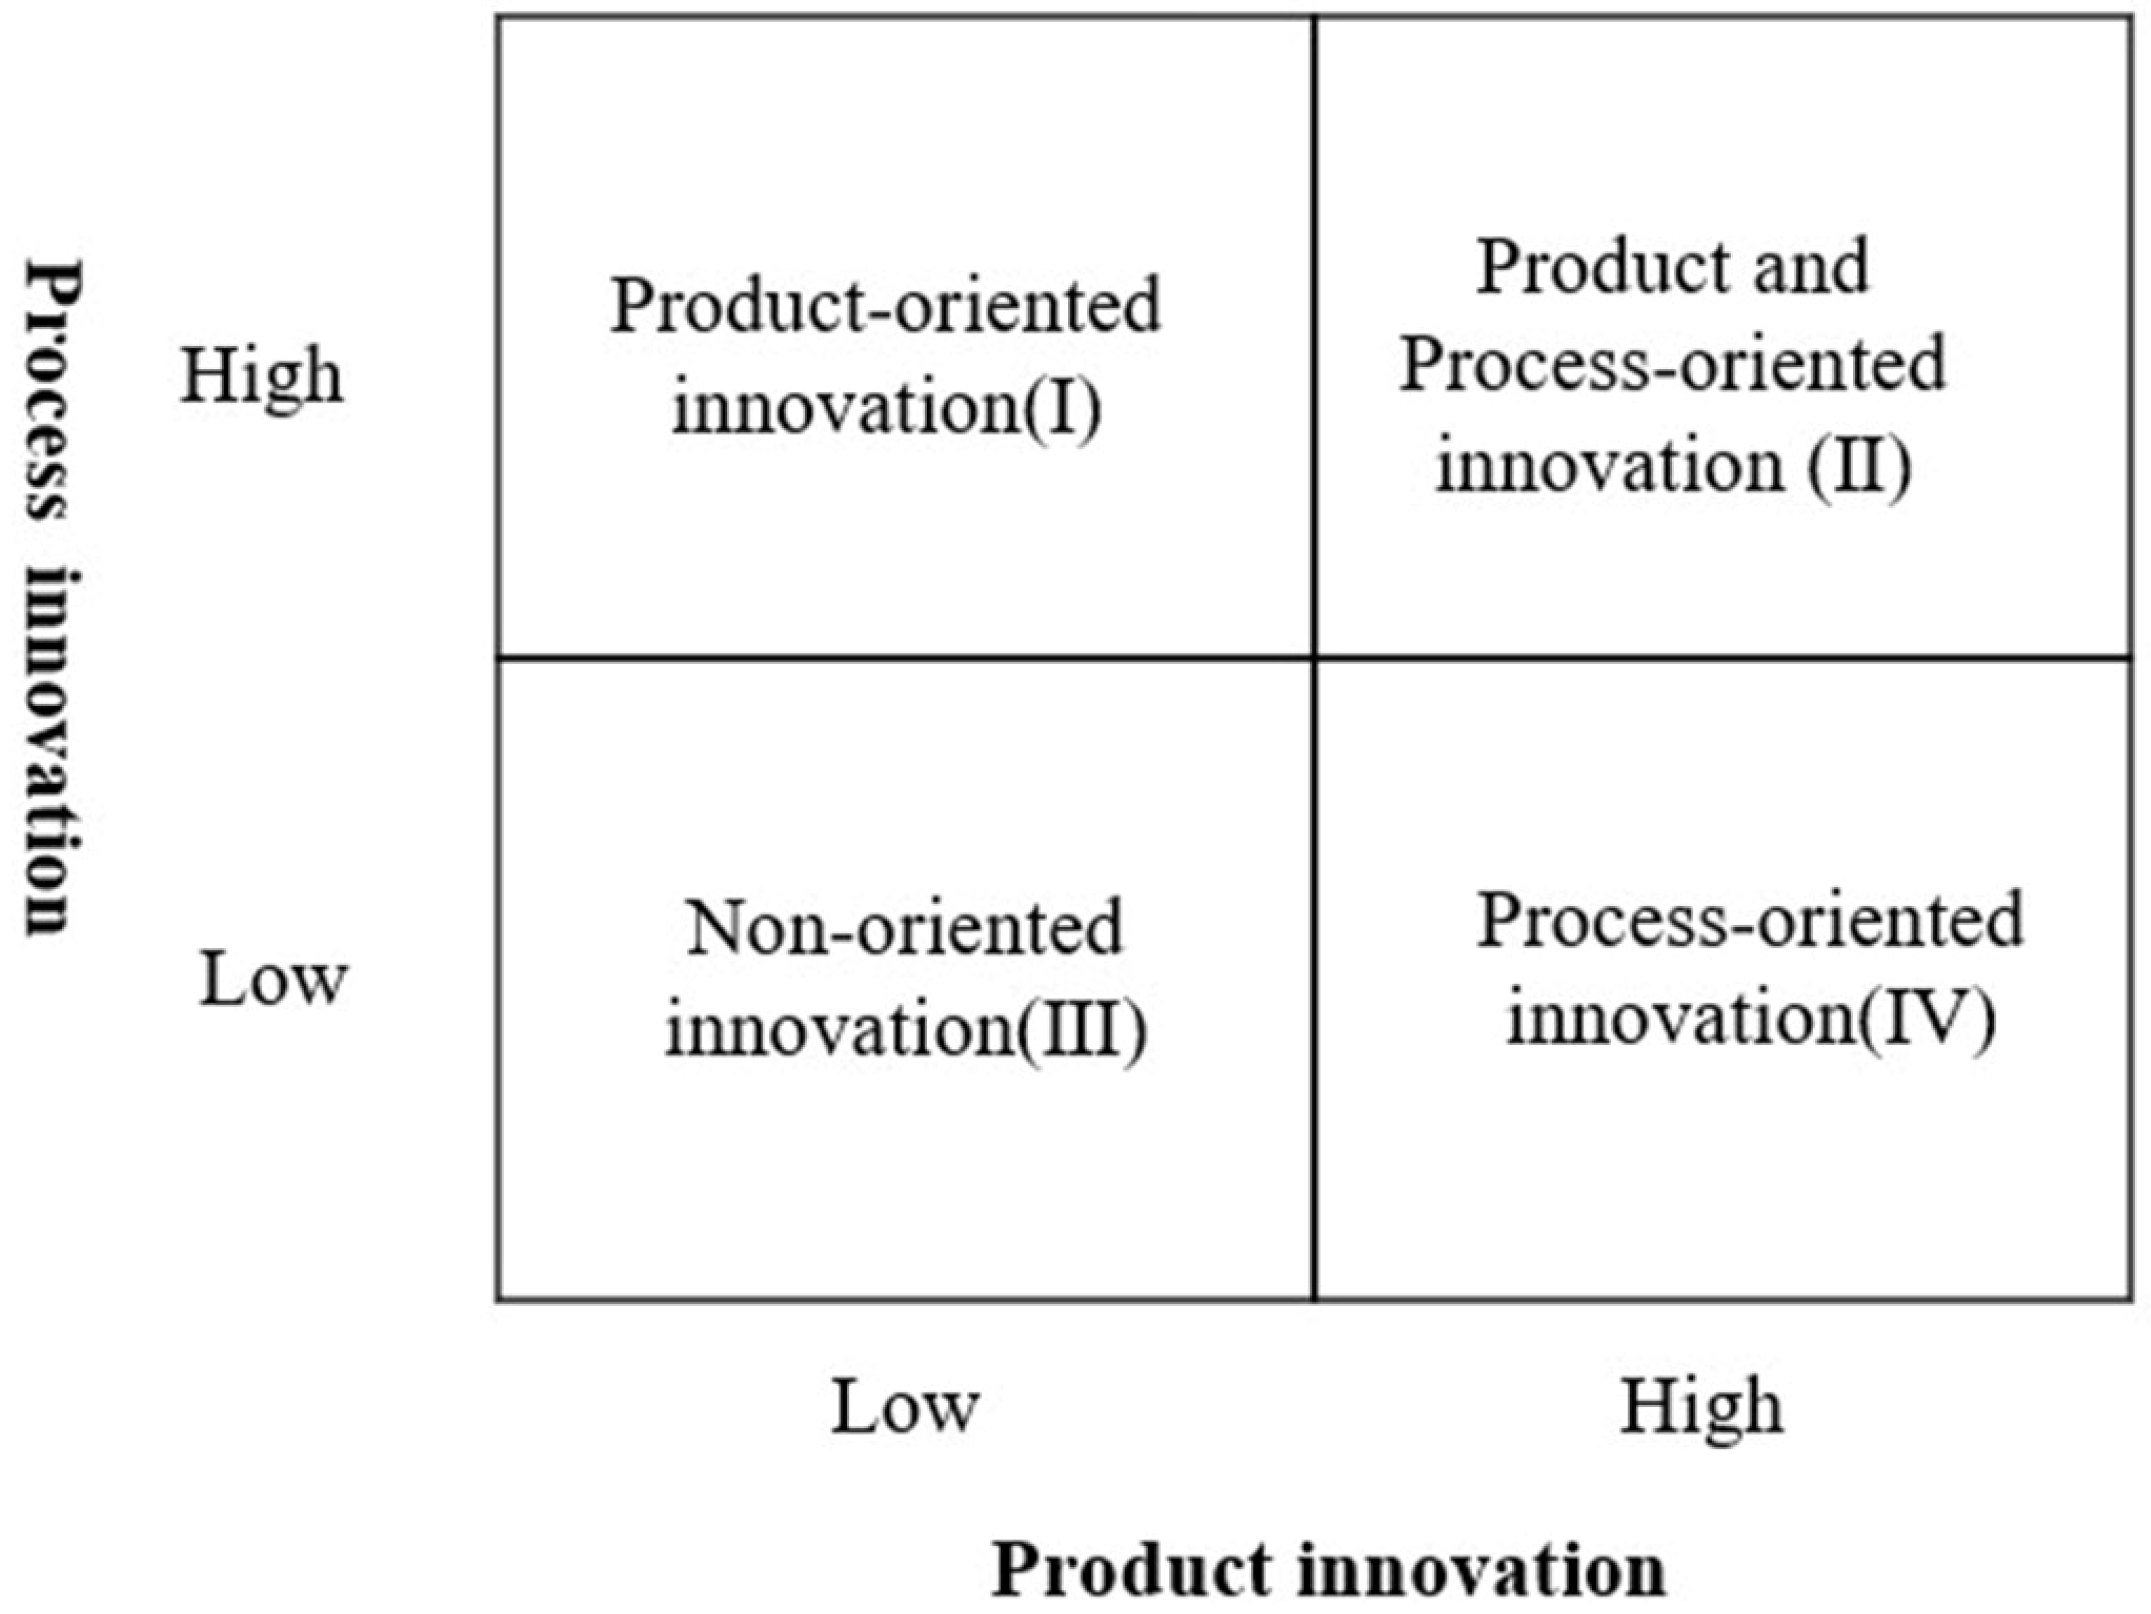
- Regarding the innovation process, four types of enterprises with different resource statuses are key factors influencing the innovation model and the success of transformation and upgrading. More specifically, leading enterprises with adequate resources can undertake product and process innovation simultaneously to transform and upgrade. In contrast, catching-up enterprises drive transformation and upgrading through product innovation, while potential enterprises do so through process innovation. Meanwhile, exiting enterprises are unable to transform and upgrade through product or process innovation. H3a, H3b, H3c, and H3d were verified. The outcomes coincided with those of Ettlie [50] and Gagnon [90].
- (4)
- Regarding innovation output, with the exception of exiting enterprises, all remaining manufacturing enterprises can achieve transformation and upgrading by increasing their innovation output. H4 was verified. The result agreed with that of Chemmanur et al. [88].
7.2. Discussion
7.2.1. Theoretical Implications
7.2.2. Practical Implications
7.2.3. Limitations and Prospects
Author Contributions
Funding
Institutional Review Board Statement
Informed Consent Statement
Data Availability Statement
Conflicts of Interest
References
- Liu, Y.H.; Liu, Q. The effect of industrial design on the transformation and upgrade of manufacturing industry from the perspective of industry 4.0. Packag. Eng. 2018, 39, 113–116. [Google Scholar] [CrossRef]
- Bo, M.Z.; Zhang, M.; Li, W. The role of new industrial design training model in the transformation and upgrading of manufacturing industry. In Proceedings of the IOP Conference Series: Materials Science and Engineering, Luoyang, China, 17–19 May 2019. [Google Scholar] [CrossRef]
- Wang, X. Application of Internet of Things Technology to Promote High-Quality Development of Resource-Based City Industrial Transformation and Upgrading Demonstration Areas. Mob. Inf. Syst. 2022, 2022, 9263632. [Google Scholar] [CrossRef]
- Peng, S.; Wang, J.; Sun, H.; Guo, Z. How Does the Spatial Misallocation of Land Resources Affect Urban Industrial Transformation and Upgrading? Evidence from China. Land 2022, 11, 1630. [Google Scholar] [CrossRef]
- Li, F.; Wu, Y.; Liu, J.; Zhong, S. Does digital inclusive finance promote industrial transformation? New evidence from 115 resource-based cities in China. PLoS ONE 2022, 17, e0273680. [Google Scholar] [CrossRef]
- Estensoro, M.; Larrea, M.; Müller, J.M.; Sisti, E. A resource-based view on SMEs regarding the transition to more sophisticated stages of industry 4.0. Eur. Manag. J. 2022, 40, 778–792. [Google Scholar] [CrossRef]
- You, L.; Yang, M. Transformation and upgrading path for midstream manufacturers in the chain: Taking Shennan Circuits as an example. Front. Environ. Sci. 2022, 10, 2323. [Google Scholar] [CrossRef]
- Ma, Z.; Fan, X.; Zhang, Y.; Hu, B. Understanding the Influencing Factors of Enterprise Transformation and Upgrading Capability: A Case Study of the National Innovation Demonstration Zones, China. Sustainability 2023, 15, 2711. [Google Scholar] [CrossRef]
- Xu, L. Towards Green Innovation by China’s Industrial Policy: Evidence from Made in China 2025. Front. Environ. Sci. 2022, 10, 1049. [Google Scholar] [CrossRef]
- Niu, H.; Zhao, X.; Luo, Z.; Gong, Y.; Zhang, X. Green credit and enterprise green operation: Based on the perspective of enterprise green transformation. Front. Psychol. 2022, 13, 1041798. [Google Scholar] [CrossRef]
- Wang, D.; Xu, D.; Zhou, N.; Cheng, Y. The asymmetric relationship between sustainable innovation and industrial transformation and upgrading: Evidence from China’s provincial panel data. J. Clean. Prod. 2022, 378, 134453. [Google Scholar] [CrossRef]
- Fu, X.-M.; Wu, W.-Y.; Lin, C.-Y.; Ku, H.-L.; Wang, L.-X.; Lin, X.-H.; Liu, Y. Green innovation ability and spatial spillover effect of marine fishery in China. Ocean Coast. Manag. 2022, 228, 106310. [Google Scholar] [CrossRef]
- Gong, M.; You, Z.; Wang, L.; Cheng, J. Environmental Regulation, Trade Comparative Advantage, and the Manufacturing Industry’s Green Transformation and Upgrading. Int. J. Environ. Res. Public Health 2020, 17, 2823. [Google Scholar] [CrossRef] [Green Version]
- Yang, F.; Sun, Y.; Zhang, Y.; Wang, T. Factors Affecting the Manufacturing Industry Transformation and Upgrading: A Case Study of Guangdong–Hong Kong–Macao Greater Bay Area. Int. J. Environ. Res. Public Health 2021, 18, 7157. [Google Scholar] [CrossRef] [PubMed]
- Omrani, N.; Rejeb, N.; Maalaoui, A.; Dabic, M.; Kraus, S. Drivers of Digital Transformation in SMEs. IEEE Trans. Eng. Manag. 2022, 1–14. [Google Scholar] [CrossRef]
- Na, D.D.; Li, Y. Research on the factors influencing the transformation and upgrading of manufacturing industry. Study Explor. 2020, 305, 130–135. (In Chinese) [Google Scholar]
- Cho, Y.S.; Linderman, K. Resource-Based Product and Process Innovation Model: Theory Development and Empirical Validation. Sustainability 2020, 12, 913. [Google Scholar] [CrossRef] [Green Version]
- Shen, L.; Fan, R.; Wang, Y.; Yu, Z.; Tang, R. Impacts of Environmental Regulation on the Green Transformation and Upgrading of Manufacturing Enterprises. Int. J. Environ. Res. Public Health 2020, 17, 7680. [Google Scholar] [CrossRef]
- Zhao, X.; Zhao, L.; Sun, X.; Xing, Y. The incentive effect of government subsidies on the digital transformation of manufacturing enterprises. Int. J. Emerg. Mark. 2023. ahead of print. [Google Scholar] [CrossRef]
- Xie, H.; Yang, S.; Liu, Y.; Li, M. Can Internet construction promote enterprise upgrading? Ekon. Istraz. 2022, 36, 1933–1959. [Google Scholar] [CrossRef]
- Lin, S.; Cai, S.; Sun, J.; Wang, S.; Zhao, D. Influencing mechanism and achievement of manufacturing transformation and upgrading: Empirical analysis based on PLS-SEM model. J. Manuf. Technol. Manag. 2019, 30, 213–232. [Google Scholar] [CrossRef]
- Wang, Y.; Han, M. Research on the Impact Mechanism of Organizational-Based Psychological Ownership on the Intelligent Transformation of Manufacturing Enterprises: Based on the Perspective of Technological Change. Psychol. Res. Behav. Manag. 2020, ume13, 775–786. [Google Scholar] [CrossRef] [PubMed]
- Acemoglu, D.; Zilibotti, F. Productivity Differences. Q. J. Econ. 2001, 116, 563–606. [Google Scholar] [CrossRef] [Green Version]
- Li, Y.; Ma, H.; Xiong, J.; Zhang, J.; Divakaran, P.K.P. Manufacturing structure, transformation path, and performance evolution: An industrial network perspective. Socio-Economic Plan. Sci. 2022, 82, 101230. [Google Scholar] [CrossRef]
- Shen, J.; Sha, Z.; Wu, Y.J. Enterprise Adaptive Marketing Capabilities and Sustainable Innovation Performance: An Opportunity–Resource Integration Perspective. Sustainability 2020, 12, 469. [Google Scholar] [CrossRef] [Green Version]
- Dixon, S.E.A.; Meyer, K.E.; Day, M. Stages of Organizational Transformation in Transition Economies: A Dynamic Capabilities Approach. J. Manag. Stud. 2010, 47, 416–436. [Google Scholar] [CrossRef]
- Voss, G.B.; Sirdeshmukh, D.; Voss, Z.G. The Effects of Slack Resources and Environmentalthreat on Product Exploration and Exploitation. Acad. Manag. J. 2008, 51, 147–164. [Google Scholar] [CrossRef] [Green Version]
- Tan, J.; Peng, M.W. Organizational slack and firm performance during economic transitions: Two studies from an emerging economy. Strat. Manag. J. 2003, 24, 1249–1263. [Google Scholar] [CrossRef]
- Chen, C.-J.; Huang, Y.-F. Creative workforce density, organizational slack, and innovation performance. J. Bus. Res. 2010, 63, 411–417. [Google Scholar] [CrossRef]
- Ndofor, H.A.; Sirmon, D.G.; He, X.M. Firm resources, competitive actions and performance: Investigating a mediated model with evidence from the in-vitro diagnostics industry. Strat. Manag. J. 2011, 32, 640–657. [Google Scholar] [CrossRef]
- Wadhwa, A.; Basu, S. Exploration and Resource Commitments in Unequal Partnerships: An Examination of Corporate Venture Capital Investments. J. Prod. Innov. Manag. 2013, 30, 916–936. [Google Scholar] [CrossRef]
- Ponter, M.E. Competitive Advantage: Creating and Sustaining Superior Performance; Free Press: New York, NY, USA, 1998. [Google Scholar]
- Vanacker, T.; Collewaert, V.; Paeleman, I. The Relationship between Slack Resources and the Performance of Entrepreneurial Firms: The Role of Venture Capital and Angel Investors. J. Manag. Stud. 2013, 50, 1070–1096. [Google Scholar] [CrossRef]
- OECD. Oslo Manual 2018: Guidelines for Collecting, Reporting and Using Data on Innovation, 4th ed.; OECD Publishing: Paris, France; Eurostat: Kirchberg, Luxembourg, 2018. [Google Scholar]
- Abernathy, W.J.; Utterback, J.M. Patterns of industrial innovation. Technol. Rev. 1978, 80, 40–47. [Google Scholar] [CrossRef]
- Zhang, H.; Chen, H.H.; Lao, K.; Ren, Z. The Impacts of Resource Endowment, and Environmental Regulations on Sustainability—Empirical Evidence Based on Data from Renewable Energy Enterprises. Energies 2022, 15, 4678. [Google Scholar] [CrossRef]
- Guo, K.M.; Yan, S.; Hang, J. Factor endowments and structural transformation. China Econ. Q. 2020, 19, 1213–1236. (In Chinese) [Google Scholar] [CrossRef]
- Wang, S.H.; Chen, L. Incremental adjustment and stock adjustment in the transformation and upgrading of manufacturing industry. Mod. Econ. Res. 2014, 6, 38–41. (In Chinese) [Google Scholar] [CrossRef]
- Wen, X.; Xia, J.; Ye, Y. Customer stability, managerial overconfidence, and enterprise investment in innovation: A perspective based on “Made in China 2025”. Asia-Pacific J. Account. Econ. 2020, 29, 673–691. [Google Scholar] [CrossRef]
- Hall, B.H.; Moncada-Paternò-Castello, P.; Montresor, S.; Vezzani, A. Financing constraints, R&D investments and innovative performances: New empirical evidence at the firm level for Europe. Econ. Innov. New Technol. 2015, 25, 183–196. [Google Scholar] [CrossRef]
- Li, B.; Wu, L.H. Resource dependence or innovation success? –on the survival of newly founded ventures based on organizational imprinting role. Foreign. Econ. Manag. 2018, 40, 35–50. (In Chinese) [Google Scholar] [CrossRef]
- de Jong, A.; Zacharias, N.A.; Nijssen, E.J. How young companies can effectively manage their slack resources over time to ensure sales growth: The contingent role of value-based selling. J. Acad. Mark. Sci. 2021, 49, 304–326. [Google Scholar] [CrossRef]
- Li, X.X.; Liu, C.L. Investment intensity change: From the perspectives of performance deviation and redundant resources. J. Manag. Sci. 2013, 26, 26–37. (In Chinese) [Google Scholar] [CrossRef]
- Acemoglu, D. Patterns of Skill Premia. Rev. Econ. Stud. 2003, 70, 199–230. [Google Scholar] [CrossRef]
- Zweimuller, J.; Brunner, J.K. Innovation and growth with rich and poor consumers. Metroeconomica 2005, 56, 233–262. [Google Scholar] [CrossRef]
- Xu, Q.R. Research, Development and Technology Innovation Management; Higher Education Press: Beijing, China, 2010. [Google Scholar]
- Lim, L.P.L.; Garnsey, E.; Gregory, M. Product and process innovation in biopharmaceuticals: A new perspective on development. R&D Manag. 2006, 36, 27–36. [Google Scholar] [CrossRef] [Green Version]
- Wu, L.; Sun, L.; Chang, Q.; Zhang, D.; Qi, P. How do digitalization capabilities enable open innovation in manufacturing enterprises? A multiple case study based on resource integration perspective. Technol. Forecast. Soc. Chang. 2022, 184, 122019. [Google Scholar] [CrossRef]
- Lin, H.-E.; McDonough, E.F.; Lin, S.-J.; Lin, C.Y.-Y. Managing the Exploitation/Exploration Paradox: The Role of a Learning Capability and Innovation Ambidexterity. J. Prod. Innov. Manag. 2012, 30, 262–278. [Google Scholar] [CrossRef]
- Majchrzak, A.; Ettlie, J.E. Taking Charge of Manufacturing: How Companies are Combining Technological and Organizational Innovations to Compete Successfully. Adm. Sci. Q. 1988, 33, 643–646. [Google Scholar] [CrossRef]
- Capon, N.; Farley, J.U.; Lehmann, D.R.; Hulbert, J.M. Profiles of Product Innovators Among Large U.S. Manufacturers. Manag. Sci. 1992, 38, 157–169. [Google Scholar] [CrossRef]
- Hitt, M.A.; Xu, K.; Carnes, C.M. Resource based theory in operations management research. J. Oper. Manag. 2015, 41, 77–94. [Google Scholar] [CrossRef]
- Linn, R. Product development in the chemical industry: A description of a maturing business. J. Prod. Innov. Manag. 1984, 1, 116–128. [Google Scholar] [CrossRef]
- Wang, J.X.; Wang, S.J. Do financial constraints inhibit innovation in manufacturing Enterprises?—An empirical analysis based on the World Bank’s Survey of Chinese Enterprises. J. Lanzhou Univ. Financ. Econ. 2022, 38, 78–91. (In Chinese) [Google Scholar] [CrossRef]
- Wang, M.-C.; Chen, P.-C.; Fang, S.-C. A critical view of knowledge networks and innovation performance: The mediation role of firms’ knowledge integration capability. J. Bus. Res. 2018, 88, 222–233. [Google Scholar] [CrossRef]
- Ma, H.Y.; Yu Meng, Y.; Wang, T.Y. Product diversification and fi rm performance: The Moderating role of resource heterogeneity and internationalization. J. Manag. Sci. 2016, 24 (Suppl. S1), 740–750. (In Chinese) [Google Scholar]
- Qiao, P.H.; Xie, H.; Zhang, Y. The effect of ambidextrous innovation on firm value: The mediating effects of leader regulatory focus. Sci. Technol. Prog. Policy 2022, 39, 93–102. (In Chinese) [Google Scholar] [CrossRef]
- Wang, L.; Shen, K.R.; Wu, Q.; Qin, W.P. The research of the relationship between exploratory innovation exploitation innovation and the new product development performance. Sci. Technol. Prog. Policy 2014, 31, 24–29. (In Chinese) [Google Scholar] [CrossRef]
- Ai, H.; Hu, S.; Li, K.; Shao, S. Environmental regulation, total factor productivity, and enterprise duration: Evidence from China. Bus. Strat. Environ. 2020, 29, 2284–2296. [Google Scholar] [CrossRef]
- Zhao, H.F.; Li, S.Y.; Wu, Z.W. The influence of central environmental inspection on the transformation and upgrading of manufacturing enterprises- based on the test of mediator effect of marketization process. Manag. Rev. 2022, 34, 3–14. (In Chinese) [Google Scholar] [CrossRef]
- Tang, W.B.; Fu, Y.H.; Wang, Z.X. Technology Innovation, Technology Introduction and Transformation of Economic Growth Pattern. Econ. Res. J. 2014, 49, 31–43. (In Chinese) [Google Scholar]
- Ren, S.G.; Zheng, J.J.; Liu, D.H.; Chen, X.H. Does emissions trading system improve firm’s total factor productivity—Evidence from Chinese listed companies. China Ind. Econ. 2019, 5, 5–23. (In Chinese) [Google Scholar] [CrossRef]
- Lu, X.D.; Lian, Y.J. Estimation of total factor productivity of industrial enterprises in China: 1999–2007, China. Econ. Q. 2012, 11, 541–558. (In Chinese) [Google Scholar] [CrossRef]
- Blundell, R.; Bond, S. Initial conditions and moment restrictions in dynamic panel data models. J. Econ. 1998, 87, 115–143. [Google Scholar] [CrossRef] [Green Version]
- Jancenelle, V.E. Tangible−Intangible resource composition and firm success. Technovation 2021, 108, 102337. [Google Scholar] [CrossRef]
- Dushnitsky, G.; Lenox, M.J. When do firms undertake R&D by investing in new ventures? Strat. Manag. J. 2005, 26, 947–965. [Google Scholar] [CrossRef]
- Lo, F.-Y.; Huarng, K.-H.; Rey-Martí, A. Entrepreneur subsidiary of business groups from emerging markets: A multi-level perspective. Int. Entrep. Manag. J. 2019, 15, 471–483. [Google Scholar] [CrossRef]
- Liang, S.; Li, T. Can Digital Transformation Promote Innovation Performance in Manufacturing Enterprises? The Mediating Role of R&D Capability. Sustainability 2022, 14, 10939. [Google Scholar] [CrossRef]
- Wang, A.; Zhu, L.; Sun, H.; Wang, S.; Ma, H. Fiscal Decentralization, Enterprise Digital Transformation and Enterprise Green Innovation—The Case of 11 Years A-Share Listed Companies in China. Sustainability 2023, 15, 6838. [Google Scholar] [CrossRef]
- Zhou, M.; Fan, R. The Impact of Green Capital Structure on Enterprise Development and the Regulation of Technological Innovation under Carbon Peaking. Sustainability 2023, 15, 5743. [Google Scholar] [CrossRef]
- Zhiyong, Z.; Yongbin, X.; Jiaying, C. Digital economy, industrial structure upgrading and green innovation efficiency of family enterprises. Int. Entrep. Manag. J. 2023, 3, 1–25. [Google Scholar] [CrossRef]
- Su, X.; Mou, C.; Zhou, S. Institutional environment, technological innovation capability and service-oriented transformation. PLoS ONE 2023, 18, e0281403. [Google Scholar] [CrossRef]
- Zhou, M.; Zhao, M. Research on the Performance Transmission of Green Technology Innovation in the Coal Industry under the Goal of Carbon Peaking and the Moderating Role of Government Macro-Regulation. Sustainability 2023, 15, 1544. [Google Scholar] [CrossRef]
- Jin, H.; Wei, J.L.; Yu, L.H. Can network infrastructure construction realize the transformation and upgrading of enterprises: A quasi-natural experiment from the “Broadband China”. Ind. Econ. Res. 2021, 115, 73–86. (In Chinese) [Google Scholar] [CrossRef]
- Gao, Y.; Chen, S.F. The Uncertainty of Economic Policy and the Increase of Total Factor Productivity of Export Enterprises. East China Econ. Manag. 2022, 36, 31–44. (In Chinese) [Google Scholar] [CrossRef]
- Wen, Z.; Ye, B. Analyses of Mediating Effects: The Development of Methods and Models. Adv. Psychol. Sci. 2014, 22, 731–745. [Google Scholar] [CrossRef]
- Sobel, M.E. Asymptotic confidence intervals for indirect effects in structural equation models. Sociol. Methodol. 1982, 13, 290–312. [Google Scholar] [CrossRef]
- MacKinnon, D.P.; Lockwood, C.M.; Hoffman, J.M.; West, S.G.; Sheets, V. A comparison of methods to test mediation and other intervening variable effects. Psychol. Methods 2002, 7, 83–104. [Google Scholar] [CrossRef]
- Betti, G.; Neri, L.; Lonzi, M.; Lemmi, A. Objective Environmental Indicators and Subjective Well-Being: Are They Directly Related? Sustainability 2020, 12, 2277. [Google Scholar] [CrossRef] [Green Version]
- Preacher, K.J.; Hayes, A.F. SPSS and SAS procedures for estimating indirect effects in simple mediation models. Behav. Res. Methods Instrum. Comput. 2004, 36, 717–731. [Google Scholar] [CrossRef] [Green Version]
- Zheng, J.L.; Chen, B.X. Comparative study on conditional configuration paths of manufacturing transformation and upgrading from the perspective of enterprise resources. Sci. Technol. Prog. Policy 2020, 37, 1–10. (In Chinese) [Google Scholar] [CrossRef]
- Peng, H.; Tan, H.; Zhang, Y. Human capital, financial constraints, and innovation investment persistence. Asian J. Technol. Innov. 2020, 28, 453–475. [Google Scholar] [CrossRef]
- Li, X.; Zhao, Y. Research on the Impact of Venture Capital Strategy on Enterprise Innovation Performance: Based on Evidence of Investment Timing and Rounds. Front. Environ. Sci. 2022, 10, 935441. [Google Scholar] [CrossRef]
- Wu, N.; Liu, Z. Higher education development, technological innovation and industrial structure upgrade. Technol. Forecast. Soc. Chang. 2020, 162, 120400. [Google Scholar] [CrossRef]
- Ju, X.; Di, L.; Yu, Y. Financing constraints, working capital management and the persistence of firm innovation. Econ. Res. J. 2013, 1, 4–16. (In Chinese) [Google Scholar]
- Hoegl, M.; Gibbert, M.; Mazursky, D. Financial constraints in innovation projects: When is less more? Res. Policy 2008, 37, 1382–1391. [Google Scholar] [CrossRef]
- Kong, Y.; Donkor, M.; Musah, M.; Nkyi, J.A.; Ampong, G.O.A. Capital Structure and Corporates Financial Sustainability: Evidence from Listed Non-Financial Entities in Ghana. Sustainability 2023, 15, 4211. [Google Scholar] [CrossRef]
- Chemmanur, T.J.; Kong, L.; Krishnan, K.; Yu, Q. Top Management Human Capital, Inventor Mobility, and Corporate Innovation. J. Financial Quant. Anal. 2018, 54, 2383–2422. [Google Scholar] [CrossRef] [Green Version]
- Chen, N.; Chang, H. Research on innovation cooperation strategy and resource model of enterprises. Stud. Sci. Sci. 2012, 30, 1910–1918. (In Chinese) [Google Scholar] [CrossRef]
- Gagnon, S. Resource-based competition and the new operations strategy. Int. J. Oper. Prod. Manag. 1999, 19, 125–138. [Google Scholar] [CrossRef]
- Zhang, J.; Guan, J. The time-varying impacts of government incentives on innovation. Technol. Forecast. Soc. Chang. 2018, 135, 132–144. [Google Scholar] [CrossRef]
- Hunt, S.D. A General Theory of Competition. Resources, Competences, Productivity, and Economic Growth; Sage Publications: Thousand Oaks, CA, USA, 2000. [Google Scholar]
- Varadarajan, R. Resource advantage theory, resource based theory, and theory of multimarket competition: Does multimarket rivalry restrain firms from leveraging resource Advantages? J. Bus. Res. 2023, 160, 113713. [Google Scholar] [CrossRef]
- Barney, J.B.; Ketchen, J.D.J.; Wright, M. Resource-Based Theory and the Value Creation Framework. J. Manag. 2021, 47, 1936–1955. [Google Scholar] [CrossRef]
- Mansion, S.E.; Bausch, A. Intangible assets and SMEs’ export behavior: A meta-analytical perspective. Small Bus. Econ. 2019, 55, 727–760. [Google Scholar] [CrossRef]
- Matloob, S.; Limón, M.L.S.; Montemayor, H.M.V.; Raza, A.; Rodriguez, J.C.C. Does Strategic Change Enhance the Relationship between Firms’ Resources and SMEs Performance in Pakistan? Sustainability 2023, 15, 1808. [Google Scholar] [CrossRef]
- Dong, C.; Liu, X.; Zhang, S. Returnee firms, R&D input and innovation performance: Critical roles of political and economic stakeholders. Eur. J. Innov. Manag. 2023, 6, 1–25. [Google Scholar] [CrossRef]
- Leute, M.; Bammens, Y.; Carree, M.; Huybrechts, J. Ownership Heterogeneity and Corporate Innovation Output: A Study on Family Blockholders and Activist Hedge Funds. Fam. Bus. Rev. 2023, 36, 254–280. [Google Scholar] [CrossRef]
- Xu, X.; Imran, M.; Ayaz, M.; Lohana, S. The Mediating Role of Green Technology Innovation with Corporate Social Responsibility, Firm Financial, and Environmental Performance: The Case of Chinese Manufacturing Industries. Sustainability 2022, 14, 16951. [Google Scholar] [CrossRef]
- Wu, H.; Hu, S.; Hu, S. How digitalization works in promoting corporate sustainable development performance? The mediating role of green technology innovation. Environ. Sci. Pollut. Res. 2023, 30, 22013–22023. [Google Scholar] [CrossRef] [PubMed]
- Sun, Y.; Li, L.; Shi, H.; Chong, D. The transformation and upgrade of China’s manufacturing industry in Industry 4.0 era. Syst. Res. Behav. Sci. 2020, 37, 734–740. [Google Scholar] [CrossRef]
- Hu, R.; Yan, Y. Effects of Economic Policy Uncertainty on Manufacturing Structural Upgrading: Evidence from China. Discret. Dyn. Nat. Soc. 2021, 2021, 7364528. [Google Scholar] [CrossRef]
- Pinzaru, F.; Dima, A.M.; Zbuchea, A.; Veres, Z. Adopting Sustainability and Digital Transformation in Business in Romania: A Multifaceted Approach in the Context of the Just Transition. Amfiteatru Econ 2022, 24, 27–44. [Google Scholar] [CrossRef]
- Song, Y.; Yang, L.; Sindakis, S.; Aggarwal, S.; Chen, C. Analyzing the Role of High-Tech Industrial Agglomeration in Green Transformation and Upgrading of Manufacturing Industry: The Case of China. J. Knowl. Econ. 2022, 1–31. [Google Scholar] [CrossRef]
- Meng, F.; Xu, Y.; Zhao, G. Environmental regulations, green innovation and intelligent upgrading of manufacturing enterprises: Evidence from China. Sci. Rep. 2020, 10, 14485. [Google Scholar] [CrossRef]
- Lerman, L.V.; Benitez, G.B.; Müller, J.M.; de Sousa, P.R.; Frank, A.G. Smart green supply chain management: A configurational approach to enhance green performance through digital transformation. Supply Chain Manag. Int. J. 2022, 27, 147–176. [Google Scholar] [CrossRef]
- Xu, H.N.; Dong, B.R. How digital transformation can drive sustainable business development—A perspective based on the shaping of corporate core competencies. Contemp. Econ. Manag. 2023, 6, 1–14. (In Chinese) [Google Scholar]
- Chin, T.; Liu, R.H.; Yang, D.J.; Tsuei, T.C.; Hu, L.Y.; Yang, Y. Effects of dynamic core competences on own brand strategy in reverse internationalization. J. Manag. Sci. 2017, 30, 27–38. (In Chinese) [Google Scholar] [CrossRef]
- Zhang, J.; Kang, K.; Wei, X.; Zhang, Z. An empirical research of the effect of institutional environments and risk perception on governance mode of supply chain network. Manag. Rev. 2020, 32, 275–285. (In Chinese) [Google Scholar] [CrossRef]
- Ma, Y.; Xia, L.; Meng, W. Research on China’s Manufacturing Industry Upgrading from the Global Perspective. IOP Conf. Series: Earth Environ. Sci. 2019, 295, 032060. [Google Scholar] [CrossRef]
- Helfat, C.E.; Kaul, A.; Ketchen, D.J.; Barney, J.B.; Chatain, O.; Singh, H. Renewing the resource-based view: New contexts, new concepts, and new methods. Strat. Manag. J. 2023, 44, 1357–1390. [Google Scholar] [CrossRef]
- Cuthbertson, R.W.; Furseth, P.I. Digital services and competitive advantage: Strengthening the links between RBV, KBV, and innovation. J. Bus. Res. 2022, 152, 168–176. [Google Scholar] [CrossRef]


| Dimension 1. Product Innovation |
| Typical Context Matching from the Original Analysis of the Text Keywords |
| product, new product, product quality, product structure, product design, product development, product formalization, product service, product distribution, product maintenance, product function, product appearance, product type, product performance, product commissioning, product added value, new services, product portfolio, new functions, product market, product development and design, product function upgrade, product life, product differentiation, product design, product aesthetics, product practicality, product stability, product comfort, economic efficiency |
| Dimension 2. Process Innovation |
| Typical Context Matching from the Original Analysis of the Text Keywords |
| process, manufacturing technique, production process, cost advantage, production performance, production cost, production efficiency, process technology, process innovation, technique innovation, production method, process flow, management process, labor productivity, management method, processing method, testing method, process technology innovation, process equipment innovation, process technology upgrade, intelligent transformation, cost reduction, cost savings, energy saving and emission reduction, product processing sequence, processing technology, processing procedures, production side, process upgrading and optimization, equipment upgrading and optimization, production equipment, process transformation and upgrading, resource utilization, cost cutting, processing methods, process equipment flow, production processing, equipment renewal, process flow optimization, assembly processes, processing efficiency, industrialized production, production lines, product conversion rate, new equipment, control devices, processing equipment, industrial preparation methods, mass production, yield, production processes, process times, manufacturing costs, process simplicity, failure rates, improved yields, scrap rates, yield rates, processing accuracy |
| Variable Type | Variable Name | Variable Symbol | Variable Definition |
|---|---|---|---|
| Dependent variable | Transformation and upgrading | Tfp | Calculated by the GMM method |
| Mediating variables | Innovation investment intensity | Inv | Ratio of corporate innovation investment to the level of the same industry |
| Product innovation | Product | The number of product patents | |
| Process innovation | Process | The number of process patents | |
| Innovation quantity | Count | Sum of product innovation and process innovation patents | |
| Independent variable | Resource abundance | Fyd | Calculated by using entropy weight method |
| Control variables | Firm size | Size | Ln (total assets) |
| Leverage | Lev | The ratio of total debts to total assets | |
| Operating profit margins | Pro | The ratio of operating profit to operating income | |
| Remuneration of the top three directors | Inc | The natural logarithm of remuneration of the top three directors | |
| Net profit growth rate | Growth | (Net profit for the period − net profit for the previous period)/net profit for the previous period | |
| Ownership concentration | Shrcr | The sum of the shareholding ratio of the top 3 largest shareholders of the company | |
| Capital intensity | Zbmw | Fixed assets/number of employees/10,000 | |
| CEO duality | Dual | Take 1 if the Chairman and CEO are the same people, otherwise, take 0 | |
| Funding liquidity | Ldx | Monetary funds/total assets | |
| Management concentration | Mna | Number of senior managers/number of employees | |
| Total operating cost rate | Cbl | Operating profit/operating costs | |
| Fixed asset growth | Fgr | (Closing fixed assets − beginning fixed assets)/beginning fixed assets | |
| Sustainable growth rate | Sus | Roe × earnings retention ratio/(1 − Roe × earnings retention ratio) | |
| Establishment of committees | Com | The number of the committees of the company | |
| Return on net assets | Roe | Net profit/net assets | |
| Percentage of independent directors | Dratio | Number of independent directors/number of directors | |
| Year | Year | Year dummy variables | |
| Industry | Ind | Industry dummy variables |
| Variables | (1) Tfp | (2) Inv | (3) Tfp | (4) Product | (5) Process | (6) Tfp | (7) Tfp | (8) Count | (9) Tfp |
|---|---|---|---|---|---|---|---|---|---|
| Fyd | 11.9558 *** | 24.1892 *** | 11.4484 *** | 1.8848 ** | 4.3417 ** | 11.8897 *** | 11.8826 *** | 6.2265 ** | 11.8768 *** |
| (18.7693) | (6.3651) | (19.9744) | (1.9735) | (2.0110) | (18.6998) | (18.6825) | (2.1368) | (18.6885) | |
| Inv | 0.0210 *** | ||||||||
| (3.5942) | |||||||||
| Product | 0.0351 *** | ||||||||
| (3.6134) | |||||||||
| Process | 0.0169 ** | ||||||||
| (2.1022) | |||||||||
| Count | 0.0127 *** | ||||||||
| (2.6142) | |||||||||
| Size | 2.8305 *** | 5.9512 *** | 2.7056 *** | −0.4647 *** | −0.6903 ** | 2.8468 *** | 2.8421 *** | −1.1550 *** | 2.8451 *** |
| (38.0252) | (12.5587) | (31.1863) | (−2.8687) | (−2.4407) | (38.3910) | (38.2470) | (−2.7054) | (38.3321) | |
| Lev | −0.2055 | −2.4394 *** | −0.1543 | 0.2958 | 0.0391 | −0.2158 | −0.2061 | 0.3349 | −0.2097 |
| (−1.1498) | (−3.7361) | (−0.8655) | (1.4742) | (0.1066) | (−1.2099) | (−1.1572) | (0.6292) | (−1.1774) | |
| Pro | −4.2276 *** | −7.9065 *** | −4.0617 *** | 0.0325 | −0.3946 | −4.2287 *** | −4.2209 *** | −0.3621 | −4.2230 *** |
| (−6.4721) | (−4.0108) | (−6.2826) | (0.0844) | (−0.5984) | (−6.4703) | (−6.4783) | (−0.3751) | (−6.4768) | |
| Growth | −0.0081 | −0.0044 | −0.0080 | 0.0026 | 0.0010 | −0.0082 | −0.0081 | 0.0036 | −0.0082 |
| (−1.4912) | (−0.3045) | (−1.5053) | (0.6363) | (0.1441) | (−1.5111) | (−1.5003) | (0.3394) | (−1.5053) | |
| Inc | 0.0205 | 0.2798 *** | 0.0146 | −0.0606 | −0.0959 | 0.0226 | 0.0221 | −0.1565 | 0.0225 |
| (1.2323) | (2.8290) | (0.8785) | (−1.5358) | (−1.0831) | (1.3570) | (1.3257) | (−1.2950) | (1.3479) | |
| Dual | −0.0674 ** | 0.2670 | −0.0730 *** | 0.0312 | 0.0464 | −0.0685 ** | −0.0682 ** | 0.0776 | −0.0684 ** |
| (−2.4715) | (1.4303) | (−2.6556) | (0.5362) | (0.4655) | (−2.5195) | (−2.5096) | (0.5108) | (−2.5175) | |
| Shrcr | 0.0040 *** | −0.0028 | 0.0041 *** | −0.0005 | −0.0023 | 0.0040 *** | 0.0040 *** | −0.0028 | 0.0040 *** |
| (3.5990) | (−0.4648) | (3.6770) | (−0.2663) | (−0.6898) | (3.6161) | (3.6339) | (−0.5686) | (3.6317) | |
| Zbmw | 0.0062 *** | −0.0093 *** | 0.0064 *** | 0.0017 ** | 0.0043 ** | 0.0061 *** | 0.0061 *** | 0.0060 ** | 0.0061 *** |
| (12.8292) | (−3.1898) | (13.2579) | (1.9854) | (2.3799) | (12.7649) | (12.6704) | (2.3871) | (12.6927) | |
| Ldx | −0.4612 *** | −1.4796 * | −0.4302 *** | 0.6186 | 1.1834 | −0.4829 *** | −0.4812 *** | 1.8020 | −0.4841 *** |
| (−3.6858) | (−1.8170) | (−3.4875) | (1.5138) | (1.5594) | (−3.8601) | (−3.8363) | (1.5800) | (−3.8616) | |
| Mna | −152.1335 *** | 798.4957 *** | −168.8834 *** | 34.7795 | 78.6731 | −153.3527 *** | −153.4608 *** | 113.4526 | −153.5722 *** |
| (−4.2021) | (4.9873) | (−4.7641) | (0.3928) | (0.5770) | (−4.2596) | (−4.2685) | (0.5353) | (−4.2738) | |
| Dratio | 0.1016 | 3.7660 *** | 0.0226 | −0.0601 | −0.2760 | 0.1037 | 0.1063 | −0.3361 | 0.1059 |
| (0.4743) | (2.8867) | (0.1077) | (−0.1460) | (−0.2851) | (0.4854) | (0.4963) | (−0.2549) | (0.4949) | |
| Cbl | −1.4108 *** | −2.6506 * | −1.3552 *** | 0.0374 | −0.5276 | −1.4121 *** | −1.4019 *** | −0.4903 | −1.4045 *** |
| (−3.7369) | (−1.7983) | (−3.6424) | (0.1057) | (−0.6837) | (−3.7491) | (−3.7512) | (−0.4622) | (−3.7522) | |
| Fgr | 0.0395 | −0.2088 | 0.0439 | −0.0254 | 0.1011 | 0.0404 | 0.0378 | 0.0756 | 0.0385 |
| (0.5900) | (−0.6910) | (0.6624) | (−0.2733) | (0.4283) | (0.6036) | (0.5638) | (0.2385) | (0.5753) | |
| Com | −0.0322 | −0.5205 *** | −0.0212 | 0.0235 | 0.0617 | −0.0330 | −0.0332 | 0.0852 | −0.0332 |
| (−1.3103) | (−2.9440) | (−0.8772) | (0.4889) | (0.4607) | (−1.3350) | (−1.3391) | (0.4850) | (−1.3407) | |
| Sus | −0.3366 | 3.4378 ** | −0.4088 | 0.7104 | 0.8051 | −0.3615 | −0.3502 | 1.5155 | −0.3559 |
| (−1.2458) | (1.9819) | (−1.5218) | (1.4114) | (0.8224) | (−1.3349) | (−1.2889) | (1.0990) | (−1.3103) | |
| Roe | 3.8724 *** | 3.3480 | 3.8021 *** | −0.3116 | −0.8421 | 3.8833 *** | 3.8866 *** | −1.1537 | 3.8870 *** |
| (7.9712) | (1.6236) | (7.9036) | (−0.5668) | (−0.7343) | (8.0172) | (8.0503) | (−0.7215) | (8.0476) | |
| Constant | 12.0549 *** | −61.1922 *** | 13.3385 *** | 5.3034 *** | 8.5810 *** | 11.8690 *** | 11.9101 *** | 13.8844 *** | 11.8788 *** |
| (16.5270) | (−13.3153) | (16.9716) | (3.6983) | (3.5101) | (16.3202) | (16.3457) | (3.7781) | (16.3232) | |
| Year dummy | YES | YES | YES | YES | YES | YES | YES | YES | YES |
| Ind dummy | YES | YES | YES | YES | YES | YES | YES | YES | YES |
| Observations | 1356 | 1356 | 1356 | 1356 | 1356 | 1356 | 1356 | 1356 | 1356 |
| R−squared | 0.9568 | 0.6964 | 0.9573 | 0.0785 | 0.0558 | 0.9570 | 0.9570 | 0.0616 | 0.9570 |
| Variables | (1) Tfp | (2) Inv | (3) Tfp | (4) Product | (5) Process | (6) Tfp | (7) Tfp | (8) Count | (9) Tfp |
|---|---|---|---|---|---|---|---|---|---|
| Fyd | 111.2636 *** | 9.7127 *** | 110.0454 *** | 21.7236 ** | 16.3754 | 111.0839 *** | 111.1208 *** | 38.0990 | 111.0620 *** |
| (30.2816) | (2.9333) | (30.5544) | (1.9845) | (0.9813) | (30.2254) | (30.2222) | (1.5088) | (30.2110) | |
| Inv | 0.1254 *** | ||||||||
| (4.8329) | |||||||||
| Product | 0.0083 | ||||||||
| (1.5770) | |||||||||
| Process | 0.0087 *** | ||||||||
| (2.6481) | |||||||||
| Count | 0.0053 ** | ||||||||
| (2.4033) | |||||||||
| Size | 2.3670 *** | 0.9028 *** | 2.2538 *** | −0.4045 *** | −0.2538 | 2.3703 *** | 2.3692 *** | −0.6583 ** | 2.3705 *** |
| (44.2971) | (12.1851) | (36.3672) | (−3.1910) | (−1.4528) | (44.3466) | (44.3416) | (−2.3930) | (44.3684) | |
| Lev | 0.1416 | −0.1393 ** | 0.1591 | −0.0390 | −0.1265 | 0.1420 | 0.1427 | −0.1655 | 0.1425 |
| (1.3966) | (−2.1827) | (1.5937) | (−0.2325) | (−0.5555) | (1.3991) | (1.4067) | (−0.4530) | (1.4043) | |
| Pro | −3.0033 *** | −0.8566 *** | −2.8958 *** | 0.2432 | 0.2332 | −3.0053 *** | −3.0053 *** | 0.4764 | −3.0058 *** |
| (−7.9407) | (−5.7829) | (−7.6888) | (0.9264) | (0.6239) | (−7.9530) | (−7.9568) | (0.8114) | (−7.9585) | |
| Growth | 0.0002 | −0.0025 * | 0.0005 | −0.0035 | −0.0067 | 0.0003 | 0.0003 | −0.0102 | 0.0003 |
| (0.0933) | (−1.8659) | (0.2257) | (−1.1816) | (−1.4469) | (0.1055) | (0.1176) | (−1.4426) | (0.1159) | |
| Inc | 0.0579 *** | 0.0341 ** | 0.0536 *** | −0.0014 | −0.0500 | 0.0579 *** | 0.0583 *** | −0.0514 | 0.0582 *** |
| (3.6823) | (2.4557) | (3.4972) | (−0.0340) | (−0.8041) | (3.6809) | (3.7091) | (−0.5490) | (3.6980) | |
| Dual | −0.0225 | 0.0222 | −0.0253 | −0.0768 | −0.0665 | −0.0219 | −0.0220 | −0.1433 | −0.0218 |
| (−1.3160) | (1.5943) | (−1.4789) | (−1.5179) | (−0.8741) | (−1.2781) | (−1.2824) | (−1.2328) | (−1.2716) | |
| Shrcr | −0.0008 | −0.0005 | −0.0008 | −0.0003 | −0.0020 | −0.0008 | −0.0008 | −0.0023 | −0.0008 |
| (−1.2600) | (−0.8970) | (−1.1697) | (−0.1848) | (−0.7922) | (−1.2557) | (−1.2336) | (−0.5785) | (−1.2413) | |
| Zbmw | 0.0083 *** | −0.0008 *** | 0.0084 *** | 0.0017 ** | 0.0012 | 0.0083 *** | 0.0083 *** | 0.0029 ** | 0.0083 *** |
| (23.3860) | (−2.7585) | (23.5150) | (2.3956) | (1.3324) | (23.3706) | (23.4267) | (1.9728) | (23.4089) | |
| Ldx | −0.6309 *** | 0.1238 ** | −0.6464 *** | −0.1826 | −0.2438 | −0.6293 *** | −0.6287 *** | −0.4264 | −0.6286 *** |
| (−8.7296) | (2.2559) | (−9.0175) | (−0.8815) | (−0.7891) | (−8.7233) | (−8.7139) | (−0.9094) | (−8.7158) | |
| Mna | −57.5735 *** | 8.1049 *** | −58.5900 *** | 4.1321 | 4.5326 | −57.6077 *** | −57.6130 *** | 8.6647 | −57.6193 *** |
| (−18.2623) | (5.6793) | (−18.4703) | (0.4875) | (0.4262) | (−18.2504) | (−18.2851) | (0.4989) | (−18.2683) | |
| Dratio | −0.3239 ** | 0.1527 | −0.3430 ** | −0.1434 | −0.1164 | −0.3227 ** | −0.3228 ** | −0.2598 | −0.3225 ** |
| (−2.0420) | (1.3313) | (−2.1857) | (−0.3078) | (−0.1701) | (−2.0352) | (−2.0377) | (−0.2468) | (−2.0353) | |
| Cbl | −1.0911 *** | −0.1371 | −1.0739 *** | −0.3983 * | −0.8329 ** | −1.0878 *** | −1.0839 *** | −1.2312 ** | −1.0846 *** |
| (−4.2143) | (−1.2984) | (−4.2419) | (−1.6492) | (−2.2044) | (−4.2023) | (−4.1871) | (−2.1530) | (−4.1903) | |
| Fgr | 0.0272 | −0.0020 | 0.0274 | 0.0538 | −0.0066 | 0.0267 | 0.0272 | 0.0471 | 0.0269 |
| (1.3836) | (−0.1746) | (1.4042) | (0.8795) | (−0.0719) | (1.3587) | (1.3768) | (0.3332) | (1.3637) | |
| Com | 0.0194 | −0.0669 *** | 0.0278 | 0.0414 | −0.0319 | 0.0190 | 0.0197 | 0.0095 | 0.0193 |
| (0.6931) | (−2.7710) | (1.0114) | (0.6613) | (−0.4039) | (0.6817) | (0.7035) | (0.0720) | (0.6922) | |
| Sus | −0.5901 *** | 0.4180 ** | −0.6426 *** | 0.6871 | 0.7290 | −0.5958 *** | −0.5965 *** | 1.4161 | −0.5976 *** |
| (−2.8448) | (2.2529) | (−3.1209) | (1.4287) | (1.1593) | (−2.8701) | (−2.8757) | (1.4354) | (−2.8801) | |
| Roe | 3.8996 *** | 0.9565 *** | 3.7796 *** | −0.6623 | −0.7711 | 3.9051 *** | 3.9063 *** | −1.4334 | 3.9072 *** |
| (9.0527) | (4.1967) | (8.8594) | (−1.3468) | (−1.2641) | (9.0546) | (9.0539) | (−1.4444) | (9.0550) | |
| Constant | 13.6436 *** | −8.5310 *** | 14.7136 *** | 4.1476 *** | 4.6525 *** | 13.6093 *** | 13.6031 *** | 8.8002 *** | 13.5971 *** |
| (24.1382) | (−13.2162) | (24.1723) | (3.6020) | (2.8191) | (24.0371) | (24.0302) | (3.4257) | (24.0127) | |
| Year dummy | YES | YES | YES | YES | YES | YES | YES | YES | YES |
| Ind dummy | YES | YES | YES | YES | YES | YES | YES | YES | YES |
| Observations | 3406 | 3406 | 3406 | 3406 | 3406 | 3406 | 3406 | 3406 | 3406 |
| R−squared | 0.9310 | 0.4667 | 0.9317 | 0.0575 | 0.0516 | 0.9310 | 0.9311 | 0.0600 | 0.9311 |
| Sobel Test for Product Mediator Variables | Sobel Test for Process Mediator Variables | Sobel Test for Count Mediator Variables | |||||||
| z | mediating effect | z | mediating effect | z | mediating effect | ||||
| 1.2438 | significant | 0.9197 | insignificant | 1.2787 | significant | ||||
| Variables | (1) Tfp | (2) Inv | (3) Tfp | (4) Product | (5) Process | (6) Tfp | (7) Tfp | (8) Count | (9) Tfp |
|---|---|---|---|---|---|---|---|---|---|
| Fyd | 14.3935 *** | 30.8727 *** | 13.5997 *** | 3.9560 | 3.0301 *** | 14.3589 *** | 14.2899 *** | 7.2981** | 14.2867 *** |
| (11.2535) | (5.0069) | (10.6030) | (1.4591) | (2.6060) | (11.2292) | (11.1546) | (2.4785) | (11.1622) | |
| Inv | 0.0257 ** | ||||||||
| (2.3261) | |||||||||
| Product | 0.0087 | ||||||||
| (0.8171) | |||||||||
| Process | 0.0342 | ||||||||
| (1.2126) | |||||||||
| Count | 0.0146 | ||||||||
| (1.3214) | |||||||||
| Size | 2.7288 *** | 3.7240 *** | 2.6331 *** | −0.6094 ** | −0.3823 *** | 2.7341 *** | 2.7419 *** | −0.8595 *** | 2.7414 *** |
| (27.0765) | (7.6766) | (23.5904) | (−2.0450) | (−3.5809) | (27.1668) | (27.0692) | (−3.2655) | (27.0972) | |
| Lev | −0.1527 | −0.7874 | −0.1324 | 0.6318 * | 0.2054 | −0.1582 | −0.1597 | 0.4335 | −0.1590 |
| (−0.9141) | (−1.4116) | (−0.8040) | (1.6743) | (1.3900) | (−0.9474) | (−0.9582) | (1.2620) | (−0.9539) | |
| Pro | −3.5026 *** | −2.2705 | −3.4442 *** | −0.3482 | −0.3017 | −3.4995 *** | −3.4923 *** | −0.8444 | −3.4902 *** |
| (−4.4460) | (−1.0374) | (−4.5772) | (−0.3932) | (−0.8124) | (−4.4357) | (−4.4318) | (−0.9665) | (−4.4289) | |
| Growth | −0.0093 ** | −0.0135 | −0.0089 ** | −0.0001 | 0.0030 | −0.0093 ** | −0.0094 ** | 0.0060 | −0.0094 ** |
| (−2.3237) | (−0.8781) | (−2.3114) | (−0.0137) | (1.1570) | (−2.3240) | (−2.3506) | (1.0132) | (−2.3485) | |
| Inc | 0.0293 | 0.4002 *** | 0.0190 | −0.1195 * | −0.0213 | 0.0303 | 0.0300 | −0.0619 | 0.0302 |
| (1.1057) | (3.6533) | (0.7015) | (−1.9029) | (−0.7312) | (1.1394) | (1.1320) | (−0.8985) | (1.1384) | |
| Dual | −0.0902 *** | −0.0527 | −0.0888 *** | −0.1327 | −0.0487 | −0.0890 *** | −0.0885 *** | −0.1178 | −0.0885 *** |
| (−2.7200) | (−0.3978) | (−2.6746) | (−1.2392) | (−1.1323) | (−2.6818) | (−2.6679) | (−1.1373) | (−2.6667) | |
| Shrcr | 0.0031 *** | −0.0040 | 0.0032 *** | −0.0042 | −0.0013 | 0.0032 *** | 0.0032 *** | −0.0026 | 0.0032 *** |
| (2.7684) | (−0.7158) | (2.8571) | (−1.3004) | (−1.0050) | (2.8015) | (2.8122) | (−0.8766) | (2.8074) | |
| Zbmw | 0.0055 *** | −0.0008 | 0.0055 *** | 0.0022 | 0.0012 ** | 0.0054 *** | 0.0054 *** | 0.0027 * | 0.0054 *** |
| (10.6940) | (−0.2758) | (10.6370) | (1.5914) | (1.9874) | (10.6831) | (10.6137) | (1.8092) | (10.6275) | |
| Ldx | −1.1292 *** | −0.4069 | −1.1188 *** | 0.5814 | 0.2588 | −1.1343 *** | −1.1381 *** | 0.5573 | −1.1374 *** |
| (−5.3644) | (−0.4647) | (−5.4882) | (1.1252) | (1.1593) | (−5.3930) | (−5.4065) | (1.0644) | (−5.4065) | |
| Mna | −112.0752 ** | 595.5835 *** | −127.3880 *** | 71.3323 | 61.4725 | −112.6985 ** | −114.1779 ** | 175.1449 | −114.6375 ** |
| (−2.4657) | (3.5763) | (−2.8225) | (0.6867) | (1.1745) | (−2.4788) | (−2.5156) | (1.3586) | (−2.5271) | |
| Dratio | −0.1975 | 0.5725 | −0.2122 | 1.7873 * | 1.0547 ** | −0.2131 | −0.2336 | 2.5492 ** | −0.2348 |
| (−0.7350) | (0.4595) | (−0.7695) | (1.7511) | (2.3301) | (−0.7858) | (−0.8519) | (2.3107) | (−0.8576) | |
| Cbl | −0.1052 | −0.3769 | −0.0955 | −0.8933 | −0.0915 | −0.0974 | −0.1021 | −0.3395 | −0.1002 |
| (−0.1411) | (−0.1647) | (−0.1352) | (−0.7729) | (−0.2263) | (−0.1303) | (−0.1367) | (−0.3465) | (−0.1342) | |
| Fgr | −0.0530 | −0.0259 | −0.0523 | −0.0223 | 0.0055 | −0.0528 | −0.0532 | 0.0199 | −0.0533 |
| (−1.4545) | (−0.1422) | (−1.4186) | (−0.2720) | (0.1758) | (−1.4475) | (−1.4620) | (0.2448) | (−1.4650) | |
| Com | 0.0612 | −0.2058 | 0.0665 | −0.0078 | 0.0003 | 0.0613 | 0.0612 | 0.0106 | 0.0611 |
| (1.4002) | (−1.0479) | (1.5356) | (−0.1137) | (0.0081) | (1.4019) | (1.4010) | (0.1288) | (1.3976) | |
| Sus | 1.1147 | 4.8776 * | 0.9893 | −0.3201 | 0.0397 | 1.1175 | 1.1133 | 0.0261 | 1.1143 |
| (1.4470) | (1.9062) | (1.3149) | (−0.2301) | (0.0670) | (1.4509) | (1.4443) | (0.0176) | (1.4465) | |
| Roe | 2.3282 ** | −1.7937 | 2.3743 ** | 0.3967 | 0.0851 | 2.3247 ** | 2.3252 ** | 0.3017 | 2.3237 ** |
| (2.4122) | (−0.6823) | (2.5308) | (0.2918) | (0.1532) | (2.4065) | (2.4048) | (0.2285) | (2.4049) | |
| Constant | 10.9422 *** | −46.4026 *** | 12.1353 *** | 6.8846 ** | 3.2431 *** | 10.8821 *** | 10.8313 *** | 7.4463 *** | 10.8333 *** |
| (8.7821) | (−8.9576) | (8.8353) | (2.2552) | (2.9895) | (8.7292) | (8.6635) | (2.8555) | (8.6695) | |
| Year dummy | YES | YES | YES | YES | YES | YES | YES | YES | YES |
| Ind dummy | YES | YES | YES | YES | YES | YES | YES | YES | YES |
| Observations | 848 | 848 | 848 | 848 | 848 | 848 | 848 | 848 | 848 |
| R−squared | 0.9400 | 0.5725 | 0.9406 | 0.1616 | 0.1970 | 0.9400 | 0.9401 | 0.1976 | 0.9401 |
| Sobel Test for Product Mediator Variables | Sobel Test for Process Mediator Variables | Sobel Test for Count Mediator Variables | |||||||
| z | mediating effect | z | mediating effect | z | mediating effect | ||||
| 0.7103 | insignificant | 1.0995 | significant | 1.1619 | insignificant | ||||
| Variables | (1) Tfp | (2) Inv | (3) Tfp | (4) Product | (5) Process | (6) Tfp | (7) Tfp | (8) Count | (9) Tfp |
|---|---|---|---|---|---|---|---|---|---|
| Fyd | 106.7431 *** | 15.9935 *** | 104.7915 *** | −5.9139 | −2.2215 | 106.7345 *** | 106.7365 *** | −8.1354 | 106.7312 *** |
| (32.1978) | (5.2207) | (32.5094) | (−0.7125) | (−0.2091) | (32.1870) | (32.1974) | (−0.4629) | (32.1945) | |
| Inv | 0.1220 *** | ||||||||
| (5.6624) | |||||||||
| Product | −0.0015 | ||||||||
| (−0.3252) | |||||||||
| Process | −0.0030 | ||||||||
| (−0.8542) | |||||||||
| Count | −0.0015 | ||||||||
| (−0.6897) | |||||||||
| Size | 2.3403 *** | 0.8453 *** | 2.2372 *** | −0.3359 *** | −0.4261 *** | 2.3398 *** | 2.3390 *** | −0.7620 *** | 2.3392 *** |
| (43.9387) | (12.6110) | (38.4008) | (−2.9770) | (−2.5840) | (43.9317) | (43.8145) | (−2.9773) | (43.8434) | |
| Lev | −0.0681 | −0.2359 *** | −0.0394 | 0.1288 | 0.5907 * | −0.0680 | −0.0664 | 0.7195 | −0.0671 |
| (−0.7110) | (−3.3103) | (−0.4149) | (0.6752) | (1.9096) | (−0.7090) | (−0.6916) | (1.5577) | (−0.6995) | |
| Pro | −3.3157 *** | −0.6034 *** | −3.2420 *** | −0.7332 * | −0.7443 | −3.3167 *** | −3.3179 *** | −1.4775 | −3.3178 *** |
| (−7.5265) | (−3.8898) | (−7.4625) | (−1.8577) | (−0.9779) | (−7.5248) | (−7.5449) | (−1.4112) | (−7.5372) | |
| Growth | −0.0035 | 0.0005 | −0.0035 * | 0.0019 | 0.0049 | −0.0034 | −0.0034 | 0.0068 | −0.0034 |
| (−1.6436) | (0.2861) | (−1.7046) | (0.4538) | (0.9644) | (−1.6424) | (−1.6363) | (0.7988) | (−1.6389) | |
| Inc | 0.0424 *** | 0.0389 ** | 0.0377 *** | −0.0131 | −0.0315 | 0.0424 *** | 0.0423 *** | −0.0446 | 0.0424 *** |
| (2.8857) | (2.0357) | (2.5905) | (−0.3149) | (−0.5266) | (2.8843) | (2.8806) | (−0.4815) | (2.8820) | |
| Dual | −0.0501 *** | −0.0019 | −0.0499 *** | 0.0583 | 0.0772 | −0.0501 *** | −0.0499 *** | 0.1355 | −0.0499 *** |
| (−3.1737) | (−0.1472) | (−3.1687) | (1.1496) | (1.1371) | (−3.1670) | (−3.1599) | (1.2420) | (−3.1610) | |
| Shrcr | 0.0008 | 0.0001 | 0.0008 | −0.0011 | −0.0014 | 0.0008 | 0.0008 | −0.0025 | 0.0008 |
| (1.2791) | (0.2292) | (1.2630) | (−0.5605) | (−0.5545) | (1.2758) | (1.2722) | (−0.6093) | (1.2727) | |
| Zbmw | 0.0077 *** | −0.0010 *** | 0.0078 *** | 0.0009 | 0.0020 | 0.0077 *** | 0.0077 *** | 0.0028 | 0.0077 *** |
| (21.4204) | (−2.8967) | (21.8479) | (1.1363) | (1.3307) | (21.4246) | (21.4187) | (1.3502) | (21.4237) | |
| Ldx | −0.7636 *** | 0.2344 *** | −0.7922 *** | 0.2089 | 0.6305 * | −0.7633 *** | −0.7617 *** | 0.8394 | −0.7624 *** |
| (−8.8965) | (2.7955) | (−9.1905) | (0.7505) | (1.6974) | (−8.8880) | (−8.8668) | (1.4110) | (−8.8742) | |
| Mna | −58.7177 *** | 9.5855 *** | −59.8874 *** | 3.5100 | 9.0352 | −58.7126 *** | −58.6908 *** | 12.5452 | −58.6993 *** |
| (−21.2506) | (6.7048) | (−21.5070) | (0.4464) | (0.9580) | (−21.2412) | (−21.2459) | (0.7721) | (−21.2412) | |
| Dratio | −0.5301 *** | 0.2010 * | −0.5546 *** | 0.4929 | 1.3084 * | −0.5294 *** | −0.5262 *** | 1.8013 * | −0.5275 *** |
| (−3.6179) | (1.7037) | (−3.7984) | (1.0454) | (1.8493) | (−3.6130) | (−3.5866) | (1.6678) | (−3.5976) | |
| Cbl | −1.0628 *** | 0.3331 *** | −1.1034 *** | −0.6864 ** | −1.4680 *** | −1.0638 *** | −1.0671 *** | −2.1544 *** | −1.0659 *** |
| (−2.7858) | (2.6865) | (−2.9468) | (−2.0337) | (−2.7384) | (−2.7866) | (−2.7987) | (−2.7090) | (−2.7937) | |
| Fgr | −0.0067 | −0.0038 | −0.0063 | −0.0140 | 0.0010 | −0.0068 | −0.0067 | −0.0130 | −0.0068 |
| (−0.4805) | (−0.3835) | (−0.4531) | (−0.3555) | (0.0135) | (−0.4820) | (−0.4805) | (−0.1297) | (−0.4820) | |
| Com | 0.0198 | −0.0539 ** | 0.0264 | −0.0217 | 0.0209 | 0.0198 | 0.0199 | −0.0008 | 0.0198 |
| (0.7236) | (−2.5068) | (0.9745) | (−0.3006) | (0.1656) | (0.7221) | (0.7254) | (−0.0042) | (0.7231) | |
| Sus | −0.3696 | 0.5045 * | −0.4311 | 0.3594 | −0.1281 | −0.3691 | −0.3700 | 0.2313 | −0.3692 |
| (−1.0026) | (1.8912) | (−1.1689) | (0.3529) | (−0.1231) | (−1.0010) | (−1.0030) | (0.1204) | (−1.0011) | |
| Roe | 4.3784 *** | 0.6706 ** | 4.2966 *** | 0.4194 | −0.0298 | 4.3790 *** | 4.3783 *** | 0.3896 | 4.3790 *** |
| (8.4750) | (1.9885) | (8.3821) | (0.4974) | (−0.0284) | (8.4743) | (8.4768) | (0.2216) | (8.4768) | |
| Constant | 14.3816 *** | −8.5918 *** | 15.4300 *** | 4.1448 *** | 5.4524 *** | 14.3877 *** | 14.3978 *** | 9.5972 *** | 14.3957 *** |
| (23.3666) | (−15.5587) | (23.6080) | (3.3205) | (3.1797) | (23.3250) | (23.3408) | (3.4701) | (23.3277) | |
| Year dummy | YES | YES | YES | YES | YES | YES | YES | YES | YES |
| Ind dummy | YES | YES | YES | YES | YES | YES | YES | YES | YES |
| Observations | 4099 | 4099 | 4099 | 4099 | 4099 | 4099 | 4099 | 4099 | 4099 |
| R−squared | 0.9191 | 0.4003 | 0.9200 | 0.0577 | 0.0441 | 0.9191 | 0.9191 | 0.0531 | 0.9191 |
| Variables | (1) Tfp | (2) Inv | (3) Tfp | (4) Product | (5) Process | (6) Tfp | (7) Tfp | (8) Count | (9) Tfp |
|---|---|---|---|---|---|---|---|---|---|
| Ffyd | 11.9392 *** | 24.1511 *** | 11.4327 *** | 1.8808 ** | 4.3332 ** | 11.8733 *** | 11.8661 *** | 6.2140 ** | 11.8604 *** |
| (18.7633) | (6.3661) | (19.9661) | (1.9729) | (2.0105) | (18.6941) | (18.6767) | (2.1363) | (18.6827) | |
| Inv | 0.0210 *** | ||||||||
| (3.5947) | |||||||||
| Product | 0.0351 *** | ||||||||
| (3.6141) | |||||||||
| Process | 0.0169 ** | ||||||||
| (2.1027) | |||||||||
| Count | 0.0127 *** | ||||||||
| (2.6148) | |||||||||
| Size | 2.8310 *** | 5.9526 *** | 2.7061 *** | −0.4645 *** | −0.6899 ** | 2.8473 *** | 2.8426 *** | −1.1544 *** | 2.8456 *** |
| (38.0408) | (12.5653) | (31.1964) | (−2.8684) | (−2.4401) | (38.4068) | (38.2626) | (−2.7048) | (38.3478) | |
| Lev | −0.2055 | −2.4396 *** | −0.1543 | 0.2957 | 0.0390 | −0.2159 | −0.2061 | 0.3347 | −0.2097 |
| (−1.1501) | (−3.7366) | (−0.8658) | (1.4739) | (0.1063) | (−1.2101) | (−1.1575) | (0.6289) | (−1.1777) | |
| Pro | −4.2267 *** | −7.9052 *** | −4.0609 *** | 0.0325 | −0.3946 | −4.2278 *** | −4.2200 *** | −0.3621 | −4.2221 *** |
| (−6.4726) | (−4.0108) | (−6.2830) | (0.0844) | (−0.5984) | (−6.4708) | (−6.4788) | (−0.3751) | (−6.4773) | |
| Growth | −0.0081 | −0.0044 | −0.0080 | 0.0026 | 0.0010 | −0.0082 | −0.0081 | 0.0036 | −0.0082 |
| (−1.4920) | (−0.3050) | (−1.5061) | (0.6361) | (0.1438) | (−1.5119) | (−1.5011) | (0.3392) | (−1.5061) | |
| Inc | 0.0205 | 0.2797 *** | 0.0146 | −0.0606 | −0.0959 | 0.0226 | 0.0221 | −0.1565 | 0.0225 |
| (1.2312) | (2.8288) | (0.8775) | (−1.5357) | (−1.0831) | (1.3560) | (1.3247) | (−1.2950) | (1.3469) | |
| Dual | −0.0674 ** | 0.2672 | −0.0730 *** | 0.0312 | 0.0465 | −0.0685 ** | −0.0681 ** | 0.0777 | −0.0683 ** |
| (−2.4695) | (1.4310) | (−2.6537) | (0.5364) | (0.4658) | (−2.5176) | (−2.5076) | (0.5110) | (−2.5156) | |
| Shrcr | 0.0040 *** | −0.0028 | 0.0041 *** | −0.0005 | −0.0023 | 0.0040 *** | 0.0040 *** | −0.0028 | 0.0040 *** |
| (3.5989) | (−0.4651) | (3.6769) | (−0.2664) | (−0.6899) | (3.6160) | (3.6338) | (−0.5688) | (3.6316) | |
| Zbmw | 0.0062 *** | −0.0093 *** | 0.0064 *** | 0.0017 ** | 0.0043 ** | 0.0061 *** | 0.0061 *** | 0.0060 ** | 0.0061 *** |
| (12.8358) | (−3.1893) | (13.2640) | (1.9851) | (2.3798) | (12.7717) | (12.6771) | (2.3870) | (12.6994) | |
| Ldx | −0.4601 *** | −1.4774 * | −0.4291 *** | 0.6187 | 1.1838 | −0.4818 *** | −0.4801 *** | 1.8025 | −0.4829 *** |
| (−3.6768) | (−1.8143) | (−3.4786) | (1.5139) | (1.5597) | (−3.8513) | (−3.8275) | (1.5802) | (−3.8528) | |
| Mna | −152.1573 *** | 798.3378 *** | −168.9017 *** | 34.7417 | 78.6043 | −153.3754 *** | −153.4836 *** | 113.3460 | −153.5949 *** |
| (−4.2025) | (4.9864) | (−4.7644) | (0.3923) | (0.5765) | (−4.2600) | (−4.2689) | (0.5348) | (−4.2742) | |
| Dratio | 0.1017 | 3.7664 *** | 0.0227 | −0.0601 | −0.2759 | 0.1038 | 0.1064 | −0.3359 | 0.1060 |
| (0.4748) | (2.8868) | (0.1082) | (−0.1458) | (−0.2850) | (0.4859) | (0.4968) | (−0.2548) | (0.4954) | |
| Cbl | −1.4110 *** | −2.6511 * | −1.3554 *** | 0.0373 | −0.5277 | −1.4123 *** | −1.4021 *** | −0.4904 | −1.4048 *** |
| (−3.7382) | (−1.7988) | (−3.6436) | (0.1055) | (−0.6838) | (−3.7504) | (−3.7525) | (−0.4623) | (−3.7535) | |
| Fgr | 0.0393 | −0.2090 | 0.0437 | −0.0255 | 0.1010 | 0.0402 | 0.0376 | 0.0756 | 0.0384 |
| (0.5880) | (−0.6917) | (0.6605) | (−0.2735) | (0.4282) | (0.6017) | (0.5619) | (0.2383) | (0.5734) | |
| Com | −0.0321 | −0.5205 *** | −0.0212 | 0.0235 | 0.0617 | −0.0330 | −0.0332 | 0.0852 | −0.0332 |
| (−1.3099) | (−2.9440) | (−0.8768) | (0.4888) | (0.4607) | (−1.3346) | (−1.3387) | (0.4850) | (−1.3403) | |
| Sus | −0.3365 | 3.4378 ** | −0.4086 | 0.7103 | 0.8051 | −0.3614 | −0.3501 | 1.5154 | −0.3558 |
| (−1.2454) | (1.9819) | (−1.5214) | (1.4113) | (0.8224) | (−1.3345) | (−1.2886) | (1.0990) | (−1.3100) | |
| Roe | 3.8723 *** | 3.3482 | 3.8020 *** | −0.3115 | −0.8419 | 3.8832 *** | 3.8865 *** | −1.1534 | 3.8869 *** |
| (7.9713) | (1.6238) | (7.9037) | (−0.5666) | (−0.7342) | (8.0174) | (8.0504) | (−0.7213) | (8.0477) | |
| Constant | 12.0559 *** | −61.1938 *** | 13.3394 *** | 5.3024 *** | 8.5793 *** | 11.8700 *** | 11.9112 *** | 13.8818 *** | 11.8799 *** |
| (16.5303) | (−13.3171) | (16.9721) | (3.6980) | (3.5099) | (16.3236) | (16.3490) | (3.7779) | (16.3266) | |
| Year dummy | YES | YES | YES | YES | YES | YES | YES | YES | YES |
| Ind dummy | YES | YES | YES | YES | YES | YES | YES | YES | YES |
| Observations | 1356 | 1356 | 1356 | 1356 | 1356 | 1356 | 1356 | 1356 | 1356 |
| R−squared | 0.9568 | 0.6964 | 0.9574 | 0.0785 | 0.0558 | 0.9570 | 0.9570 | 0.0616 | 0.9570 |
| Variables | (1) Tfp | (2) Inv | (3) Tfp | (4) Product | (5) Process | (6) Tfp | (7) Tfp | (8) Count | (9) Tfp |
|---|---|---|---|---|---|---|---|---|---|
| Ffyd | 111.1115 *** | 9.6652 *** | 109.8977 *** | 21.7277 ** | 16.3970 | 110.9321 *** | 110.9687 *** | 38.1247 | 110.9100 *** |
| (30.2767) | (2.9197) | (30.5504) | (1.9876) | (0.9840) | (30.2204) | (30.2172) | (1.5120) | (30.2059) | |
| Inv | 0.1256 *** | ||||||||
| (4.8362) | |||||||||
| Product | 0.0083 | ||||||||
| (1.5751) | |||||||||
| Process | 0.0087 *** | ||||||||
| (2.6459) | |||||||||
| Count | 0.0053 ** | ||||||||
| (2.4010) | |||||||||
| Size | 2.3680 *** | 0.9031 *** | 2.2545 *** | −0.4046 *** | −0.2539 | 2.3713 *** | 2.3702 *** | −0.6585 ** | 2.3714 *** |
| (44.3241) | (12.1864) | (36.3830) | (−3.1929) | (−1.4545) | (44.3733) | (44.3685) | (−2.3951) | (44.3952) | |
| Lev | 0.1416 | −0.1393 ** | 0.1591 | −0.0390 | −0.1266 | 0.1419 | 0.1427 | −0.1656 | 0.1425 |
| (1.3962) | (−2.1824) | (1.5936) | (−0.2326) | (−0.5555) | (1.3986) | (1.4062) | (−0.4531) | (1.4039) | |
| Pro | −3.0033 *** | −0.8568 *** | −2.8957 *** | 0.2434 | 0.2334 | −3.0053 *** | −3.0053 *** | 0.4768 | −3.0058 *** |
| (−7.9412) | (−5.7830) | (−7.6891) | (0.9269) | (0.6244) | (−7.9535) | (−7.9572) | (0.8120) | (−7.9590) | |
| Growth | 0.0002 | −0.0025 * | 0.0005 | −0.0035 | −0.0067 | 0.0002 | 0.0003 | −0.0102 | 0.0003 |
| (0.0905) | (−1.8662) | (0.2231) | (−1.1820) | (−1.4471) | (0.1027) | (0.1148) | (−1.4430) | (0.1131) | |
| Inc | 0.0579 *** | 0.0341 ** | 0.0536 *** | −0.0014 | −0.0500 | 0.0579 *** | 0.0583 *** | −0.0514 | 0.0581 *** |
| (3.6810) | (2.4560) | (3.4959) | (−0.0342) | (−0.8042) | (3.6796) | (3.7079) | (−0.5492) | (3.6967) | |
| Dual | −0.0226 | 0.0222 | −0.0253 | −0.0768 | −0.0665 | −0.0219 | −0.0220 | −0.1433 | −0.0218 |
| (−1.3172) | (1.5942) | (−1.4802) | (−1.5179) | (−0.8741) | (−1.2793) | (−1.2835) | (−1.2328) | (−1.2727) | |
| Shrcr | −0.0008 | −0.0005 | −0.0008 | −0.0003 | −0.0020 | −0.0008 | −0.0008 | −0.0023 | −0.0008 |
| (−1.2569) | (−0.8961) | (−1.1666) | (−0.1847) | (−0.7923) | (−1.2526) | (−1.2305) | (−0.5785) | (−1.2382) | |
| Zbmw | 0.0083 *** | −0.0008 *** | 0.0084 *** | 0.0017 ** | 0.0012 | 0.0083 *** | 0.0083 *** | 0.0029 ** | 0.0083 *** |
| (23.3862) | (−2.7602) | (23.5166) | (2.3968) | (1.3337) | (23.3707) | (23.4268) | (1.9742) | (23.4090) | |
| Ldx | −0.6300 *** | 0.1238 ** | −0.6456 *** | −0.1824 | −0.2435 | −0.6285 *** | −0.6279 *** | −0.4259 | −0.6278 *** |
| (−8.7180) | (2.2562) | (−9.0063) | (−0.8803) | (−0.7883) | (−8.7117) | (−8.7024) | (−0.9083) | (−8.7042) | |
| Mna | −57.5729 *** | 8.0953 *** | −58.5896 *** | 4.1416 | 4.5450 | −57.6072 *** | −57.6125 *** | 8.6865 | −57.6189 *** |
| (−18.2614) | (5.6733) | (−18.4701) | (0.4887) | (0.4273) | (−18.2495) | (−18.2842) | (0.5001) | (−18.2673) | |
| Dratio | −0.3235 ** | 0.1527 | −0.3427 ** | −0.1433 | −0.1163 | −0.3223 ** | −0.3225 ** | −0.2596 | −0.3221 ** |
| (−2.0398) | (1.3311) | (−2.1836) | (−0.3076) | (−0.1699) | (−2.0330) | (−2.0355) | (−0.2466) | (−2.0331) | |
| Cbl | −1.0909 *** | −0.1371 | −1.0737 *** | −0.3982 * | −0.8328 ** | −1.0876 *** | −1.0836 *** | −1.2310 ** | −1.0844 *** |
| (−4.2135) | (−1.2984) | (−4.2412) | (−1.6489) | (−2.2041) | (−4.2016) | (−4.1863) | (−2.1527) | (−4.1895) | |
| Fgr | 0.0271 | −0.0020 | 0.0274 | 0.0538 | −0.0067 | 0.0267 | 0.0272 | 0.0471 | 0.0269 |
| (1.3807) | (−0.1746) | (1.4013) | (0.8793) | (−0.0721) | (1.3558) | (1.3739) | (0.3330) | (1.3608) | |
| Com | 0.0194 | −0.0669 *** | 0.0278 | 0.0414 | −0.0319 | 0.0190 | 0.0197 | 0.0095 | 0.0193 |
| (0.6927) | (−2.7712) | (1.0114) | (0.6613) | (−0.4039) | (0.6814) | (0.7031) | (0.0720) | (0.6918) | |
| Sus | −0.5899 *** | 0.4180 ** | −0.6424 *** | 0.6872 | 0.7292 | −0.5956 *** | −0.5962 *** | 1.4163 | −0.5974 *** |
| (−2.8433) | (2.2528) | (−3.1198) | (1.4289) | (1.1595) | (−2.8686) | (−2.8742) | (1.4356) | (−2.8786) | |
| Roe | 3.9005 *** | 0.9567 *** | 3.7803 *** | −0.6623 | −0.7712 | 3.9060 *** | 3.9072 *** | −1.4334 | 3.9081 *** |
| (9.0519) | (4.1975) | (8.8585) | (−1.3468) | (−1.2642) | (9.0537) | (9.0530) | (−1.4445) | (9.0541) | |
| Constant | 13.6886 *** | −8.5290 *** | 14.7597 *** | 4.1582 *** | 4.6615 *** | 13.6542 *** | 13.6479 *** | 8.8197 *** | 13.6419 *** |
| (24.1860) | (−13.1914) | (24.2182) | (3.6060) | (2.8199) | (24.0847) | (24.0778) | (3.4278) | (24.0603) | |
| Year dummy | YES | YES | YES | YES | YES | YES | YES | YES | YES |
| Ind dummy | YES | YES | YES | YES | YES | YES | YES | YES | YES |
| Observations | 3406 | 3406 | 3406 | 3406 | 3406 | 3406 | 3406 | 3406 | 3406 |
| R−squared | 0.9310 | 0.4667 | 0.9317 | 0.0575 | 0.0516 | 0.9310 | 0.9311 | 0.0600 | 0.9311 |
| Sobel Test for Product Mediator Variables | Sobel Test for Process Mediator Variables | Sobel Test for Count Mediator Variables | |||||||
| z | mediating effect | z | mediating effect | z | mediating effect | ||||
| 1.2445 | significant | 0.9219 | insignificant | 1.2806 | significant | ||||
| Variables | (1) Tfp | (2) Inv | (3) Tfp | (4) Product | (5) Process | (6) Tfp | (7) Tfp | (8) Count | (9) Tfp |
|---|---|---|---|---|---|---|---|---|---|
| Ffyd | 14.3678 *** | 30.8332 *** | 13.5745 *** | 3.9548 | 3.0252 *** | 14.3332 *** | 14.2642 *** | 7.2871 ** | 14.2611 *** |
| (11.2528) | (5.0055) | (10.6020) | (1.4597) | (2.6042) | (11.2286) | (11.1540) | (2.4771) | (11.1617) | |
| Inv | 0.0257 ** | ||||||||
| (2.3277) | |||||||||
| Product | 0.0087 | ||||||||
| (0.8167) | |||||||||
| Process | 0.0342 | ||||||||
| (1.2137) | |||||||||
| Count | 0.0146 | ||||||||
| (1.3224) | |||||||||
| Size | 2.7285 *** | 3.7226 *** | 2.6327 *** | −0.6098 ** | −0.3824 *** | 2.7338 *** | 2.7416 *** | −0.8597 *** | 2.7411 *** |
| (27.0616) | (7.6716) | (23.5815) | (−2.0455) | (−3.5811) | (27.1517) | (27.0547) | (−3.2659) | (27.0826) | |
| Lev | −0.1528 | −0.7875 | −0.1326 | 0.6318 * | 0.2054 | −0.1584 | −0.1599 | 0.4335 | −0.1592 |
| (−0.9148) | (−1.4118) | (−0.8047) | (1.6743) | (1.3898) | (−0.9481) | (−0.9589) | (1.2619) | (−0.9547) | |
| Pro | −3.5030 *** | −2.2705 | −3.4445 *** | −0.3480 | −0.3017 | −3.4999 *** | −3.4926 *** | −0.8445 | −3.4906 *** |
| (−4.4458) | (−1.0372) | (−4.5771) | (−0.3930) | (−0.8126) | (−4.4356) | (−4.4316) | (−0.9667) | (−4.4287) | |
| Growth | −0.0093 ** | −0.0135 | −0.0089 ** | −0.0001 | 0.0030 | −0.0093 ** | −0.0094 ** | 0.0060 | −0.0094 ** |
| (−2.3229) | (−0.8777) | (−2.3106) | (−0.0134) | (1.1571) | (−2.3232) | (−2.3499) | (1.0133) | (−2.3477) | |
| Inc | 0.0293 | 0.4003 *** | 0.0190 | −0.1195 * | −0.0213 | 0.0303 | 0.0300 | −0.0619 | 0.0302 |
| (1.1062) | (3.6536) | (0.7017) | (−1.9028) | (−0.7311) | (1.1398) | (1.1325) | (−0.8983) | (1.1389) | |
| Dual | −0.0903 *** | −0.0530 | −0.0889 *** | −0.1327 | −0.0487 | −0.0891 *** | −0.0886 *** | −0.1179 | −0.0886 *** |
| (−2.7224) | (−0.3999) | (−2.6769) | (−1.2395) | (−1.1328) | (−2.6842) | (−2.6703) | (−1.1379) | (−2.6692) | |
| Shrcr | 0.0031 *** | −0.0040 | 0.0032 *** | −0.0042 | −0.0013 | 0.0032 *** | 0.0032 *** | −0.0026 | 0.0032 *** |
| (2.7642) | (−0.7174) | (2.8531) | (−1.3007) | (−1.0055) | (2.7973) | (2.8080) | (−0.8772) | (2.8032) | |
| Zbmw | 0.0055 *** | −0.0008 | 0.0055 *** | 0.0022 | 0.0012 ** | 0.0054 *** | 0.0054 *** | 0.0027 * | 0.0054 *** |
| (10.6901) | (−0.2776) | (10.6330) | (1.5917) | (1.9870) | (10.6793) | (10.6099) | (1.8089) | (10.6237) | |
| Ldx | −1.1292 *** | −0.4067 | −1.1187 *** | 0.5815 | 0.2589 | −1.1343 *** | −1.1381 *** | 0.5573 | −1.1374 *** |
| (−5.3635) | (−0.4644) | (−5.4874) | (1.1253) | (1.1593) | (−5.3921) | (−5.4056) | (1.0644) | (−5.4056) | |
| Mna | −112.1046 ** | 595.7847 *** | −127.4327 *** | 71.4228 | 61.4751 | −112.7285 ** | −114.2093 ** | 175.1650 | −114.6691 ** |
| (−2.4660) | (3.5770) | (−2.8231) | (0.6873) | (1.1743) | (−2.4791) | (−2.5160) | (1.3584) | (−2.5275) | |
| Dratio | −0.1973 | 0.5730 | −0.2120 | 1.7874 * | 1.0548 ** | −0.2129 | −0.2334 | 2.5493 ** | −0.2346 |
| (−0.7341) | (0.4599) | (−0.7687) | (1.7511) | (2.3302) | (−0.7850) | (−0.8512) | (2.3108) | (−0.8568) | |
| Cbl | −0.1054 | −0.3771 | −0.0957 | −0.8933 | −0.0915 | −0.0976 | −0.1023 | −0.3396 | −0.1005 |
| (−0.1414) | (−0.1648) | (−0.1356) | (−0.7729) | (−0.2264) | (−0.1306) | (−0.1370) | (−0.3466) | (−0.1345) | |
| Fgr | −0.0533 | −0.0266 | −0.0526 | −0.0224 | 0.0054 | −0.0531 | −0.0535 | 0.0198 | −0.0536 |
| (−1.4632) | (−0.1459) | (−1.4267) | (−0.2731) | (0.1737) | (−1.4562) | (−1.4706) | (0.2428) | (−1.4736) | |
| Com | 0.0611 | −0.2061 | 0.0664 | −0.0078 | 0.0003 | 0.0612 | 0.0611 | 0.0105 | 0.0609 |
| (1.3971) | (−1.0495) | (1.5327) | (−0.1143) | (0.0072) | (1.3987) | (1.3979) | (0.1279) | (1.3945) | |
| Sus | 1.1156 | 4.8794 * | 0.9900 | −0.3199 | 0.0399 | 1.1184 | 1.1142 | 0.0265 | 1.1152 |
| (1.4481) | (1.9070) | (1.3159) | (−0.2299) | (0.0673) | (1.4521) | (1.4455) | (0.0179) | (1.4476) | |
| Roe | 2.3277 ** | −1.7953 | 2.3738 ** | 0.3963 | 0.0850 | 2.3242 ** | 2.3247 ** | 0.3014 | 2.3232 ** |
| (2.4121) | (−0.6829) | (2.5308) | (0.2915) | (0.1530) | (2.4064) | (2.4047) | (0.2283) | (2.4048) | |
| Constant | 10.9542 *** | −46.3714 *** | 12.1472 *** | 6.8899 ** | 3.2458 *** | 10.8940 *** | 10.8431 *** | 7.4531 *** | 10.8451 *** |
| (8.7884) | (−8.9492) | (8.8427) | (2.2554) | (2.9904) | (8.7354) | (8.6696) | (2.8564) | (8.6756) | |
| Year dummy | YES | YES | YES | YES | YES | YES | YES | YES | YES |
| Ind dummy | YES | YES | YES | YES | YES | YES | YES | YES | YES |
| Observations | 848 | 848 | 848 | 848 | 848 | 848 | 848 | 848 | 848 |
| R−squared | 0.9399 | 0.5725 | 0.9406 | 0.1616 | 0.1970 | 0.9400 | 0.9401 | 0.1976 | 0.9401 |
| Sobel Test for Product Mediator Variables | Sobel Test for Process Mediator Variables | Sobel Test for Count Mediator Variables | |||||||
| z | mediating effect | z | mediating effect | z | mediating effect | ||||
| 0.7103 | insignificant | 1.0994 | significant | 1.1617 | significant | ||||
| Variables | (1) Tfp | (2) Inv | (3) Tfp | (4) Product | (5) Process | (6) Tfp | (7) Tfp | (8) Count | (9) Tfp |
|---|---|---|---|---|---|---|---|---|---|
| Ffyd | 106.5453 *** | 15.9880 *** | 104.5945 *** | −5.8923 | −2.2310 | 106.5367 *** | 106.5453 *** | −8.1233 | 106.5334 *** |
| (32.1752) | (5.2225) | (32.4849) | (−0.7107) | (−0.2102) | (32.1644) | (32.1752) | (−0.4627) | (32.1719) | |
| Inv | 0.1220 *** | ||||||||
| (5.6575) | |||||||||
| Product | −0.0015 | ||||||||
| (−0.3266) | |||||||||
| Process | −0.0030 | ||||||||
| (−0.8535) | |||||||||
| Count | −0.0015 | ||||||||
| (−0.6899) | |||||||||
| Size | 2.3391 *** | 0.8450 *** | 2.2360 *** | −0.3359 *** | −0.4260 *** | 2.3387 *** | 2.3391 *** | −0.7619 *** | 2.3380 *** |
| (43.8754) | (12.6075) | (38.3456) | (−2.9755) | (−2.5815) | (43.8684) | (43.8754) | (−2.9750) | (43.7804) | |
| Lev | −0.0682 | −0.2359 *** | −0.0394 | 0.1288 | 0.5907 * | −0.0680 | −0.0682 | 0.7195 | −0.0671 |
| (−0.7107) | (−3.3106) | (−0.4148) | (0.6752) | (1.9096) | (−0.7087) | (−0.7107) | (1.5577) | (−0.6993) | |
| Pro | −3.3173 *** | −0.6035 *** | −3.2437 *** | −0.7330 * | −0.7443 | −3.3184 *** | −3.3173 *** | −1.4774 | −3.3195 *** |
| (−7.5259) | (−3.8908) | (−7.4619) | (−1.8574) | (−0.9780) | (−7.5242) | (−7.5259) | (−1.4111) | (−7.5367) | |
| Growth | −0.0035 | 0.0005 | −0.0035 * | 0.0019 | 0.0049 | −0.0034 | −0.0035 | 0.0068 | −0.0034 |
| (−1.6437) | (0.2859) | (−1.7047) | (0.4538) | (0.9645) | (−1.6425) | (−1.6437) | (0.7988) | (−1.6390) | |
| Inc | 0.0424 *** | 0.0389 ** | 0.0376 *** | −0.0131 | −0.0315 | 0.0424 *** | 0.0424 *** | −0.0446 | 0.0423 *** |
| (2.8821) | (2.0354) | (2.5869) | (−0.3149) | (−0.5266) | (2.8807) | (2.8821) | (−0.4815) | (2.8784) | |
| Dual | −0.0502 *** | −0.0019 | −0.0499 *** | 0.0583 | 0.0772 | −0.0501 *** | −0.0502 *** | 0.1355 | −0.0500 *** |
| (−3.1751) | (−0.1480) | (−3.1700) | (1.1496) | (1.1372) | (−3.1683) | (−3.1751) | (1.2420) | (−3.1624) | |
| Shrcr | 0.0008 | 0.0001 | 0.0008 | −0.0011 | −0.0014 | 0.0008 | 0.0008 | −0.0025 | 0.0008 |
| (1.2733) | (0.2279) | (1.2573) | (−0.5605) | (−0.5545) | (1.2700) | (1.2733) | (−0.6092) | (1.2669) | |
| Zbmw | 0.0077 *** | −0.0010 *** | 0.0078 *** | 0.0009 | 0.0020 | 0.0077 *** | 0.0077 *** | 0.0028 | 0.0077 *** |
| (21.4121) | (−2.8952) | (21.8390) | (1.1367) | (1.3305) | (21.4163) | (21.4121) | (1.3503) | (21.4153) | |
| Ldx | −0.7636 *** | 0.2344 *** | −0.7922 *** | 0.2090 | 0.6304 * | −0.7633 *** | −0.7636 *** | 0.8394 | −0.7624 *** |
| (−8.8930) | (2.7961) | (−9.1864) | (0.7506) | (1.6973) | (−8.8845) | (−8.8930) | (1.4110) | (−8.8706) | |
| Mna | −58.7568 *** | 9.5860 *** | −59.9265 *** | 3.5150 | 9.0324 | −58.7517 *** | −58.7568 *** | 12.5474 | −58.7384 *** |
| (−21.2607) | (6.7023) | (−21.5166) | (0.4470) | (0.9578) | (−21.2512) | (−21.2607) | (0.7723) | (−21.2513) | |
| Dratio | −0.5308 *** | 0.2009 * | −0.5553 *** | 0.4929 | 1.3084 * | −0.5301 *** | −0.5308 *** | 1.8013 * | −0.5282 *** |
| (−3.6216) | (1.7032) | (−3.8020) | (1.0456) | (1.8493) | (−3.6168) | (−3.6216) | (1.6679) | (−3.6014) | |
| Cbl | −1.0632 *** | 0.3330 *** | −1.1039 *** | −0.6863 ** | −1.4680 *** | −1.0642 *** | −1.0632 *** | −2.1543 *** | −1.0664 *** |
| (−2.7853) | (2.6862) | (−2.9462) | (−2.0336) | (−2.7384) | (−2.7860) | (−2.7853) | (−2.7089) | (−2.7932) | |
| Fgr | −0.0068 | −0.0038 | −0.0064 | −0.0140 | 0.0010 | −0.0069 | −0.0068 | −0.0130 | −0.0068 |
| (−0.4863) | (−0.3848) | (−0.4588) | (−0.3554) | (0.0135) | (−0.4877) | (−0.4863) | (−0.1296) | (−0.4878) | |
| Com | 0.0199 | −0.0539 ** | 0.0265 | −0.0217 | 0.0209 | 0.0199 | 0.0199 | −0.0008 | 0.0199 |
| (0.7260) | (−2.5067) | (0.9769) | (−0.3007) | (0.1656) | (0.7245) | (0.7260) | (−0.0042) | (0.7255) | |
| Sus | −0.3718 | 0.5044 * | −0.4334 | 0.3596 | −0.1282 | −0.3713 | −0.3718 | 0.2314 | −0.3715 |
| (−1.0081) | (1.8905) | (−1.1742) | (0.3531) | (−0.1232) | (−1.0064) | (−1.0081) | (0.1205) | (−1.0066) | |
| Roe | 4.3819 *** | 0.6709 ** | 4.3000 *** | 0.4191 | −0.0298 | 4.3825 *** | 4.3819 *** | 0.3894 | 4.3825 *** |
| (8.4766) | (1.9894) | (8.3835) | (0.4971) | (−0.0284) | (8.4759) | (8.4766) | (0.2215) | (8.4784) | |
| Constant | 14.4461 *** | −8.5808 *** | 15.4931 *** | 4.1419 *** | 5.4503 *** | 14.4521 *** | 14.4461 *** | 9.5922 *** | 14.4602 *** |
| (23.4248) | (−15.5302) | (23.6601) | (3.3126) | (3.1720) | (23.3833) | (23.4248) | (3.4617) | (23.3859) | |
| Year dummy | YES | YES | YES | YES | YES | YES | YES | YES | YES |
| Ind dummy | YES | YES | YES | YES | YES | YES | YES | YES | YES |
| Observations | 4099 | 4099 | 4099 | 4099 | 4099 | 4099 | 4099 | 4099 | 4099 |
| R−squared | 0.9190 | 0.4004 | 0.9199 | 0.0577 | 0.0441 | 0.9190 | 0.9190 | 0.0531 | 0.9190 |
Disclaimer/Publisher’s Note: The statements, opinions and data contained in all publications are solely those of the individual author(s) and contributor(s) and not of MDPI and/or the editor(s). MDPI and/or the editor(s) disclaim responsibility for any injury to people or property resulting from any ideas, methods, instructions or products referred to in the content. |
© 2023 by the authors. Licensee MDPI, Basel, Switzerland. This article is an open access article distributed under the terms and conditions of the Creative Commons Attribution (CC BY) license (https://creativecommons.org/licenses/by/4.0/).
Share and Cite
Tang, T.; Ma, C.-A.; Lv, H.-Y.; Hao, F.-Y. The Effect of Corporate Resource Abundance on the Transformation and Upgrading of Manufacturing Enterprises from the Perspective of Whole Process Innovation. Sustainability 2023, 15, 11003. https://doi.org/10.3390/su151411003
Tang T, Ma C-A, Lv H-Y, Hao F-Y. The Effect of Corporate Resource Abundance on the Transformation and Upgrading of Manufacturing Enterprises from the Perspective of Whole Process Innovation. Sustainability. 2023; 15(14):11003. https://doi.org/10.3390/su151411003
Chicago/Turabian StyleTang, Tong, Chun-Ai Ma, Heng-Yu Lv, and Fu-Ying Hao. 2023. "The Effect of Corporate Resource Abundance on the Transformation and Upgrading of Manufacturing Enterprises from the Perspective of Whole Process Innovation" Sustainability 15, no. 14: 11003. https://doi.org/10.3390/su151411003