
Assessing Water Sustainability in Northwest China: Analysis of Water Quantity, Water Quality, Socio-Economic Development and Policy Impacts


Abstract
1. Introduction
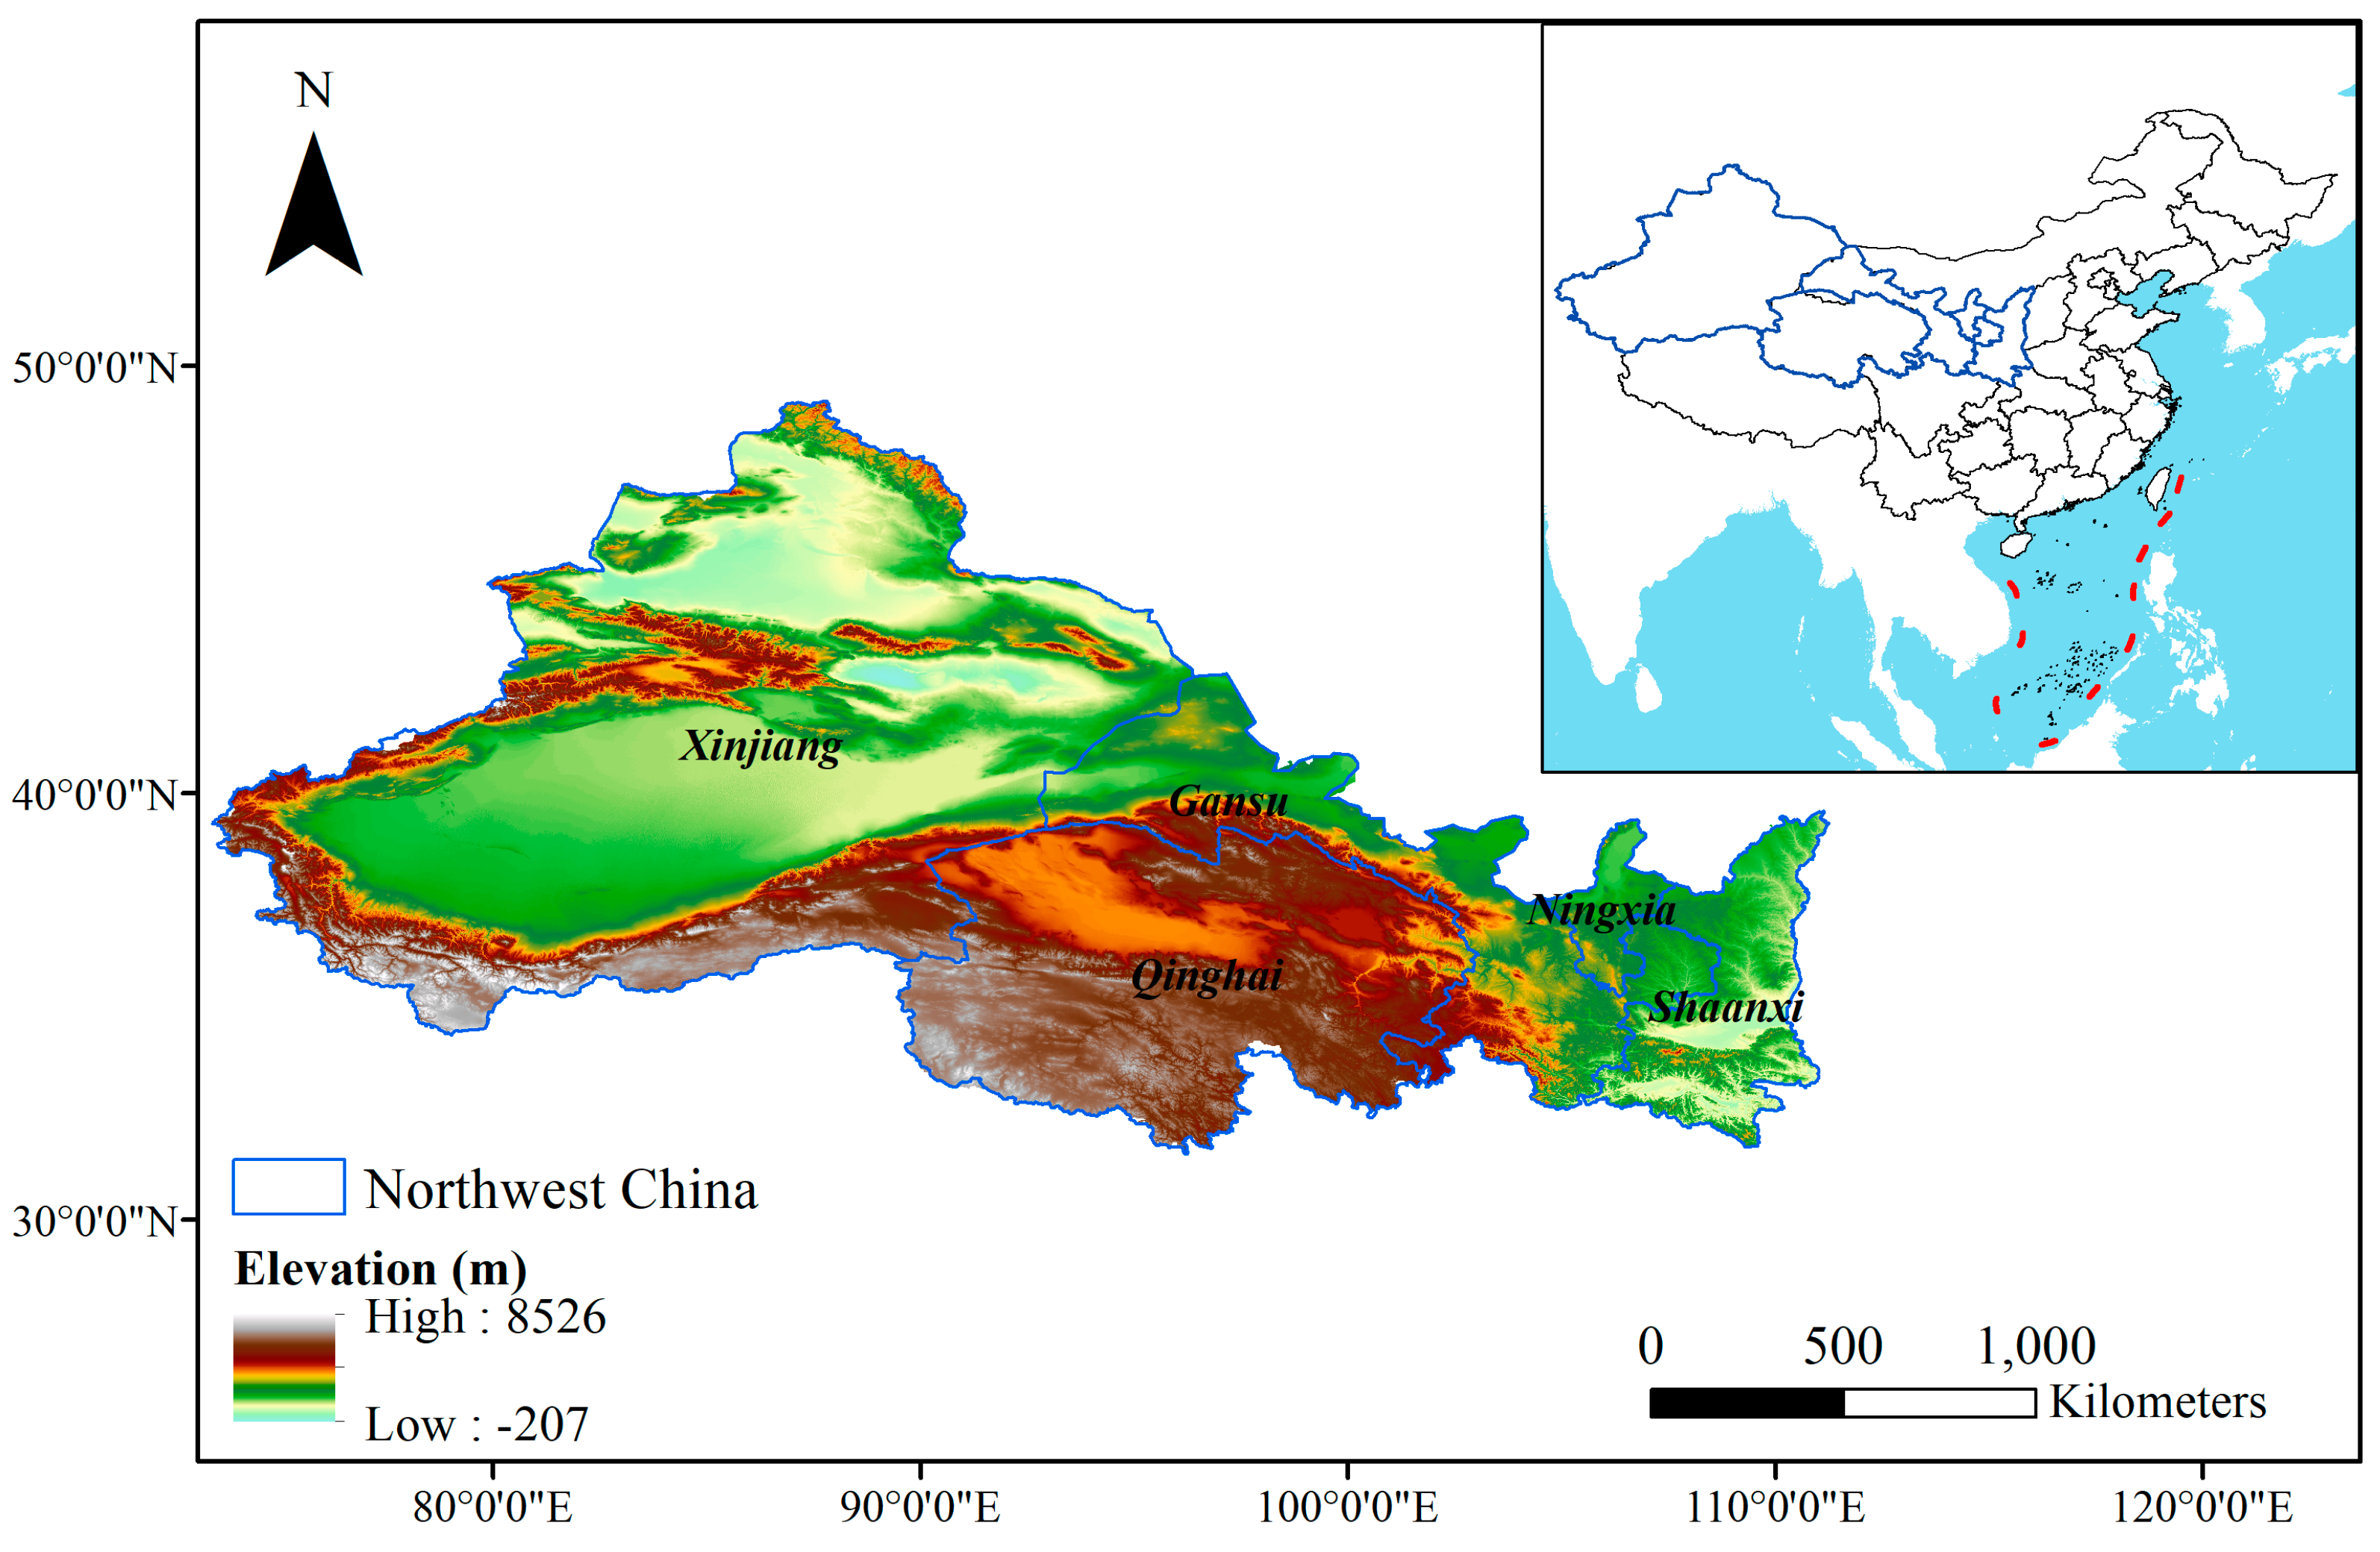
2. Study Area
3. Materials and Methods
3.1. Data Collection
3.2. Water Use Intensity
3.3. Water Scarcity Estimation
3.4. Trend Analysis of the Water Use and Its Intensity Conditions
4. Results and Discussion
4.1. Water Use Trends under Rapid Socio-Economic Growth
4.2. Spatiotemporal Characteristics of Water Use Intensity
4.2.1. Agricultural Water Use Intensity
4.2.2. Industrial Water Use Intensity
4.3. Regional Water Scarcity
4.4. Efforts towards Water Conservation
4.5. Efforts towards Water Quality Improvement
4.5.1. Controlling Main Pollutants and Increasing Wastewater Treatment Capacity
4.5.2. Water Quality of Rivers
5. Concluding Remarks
Supplementary Materials
Author Contributions
Funding
Institutional Review Board Statement
Informed Consent Statement
Data Availability Statement
Conflicts of Interest
References
- Zhang, C.; Anadon, L.D. Life Cycle Water Use of Energy Production and Its Environmental Impacts in China. Environ. Sci. Technol. 2013, 47, 14459–14467. [Google Scholar] [CrossRef] [PubMed]
- Wang, Y.; Wang, Y.; Su, X.; Qi, L.; Liu, M. Evaluation of the Comprehensive Carrying Capacity of Interprovincial Water Resources in China and the Spatial Effect. J. Hydrol. 2019, 575, 794–809. [Google Scholar] [CrossRef]
- Sun, S.; Zhou, X.; Liu, H.; Jiang, Y.; Zhou, H.; Zhang, C.; Fu, G. Unraveling the Effect of Inter-Basin Water Transfer on Reducing Water Scarcity and Its Inequality in China. Water Res. 2021, 194, 116931. [Google Scholar] [CrossRef] [PubMed]
- Mekonnen, M.M.; Hoekstra, A.Y. Four Billion People Facing Severe Water Scarcity. Sci. Adv. 2016, 2, e1500323. [Google Scholar] [CrossRef] [PubMed]
- Chen, Y.; Wang, S.; Ren, Z.; Huang, J.; Wang, X.; Liu, S.; Deng, H.; Lin, W. Increased Evapotranspiration from Land Cover Changes Intensified Water Crisis in an Arid River Basin in Northwest China. J. Hydrol. 2019, 574, 383–397. [Google Scholar] [CrossRef]
- Liu, X.; Shi, L.; Engel, B.A.; Sun, S.; Zhao, X.; Wu, P.; Wang, Y. New Challenges of Food Security in Northwest China: Water Footprint and Virtual Water Perspective. J. Clean. Prod. 2020, 245, 118939. [Google Scholar] [CrossRef]
- Zhou, F.; Bo, Y.; Ciais, P.; Dumas, P.; Tang, Q.; Wang, X.; Liu, J.; Zheng, C.; Polcher, J.; Yin, Z.; et al. Deceleration of China’s Human Water Use and Its Key Drivers. Proc. Natl. Acad. Sci. USA 2020, 117, 7702–7711. [Google Scholar] [CrossRef]
- Ma, T.; Sun, S.; Fu, G.; Hall, J.W.; Ni, Y.; He, L.; Yi, J.; Zhao, N.; Du, Y.; Pei, T.; et al. Pollution Exacerbates China’s Water Scarcity and Its Regional Inequality. Nat. Commun. 2020, 11, 650. [Google Scholar] [CrossRef]
- Li, J.; Yang, J.; Liu, M.; Ma, Z.; Fang, W.; Bi, J. Quality Matters: Pollution Exacerbates Water Scarcity and Sectoral Output Risks in China. Water Res. 2022, 224, 119059. [Google Scholar] [CrossRef]
- Zhu, Y.; Chen, Y.; Ren, L.; Lü, H.; Zhao, W.; Yuan, F.; Xu, M. Ecosystem Restoration and Conservation in the Arid Inland River Basins of Northwest China: Problems and Strategies. Ecol. Eng. 2016, 94, 629–637. [Google Scholar] [CrossRef]
- Han, X.; Zhao, Y.; Gao, X.; Jiang, S.; Lin, L.; An, T. Virtual Water Output Intensifies the Water Scarcity in Northwest China: Current Situation, Problem Analysis and Countermeasures. Sci. Total Environ. 2021, 765, 144276. [Google Scholar] [CrossRef] [PubMed]
- Piao, S.; Ciais, P.; Huang, Y.; Shen, Z.; Peng, S.; Li, J.; Zhou, L.; Liu, H.; Ma, Y.; Ding, Y.; et al. The Impacts of Climate Change on Water Resources and Agriculture in China. Nature 2010, 467, 43–51. [Google Scholar] [CrossRef] [PubMed]
- Chen, Y.; Chen, Y.; Zhu, C.; Wang, Y.; Hao, X. Ecohydrological Effects of Water Conveyance in a Disconnected River in an Arid Inland River Basin. Sci. Rep. 2022, 12, 9982. [Google Scholar] [CrossRef] [PubMed]
- Chen, Y.; Zhang, X.; Fang, G.; Li, Z.; Wang, F.; Qin, J.; Sun, F. Potential Risks and Challenges of Climate Change in the Arid Region of Northwestern China. Reg. Sustain. 2020, 1, 20–30. [Google Scholar] [CrossRef]
- Pereira, L.S.; Gonçalves, J.M.; Dong, B.; Mao, Z.; Fang, S.X. Assessing Basin Irrigation and Scheduling Strategies for Saving Irrigation Water and Controlling Salinity in the Upper Yellow River Basin, China. Agric. Water Manag. 2007, 93, 109–122. [Google Scholar] [CrossRef]
- Fan, G.; Zhang, D.; Zhang, J.; Li, Z.; Sang, W.; Zhao, L.; Xu, M. Ecological Environmental Effects of Yellow River Irrigation Revealed by Isotope and Ion Hydrochemistry in the Yinchuan Plain, Northwest China. Ecol. Indic. 2022, 135, 108574. [Google Scholar] [CrossRef]
- Shi, M.; Wu, H.; Jiang, P.; Zheng, K.; Liu, Z.; Dong, T.; He, P.; Fan, X. Food-Water-Land-Ecosystem Nexus in Typical Chinese Dryland under Different Future Scenarios. Sci. Total. Environ. 2023, 880, 163183. [Google Scholar] [CrossRef]
- Huang, J.; Zhang, Y.; Bing, H.; Peng, J.; Dong, F.; Gao, J.; Arhonditsis, G.B. Characterizing the River Water Quality in China: Recent Progress and on-Going Challenges. Water Res. 2021, 201, 117309. [Google Scholar] [CrossRef]
- Wu, W.; Zhu, Y.; Zeng, W.; Wang, M.; Yang, D.; Chen, W. Green Efficiency of Water Resources in Northwest China: Spatial-Temporal Heterogeneity and Convergence Trends. J. Clean. Prod. 2021, 320, 128651. [Google Scholar] [CrossRef]
- Wu, L.; Su, X.; Ma, X.; Kang, Y.; Jiang, Y. Integrated Modeling Framework for Evaluating and Predicting the Water Resources Carrying Capacity in a Continental River Basin of Northwest China. J. Clean. Prod. 2018, 204, 366–379. [Google Scholar] [CrossRef]
- Alamanos, A.; Koundouri, P. Emerging Challenges and the Future of Water Resources Management. Hydrolink 2022/10. Madr. Int. Assoc. Hydro-Environ. Eng. Res. (IAHR) 2022, 4, 116–120. Available online: https://hdl.handle.net/20.500.11970/110818 (accessed on 16 June 2023).
- Loucks, D.P. Managing Water as a Critical Component of a Changing World. Water Resour Manag. 2017, 31, 2905–2916. [Google Scholar] [CrossRef]
- Alamanos, A. Sustainable Water Resources Management under Water-Scarce and Limited-Data Conditions—CAJWR. Cent. Asian J. Water Res. 2021, 7, 1–19. [Google Scholar] [CrossRef]
- Caniglia, G.; Luederitz, C.; von Wirth, T.; Fazey, I.; Martín-López, B.; Hondrila, K.; König, A.; von Wehrden, H.; Schäpke, N.A.; Laubichler, M.D.; et al. A Pluralistic and Integrated Approach to Action-Oriented Knowledge for Sustainability. Nat. Sustain. 2021, 4, 93–100. [Google Scholar] [CrossRef]
- Global Water Partnership (GWP) Catalyzing Change: A Handbook for Developing Integrated Water Resources Management (IWRM) and Water Efficiency Strategies; Global Water Partnership Secretariat: Stockholm, Sweden, 2004.
- Mujica, A.; Piaggio, C.; Díaz, L.R.; Bussi, J.; Courret, A.P.; Saito, C.H. The Global Water Partnership-South America and the Transboundary Implementation of Integrated Water Resources Management (SDG Target 6.5). In Sustainable Development Goals for Society Vol. 1: Selected Topics of Global Relevance; Nhamo, G., Togo, M., Dube, K., Eds.; Sustainable Development Goals Series; Springer International Publishing: Cham, Switzerland, 2021; pp. 171–186. ISBN 978-3-030-70948-8. [Google Scholar]
- Englezos, N.; Kartala, X.; Koundouri, P.; Tsionas, M.; Alamanos, A. A Novel HydroEconomic—Econometric Approach for Integrated Transboundary Water Management Under Uncertainty. Environ. Resour. Econ. 2023, 84, 975–1030. [Google Scholar] [CrossRef]
- Phan, T.D.; Smart, J.C.R.; Stewart-Koster, B.; Sahin, O.; Hadwen, W.L.; Dinh, L.T.; Tahmasbian, I.; Capon, S.J. Applications of Bayesian Networks as Decision Support Tools for Water Resource Management under Climate Change and Socio-Economic Stressors: A Critical Appraisal. Water 2019, 11, 2642. [Google Scholar] [CrossRef]
- Wei, F.; Zhang, X.; Xu, J.; Bing, J.; Pan, G. Simulation of Water Resource Allocation for Sustainable Urban Development: An Integrated Optimization Approach. J. Clean. Prod. 2020, 273, 122537. [Google Scholar] [CrossRef]
- Garcia, J.A.; Alamanos, A. Integrated Modelling Approaches for Sustainable Agri-Economic Growth and Environmental Improvement: Examples from Greece, Canada and Ireland. Land 2022, 11, 1548. [Google Scholar] [CrossRef]
- Farrokhzadeh, S.; Hashemi Monfared, S.A.; Azizyan, G.; Sardar Shahraki, A.; Ertsen, M.W.; Abraham, E. Sustainable Water Resources Management in an Arid Area Using a Coupled Optimization-Simulation Modeling. Water 2020, 12, 885. [Google Scholar] [CrossRef]
- Haberl, H.; Wiedenhofer, D.; Pauliuk, S.; Krausmann, F.; Müller, D.B.; Fischer-Kowalski, M. Contributions of Sociometabolic Research to Sustainability Science. Nat. Sustain. 2019, 2, 173–184. [Google Scholar] [CrossRef]
- Di Baldassarre, G.; Sivapalan, M.; Rusca, M.; Cudennec, C.; Garcia, M.; Kreibich, H.; Konar, M.; Mondino, E.; Mård, J.; Pande, S.; et al. Sociohydrology: Scientific Challenges in Addressing the Sustainable Development Goals. Water Resour. Res. 2019, 55, 6327–6355. [Google Scholar] [CrossRef] [PubMed]
- Li, Z.; Chen, Y.; Shen, Y.; Liu, Y.; Zhang, S. Analysis of Changing Pan Evaporation in the Arid Region of Northwest China. Water Resour. Res. 2013, 49, 2205–2212. [Google Scholar] [CrossRef]
- National Bureau of Statistics of China National Bureau of Statistics of China. Available online: http://www.stats.gov.cn/english/ (accessed on 5 June 2023).
- Yearbook China Statistical Yearbook Sharing Platform. Available online: https://www.yearbookchina.com/ (accessed on 5 June 2023).
- Ministry of Water Resources (MWR) China Ministry of Water Resources the People’s Republic of China. Available online: http://www.mwr.gov.cn/sj/ (accessed on 5 June 2023).
- Ningxia Water Resources Department Water Resources Bulletin Ningxia Water Resources Department. Available online: http://slt.nx.gov.cn/xxgk_281/fdzdgknr/gbxx/szygb/ (accessed on 5 June 2023).
- Shaanxi Water Resources Department Water Resources Bulletin Shaanxi Water Resources Department. Available online: http://slt.shaanxi.gov.cn/zfxxgk/fdzdgknr/zdgz/szygb/ (accessed on 5 June 2023).
- Qinghai Water Resources Department Qinghai Water & Hydropower Information. Available online: http://slt.qinghai.gov.cn/subject/list?cid=58 (accessed on 5 June 2023).
- Xinjiang Uygur Autonomous Region Water Resources Department Water Resources Bulletin Xinjiang Uygur Autonomous Region Water Resources Department. Available online: http://slt.xinjiang.gov.cn/slt/szygb/list.shtml (accessed on 5 June 2023).
- Gansu Province Water Conservancy Department Water Conservancy Department of Gansu Province. Available online: http://slt.gansu.gov.cn/ (accessed on 5 June 2023).
- Geographical Monitoring Cloud Platform Geographical Monitoring Cloud Platform—Pioneer of One-Stop Data Sharing Service Platform. Available online: http://www.dsac.cn/ (accessed on 5 June 2023).
- Veldkamp, T.I.E.; Wada, Y.; Aerts, J.C.J.H.; Döll, P.; Gosling, S.N.; Liu, J.; Masaki, Y.; Oki, T.; Ostberg, S.; Pokhrel, Y.; et al. Water Scarcity Hotspots Travel Downstream Due to Human Interventions in the 20th and 21st Century. Nat. Commun. 2017, 8, 15697. [Google Scholar] [CrossRef]
- He, C.; Liu, Z.; Wu, J.; Pan, X.; Fang, Z.; Li, J.; Bryan, B.A. Future Global Urban Water Scarcity and Potential Solutions. Nat. Commun. 2021, 12, 4667. [Google Scholar] [CrossRef]
- Xia, J.; Qiu, B.; Li, Y. Water Resources Vulnerability and Adaptive Management in the Huang, Huai and Hai River Basins of China. Water Int. 2012, 37, 523–536. [Google Scholar] [CrossRef]
- Alcamo, J.; Henrichs, T.; Rösch, T. World Water in 2025: Global Modeling and Scenario Analysis for the World Commission on Water for the 21st Century. Hydrol. Sci. J. 2017, 52, 247–275. [Google Scholar] [CrossRef]
- Dai, D.; Lei, K.; Wang, R.; Lv, X.; Hu, J.; Sun, M. Evaluation of River Restoration Efforts and a Sharp Decrease in Surface Runoff for Water Quality Improvement in North China. Environ. Res. Lett. 2022, 17, 044028. [Google Scholar] [CrossRef]
- Gocic, M.; Trajkovic, S. Analysis of Changes in Meteorological Variables Using Mann-Kendall and Sen’s Slope Estimator Statistical Tests in Serbia. Glob. Planet. Chang. 2013, 100, 172–182. [Google Scholar] [CrossRef]
- Mallick, J.; Talukdar, S.; Alsubih, M.; Salam, R.; Ahmed, M.; Kahla, N.B.; Shamimuzzaman, M.d. Analysing the Trend of Rainfall in Asir Region of Saudi Arabia Using the Family of Mann-Kendall Tests, Innovative Trend Analysis, and Detrended Fluctuation Analysis. Theor Appl Clim. 2021, 143, 823–841. [Google Scholar] [CrossRef]
- Nyikadzino, B.; Chitakira, M.; Muchuru, S. Rainfall and Runoff Trend Analysis in the Limpopo River Basin Using the Mann Kendall Statistic. Phys. Chem. Earth Parts A/B/C 2020, 117, 102870. [Google Scholar] [CrossRef]
- Fu, J.; Kang, S.; Zhang, L.; Li, X.; Gentine, P.; Niu, J. Amplified Warming Induced by Large-Scale Application of Water-Saving Techniques. Environ. Res. Lett. 2022, 17, 034018. [Google Scholar] [CrossRef]
- Citakoglu, H.; Minarecioglu, N. Trend Analysis and Change Point Determination for Hydro-Meteorological and Groundwater Data of Kizilirmak Basin. Theor Appl Clim. 2021, 145, 1275–1292. [Google Scholar] [CrossRef]
- The MathWorks Inc. Optimization Toolbox Version 8.2 2020. Available online: https://de.mathworks.com/products/optimization.html (accessed on 7 July 2023).
- Jiang, Y. China’s Water Scarcity. J. Environ. Manag. 2009, 90, 3185–3196. [Google Scholar] [CrossRef]
- Zhuo, L.; Mekonnen, M.M.; Hoekstra, A.Y. The Effect of Inter-Annual Variability of Consumption, Production, Trade and Climate on Crop-Related Green and Blue Water Footprints and Inter-Regional Virtual Water Trade: A Study for China (1978–2008). Water Res. 2016, 94, 73–85. [Google Scholar] [CrossRef] [PubMed]
- Dregne, H.E. Desertification of Arid Lands. Econ. Geogr. 1977, 53, 322–331. [Google Scholar] [CrossRef]
- Alamanos, A.; Zeng, Q. Managing Scarce Water Resources for Socially Acceptable Solutions, through Hydrological and Econometric Modeling. Cent. Asian J. Water Res. 2021, 7, 84–101. [Google Scholar] [CrossRef]
- Yan, H.; Hui, X.; Li, M.; Xu, Y. Development in Sprinkler Irrigation Technology in China*. Irrig. Drain. 2020, 69, 75–87. [Google Scholar] [CrossRef]
- Shen, Q.; Niu, J.; Liu, Q.; Liao, D.; Du, T. A Resilience-Based Approach for Water Resources Management over a Typical Agricultural Region in Northwest China under Water-Energy-Food Nexus. Ecol. Indic. 2022, 144, 109562. [Google Scholar] [CrossRef]
- Dalin, C.; Qiu, H.; Hanasaki, N.; Mauzerall, D.L.; Rodriguez-Iturbe, I. Balancing Water Resource Conservation and Food Security in China. Proc. Natl. Acad. Sci. USA 2015, 112, 4588–4593. [Google Scholar] [CrossRef]
- Cheng, B.; Li, H.; Yue, S.; Huang, K. A Conceptual Decision-Making for the Ecological Base Flow of Rivers Considering the Economic Value of Ecosystem Services of Rivers in Water Shortage Area of Northwest China. J. Hydrol. 2019, 578, 124126. [Google Scholar] [CrossRef]
- Yu, C. China’s Water Crisis Needs More than Words. Nature 2011, 470, 307. [Google Scholar] [CrossRef]
- Cai, J.; Varis, O.; Yin, H. China’s Water Resources Vulnerability: A Spatio-Temporal Analysis during 2003–2013. J. Clean. Prod. 2017, 142, 2901–2910. [Google Scholar] [CrossRef]
- Su, B.; Huang, J.; Fischer, T.; Wang, Y.; Kundzewicz, Z.W.; Zhai, J.; Sun, H.; Wang, A.; Zeng, X.; Wang, G.; et al. Drought Losses in China Might Double between the 1.5 °C and 2.0 °C Warming. Proc. Natl. Acad. Sci. USA 2018, 115, 10600–10605. [Google Scholar] [CrossRef] [PubMed]
- Tong, Y.; Zhang, W.; Wang, X.; Couture, R.-M.; Larssen, T.; Zhao, Y.; Li, J.; Liang, H.; Liu, X.; Bu, X.; et al. Decline in Chinese Lake Phosphorus Concentration Accompanied by Shift in Sources since 2006. Nature Geosci 2017, 10, 507–511. [Google Scholar] [CrossRef]
- Chen, Q.; Tan, K.; Zhu, C.; Li, R. Development and Application of a Two-Dimensional Water Quality Model for the Daqinghe River Mouth of the Dianchi Lake. J. Environ. Sci. 2009, 21, 313–318. [Google Scholar] [CrossRef]
- Zhang, Z.; He, W.; Shen, J.; An, M.; Gao, X.; Degefu, D.M.; Yuan, L.; Kong, Y.; Zhang, C.; Huang, J. The Driving Forces of Point Source Wastewater Emission: Case Study of COD and NH4-N Discharges in Mainland China. Int. J. Environ. Res. Public Health 2019, 16, 2556. [Google Scholar] [CrossRef] [PubMed]
- Zhao, Y.; Wang, S.; Zhou, C. Understanding the Relation between Urbanization and the Eco-Environment in China’s Yangtze River Delta Using an Improved EKC Model and Coupling Analysis. Sci. Total Environ. 2016, 571, 862–875. [Google Scholar] [CrossRef]
- Tang, W.; Pei, Y.; Zheng, H.; Zhao, Y.; Shu, L.; Zhang, H. Twenty Years of China’s Water Pollution Control: Experiences and Challenges. Chemosphere 2022, 295, 133875. [Google Scholar] [CrossRef]
- Ma, T.; Zhao, N.; Ni, Y.; Yi, J.; Wilson, J.P.; He, L.; Du, Y.; Pei, T.; Zhou, C.; Song, C.; et al. China’s Improving Inland Surface Water Quality since 2003. Sci. Adv. 2020, 6, eaau3798. [Google Scholar] [CrossRef] [PubMed]
- Han, D.; Currell, M.J.; Cao, G. Deep Challenges for China’s War on Water Pollution. Environ. Pollut. 2016, 218, 1222–1233. [Google Scholar] [CrossRef]
- Ministry of Environmental Protection of China (MEP). Technical Specifications Requirements for Monitoring of Surface Water and Waste Water, 4th ed.; Ministry of Environmental Protection of China: Beijing, China, 2002. [Google Scholar]
- Ding, J.; Jiang, Y.; Liu, Q.; Hou, Z.; Liao, J.; Fu, L.; Peng, Q. Influences of the Land Use Pattern on Water Quality in Low-Order Streams of the Dongjiang River Basin, China: A Multi-Scale Analysis. Sci. Total Environ. 2016, 551–552, 205–216. [Google Scholar] [CrossRef] [PubMed]
- Zhou, Y.; Ma, J.; Zhang, Y.; Qin, B.; Jeppesen, E.; Shi, K.; Brookes, J.D.; Spencer, R.G.M.; Zhu, G.; Gao, G. Improving Water Quality in China: Environmental Investment Pays Dividends. Water Res. 2017, 118, 152–159. [Google Scholar] [CrossRef]
- Madramootoo, C.A.; Morrison, J. Advances and Challenges with Micro-Irrigation. Irrig. Drain. 2013, 62, 255–261. [Google Scholar] [CrossRef]
- Stubbs, M. Irrigation in U.S. Agriculture: On-Farm Technologies and Best Management Practices. Congressional Research Service (CRS) Report. Available online: https://sgp.fas.org/crs/misc/R44158.pdf (accessed on 7 July 2023).
- Liu, Y.; Engel, B.A.; Flanagan, D.C.; Gitau, M.W.; McMillan, S.K.; Chaubey, I.; Singh, S. Modeling Framework for Representing Long-Term Effectiveness of Best Management Practices in Addressing Hydrology and Water Quality Problems: Framework Development and Demonstration Using a Bayesian Method. J. Hydrol. 2018, 560, 530–545. [Google Scholar] [CrossRef]


Disclaimer/Publisher’s Note: The statements, opinions and data contained in all publications are solely those of the individual author(s) and contributor(s) and not of MDPI and/or the editor(s). MDPI and/or the editor(s) disclaim responsibility for any injury to people or property resulting from any ideas, methods, instructions or products referred to in the content. |
© 2023 by the authors. Licensee MDPI, Basel, Switzerland. This article is an open access article distributed under the terms and conditions of the Creative Commons Attribution (CC BY) license (https://creativecommons.org/licenses/by/4.0/).
Share and Cite
Dai, D.; Alamanos, A.; Cai, W.; Sun, Q.; Ren, L. Assessing Water Sustainability in Northwest China: Analysis of Water Quantity, Water Quality, Socio-Economic Development and Policy Impacts. Sustainability 2023, 15, 11017. https://doi.org/10.3390/su151411017
Dai D, Alamanos A, Cai W, Sun Q, Ren L. Assessing Water Sustainability in Northwest China: Analysis of Water Quantity, Water Quality, Socio-Economic Development and Policy Impacts. Sustainability. 2023; 15(14):11017. https://doi.org/10.3390/su151411017
Chicago/Turabian StyleDai, Dan, Angelos Alamanos, Wenqian Cai, Qingqing Sun, and Liangsuo Ren. 2023. "Assessing Water Sustainability in Northwest China: Analysis of Water Quantity, Water Quality, Socio-Economic Development and Policy Impacts" Sustainability 15, no. 14: 11017. https://doi.org/10.3390/su151411017
APA StyleDai, D., Alamanos, A., Cai, W., Sun, Q., & Ren, L. (2023). Assessing Water Sustainability in Northwest China: Analysis of Water Quantity, Water Quality, Socio-Economic Development and Policy Impacts. Sustainability, 15(14), 11017. https://doi.org/10.3390/su151411017