Article

Impact of Urban Form at the Block Scale on Renewable Energy Application and Building Energy Efficiency

School of Economics and Management, Beijing Jiaotong University, Beijing 100044, China
*
Author to whom correspondence should be addressed.
Sustainability 2023, 15(14), 11062; https://doi.org/10.3390/su151411062
Submission received: 1 June 2023 / Revised: 10 July 2023 / Accepted: 10 July 2023 / Published: 14 July 2023
(This article belongs to the Section Green Building)

Abstract

:
Improving building energy efficiency and widespread application of renewable energy are key measures for achieving zero-emission development in the building sector in response to climate change. However, previous studies on buildings and renewable energy use have predominantly treated buildings as independent entities, overlooking the influence of urban morphology on both aspects. Conducting research on the impact of urban form on building energy consumption and renewable energy application at the block scale can contribute to more accurate predictions of renewable energy potential and building energy efficiency, thereby enhancing their synergistic relationship. In this context, this study proposes a methodology for building energy simulation and analysis of renewable energy potential in building clusters using the Grasshopper platform. Six typical residential building clusters in Beijing, selected based on the local climate zone system, are used as representative samples of urban forms at the block scale. Based on these samples, 30 building cluster prototypes have been constructed. By simulating the renewable energy potential and building energy consumption of these prototypes, the study analyzes the influence of urban form on both aspects. The results indicate that the heat island effect and obstruction effect between buildings are the main manifestations of urban form influence; in this case, the urban heat island effect can reduce the building heating energy consumption by 15.8% on average and increase the cooling energy consumption by up to 30%; the shading effect between buildings increases heating energy consumption by an average of 11.88% and reduces cooling energy consumption by 5.87%. These two factors have opposite effects on building energy efficiency and are correlated with urban form parameters, such as the sky view factor, street canyon height to street canyon width ratio, and floor area ratio. This study provides valuable insights for the application of renewable energy in buildings and the balance of energy supply and demand.

1. Introduction

As urbanization progresses and urban populations continue to grow, urban development faces significant challenges. Currently, more than half of the population lives in cities, which consume two-thirds of the world’s energy and contribute to 70% of carbon emissions. This situation makes climate change a critical issue for urban development [1]. Energy consumption in buildings accounts for a large proportion of urban energy consumption. With the introduction of carbon neutrality strategies worldwide, achieving zero-carbon energy use in buildings has become a new development requirement. Building a more sustainable energy system and maximizing building energy efficiency is widely recognized as an essential choice for achieving zero-emission goals in the building sector [2]. It is projected that by 2050, all buildings will need to incorporate renewable energy technologies to meet the requirements of developing zero-emission buildings [3].
With the continuous improvement of building energy efficiency and the increasing share of renewable energy applications, the challenge of achieving an appropriate and harmonious balance between energy supply and demand in buildings is becoming more and more challenging. This underscores the heightened demands for research on building energy efficiency and the widespread application of renewable energy sources. Current research on building energy efficiency focuses primarily on individual buildings, including enhancing thermal performance, improving architectural design, and optimizing the efficiency of building equipment and operations [4,5,6,7]. However, research on the environmental impact on buildings is relatively limited. Some studies have indicated that the assumption of isolated buildings, which neglects the microclimate changes in the surrounding environment and the impact of adjacent buildings on daylighting, can lead to significant differences in building energy simulation [8,9,10,11]. On one hand, urban morphology can alter regional microclimates, such as temperature, wind speed, and wind direction, thereby influencing the internal energy balance of buildings and subsequently affecting their thermal loads. On the other hand, mutual shading between buildings can impact the distribution of solar radiation, which in turn affects the energy consumption for lighting, cooling, and heating within the buildings [12]. In a study by A. Boccalatte et al., EnergyPlus was employed to simulate the heating and cooling consumption of residential buildings. Using suburban weather data as input, the annual air conditioning demand was reduced by 10% [9]. Z. Ren et al. used the UCM-TAPM (Urban Canopy Model—The Air Pollution Model) to assess the effect of urban heat islands on single-story and two-story freestanding houses located in Melbourne. The houses were modeled using AccuRate software. The results revealed that the urban climate reduced heating demand by 0.9–3.1%, while increasing cooling demand by 8.2–11.4% [13]. Liu et al. conducted a study using EnergyPlus software to investigate the impact of the urban heat island effect on residential buildings in Singapore. They found that cooling energy consumption increased by 4.15–11% [14]. In addition, the shading effect between buildings can also have a significant impact on building energy efficiency. Research by Cong Yu et al. has shown that the shading effect between buildings can influence building energy consumption by up to 13.1%. A comparison of different shading scenarios with a baseline scenario revealed significant variations in heating, ventilation, air conditioning (HVAC), and lighting consumption. HVAC consumption ranged from −11.8% to 18.8%, while lighting consumption varied from 0.1% to −27.6%. An offsetting effect occurred between reduced lighting consumption and increased HVAC consumption [15]. A. L. S. Chan studied the effect of adjacent shading of various residential buildings in Hong Kong and found that optimizing the layout design can reduce building cooling loads by up to 18.3% [16].
In addition, urban morphology and structure have a significant impact on the application of renewable energy in buildings, particularly solar photovoltaics [17,18]. J. Zhang et al. defined typical urban block types to study the influence of urban form on solar energy utilization and building energy efficiency. The results showed that different urban block types lead to significant variations in solar potential and building energy efficiency [8]. Tian and Xu quantified the impact of morphological parameters on the solar potential of residential areas, using Wuhan, China, as an example. The results indicated that floor area ratio, building density, average building height, and building spacing affect the solar potential of residential areas [19,20]. Chatzipoulka, Compagnon, and Nikolopoulou conducted a study on 24 representative urban structures in London and found that density has a negative impact on solar energy utilization potential. They also identified several key factors that quantify urban layout, which significantly influence the solar potential of open spaces and building façades. These factors include the average spacing between buildings, site coverage ratio, and variations in building height [21].
In conclusion, the significance of urban form in relation to building energy consumption and the utilization of renewable energy cannot be overlooked in the pursuit of achieving zero emissions. This study specifically examines residential buildings and investigates the influence of urban form on building energy efficiency and the adoption of renewable energy at the block level. To mitigate potential counteracting effects, this paper separately addresses the impacts of the urban heat island effect and adjacent shading. The results and insights gained from this research contribute to the advancement of zero-emission goals in the building and construction sector. The remaining sections of the paper are as follows: Section 2 presents the main workflow of the research and the simulation methods used for renewable energy and building energy consumption modeling. Section 3 presents the simulation results and analyzes the relationship among building energy efficiency, renewable energy application, and urban form. Section 4 discusses the correlation among building energy consumption, renewable energy application, and urban form in more detail. Section 5 concludes the findings of the study.

2. Materials and Methods

2.1. The Workflow of This Study

The workflow of this study can be divided into four different parts. In the first part, six typical sample plots in the built-up region of Beijing were selected based on the local climate zone system. Taking into account the building types and distribution patterns, Rhino7 software was employed to create 30 prototype building clusters that represent different urban forms at the block scale. Moving on to the second part, an analysis model was developed to evaluate the potential of shallow geothermal energy resources in the different building cluster prototypes. The analysis was performed using the Radiance plugin in Grasshopper, which allows the evaluation of solar energy utilization potential within the building clusters. In the third part, the Dragonfly plugin in Grasshopper was used to simulate the impact of different building clusters on the urban microclimate, generating the necessary urban microclimate meteorological data files for EnergyPlus simulation. Building energy simulations were performed using the Ladybug, Honeybee, and HB-Energy plugins, taking into account both the mutual shading effect between buildings and the scenario where building shading effects were not considered. The simulations utilized both the original meteorological data and the simulated microclimate data. The fourth part analyzed and discussed the research findings. The local climate zone (LCZ) system, proposed by Stewart and Oke in 2012 as a classification method for temperature studies, was utilized [22]. It includes 10 basic built types (LCZ 1–10). The characteristic parameters of LCZs include 10 indicators closely related to microclimate, such as the sky view factor, aspect ratio, average building height, building density, and pervious and impervious surface fraction. Each LCZ has homogeneous distributions of underlying surfaces, spatial form, material composition, and human activities. LCZs of the same type typically exhibit similar microclimate characteristics.

2.2. Building Cluster Prototypes

Beijing, located on the northwest edge of the North China Plain (latitude 39°26′ to 41°03′ N, longitude 115°25′ to 117°30′ E), has a total area of 16,410.0 square kilometers. The built-up area covers 1469.1 square kilometers, with a population of 231.85 million. The city experiences a warm–temperate continental monsoon climate, with the average temperature in the coldest month (January) being around −3.1 °C and in the hottest month (July) around 26.7 °C [23]. Based on the definitions and indicators of each LCZ type, LCZ 1–6 located within the built-up area were selected, representing compact high-rise building clusters, compact mid-rise building clusters, and compact low-rise building clusters, as well as open high-rise building clusters, open mid-rise building clusters, and open low-rise building clusters (Figure 1 and Figure 2).
Furthermore, the types and distribution patterns of individual buildings, which directly impact building energy efficiency and the utilization of renewable energy, are also important components of the urban form. Therefore, based on the selected six LCZs, typical types of individual buildings in Beijing were considered, including slab buildings, tower buildings, and villas. The distribution patterns of buildings include linear, courtyard, staggered, and interconnected layouts. Thirty prototype building clusters were created to represent the major urban forms characterized by residential buildings. The size of each building cluster prototype was standardized as a 300 × 300 m square site, with a 10 m inward offset serving as the building boundary. In addition, the key parameters selected for the prototype building clusters were based on the LCZ system, including the sky view factor (SVF), canyon height to canyon width ratio (H/W), impervious surface fraction (IPSF), pervious surface fraction (PSF), building height (BH), building density (BD), and floor area ratio (FAR). To ensure effective control of variables, building clusters of the same local climate zone were designed with consistent building heights and floor area ratios (Table 1, Table 2 and Table 3).

2.3. Renewable Energy Application

Shallow geothermal energy refers to a renewable energy source that originates from the Earth’s interior and is distributed within a certain range of geological formations below the surface. It has characteristics such as renewable, large reserves, clean, and high availability. Geothermal heat pump technology is the primary method used to harness shallow geothermal energy to provide heating and cooling solutions for buildings. Compared to conventional air conditioning systems, geothermal heat pumps have the advantage of producing approximately 3–4 kW of heating or cooling energy for every 1 kW of electricity consumed, resulting in significant energy savings and environmental benefits. Solar energy is the primary renewable energy source, and every building is exposed to varying degrees of solar radiation. Solar energy applications in buildings include solar thermal utilization, photovoltaic power generation, and natural lighting. This paper focuses primarily on the application of photovoltaic technology.

2.3.1. Shallow Geothermal Energy

As a “point-to-point” resource utilization model, the use of shallow geothermal energy for heating and cooling is constrained by the physical characteristics of the building’s location and ground space. The assessment of shallow geothermal energy potential for ground source heat pump systems is calculated using the following formula [24]:
Q G S = N × L g s × D h c × t g s × min E E R g s E E R g s + 1 , C O P g s C O P g s + 1
Specifically:
  • Q G S —Resource utilization potential of ground source heat pump systems (kWh);
  • N —Number of geothermal heat pump boreholes;
  • L g s —Depth of the borehole;
  • D h c —Heat transfer power of a single hole (W/m);
  • t g s —Annual equivalent operating hours;
  • E E R g s —Cooling energy efficiency ratio of ground source heat pump;
  • C O P g s —Coefficient of performance for ground source heat pump in heating mode.
According to the formula, the resource utilization potential of ground source heat pump systems in a specific area is mainly influenced by factors such as the number of boreholes, heat transfer power per borehole, borehole depth, system operating time, and cooling/heating coefficient of performance (COP). To simplify calculations, a uniform COP of 3.5 is set for the ground source heat pump system. Based on the subsequent building energy simulation results and the climatic data collected for the simulation year, the annual cooling duration for the building is 1837 h, while the heating duration is 2780 h. The heat transfer power per borehole in the ground source heat pump system is mainly related to the overall thermal conductivity of the borehole. Based on the actual engineering applications in Beijing, the heat transfer power per borehole is set as 45 W/m in winter and 60 W/m in summer. The number of boreholes is closely related to the building type, and under the scenario of a 5 m spacing between boreholes, the number of boreholes that can be arranged per unit area is 0.046 boreholes per square meter [25]. Based on the available references, the recommended allocation of borehole areas in different types of building clusters is as follows. For existing building clusters: No boreholes can be allocated within the footprint of existing buildings. Impervious surfaces can accommodate borehole areas up to 50% of their total area, while pervious surfaces should have borehole areas allocated at a rate of 70%. For new building clusters: Within the footprint of the buildings, boreholes for ground source heat pump systems can be pre-allocated. Borehole areas should be calculated at 70% of the total area. Impervious surfaces, such as community roads, should have boreholes allocated at a rate of 60%. Pervious surfaces, such as community green spaces, should have boreholes allocated at a rate of 80%.

2.3.2. Solar Photovoltaic Power Generation

The amount of solar energy yield that can be generated by a building depends on factors such as the available area for PV module installation, annual solar irradiance on the surface of the PV modules, and the module conversion efficiency. The relationship can be described using the following formula [26]:
E p v = I × K E × 1 K s × A p
Specifically:
  • E p v —Annual energy yield of the solar PV system (kWh);
  • I —Annual solar radiance on the surface of PV panels (kWh/m2);
  • K E —Conversion efficiency of PV modules (%);
  • K s —Efficiency loss of PV modules (%);
  • A p —Net surface area of PV modules (m2).
The PV module conversion efficiency is set at 20% and the efficiency loss at 25%. The annual solar irradiance on the surface of PV modules is obtained through simulation using the Radiance (5.4a) software. Radiance [27] is a validated lighting and solar radiation research software used to simulate the cumulative annual irradiance received on building surfaces. The potential deployment area for solar panels in buildings depends on the annual solar irradiance and the building structure. Studies have indicated that the annual solar irradiance thresholds for PV generation on roofs and façades are 1000 kWh/m2 × y and 800 kWh/m2 × y, respectively [28]. From a structural perspective, the roof area of buildings is relatively intact, which makes the installation of PV modules relatively easy. The installation area for PV modules is calculated as 80% of the roof area. For building façades, considerations such as window areas and installation restrictions come into play. In scenarios where windows are present, the installation area for PV modules is determined as 50% of the remaining façade area after accounting for the windows. In scenarios without windows, PV panels are placed at a ratio of 70% of the total façade area.

2.4. Building Energy Consumption

2.4.1. Urban Weather Generator (UWG)

In contrast to the assumption of isolated buildings, building energy simulations for building clusters must take into account the local microclimate, including the urban heat island effect, as well as the mutual shading effects between buildings. The Urban Weather Generator (UWG) is a microclimate prediction tool based on an urban energy balance model. It starts with rural weather files and modifies the hourly values of air temperature and other indicators to simulate microclimate conditions within the city [9]. In this study, the UWG tool has been implemented using the Dragonfly plugin in Grasshopper, which provides calculations for estimating the urban heat island effect. The main parameters used to generate input for the simulation of urban microclimate data are as follows. The building cluster prototype models were also input into the UWG tool to generate microclimate data for each building cluster prototype (Table 4).
Waste heat discharge rate of air conditioning systems: the waste heat discharge rate of air conditioning systems is a fraction between 0 and 1, indicating the proportion of waste heat generated by the air conditioning system that is rejected into the urban canyon. Regarding the traffic parameters, it is a numerical value that represents the maximum sensible anthropogenic heat flux in watts per square meter for the urban area. This includes heat generated by sources other than buildings, such as automobiles, street lighting, and human metabolism.

2.4.2. Building Energy Simulation

The building energy simulations in this study were performed using the Honeybee plugin within Grasshopper, which relies on the EnergyPlus engine. EnergyPlus is a comprehensive building energy simulation program developed with the support of the U.S. Department of Energy. It is widely used in academia and the engineering industry [29]. In this study, annual building energy simulations were conducted for the entire building cluster prototype. Each floor was divided into thermal zones to ensure reasonable simulation times. To compare the energy performance of different building cluster types, the same simulation parameters were applied to each building cluster prototype.
In China, a strategic vision has been proposed to peak carbon emissions before 2030 and carbon neutrality before 2060. In the field of urban and rural development, the goal is to peak carbon emissions before 2030, while scaling up the development of low-carbon buildings and encouraging the construction of zero-emission and nearly zero-energy buildings [30]. Beijing has set a target of promoting a cumulative scale of 5 million square meters of ultra-low-energy buildings during the 14th Five-Year Plan period [31]. It is evident that zero-emission buildings and near zero-energy buildings, represented by ultra-low-energy buildings, will become a trend in the construction industry. For this reason, this study case adopts ultra-low-energy building standards to minimize the building energy demand, with reference to both the local standard of Beijing, Design Standard for Ultra-Low Energy Residential Buildings (DB11/T 1665-2019), and the national standard, Technical Standard for Nearly Zero Energy Buildings (GB/T 51350-2019), for requirements related to ultra-low-energy buildings [26,32]. The heat transfer coefficient for all building roofs was set at 0.10 (W/m2 × K), for exterior walls at 0.15 (W/m2 × K), and for windows at 0.8 (W/m2 × K), and the solar heat gain coefficient was uniformly set at 0.45. Additionally, parameters of certain fundamental structural elements of the buildings comply with ultra-low-energy building standards. For example, the window-to-wall ratio was set at 0.35, with front and rear windows for slab buildings, and front, rear, left, and right windows for tower buildings, all following the 0.35 window-to-wall ratio. In addition, the buildings had a set floor height of 2.8 m and were categorized as high-rise or mid-rise residential buildings with a mixed structure type. Sun shading devices were installed on windows facing south, east, and west, providing partial shading to prevent excessive sunlight from entering the interior during summer, while minimizing the impact on daylighting during winter. An ideal air conditioning system was used to simulate buildings’ heating and cooling loads. The heating season was defined from 15 November to 15 March, with an indoor temperature set at 18 degrees Celsius. The cooling season set the maximum indoor temperature at 26 degrees Celsius. Furthermore, to account for energy-saving behavior, a ventilation mode was put in place. Specifically, when the outdoor temperature was ≤28 degrees Celsius and the relative humidity was ≤70%, natural ventilation was utilized without cooling demand. The specific parameter settings were as follows:
The occupancy rate was set based on relevant standards. From 20:00 to 07:00 the next day, the occupancy rate was 100%, while during other times, it remained below 50%. From 14:00 to 16:00, the occupancy rate was zero. The personnel density was set at 32 m2/person. The lighting power density inside the building was 3 W/m2, and the power density for electrical appliances and other electrical facilities was 18 W/m2. In line with the zero-emission target, the building’s energy consumption was fully electrified. The kitchen used electric cooking appliances instead of gas equipment, with 5 W/m2 energy consumption instead of gas consumption at 1.0 m3/m2 after conversion. For water heating, an air-source heat pump was utilized with a COP value of 3.5. The equivalent electricity consumption was set at 2.5 W/m2. The usage rates and operating hours for lighting, electrical appliances, hot water, and cooking facilities were all set according to relevant standards.
During software simulation, original climate data, as well as microclimate data generated by the UWG tool, were separately incorporated to analyze and compare the impact of the urban microclimate on building energy consumption. Additionally, neighboring building models were included in the simulation as obstructing objects to account for the building-to-building shading effect. When neighboring building models were not included as obstructing objects, the simulation neglected the shading effect caused by adjacent buildings (Table 5).

3. Results

3.1. Shallow Geothermal Energy Application

The calculation of the number of boreholes that can be installed for different building clusters is illustrated in the figure below. From the results, it is evident that the availability of a building footprint area is a key factor affecting the number of boreholes in a geothermal heat pump system, particularly in compact building clusters. The proportion of permeable area and green space in the building site also has an impact on the number of boreholes that can be installed. For existing building clusters, it is not suitable to allocate boreholes within the building footprint. Therefore, building density is the most critical variable influencing the number of boreholes. In this study, the average building density of compact building clusters is 1.58 times that of open building clusters, and the number of borehole installations accounts for 77.4% of the latter. Within the same local climate zone, tower building clusters exhibit relatively lower building density, resulting in a significant fluctuation in the number of boreholes that can be installed. Borehole depth is also an important factor influencing the utilization of shallow geothermal energy resources. To simplify calculations, three depths of 30 m, 80 m, and 120 m have been set as scenarios for the application of shallow geothermal energy. Formula (1) can be used to calculate the potential utilization of shallow geothermal energy for individual building cluster prototypes (Figure 3 and Figure 4).

3.2. Solar Photovoltaic Power Generation Application

3.2.1. Total Power Generation

Based on simulation results from Radiance, the figure above shows the visualization of solar irradiance in building clusters. It reveals that building roofs have the highest annual solar irradiance, followed by the southern façade, while the eastern and western façades have the lowest irradiance. The calculations indicated that the average annual solar irradiance on rooftops in Beijing is 1285.42 kWh/m2. For unobstructed south-facing façades, the figure was 1015.45 kWh/m2, while for unobstructed east-facing façades, it was 559.50 kWh/m2, and for west-facing façades, 721.43 kWh/m2. With current technologies, buildings in Beijing enjoy favorable conditions for utilizing solar energy on rooftops and south-facing façades. However, the eastern and western façades receive relatively low solar irradiance, making them unsuitable for PV modules at present (Table 6 and Figure 5).
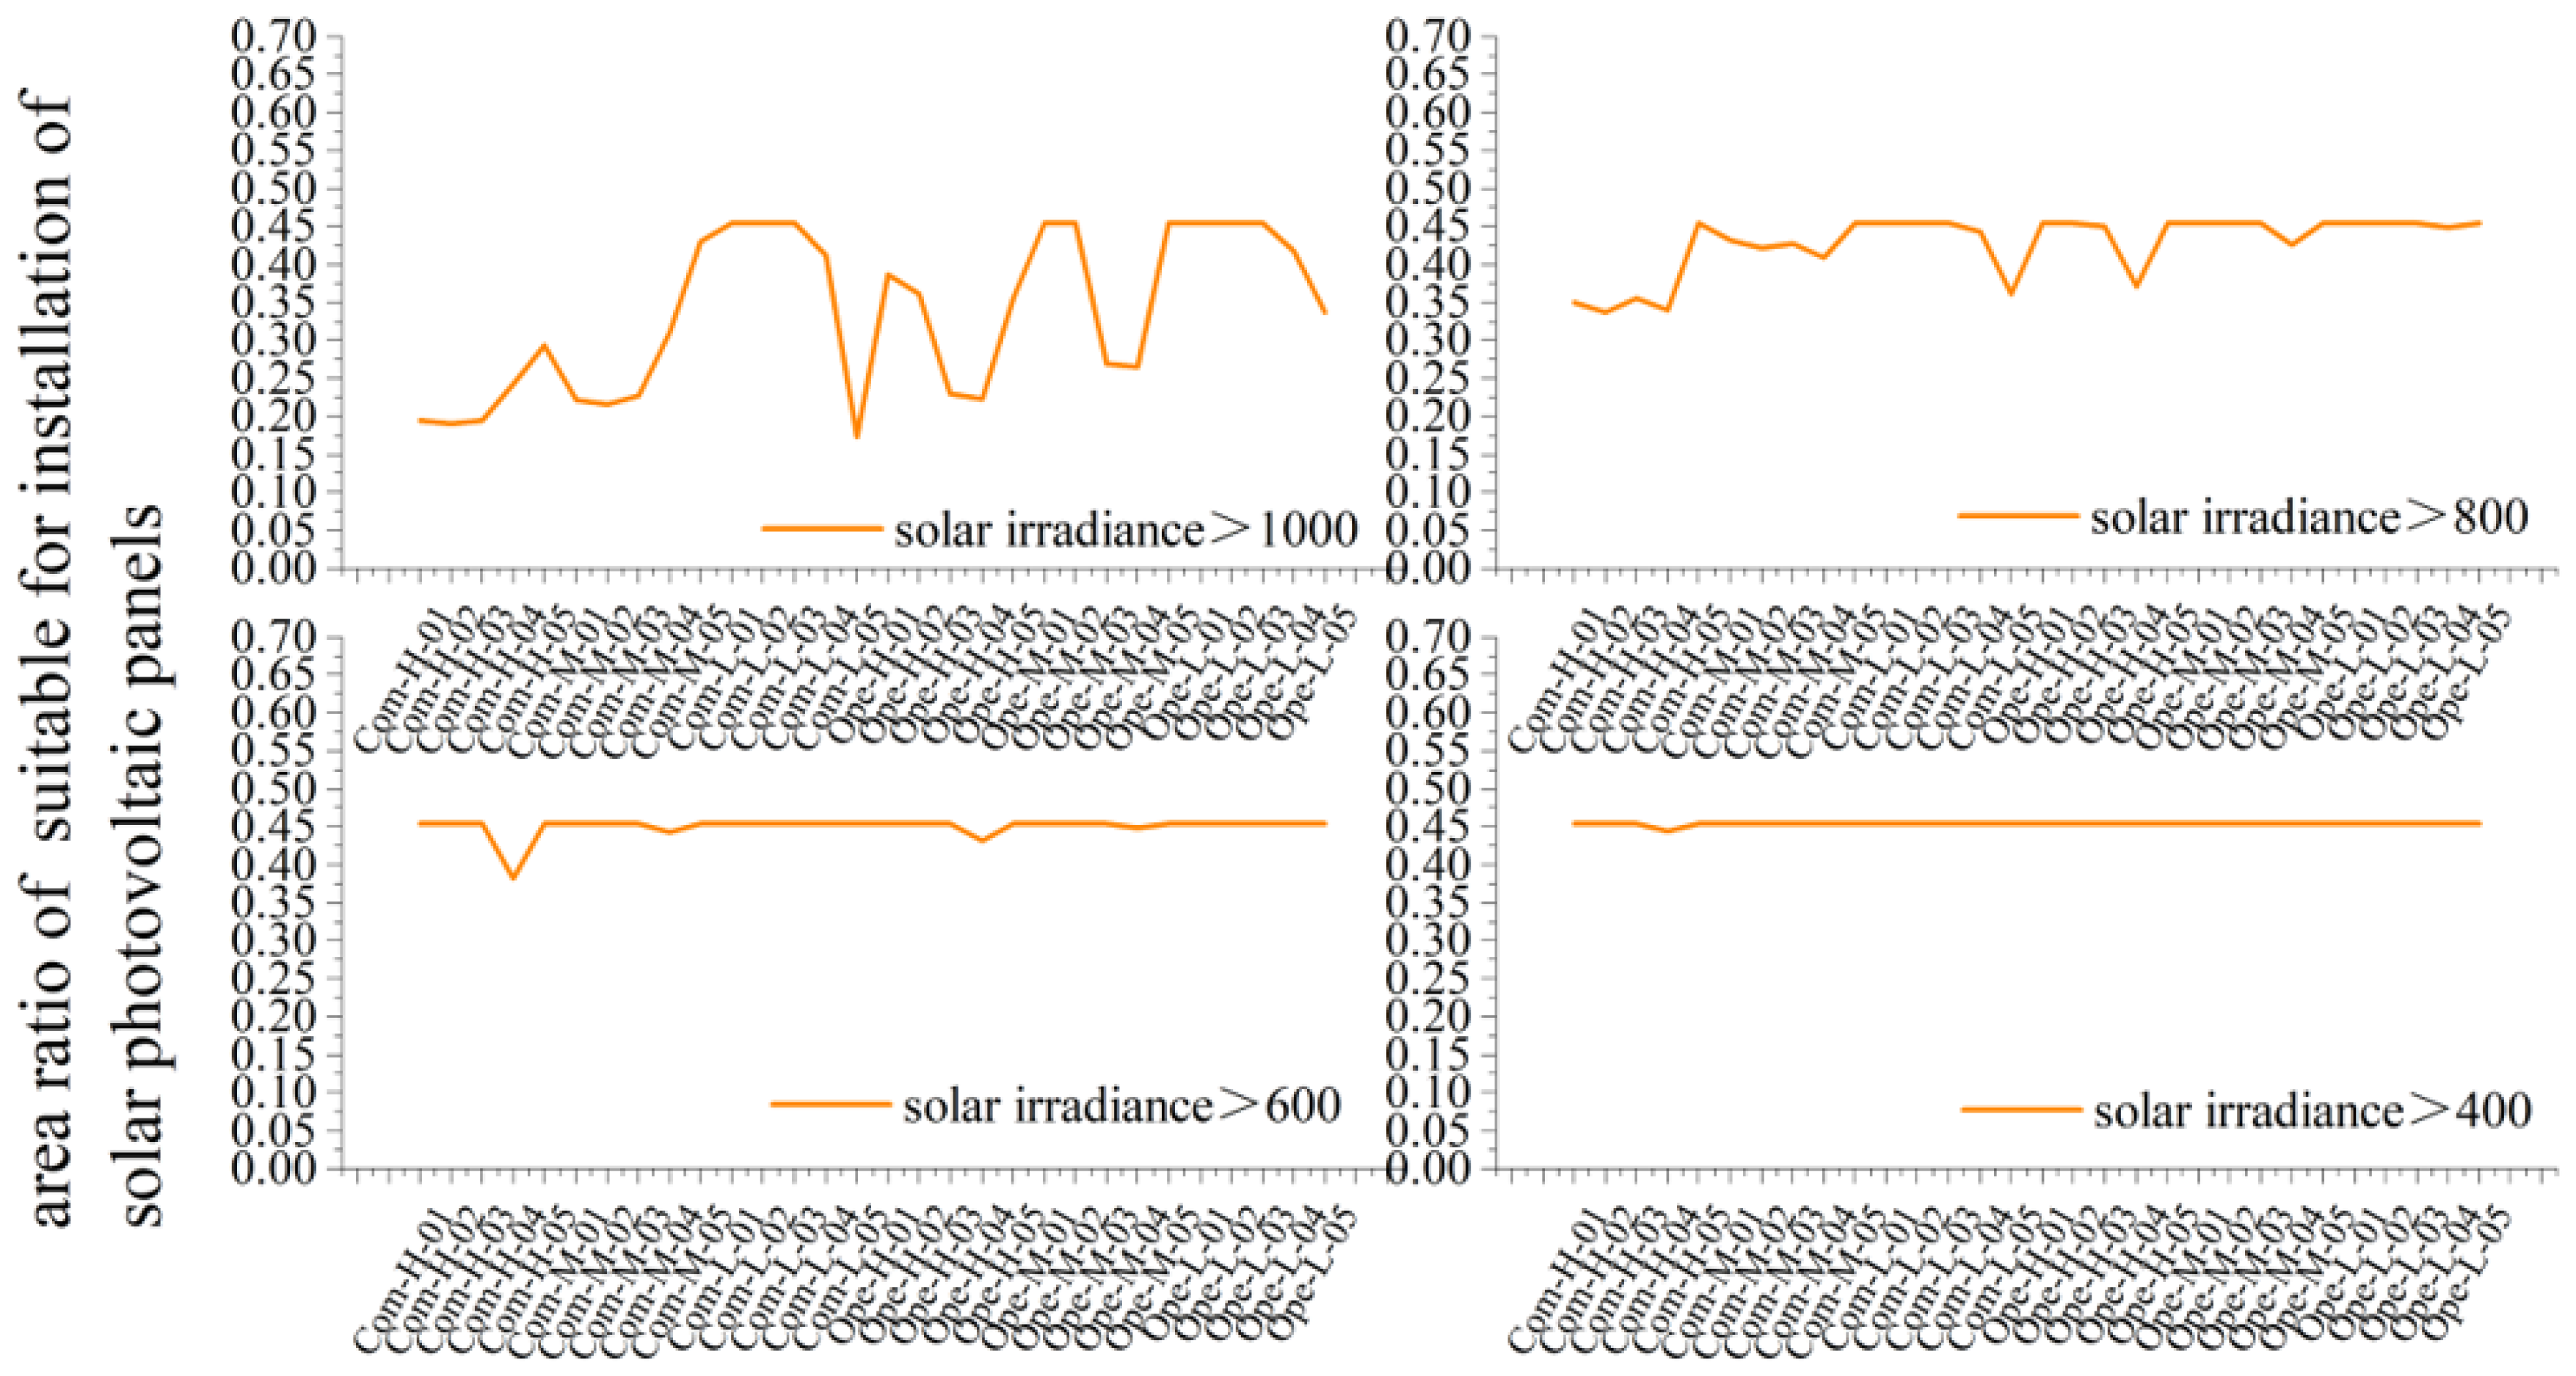
The mutual shading and its varying degrees among building clusters lead to a significant difference in the potential for solar energy utilization. The percentage of south façade area suitable for installing PV modules of different building cluster prototypes has been analyzed. Under different irradiance, the percentage demonstrated varying trends. Simulation results showed that when irradiance exceeded 1000 kWh/m2, the percentage of suitable area for PV system installation fluctuated significantly among different building cluster types, at approximately 20% for compact high-rise and compact mid-rise building clusters, and at higher levels for open building clusters. When solar irradiance exceeded 800 kWh/m2, except for compact high-rise building clusters, all other building cluster types have suitable façades for PV system installation. Further relaxing the installation criteria, almost all southern façades meet the irradiance requirements (Table 7).
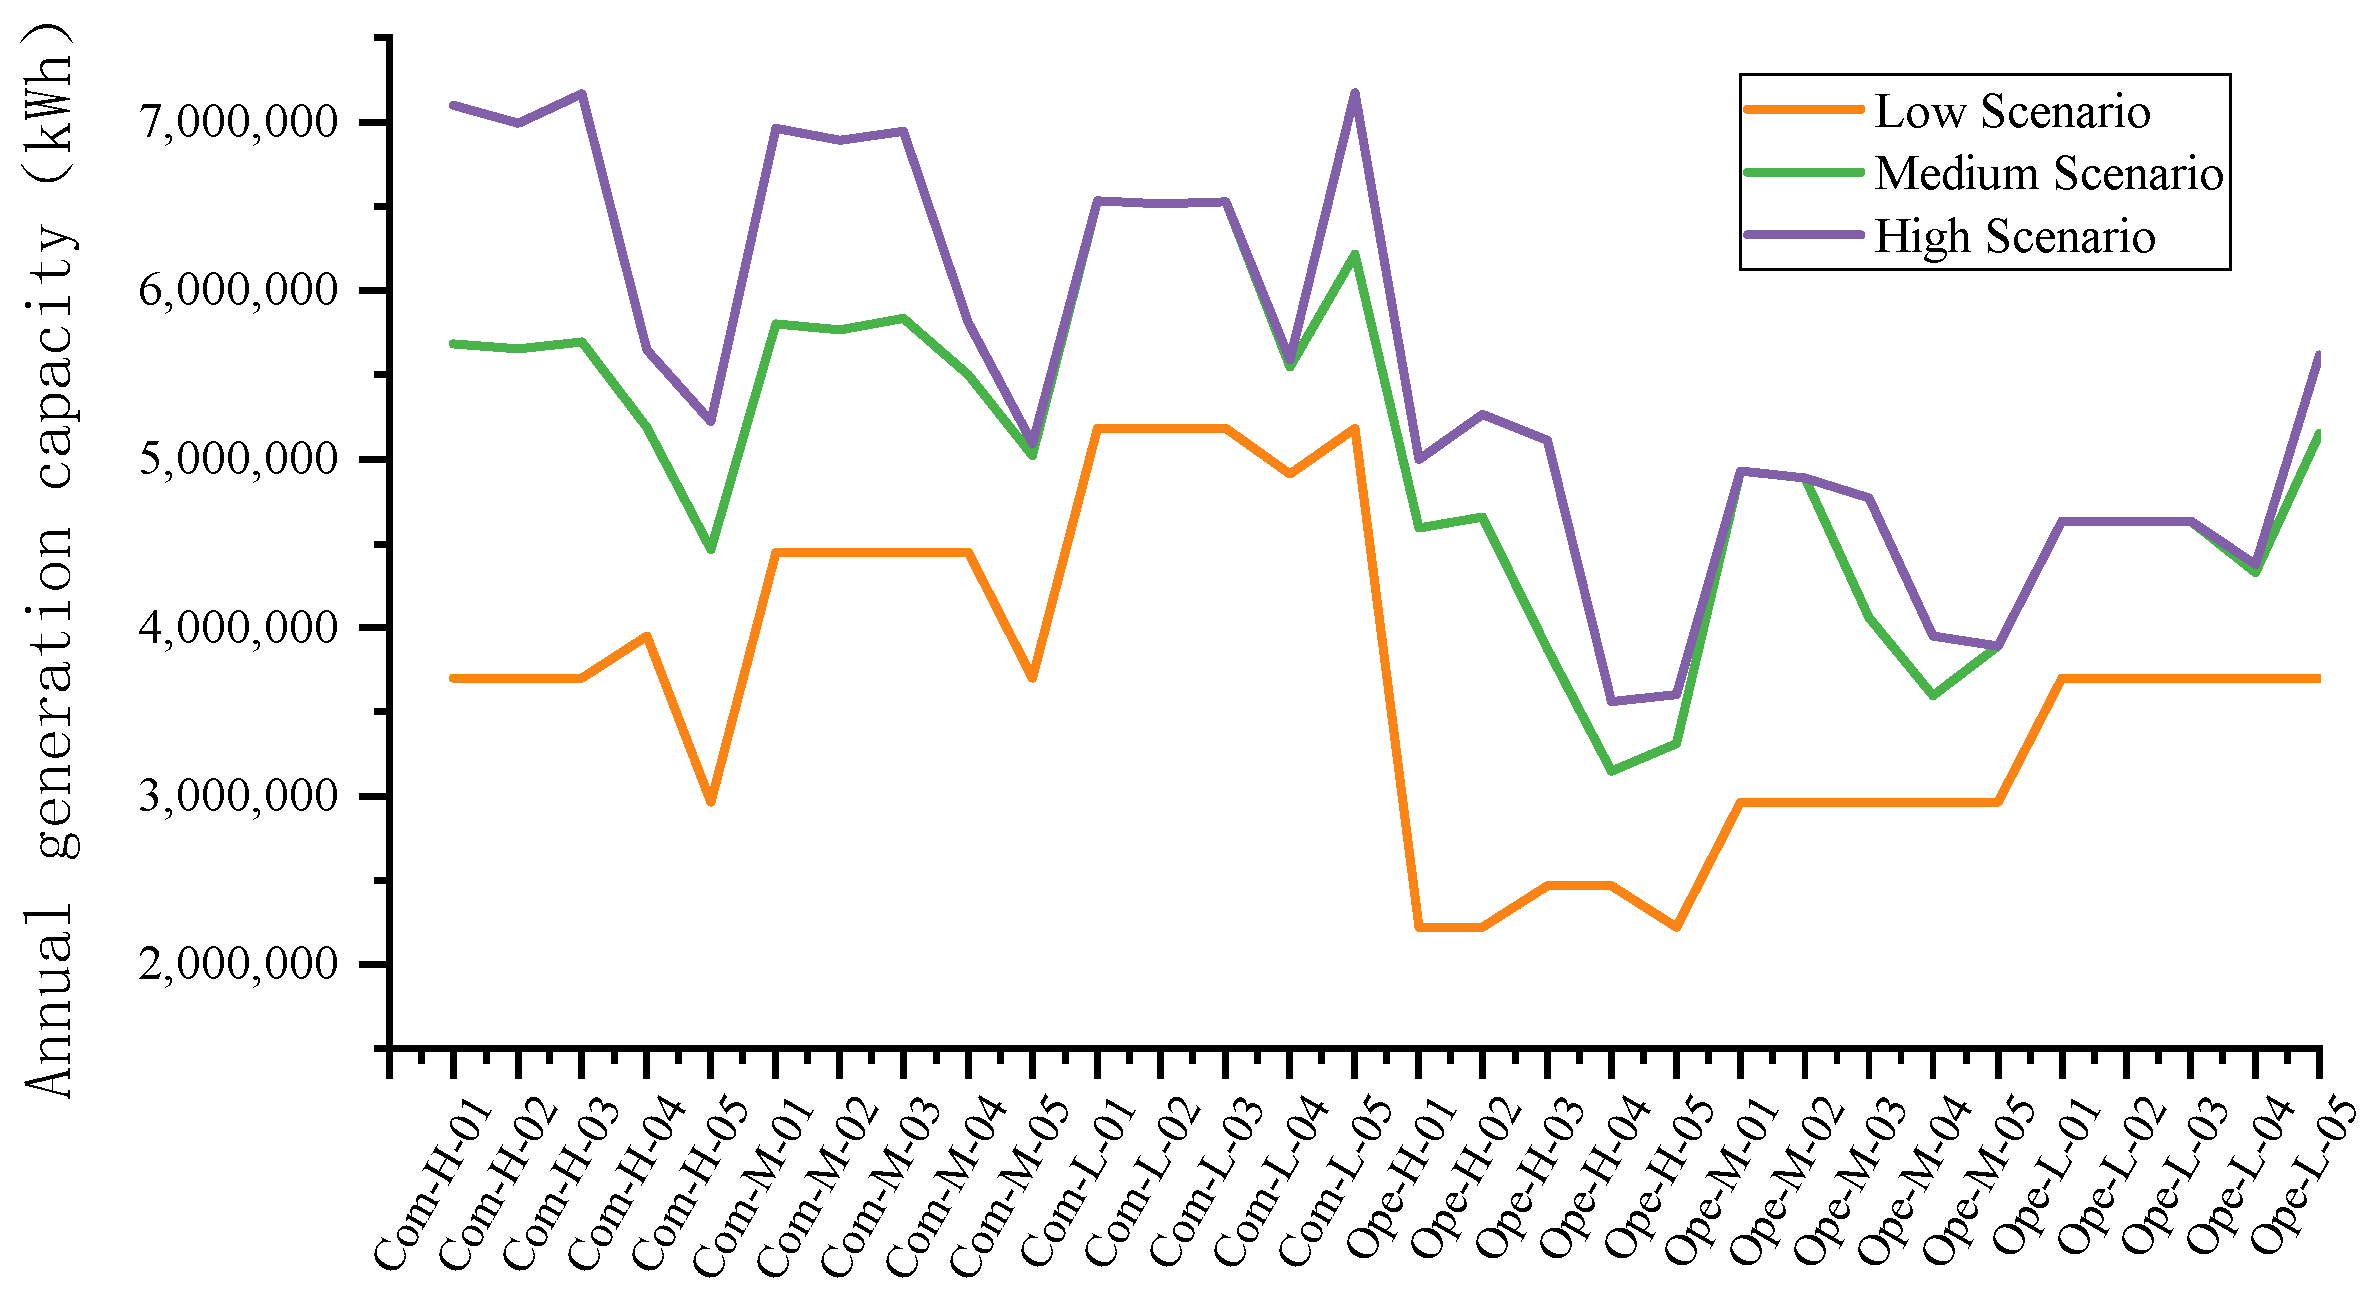
By setting three scenarios for solar PV utilization (high, medium, and low), the energy yield of PV systems for different building cluster prototypes was calculated accordingly. The results demonstrate that maximizing the utilization of building façades effectively increases the potential for solar energy utilization. Compared to the scenario where only rooftop PV systems are installed, the medium scenario shows an average increase in solar electricity generation of 40.24%, with a maximum increase of 66.37%. However, the high scenario shows less significant improvement in solar electricity generation compared to the medium scenario, with an average increase of 9.84% and a maximum increase of 25.9%. When comparing different building cluster types, compact building clusters generally generate more electricity than open building clusters. This is because compact building clusters have more rooftop and façade areas, which compensate for the electricity generation losses caused by mutual shading (Figure 6).

3.2.2. Correlation Analysis

To further explore the relationship between solar power generation and building cluster types, which is essentially the relationship between solar energy and urban form, this study examines the correlation between building cluster parameters and the intensity of total solar power generation. In this study, power generation intensity is defined as the ratio of total power generation to the total floor area of the building clusters. An irradiance level of 800 kWh/m2 was selected, with full utilization of building rooftops and façades for the installation of PV modules, thereby maximizing the utilization of solar energy resources. A correlation analysis has been conducted to investigate the relationship between building cluster parameters and the utilization of solar energy resources.
The SPSS statistical (27.0.1) analysis software is used to investigate the relationship among urban form, building energy consumption, and solar energy potential. The Pearson correlation test (two-tailed) is applied to examine the relationships between parameters and understand the correlations among urban form, building energy efficiency, and solar energy potential. The “p-value” is used to determine whether the differences between variables are significant and serves as a prerequisite for the correlation test. The correlation coefficient ( r ) is used to assess the degree of linear correlation between variables. A correlation coefficient of r = 0 indicates no correlation, 0 < | r | ≤ 0.3 represents weak correlation, 0.3 < | r | ≤ 0.5 represents low correlation, 0.5 < | r | ≤ 0.8 represents significant correlation, 0.8 < | r | < 1 represents high correlation, and | r | = 1 represents a perfect linear correlation. Additionally, the direction of the correlation between variables can be determined based on whether the correlation coefficient ( r ) is greater than zero. If r > 0, the variables are positively correlated, and if r < 0, the variables are negatively correlated. The calculation formula for the correlation coefficient ( r ) is as follows [32]:
r = i = 1 n x i x ¯ y i y ¯ i = 1 n x i x ¯ 2 i = 1 n y i y ¯ 2
The relationship between parameters and solar energy generation intensity was examined, where the latter was defined as the ratio of total electricity generation to the total floor area of the building cluster. The results indicated a negative correlation between the sky view factor and solar energy generation intensity. Additionally, the H/W ratio and building density showed a positive correlation with the building cluster energy generation intensity, but not the building height and floor area ratio, thereby emphasizing the dominant role of rooftop power generation (Figure 7).

3.3. Building Energy Simulation

3.3.1. Heat Island Effect and Occlusion Effect

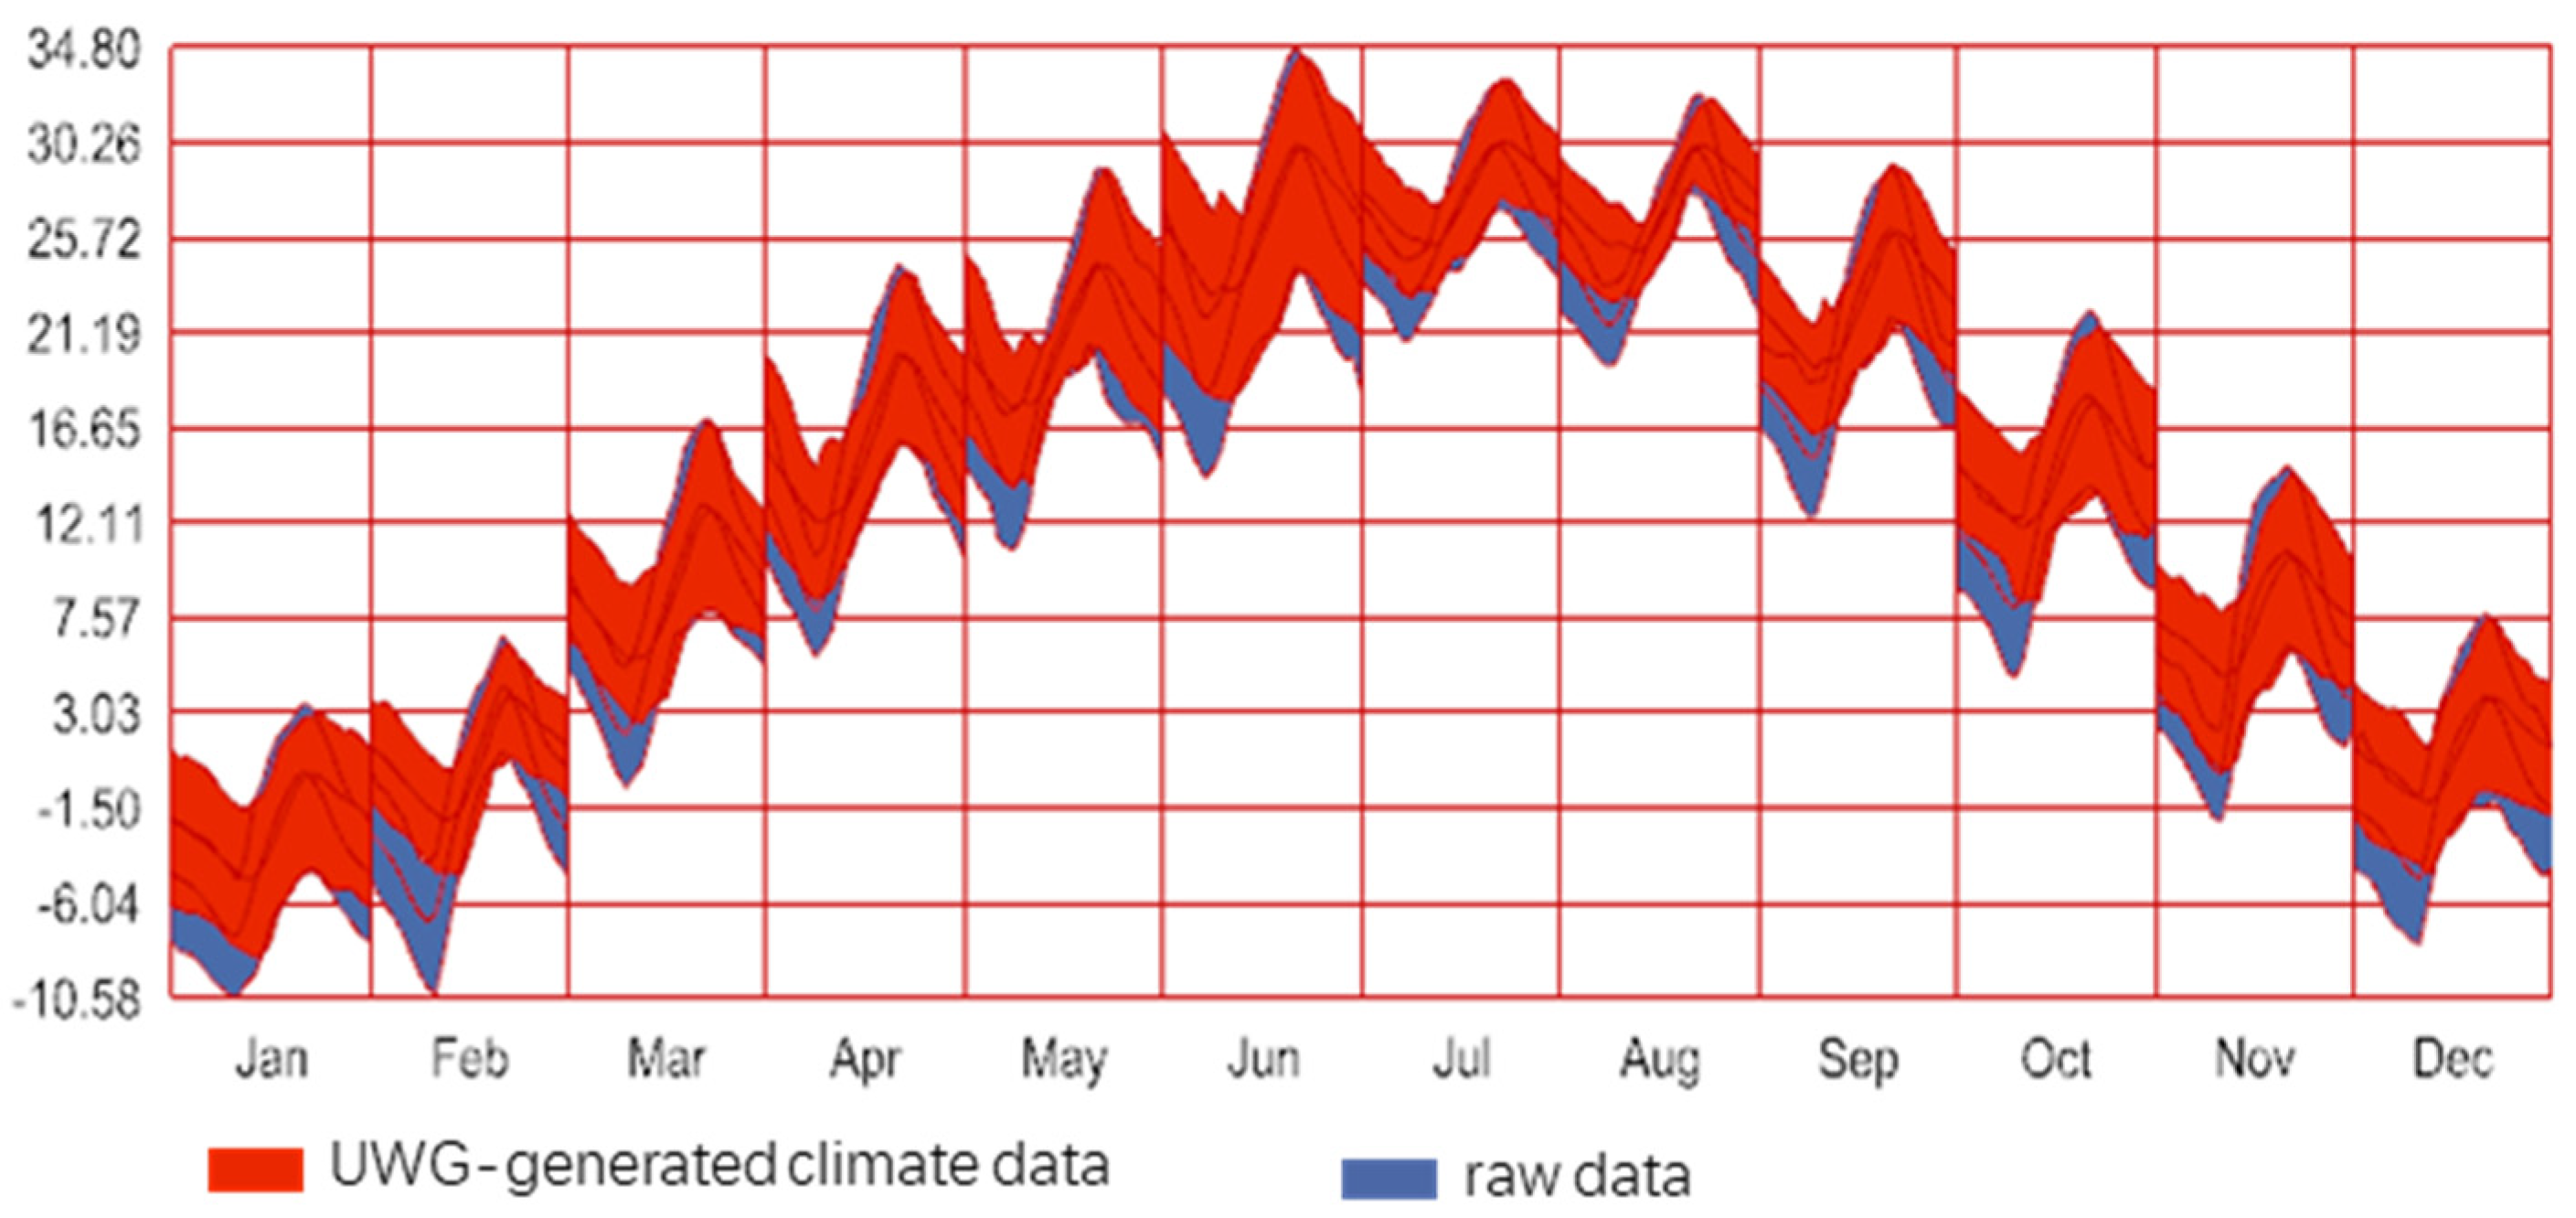
The UWG primarily considers the influence of urban heat islands on the surrounding environment of buildings, particularly the ambient temperature. In the context mentioned, the red color represents the climate data generated by UWG, while the blue color represents the original climate monitoring data. The original meteorological files show lower temperatures compared to the UWG-generated temperatures, indicating that buildings can potentially save heating energy during the heating season, but may require more cooling energy during the cooling season (Figure 8).
The mutual occlusion between buildings has the opposite effect on building energy consumption. The mutual shading between buildings reduces the level of daylighting, leading to an increase in heating load and a decrease in cooling energy consumption. This mechanism has the opposite effect to that of the urban heat island effect. In this section, a pairwise comparison analysis was employed to investigate how the urban heat island effect and occlusion effect affect building energy efficiency. Four simulation scenarios were set up: Scenario 1 used original weather data, without considering the occlusion effect or heat island effect, assuming isolated buildings; Scenario 2 used original weather data and accounted for the occlusion effect; Scenario 3 applied UWG data without considering the occlusion effect, focusing solely on how the urban heat island effect influenced building energy efficiency; Scenario 4 applied UWG data and considered the occlusion effect, representing a complete building cluster scenario that considered both the urban heat island effect and occlusion effect (Figure 9).
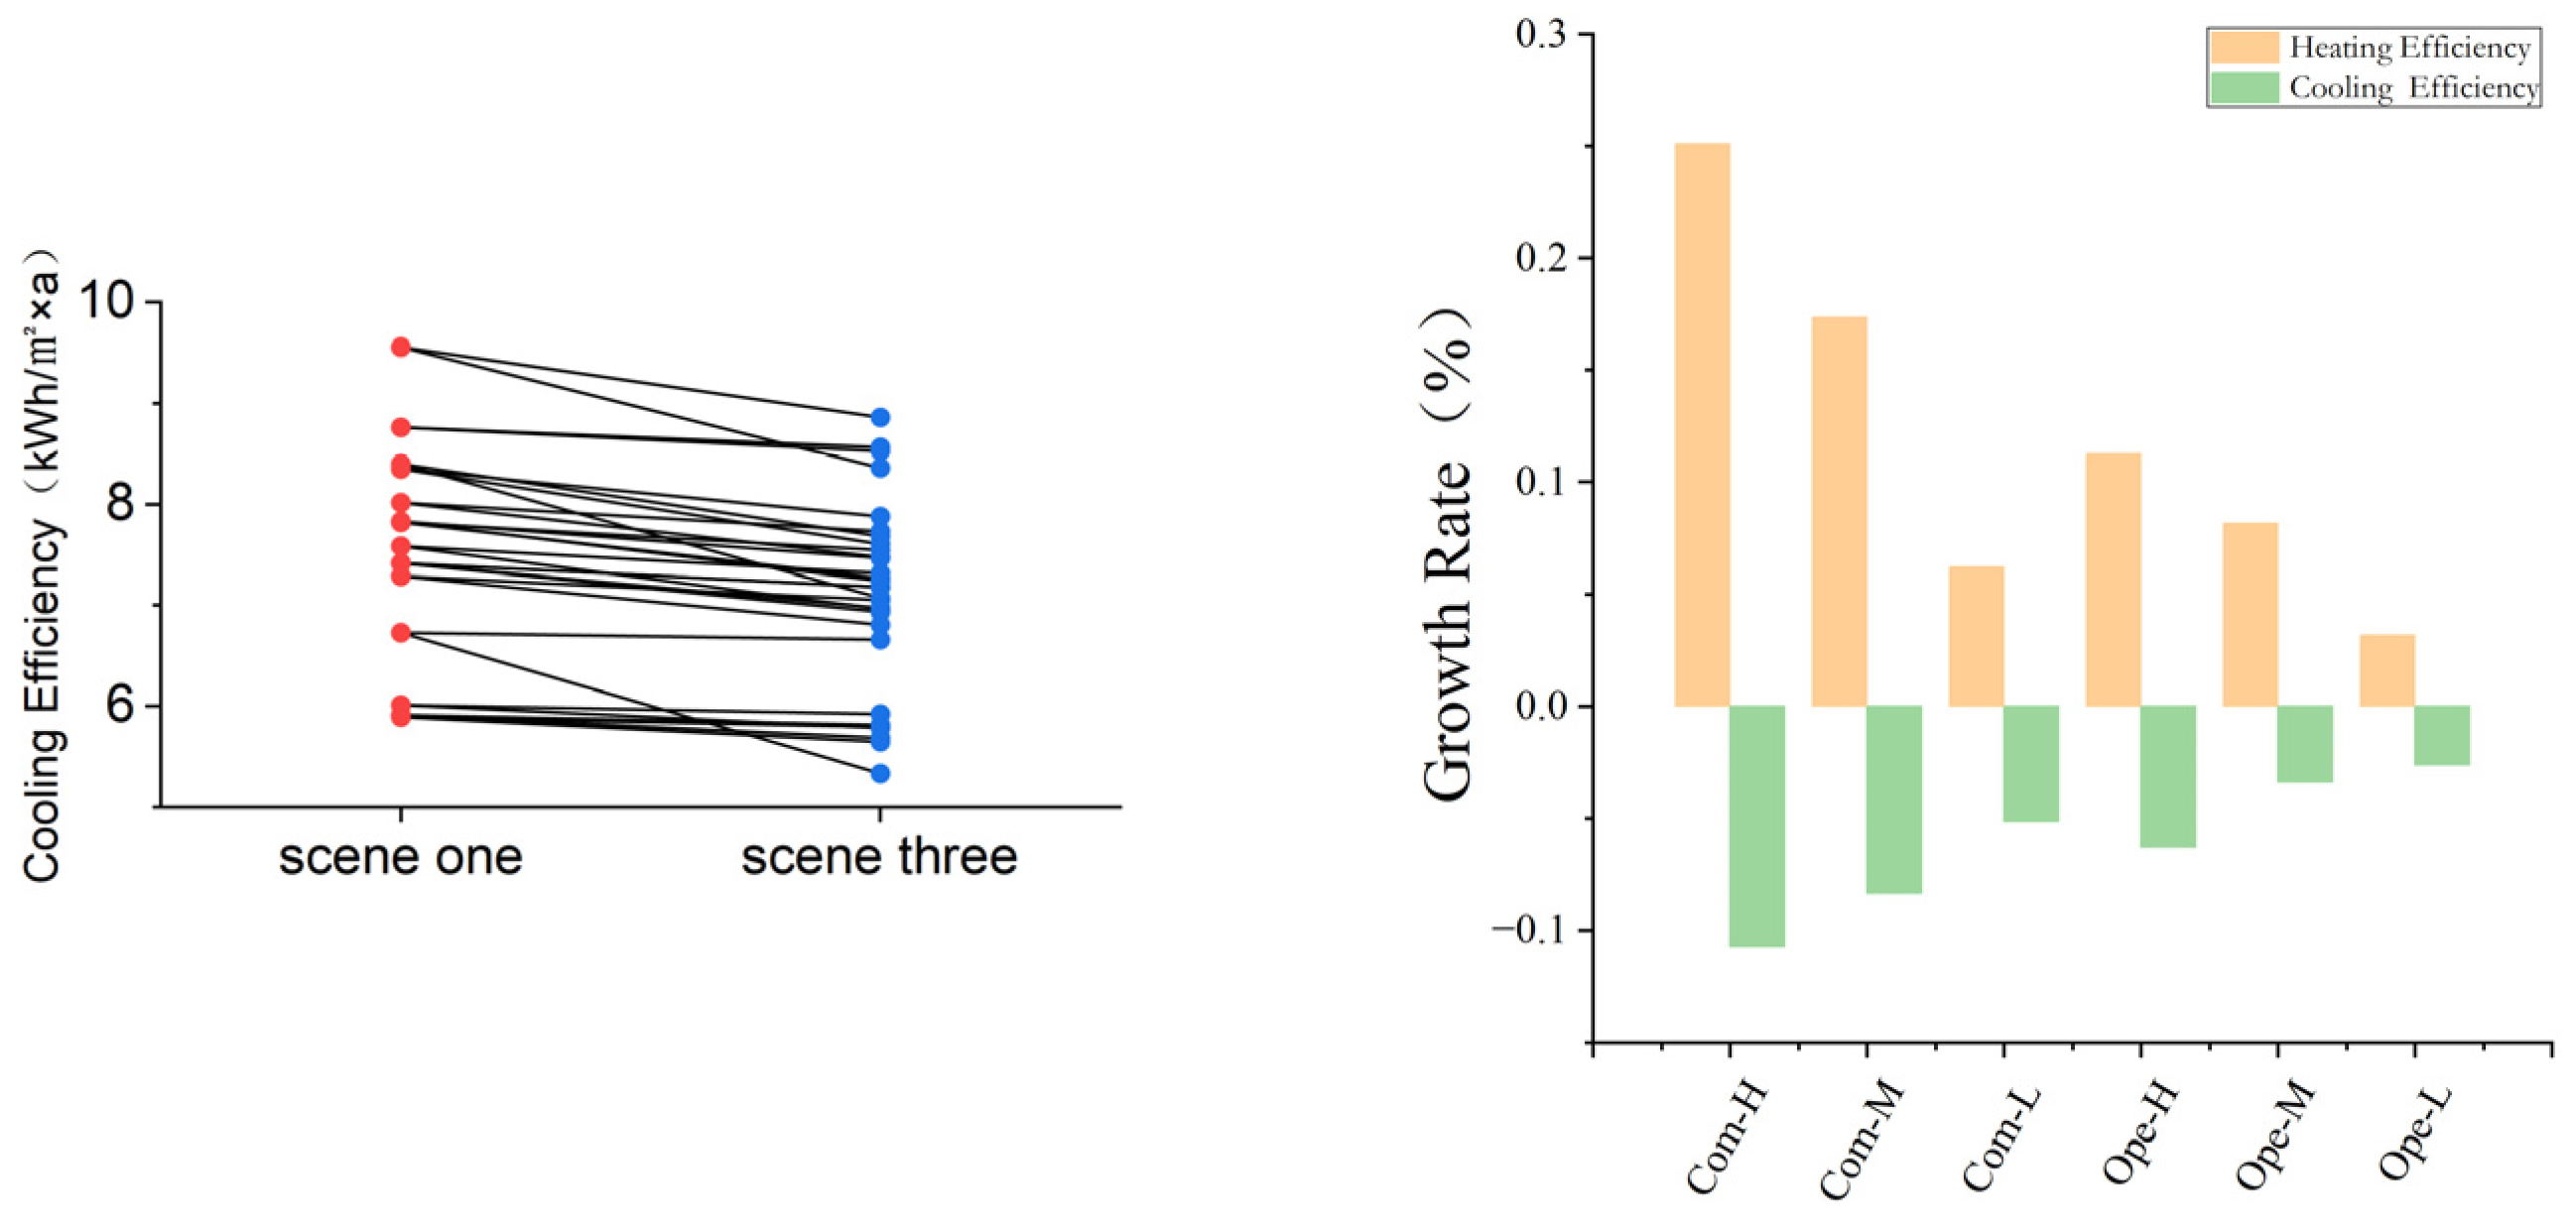
The impact of the urban heat island effect on building energy efficiency was analyzed by comparing Scenario 1 (without considering the occlusion effect) and Scenario 3 (considering the urban heat island effect). The results revealed that the urban heat island effect had different effects on the heating and cooling efficiency of the building clusters. Compared to Scenario 1, Scenario 3 showed a significant decrease in heating efficiency and a significant increase in cooling efficiency. This study showed that the urban heat island effect resulted in an average decrease of 15.80% in heating efficiency and an average increase of 30.85% in cooling efficiency. This demonstrated a significant influence of the urban heat island effect on building energy consumption. By analyzing the impact of the urban heat island effect on different types of building clusters, it was observed that the influence of the urban heat island effect on energy efficiency varied only slightly among different building cluster types. However, compact building clusters exhibited a more pronounced urban heat island effect compared to open building clusters (Figure 10).
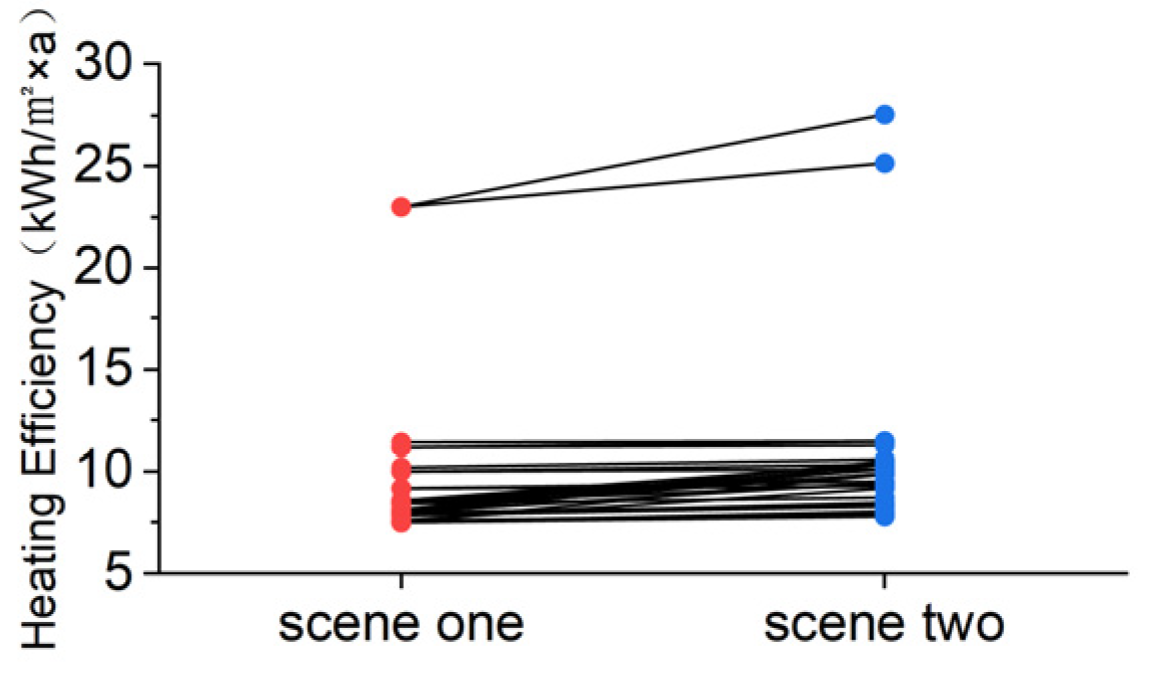
Without considering the urban heat island effect, an analysis was conducted to examine the influence of mutual occlusion among different types of building clusters on heating and cooling energy consumption. The comparison between Scenario 1 and Scenario 2 revealed that the occlusion effect led to an increase or no significant change in heating energy consumption, while cooling energy consumption decreased. In this study, considering mutual occlusion among buildings resulted in an average increase of 11.88% in heating energy consumption and an average decrease of 5.87% in cooling energy consumption. The variations between different building clusters were evident, with heating energy consumption increasing by approximately 25% at most and cooling energy consumption decreasing by around 10% at most. Additionally, the occlusion effect was more prominent in compact building clusters than open building clusters, and high-rise building clusters were more affected than low-rise building clusters (Figure 11).

3.3.2. Comparison of Energy Efficiency Levels

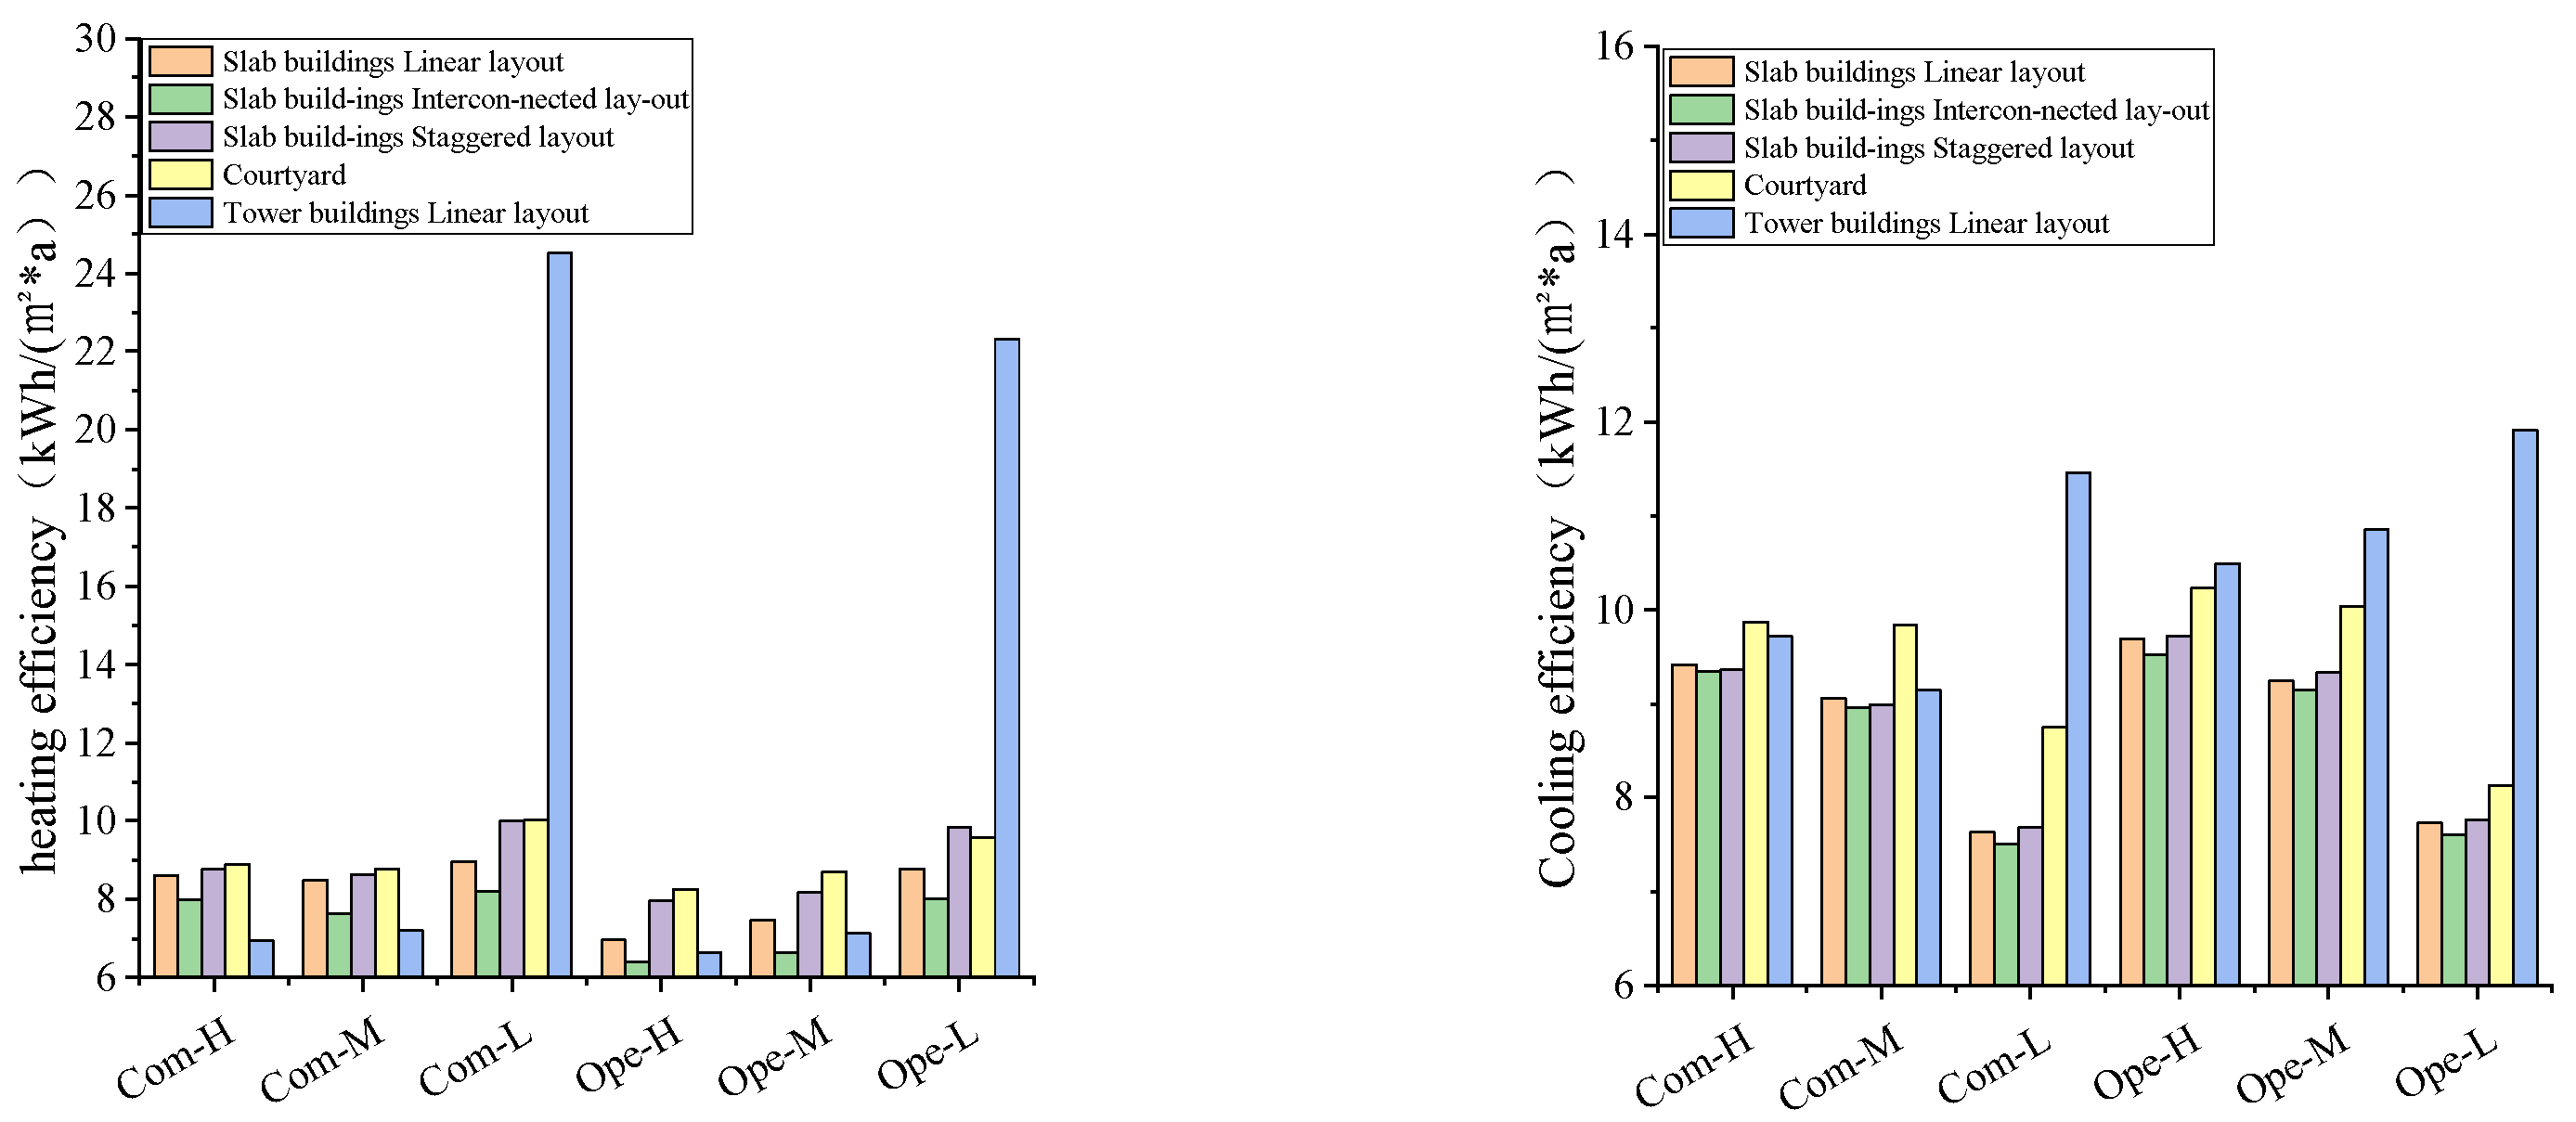
Based on the analysis in Section 3.3.1, this section examines the differences in heating and cooling loads among different building clusters in Scenario 4 (considering both the urban heat island effect and the occlusion effect). According to the simulated data on building heating energy consumption, compact building clusters have higher heating energy consumption compared to open building clusters. This trend contradicts the influence of the urban heat island effect on building heating energy consumption, but aligns with the impact of the occlusion effect. It indicates that, in this case, the occlusion effect is more significant than the urban heat island effect. This suggests that the variation in the urban heat island effect among different building clusters is smaller than the occlusion effect. Therefore, optimizing the spatial layout of buildings and reducing adjacent shading can have a greater impact on improving building energy efficiency compared to measures aimed at mitigating the urban heat island effect. Furthermore, the trend of building cooling energy consumption shows an opposite pattern to the impact of the urban heat island effect on building energy consumption. Specifically, compact building clusters are more affected by the urban heat island effect compared to open building clusters. The more pronounced the urban heat island effect, the higher the building cooling energy consumption. In contrast, open building clusters experience a lesser degree of mutual occlusion between buildings, allowing for ample daylighting, but this leads to increased building cooling energy consumption. In addition, low-rise building clusters exhibit significantly higher heating energy consumption compared to other building cluster types. This can be attributed to their larger building shape coefficient, resulting in a substantial increase in heating energy consumption levels (Figure 12 and Figure 13).
At the same time, the spatial distribution pattern of buildings can also influence building energy consumption to a certain extent. In terms of heating energy consumption, compared to the slab block-linear form as the benchmark building cluster, the heating energy consumption was significantly lower in the slab block-interconnected cluster. This indicates an impact of building form on heating energy consumption. However, the heating energy consumption in the slab block-staggered cluster did not decrease as expected; instead, it increased, suggesting that optimizing the building cluster layout does not lead to significant results. In addition to optimizing the layout according to the daylighting factor, other influencing factors need to be taken into account, as well. The courtyard-style layout showed relatively higher heating energy consumption. Within a certain range, tower buildings exhibited lower heating energy consumption, which is likely related to the building form factor. In terms of building cooling energy consumption, when the slab block-linear cluster was used as the benchmark, the cooling energy consumption was slightly lower in the slab block-interconnected cluster. This again highlighted the impact of the building form factor on energy consumption. The cooling energy consumption in the slab block-staggered cluster was slightly higher, indicating that this type of cluster had a certain influence on optimizing building daylighting. The courtyard clusters exhibited significantly higher cooling energy consumption compared to the linear clusters. This was due to a considerable amount of buildings having east–west oriented daylighting, commonly referred to as “west-facing” housing, resulting in a significant increase in cooling energy consumption. Tower building clusters showed higher cooling energy consumption compared to the benchmark cluster, and this effect was more pronounced in open building clusters. This was because they also had housing units with east–west oriented daylighting, which affected the level of cooling energy consumption.

3.3.3. Correlation Analysis

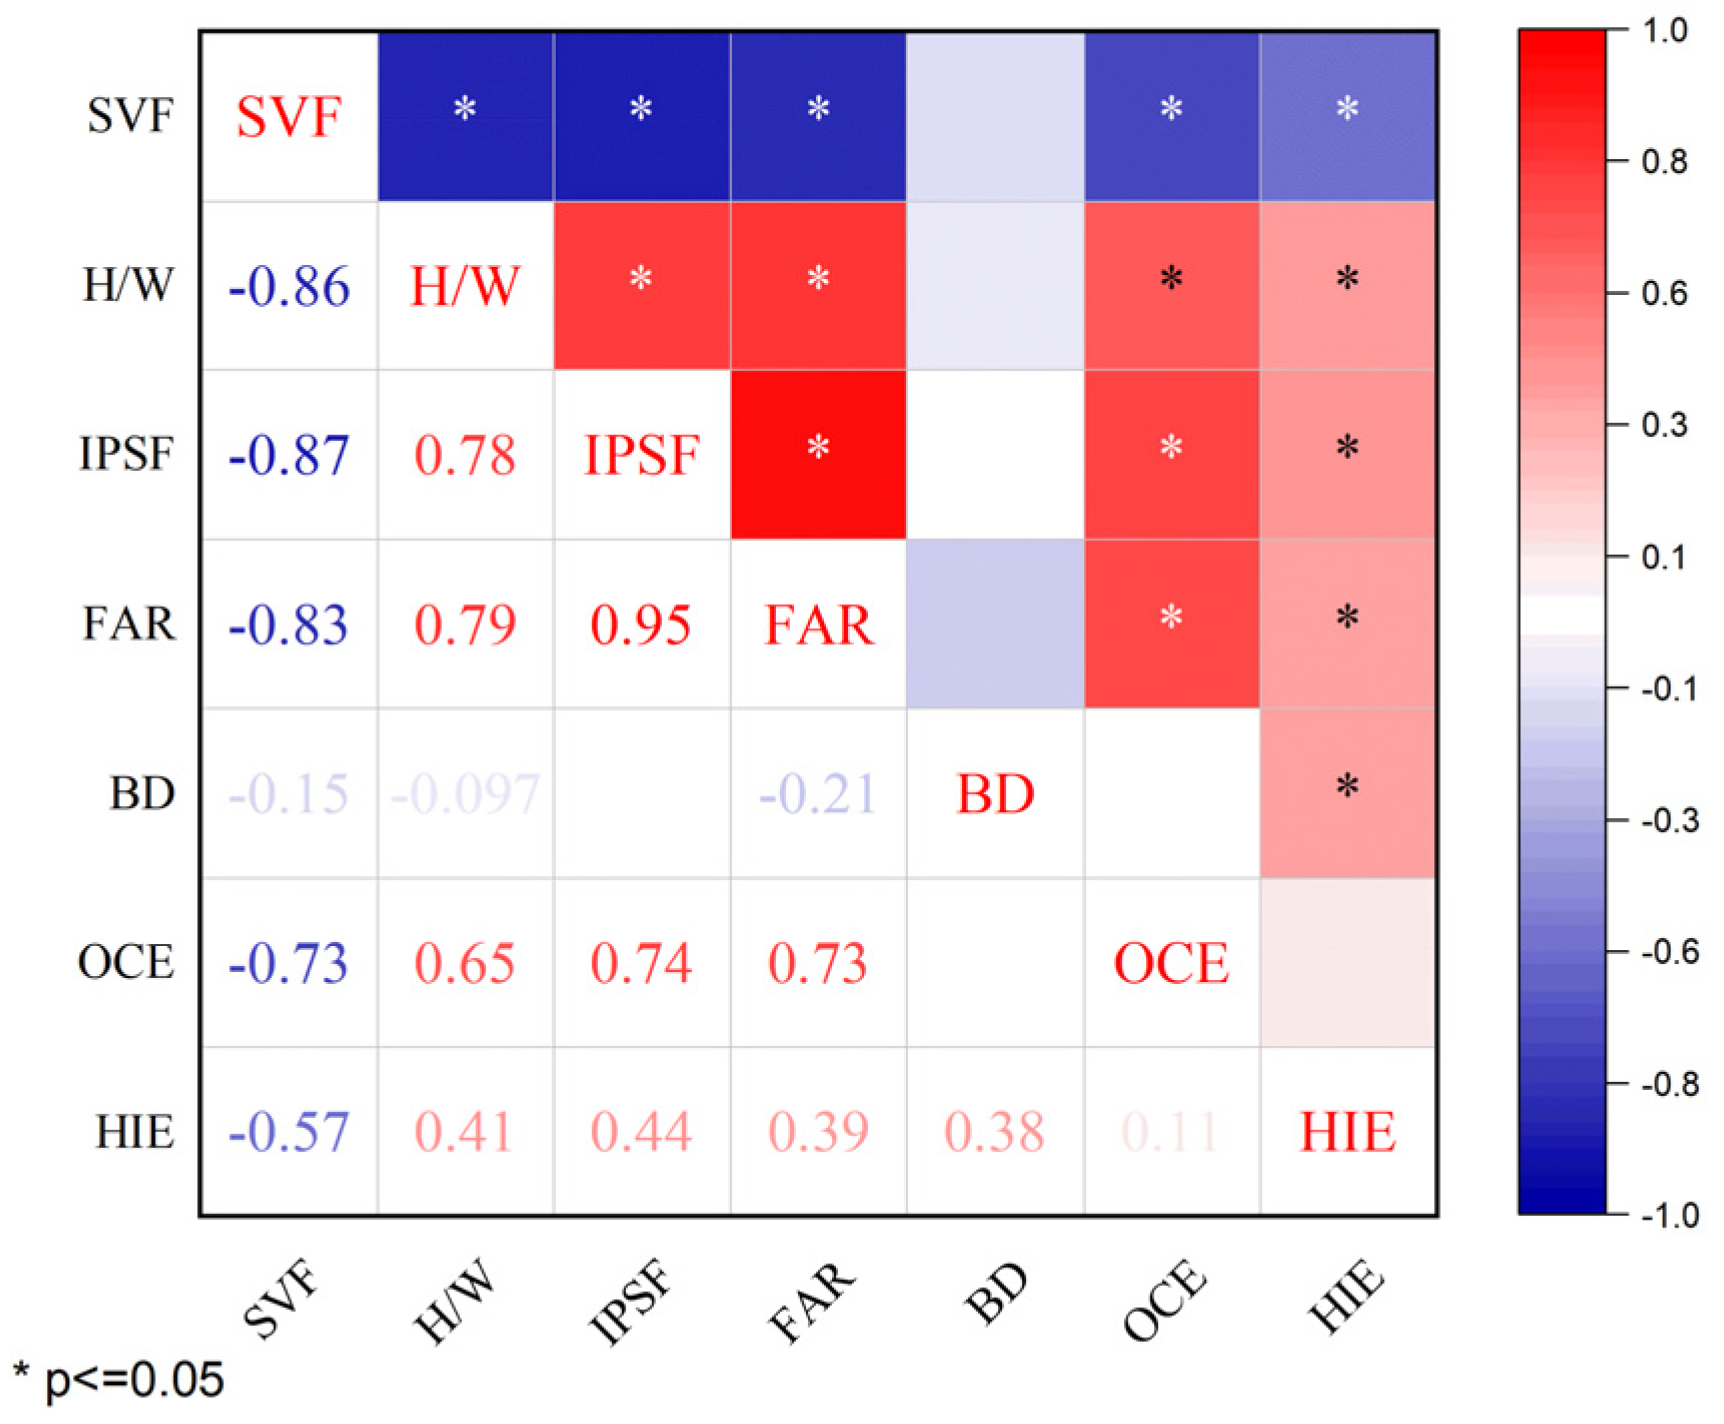
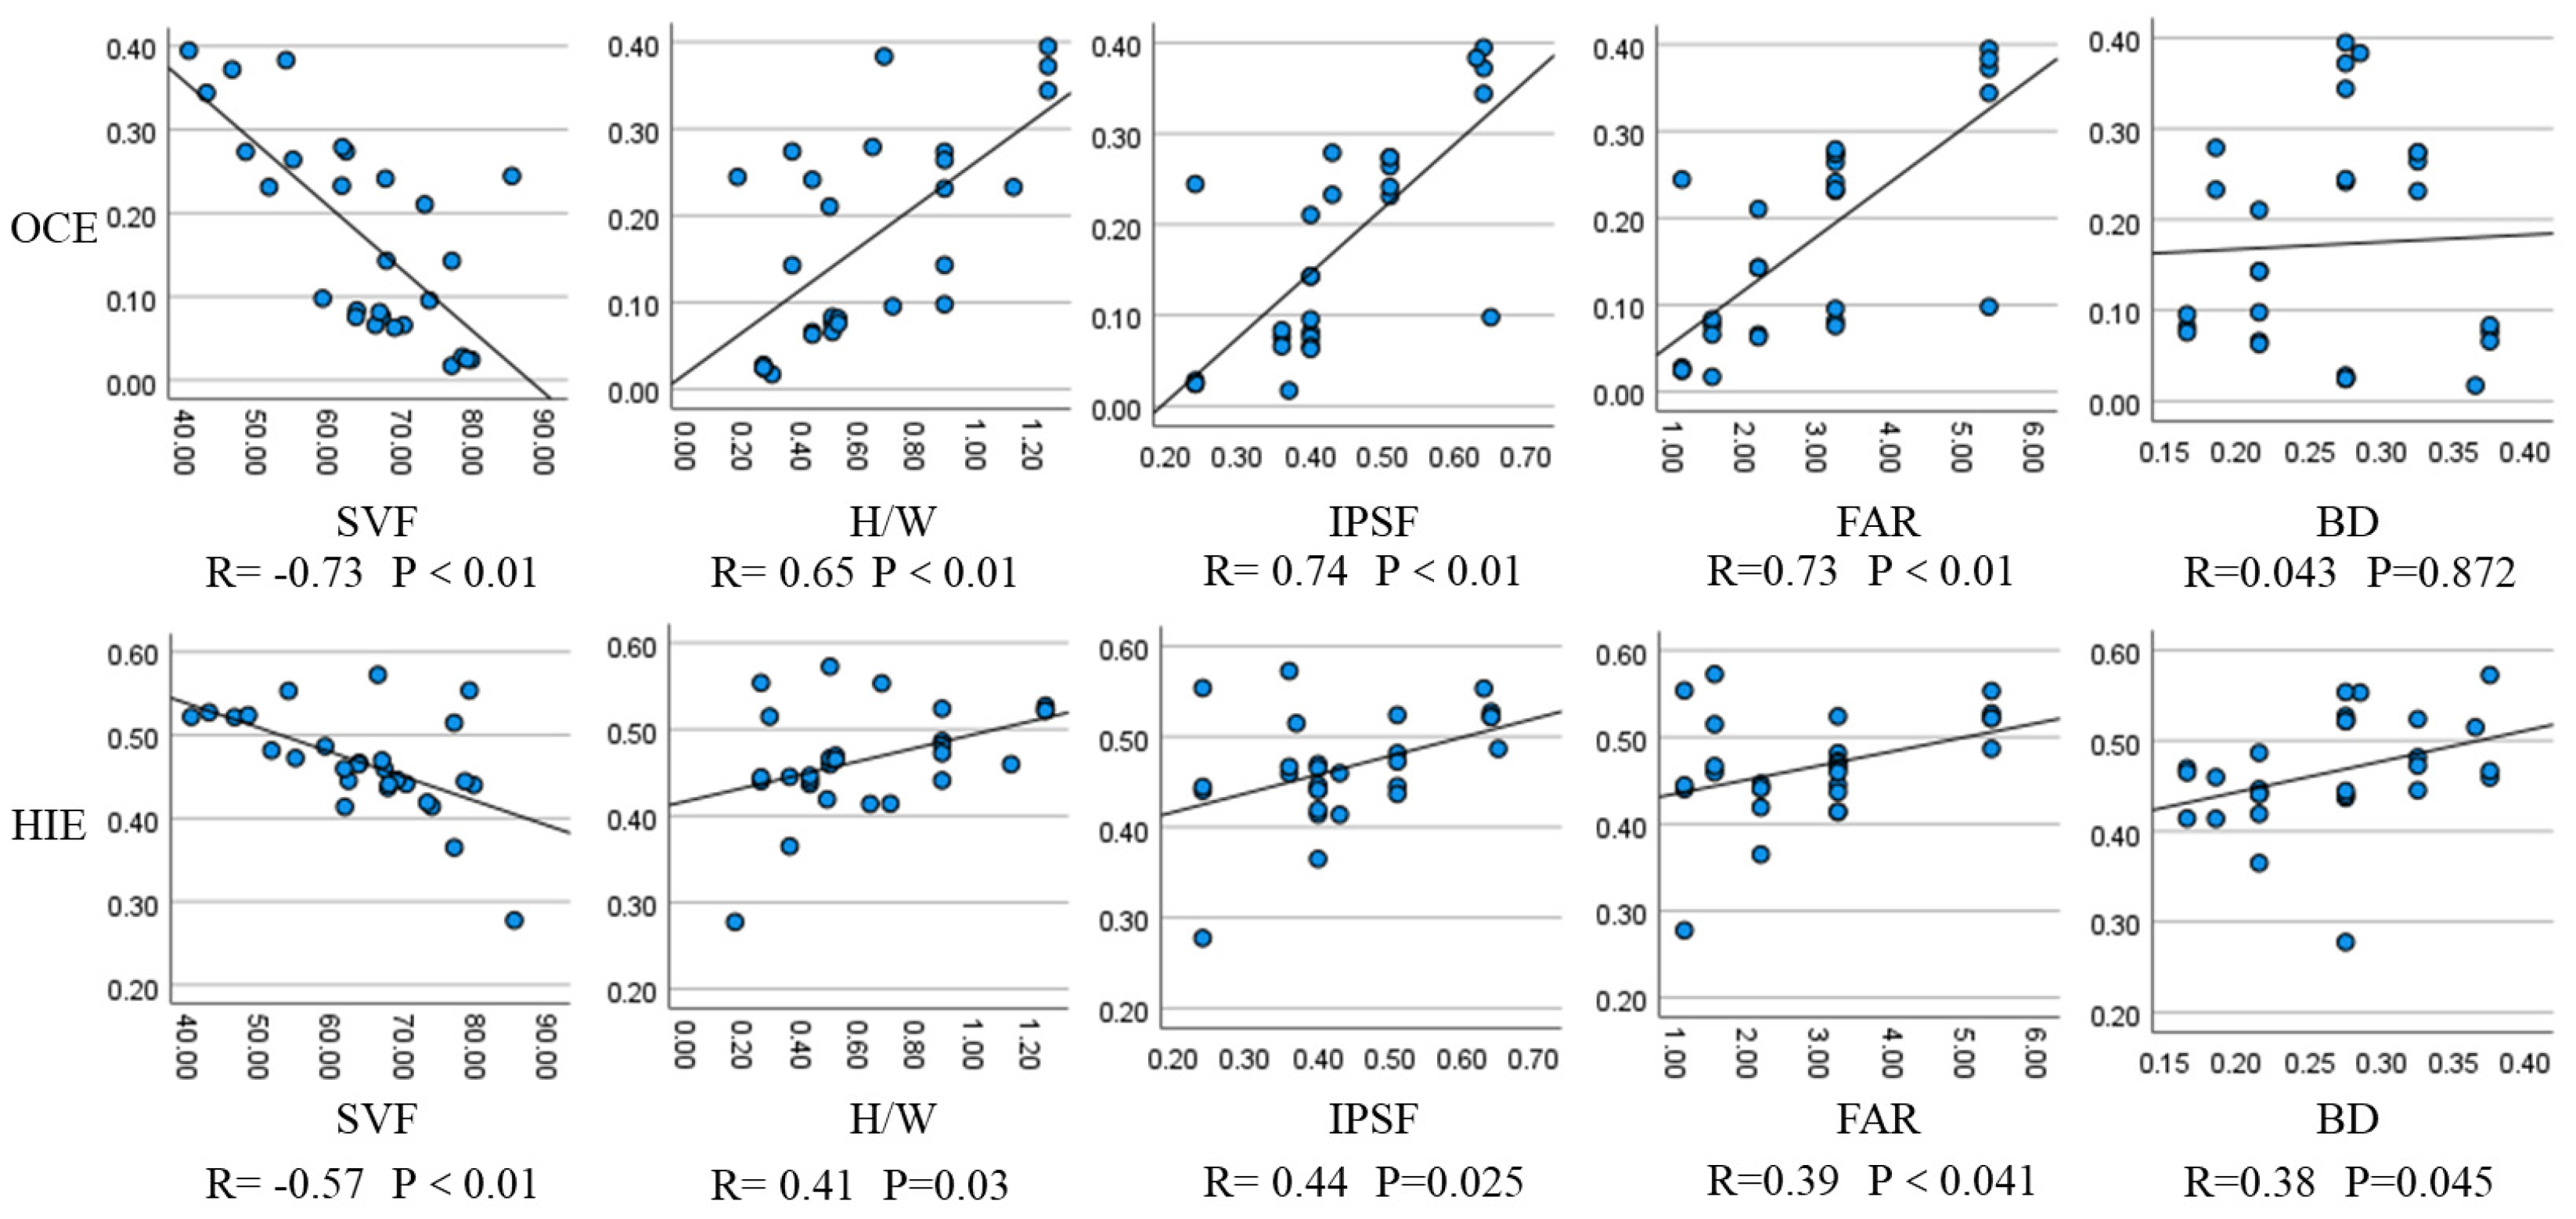
To better understand the impact of the urban heat island effect and mutual occlusion between buildings on energy consumption, a correlation analysis was applied to examine the relationships among different building cluster parameters, the urban heat island effect, and the occlusion factor. Five building cluster parameters were selected: Sky View Factor (SVF), Canyon Height to Canyon Width (H/W), Impervious Surface Area Ratio (IPSF), Floor Area Ratio (FAR), and Building Density (BD). The quantified indicators for the urban heat island effect and occlusion effect were the changes in heating and cooling energy consumption rates between Scenario 2 and Scenario 1 and between Scenario 3 and Scenario 1, respectively. In Scenario 2, only the occlusion effect was considered, without considering the urban heat island effect. In Scenario 3, only the urban heat island effect was considered, without considering the occlusion effect. To enhance the significance of the results, the sum of the energy consumption and cooling energy consumption rate changes was used as the quantitative measure of the impact of the urban heat island effect and the occlusion effect. The correlation analysis results are as follows.
Based on the correlation analysis results, the SVF exhibited a significant negative correlation with the urban heat island effect and occlusion effect. This indicated that a larger SVF represented an easier cooling of the urban canyon, as the sky could absorb the heat from buildings. Conversely, a lower SVF allowed the urban canyon to retain more heat during the day and release more heat at night, thus counteracting the urban heat island effect. Moreover, a higher SVF also indicated lower interaction between buildings. The H/W and FAR showed a positive correlation with the urban heat island effect and occlusion between buildings. This meant that as the H/W ratio and FAR increased, the urban heat island effect and mutual occlusion became more pronounced. Additionally, there was a positive correlation between the IPSF and the urban heat island effect. However, the BD indicator did not exhibit a significant correlation with occlusion, and it displayed a weak correlation with the urban heat island effect. This suggested that the sole consideration of building density was not sufficient to effectively reflect the characteristics of different building cluster forms (Figure 14).

4. Discussion

4.1. Ground Source Heat Pump System and Building Energy Consumption

Based on the analysis of renewable energy application and energy consumption simulations in buildings, the self-sufficiency rates of different building cluster prototypes with renewable energy sources were examined. This involved analyzing the relationship between the renewable energy supply and building energy demand for each building cluster prototype. Specifically, for the ground source heat pump system, the relationship between energy supply and heating/cooling loads was investigated. The study considered the number of hours during which the ground source heat pump system’s heating/cooling supply fell short of the building’s demand, as well as the actual heating/cooling capacity provided by the heat pump system. The results are shown in the figure. In scenarios with low utilization of geothermal resources, it was challenging to meet the heating demand of compact building clusters. For compact high-rise building clusters, the number of hours with a heating supply below demand exceeded 1000 h, accounting for 40% of the heating season. For compact mid-rise building clusters, the percentage of hours with an insufficient heating supply was 10%. In compact low-rise building clusters, villa-type buildings had higher heating energy consumption, and the high building density limited the application of shallow geothermal resources. In scenarios with low utilization, the percentage of hours with unmet heating demand accounted for 20% of the heating season. In addition, for open-type building clusters in scenarios of moderate and high utilization of shallow geothermal energy, as well as in scenarios of low utilization, shallow geothermal energy was effectively able to meet the heating demand of the building clusters (Figure 15).
Compared to heating demand, meeting the cooling demand in buildings is more challenging. In scenarios with low utilization, neither compact high-rise, nor mid-rise building clusters, nor open-type mid-rise building clusters were able to meet the cooling demand of the buildings. On average, the cooling demand exceeded the supply by 45.65%, 20.88%, and 12.91% of the total hours, respectively. Among them, compact high-rise courtyard-style buildings had a higher cooling demand, with approximately 50% of the cooling hours remaining unmet. Furthermore, in scenarios with moderate utilization, compact high-rise building clusters still experienced approximately 5.88% of the time where the heat pump system could not meet the cooling demand.
From a horizontal perspective, among buildings within the same local climate zone, there are differences in the performance of ground source heat pump systems due to variations in building cluster types. For example, due to lower heating energy consumption in tower-type building clusters, the number of hours where the heat pump system falls short of meeting the heating demand is significantly reduced compared to other building clusters. In fact, the shortfall is only about half of what is observed in other building clusters. On the other hand, courtyard-style building clusters have higher cooling demands, and the number of hours where the cooling demand is not met is significantly higher compared to other building clusters with a similar climate zone (Table 8).
The supply–demand ratio represents the ratio of actual heating and cooling supplied by the ground source heat pump system to a building. According to the data in the table, the ground source heat pump system is more capable of meeting the building’s heating demand. Except for the low utilization scenario where the supply–demand ratio for compact high-rise building clusters is relatively low, in other scenarios and building cluster types, the heating demand is generally met. In contrast, the cooling demand for buildings presents a more prominent challenge. In the low utilization scenario, the ground source heat pump system can only meet 67% of the cooling demand for compact high-rise building clusters, and the supply–demand ratio for compact mid-rise building clusters is only 0.87, which falls short of the design requirements. Additionally, in the medium utilization scenario, the cooling demand for compact high-rise building clusters still cannot be fully satisfied. When comparing different types of building clusters, in the low utilization scenario, open-type building clusters have a higher supply–demand ratio compared to compact-type building clusters, and high-rise building clusters have a higher supply–demand ratio compared to low-rise building clusters. This is because open-type building clusters have lower building density, which is conducive to the installation and application of ground pipes, and low-rise building clusters have lower overall energy demands, making them easier to meet.

4.2. Solar Photovoltaic Power Generation and Building Energy Consumption

4.2.1. Penetration Rate

The penetration rate is a common metric used for assessing solar photovoltaic power generation, and it can be further divided into the capacity penetration rate and energy penetration rate [33].
Capacity penetration rate: the percentage of the maximum hourly energy yield of distributed PV power sources throughout the year and the maximum hourly electricity demand of the system throughout the year.
Energy penetration rate: the percentage of electricity provided by distributed PV power sources throughout the year to the total annual electricity consumption of the system.
λ p v s = m a x S p v m a x P l o a d × 100 %
λ p v e = S p v P l o a d × 100 %
  • λ p v s —Capacity penetration rate;
  • λ p v e —Energy penetration rate;
  • S p v —The hourly energy yield of PV power systems;
  • P l o a d —Electricity consumption per hour.
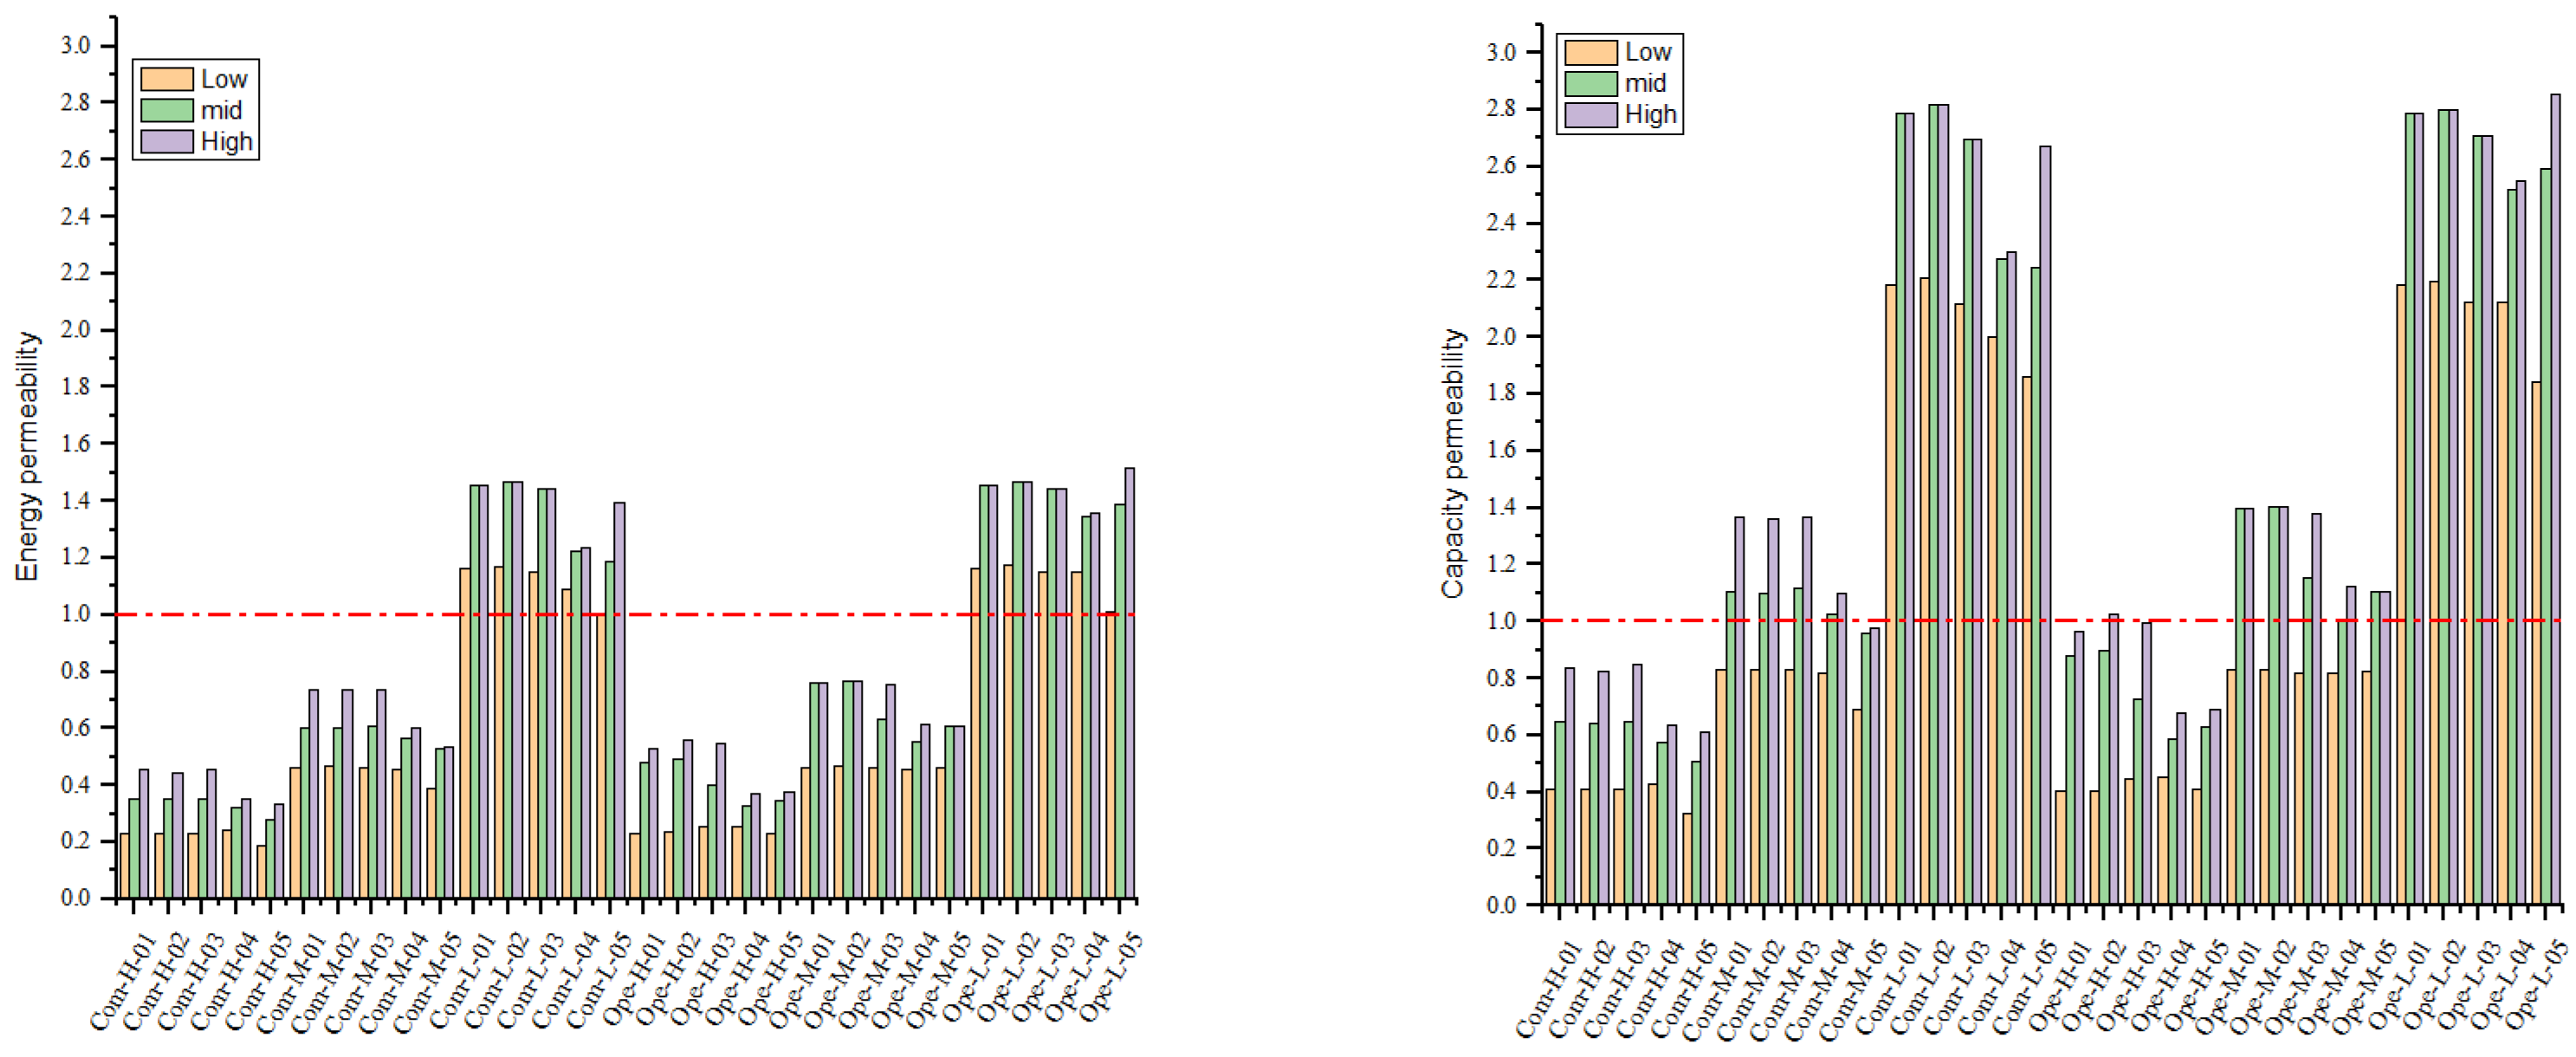
Based on the analysis of solar photovoltaic potential and building energy simulation results, the capacity and energy penetration rates are calculated as follows (Figure 16):
The capacity penetration rate of building clusters was analyzed, revealing no significant difference between compact and open building clusters. The capacity penetration rate for high-rise building clusters was below 1, indicating that the maximum hourly photovoltaic electricity generation was less than the maximum hourly consumption. In medium-rise building clusters, the capacity penetration rate was generally above 1, reaching a maximum of 1.4, meaning that the maximum hourly electricity generation was 1.4 times the maximum hourly electricity consumption. Low-rise building clusters exhibited higher penetration rates, with capacity penetration rates ranging from 2 to a maximum of 2.8. Energy penetration refers to the percentage of electricity provided by distributed photovoltaic sources to the total annual electricity consumption. It serves as an important indicator for analyzing the utilization of distributed solar photovoltaics. According to Figure 2, the energy penetration rate of solar photovoltaic utilization in building clusters showed significant variations based on the climate zone, while relatively minor differences existed among building clusters within the same climate zone (Table 9).
Based on the simulated data, it can be observed from the table that in the low utilization scenario of installing PV systems on the roof area, building clusters of the same height exhibited similar energy penetration rates. Specifically, LCZ1 and LCZ4 were similar, LCZ2 and LCZ5 were similar, and LCZ3 and LCZ6 were similar. However, when incorporating solar PV modules on building façades, building clusters of the same height showed some variations in energy penetration rates. In medium-high scenarios, the energy penetration rate of compact high-rise building clusters increased by 50.0% and 86.4%, while open high-rise building clusters increased by 70.8% and 100% compared to the low utilization scenario. This demonstrates the impact of mutual shading between buildings on the application of solar PV modules on building façades. In different utilization scenarios, the energy penetration rate for low-rise building clusters was consistently above 1, indicating that the annual electricity generation from the solar PV system exceeded the total annual electricity consumption of the building clusters. The energy penetration rates for medium-rise and high-rise building clusters were below 1, with the highest penetration rate observed in open low-rise building clusters under a high utilization scenario, averaging at 1.45, and the lowest penetration rate in compact high-rise building clusters under a low utilization scenario, averaging at 0.22. Additionally, there were certain differences in solar penetration rates among building clusters in the same climate zone. For example, the capacity penetration rate for tower building types was slightly lower than that of the same type of slab building clusters.

4.2.2. Consumption Rate

Solar PV power consumption refers to the utilization of solar PV electricity for various purposes within a building cluster, such as lighting, heating, cooling, electrical equipment, and water heating. Unused solar PV power refers to the surplus electricity generated by the solar PV system when the generated power exceeds the building’s electricity consumption. The solar PV power consumption rate is calculated as the ratio of the consumed solar PV power to the total solar PV power generated. The consumption rate is a crucial metric for assessing the efficiency and effectiveness of a PV system, and it plays a significant role in optimizing the balance of solar PV power generation with building electricity demand. In this study, unused solar PV power and the PV power consumption rate specifically pertain to the electricity consumed by the building cluster prototypes, excluding any surplus electricity exported to the grid or transferred to other building clusters. It focuses solely on the self-consumption of solar PV power within the building cluster.
This study calculates the consumed and unconsumed power of the PV system on an hourly basis.
A R = E T S p v × 100 %
E T = min S p v , P l o a d
  • A R —Self-consumption rate of PV power systems on an hourly basis;
  • S p v —The hourly energy yield of PV power systems;
  • E T —Consumption of solar PV electricity per hour in the building cluster;
  • P l o a d —Electricity consumption per hour.
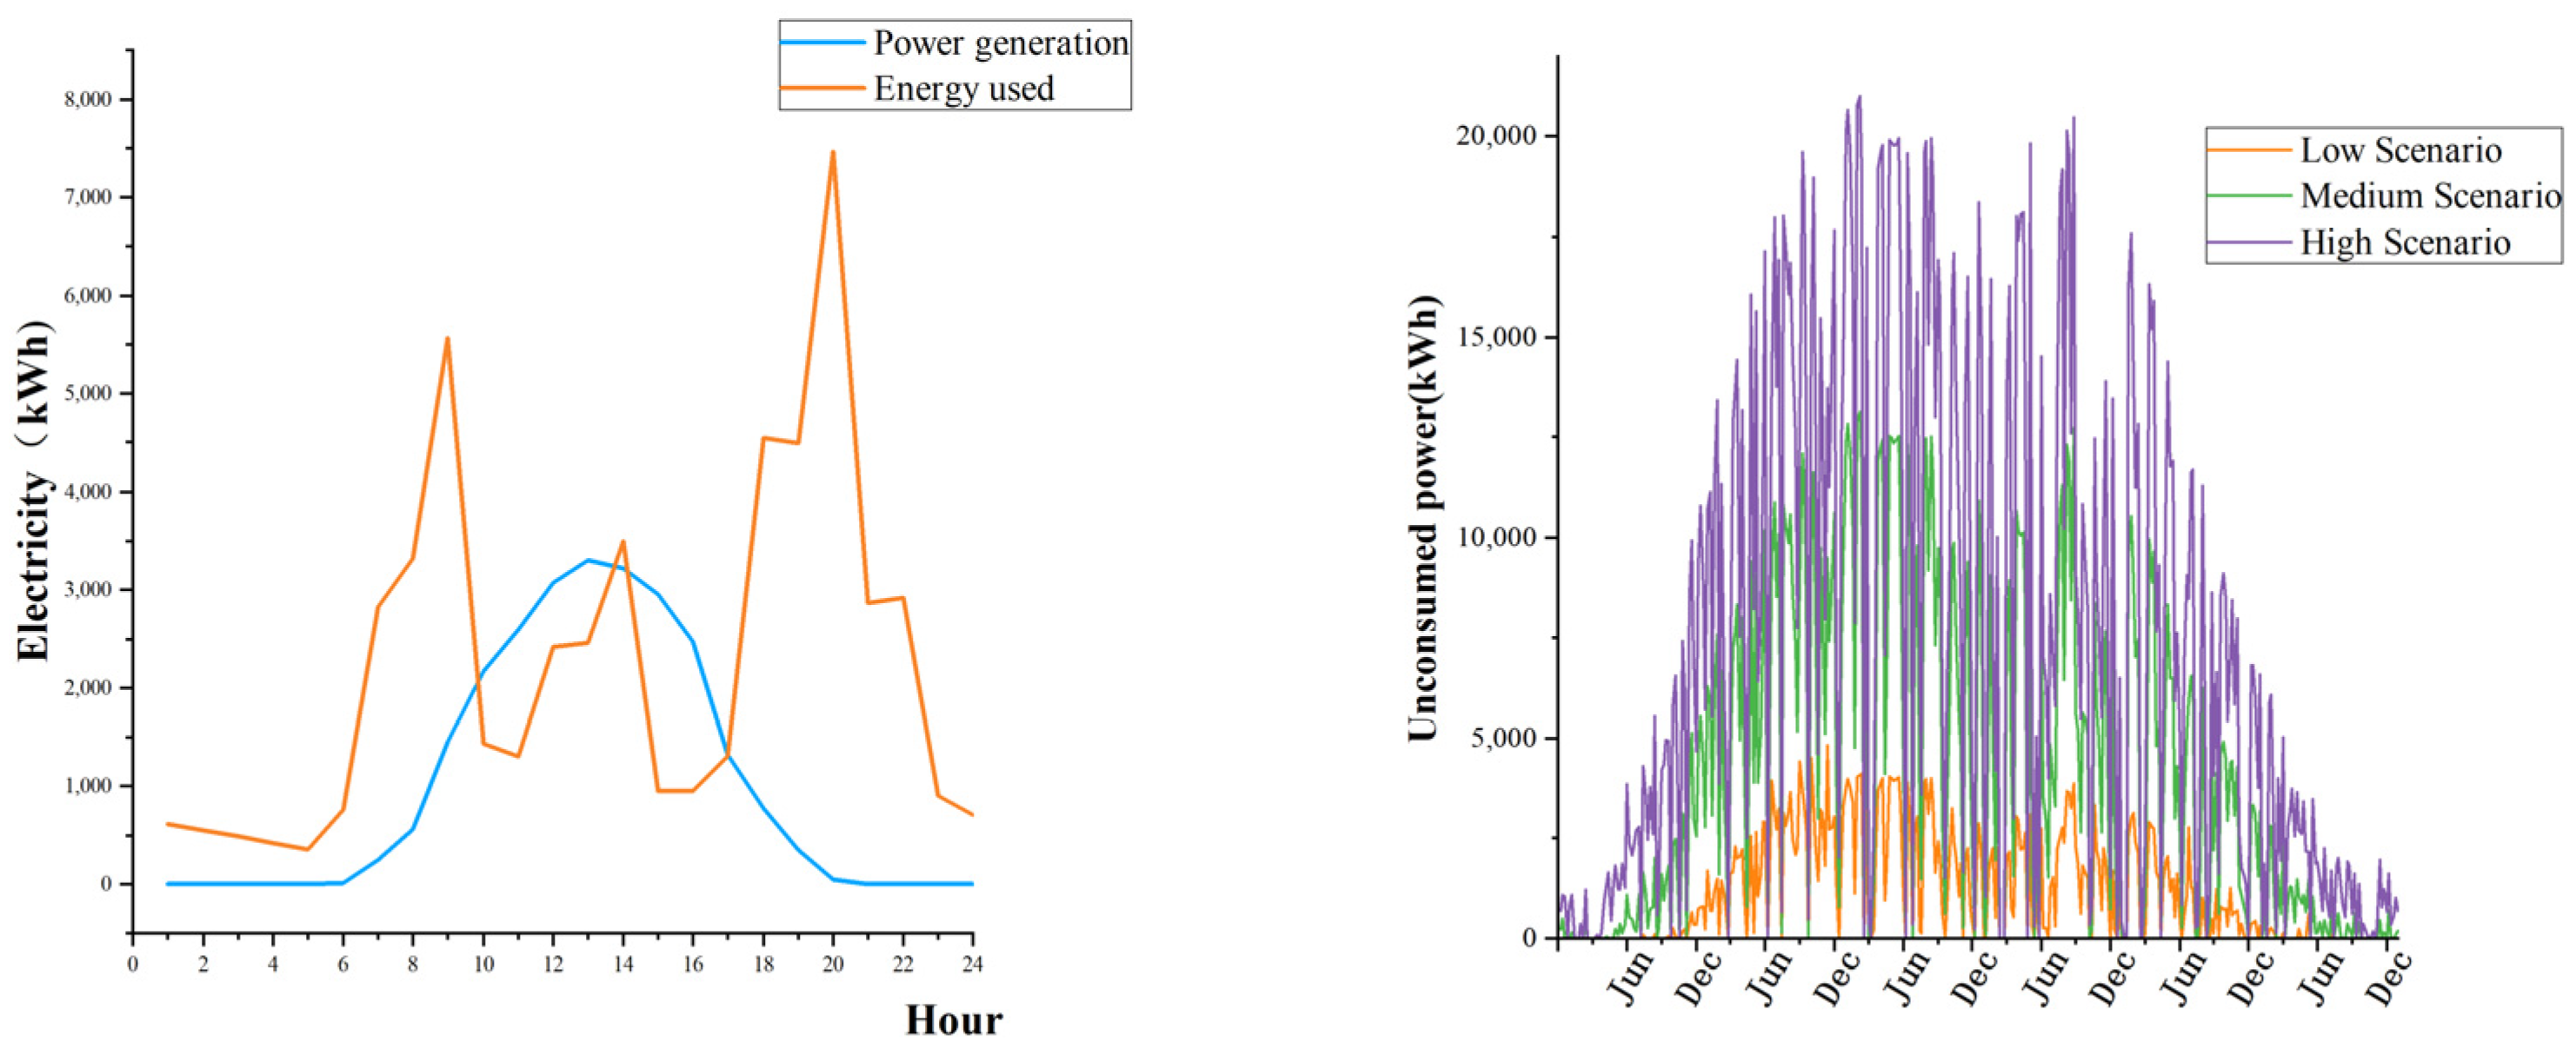
The simulation results for the daily unused solar PV power of the compact high-rise residential building cluster (Com-H-01) throughout the year were analyzed. Solar PV power generation is significantly affected by weather conditions, resulting in noticeable fluctuations in the unused solar power. Over the course of the year, the unused solar PV power exhibits a pattern of being relatively high in the middle period and lower at both ends, which is in line with the overall trend of PV power generation (Figure 17).
When examining the daily variations, significant differences and noticeable fluctuations can be observed between solar PV power generation and building electricity demand. Figure 17 illustrates the average electricity demand during different time periods in July for the compact high-rise residential building cluster (Com-H-01), as well as the average daily solar PV power generation data under high utilization conditions in July. From the figure, it can be observed that due to the fluctuation of building occupancy, there are three peaks of electricity demand during morning, midday, and evening in July for residential buildings. The highest electricity demand reaches up to 7500 kWh/h during the day, with significant differences throughout the day. On the other hand, solar PV power generation gradually increases after 6 am and reaches its peak of 3302 kWh/h at 13:00. It then gradually decreases. From the figure, it is evident that, on average in July, solar PV power generation exceeds the building electricity consumption between 10 a.m. and 5 p.m., while it is lower than the consumption during other times of the day (Figure 18).
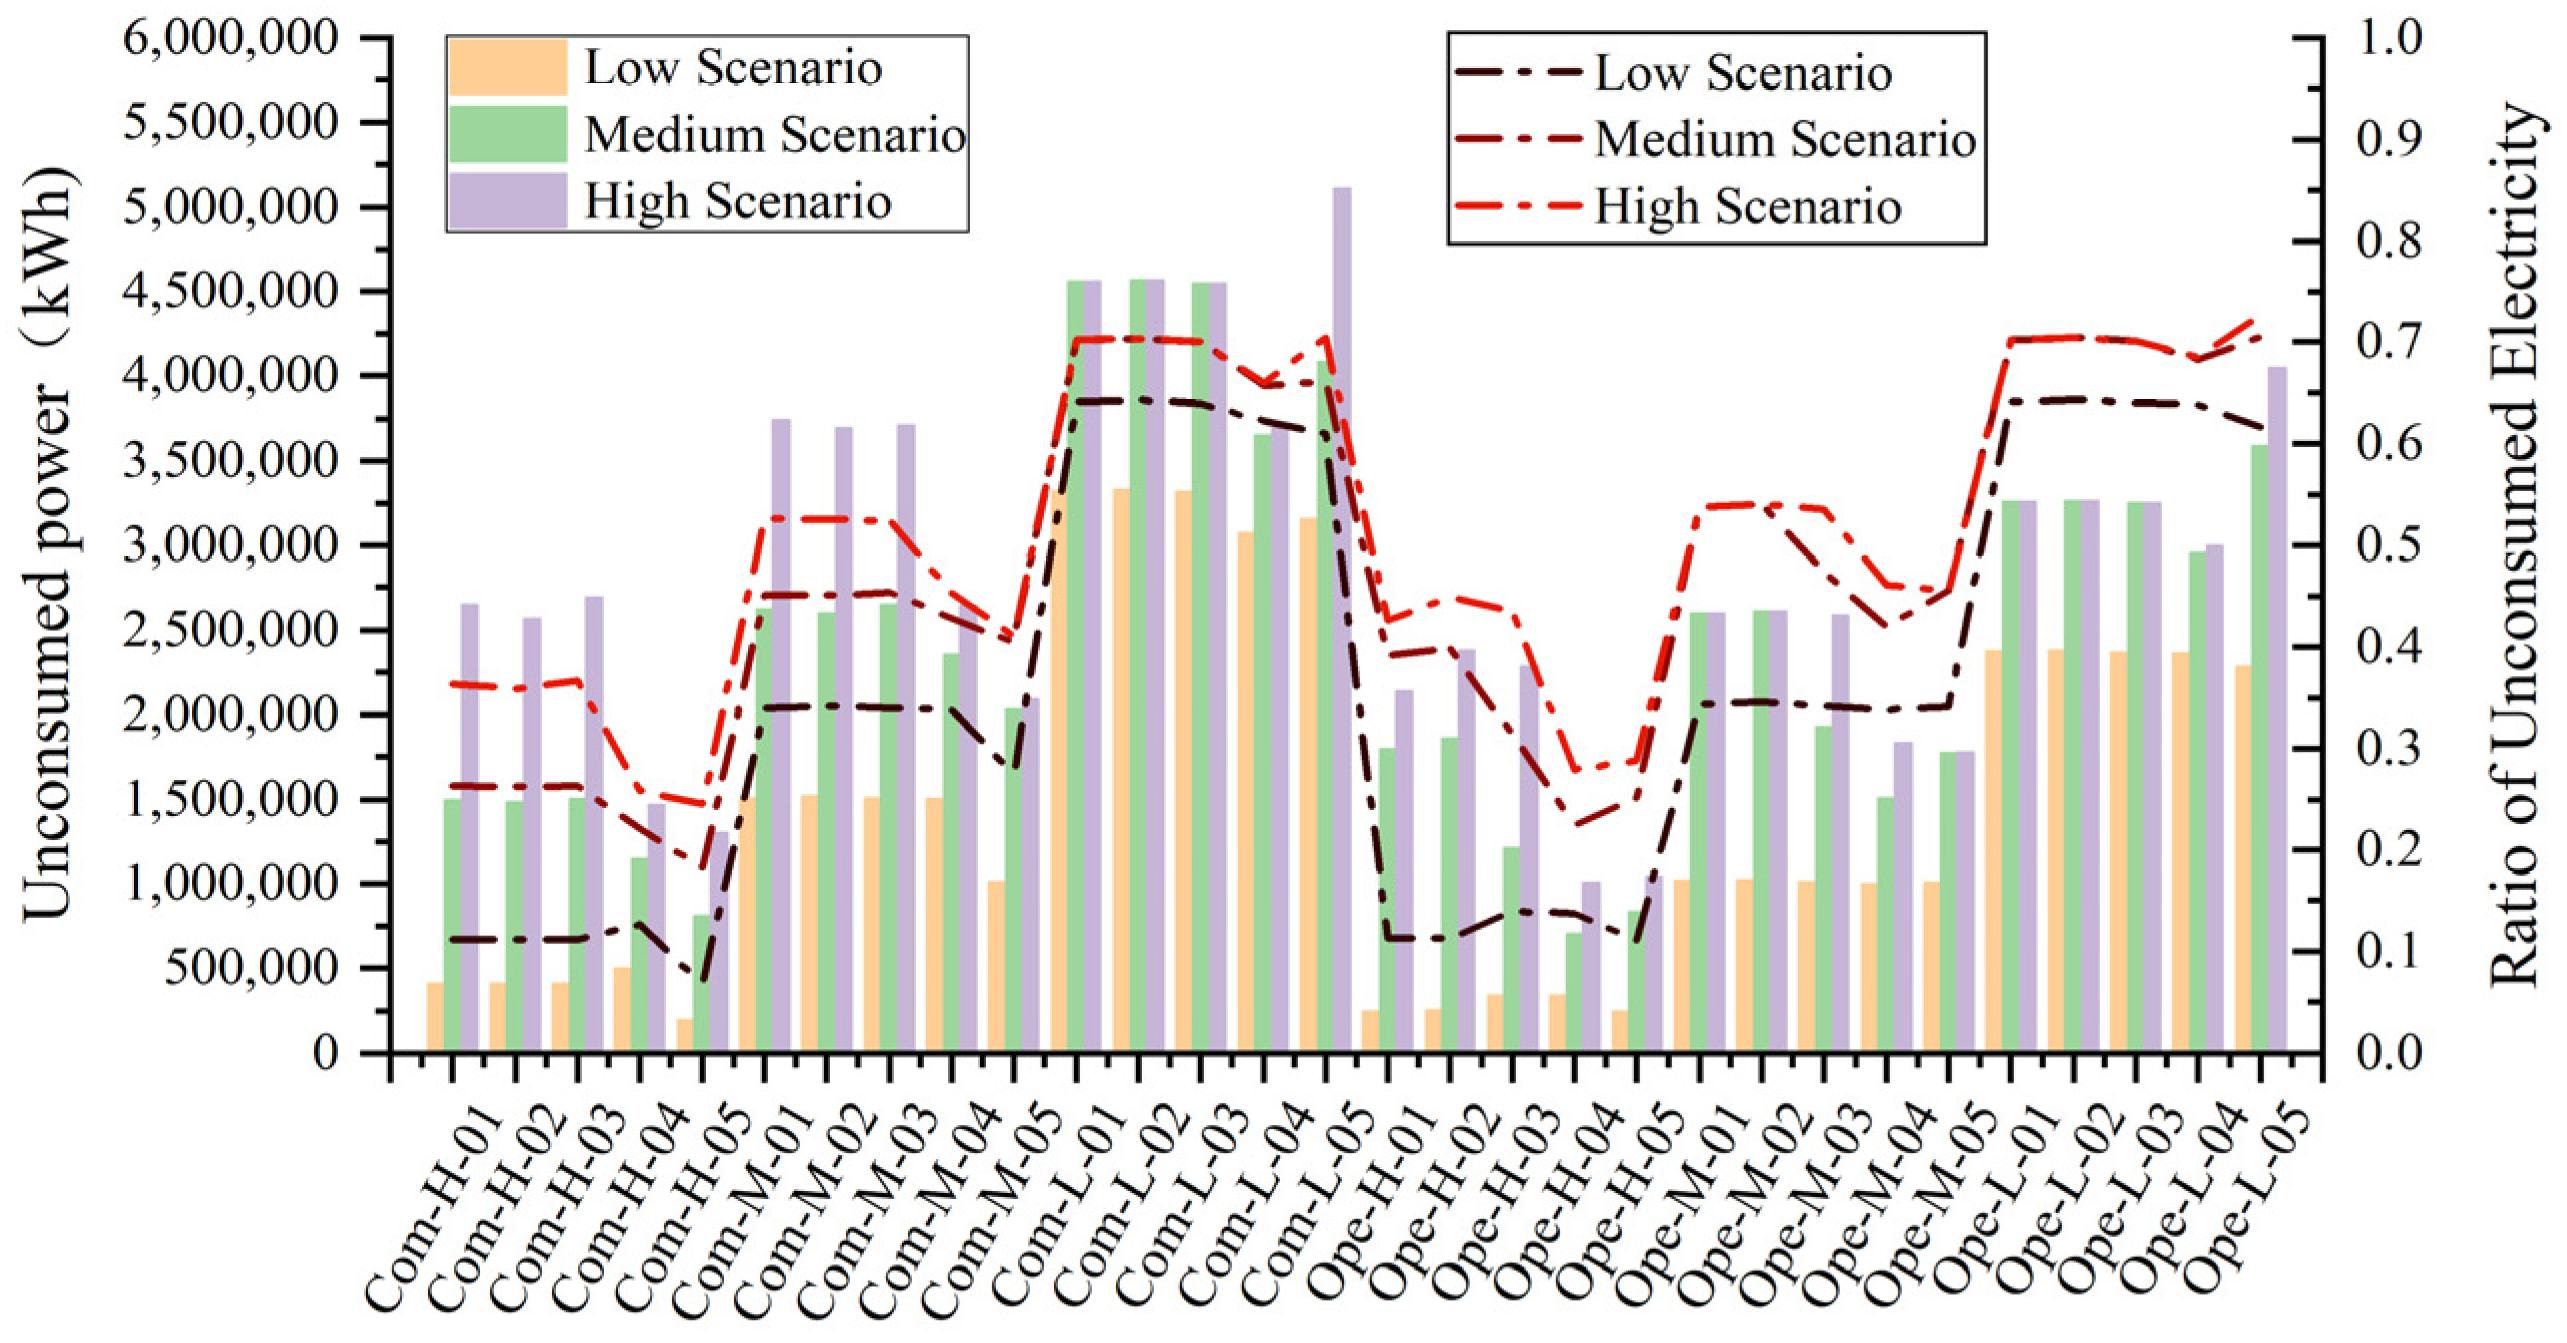
Upon analyzing the unconsumed electricity of each building cluster, it can be observed that high-rise building clusters have lower levels of unconsumed electricity. Specifically, tower-type buildings exhibited significantly lower rates of unconsumed electricity, while mid-rise and low-rise building clusters had higher unconsumed electricity levels and ratios. Under low utilization conditions, the unconsumed ratios of solar PV electricity for low-rise, mid-rise, and high-rise building clusters were 11.42%, 33.44%, and 63.38%, respectively, indicating significant differences. Under high utilization conditions, these values increased to 34.70%, 49.71%, and 69.91%, respectively. This means that without necessary peak shaving or energy storage measures, approximately 70% of the solar PV power in buildings cannot be consumed, resulting in electricity and resource waste. This indirectly confirms the significance of achieving zero-emission energy goals in buildings and ensuring that building energy demand is matched with renewable energy supply.

5. Conclusions

This paper presents an analysis method for the potential application of renewable energy in urban residential building clusters, taking into account the influence of urban form at the block scale, as well as a building energy consumption simulation method. Based on real urban building forms and local climate zones, a set of 30 prototype building clusters with different forms was constructed to analyze their potential for renewable energy application and their impact on building energy consumption. The main conclusions can be summarized as follows:
(1)
The utilization of shallow geothermal energy resources is not affected by the building floor plans. Its application in existing building clusters is closely related to the cluster type, and building density is a key factor influencing the potential for shallow geothermal energy application. In this case, the average building density of the compact building complex is 1.58 times that of the open building complex, and the number of drilling installations is 77.4% of the latter. For new building clusters, proper planning of building energy forms and early deployment of ground source heat pump boreholes can greatly enhance the potential for utilizing shallow geothermal energy resources.
(2)
The building roof serves as the primary carrier for solar PV utilization, while the southern façades of buildings in Beijing offer favorable conditions, as well. In this case, the average annual solar irradiance on the roof of the building is 1285.42 kWh/m2, and the average annual solar irradiance on the south facing façade is 1015.45 kWh/m2 without obstruction. By fully utilizing the southern façades, an average increase of around 40% in solar energy generation can be achieved. The correlation analysis between building cluster parameters and solar energy generation intensity reveals a negative relationship between the sky view factor and solar energy generation intensity. Additionally, the street canyon height/width ratio and building density demonstrate a positive correlation with the intensity of electricity generation in building clusters, while the correlation between building height and floor area ratio is not significant.
(3)
Both the urban heat island effect and the occlusion effect have significant impacts on building heating and cooling loads, with opposite mechanisms. In this study, considering the influence of the urban heat island effect, the average building heating efficiency decreases by 15.80%, while the cooling efficiency can increase by up to 30%. Taking into account the occlusion effect, the average energy consumption for heating increases by 11.88%, while the average cooling energy consumption decreases by 5.87%.
(4)
However, in this study, the differences in the urban heat island effect among different building cluster prototypes are relatively small, and its impact on building heating and cooling loads is weaker compared to the occlusion effect. This is evidenced by the fact that the differences in cooling and heating loads among different building cluster prototypes follow a similar trend to the effect of mutual shading, but in the opposite direction to the urban heat island effect. Compared to different building clusters, the maximum benefit of shading between buildings can increase heating energy consumption by about 25% and reduce cooling energy consumption by about 10%.
(5)
The correlation analysis results indicate a significant negative correlation between the sky view factor and both the urban heat island effect and the occlusion effect. The canyon height to canyon width ratio and floor area ratio show a positive correlation with the urban heat island effect and the occlusion effect. Additionally, there is a positive correlation between the proportion of impervious surface area and the urban heat island effect. However, the building density indicator shows no significant correlation with either effect, suggesting that a single building density indicator may not effectively reflect the morphological characteristics of building clusters.
(6)
Under the condition that building energy performance significantly improves, the shallow geothermal energy resources in Beijing have abundant potential and can effectively meet the cooling and heating demand of buildings. Among them, meeting the heating energy demand is relatively easier compared to the cooling demand. For example, in the low utilization scenario of the ground source heat pump, an average of 30% of the cooling demand is difficult to meet, but under the same conditions, the ground source heat pump can almost meet all heating needs.
(7)
The solar energy penetration rate is primarily influenced by the building height. In this study, under different utilization scenarios, the solar energy penetration rate for low-rise building clusters is greater than 1, with an average penetration rate of 1.45. For mid-rise and high-rise building clusters, it is less than 1, with the lowest penetration rate observed in the compact high-rise building cluster under the low utilization scenario, at 0.22. When deploying solar PV modules on building façades, open-type building clusters tend to have higher energy penetration rates compared to compact building clusters in the high utilization scenario.
(8)
Without the use of energy storage devices and management measures, there is a phenomenon of untimely consumption of solar power. Among the building cluster prototypes in this study, up to 70% of the solar power generated cannot be consumed in a timely manner. Therefore, improving the renewable energy consumption rate is a key factor in promoting renewable energy applications in buildings.

Author Contributions

Conceptualization, Y.L.; methodology, P.W.; software, P.W.; validation, P.W.; formal analysis, P.W.; investigation, P.W.; resources, Y.L.; data curation, P.W.; writing—original draft preparation, P.W.; writing—review and editing, Y.L.; visualization, P.W.; supervision, Y.L.; project administration, Y.L.; funding acquisition, Y.L. All authors have read and agreed to the published version of the manuscript.

Funding

This research was funded by the National Natural Science Foundation of China (Grant No. 71871014) and National Key R&D Plan Project (No. 2023YFE0102100).

Institutional Review Board Statement

Not applicable.

Informed Consent Statement

Not applicable.

Data Availability Statement

The data presented in this study are included in the manuscript.

Conflicts of Interest

The authors declare no conflict of interest.

References

  1. Poponi, D.; Bryant, T.; Burnard, K.; Cazzola, P.; Dulac, J.; Pales, A.F. Energy Technology Perspectives: Towards Sustainable Urban Energy Systems (Executive Summary); International Energy Agency: Paris, France, 2016. [Google Scholar]
  2. Alessia, B.; Martin, T.; Christophe, M.; Julien, R.; Marco, F. Evaluating the impact of urban morphology on rooftop solar radiation: A new city-scale approach based on Geneva GIS data. Energy Build. 2022, 260, 111919. [Google Scholar]
  3. International Energy Agency. Global ABC Roadmap for Buildings and Construction 2020–2050: Towards a Zero-Emission, Efficient, and Resilient Buildings and Construction Sector. 2020. Available online: https://www.iea.org/reports/globalabc-roadmap-for-buildings-and-construction-2020-2050 (accessed on 17 April 2023).
  4. Jianen, H.; Shasha, W.; Feihong, T.; Wei, F. Thermal performance optimization of envelope in the energy-saving renovation of existing residential buildings. Energy Build. 2021, 247, 111103. [Google Scholar]
  5. Adrian, C.; Godfried, A.; Da, Y. Occupancy data at different spatial resolutions: Building energy performance and model calibration. Appl. Energy 2021, 286, 116492. [Google Scholar]
  6. Gabriel, H.; Jimeno, A.; Fonseca, A.S. Impacts of diversity in commercial building occupancy profiles on district energy demand and supply. Appl. Energy 2020, 277, 115594. [Google Scholar]
  7. Ghezlane, H.M.; Mohamed, E.; Mohamed, B.H.; Basheer, Q.; Junaid, Q.; Muhammad, A.; Ala, A.-F.; Mohamed, R.A.; Driss, B. Intelligent building control systems for thermal comfort and energy-efficiency: A systematic review of artificial intelligence-assisted techniques. Renew. Sustain. Energy Rev. 2021, 144, 110969. [Google Scholar]
  8. Zhang, J.; Xu, L.; Shabunko, V.; Tay, S.E.R.; Sun, H.; Lau, S.S.Y.; Reindl, T. Impact of urban block typology on building solar potential and energy use efficiency in tropical high-density city. Appl. Energy 2019, 240, 513–533. [Google Scholar] [CrossRef]
  9. Boccalatte, A.; Fossa, M.; Gaillard, L.; Menezo, C. Microclimate and urban morphology effects on building energy demand in different European cities. Energy Build. 2020, 224, 110129. [Google Scholar] [CrossRef]
  10. Liu, K.; Xu, X.; Zhang, R.; Kong, L.; Wang, W.; Deng, W. Impact of urban form on building energy consumption and solar energy potential: A case study of residential blocks in Jianhu, China. Energy Build. 2023, 280, 112727. [Google Scholar] [CrossRef]
  11. Marrone, P.; Montella, I. An experimentation on the limits and potential of Renewable Energy Communities in the built city: Buildings and proximity open spaces for energy decentralization. Renew. Sustain. Energy Transit. 2022, 2, 100025. [Google Scholar] [CrossRef]
  12. Agnese, S.; Helena, C.; Michele, M. Effects of urban compactness on the building energy performance in Mediterranean climate. Energy Procedia 2017, 122, 499–504. [Google Scholar]
  13. Ren, Z.; Wang, X.; Chen, D.; Wang, C.; Thatcher, M. Constructing weather data for building simulation considering urban heat island. Build. Serv. Eng. Res. Technol. 2014, 35, 69–82. [Google Scholar] [CrossRef]
  14. Liu, Y.; Stouffs, R.; Tablada, A.; Wong, N.H.; Zhang, J. Comparing micro-scale weather data to building energy consumption in Singapore. Energy Build. 2017, 152, 776–791. [Google Scholar] [CrossRef]
  15. Yu, C.; Pan, W. Inter-building effect on building energy consumption in high-density city contexts. Energy Build. 2023, 278, 112632. [Google Scholar] [CrossRef]
  16. Chan, A.L.S. Effect of adjacent shading on the thermal performance of residential buildings in a subtropical region. Appl. Energy 2012, 92, 516–522. [Google Scholar] [CrossRef]
  17. Xu, S.; Jiang, H.; Xiong, F.; Zhang, C.; Xie, M.; Li, Z. Evaluation for block-scale solar energy potential of industrial block and optimization of application strategies: A case study of Wuhan, China. Sustain. Cities Soc. 2021, 72, 103000. [Google Scholar] [CrossRef]
  18. Zhu, R.; Wong, M.S.; You, L.; Santi, P.; Nichol, J.; Ho, H.C.; Ratti, C. The effect of urban morphology on the solar capacity of three-dimensional cities. Renew. Energy 2020, 153, 111–11126. [Google Scholar] [CrossRef]
  19. Tian, J.; Xu, S. A morphology-based evaluation on block-scale solar potential for residential area in central China. Sol. Energy 2021, 221, 332–347. [Google Scholar] [CrossRef]
  20. Chatzipoulka, C.; Compagnon, R.; Nikolopoulou, M. Urban geometry and solar availability on façades and ground of real urban forms: Using London as a case study. Sol. Energy 2016, 138, 53–66. [Google Scholar] [CrossRef] [Green Version]
  21. Stewart, I.D.; Oke, T.R. Local climate zones for urban temperature studies. Bull. Am. Meteorol. Soc. 2012, 93, 1879–1900. [Google Scholar] [CrossRef]
  22. Beijing Bureau of Statistics. Beijing Statistical Yearbook; China Statistics Press: Beijing, China, 2022. [Google Scholar]
  23. Weiding, L. Demand-Side Energy Planning in Urban Areas. J. HVAC 2015, 2, 7. [Google Scholar]
  24. Xin, L. Quantitative Evaluation of Urban Shallow Geothermal Energy Supply/Demand Balance and Potential Based on Spatial Patterns; Tsinghua University: Beijing, China, 2016. [Google Scholar]
  25. Wei, X.; Hongqing, X.; Yu, Z.; Zhen, Y.; Zhe, W. Design Standards for Ultra-Low Energy Residential Buildings; Beijing Municipal Commission of Planning and Natural Resources: Beijing, China, 2019; pp. 22–30. [Google Scholar]
  26. Larson, G.W.; Shakespeare, R. Rendering with Radiance: The Art and Science of Lighting Visualization; Morgan Kaufmann: San Francisco, CA, USA, 1998. [Google Scholar]
  27. Compagnon, R. Solar and daylight availability in the urban fabric. Energy Build. 2004, 36, 321–328. [Google Scholar] [CrossRef]
  28. Crawley, D.B.; Lawrie, L.K.; Winkelmann, F.C.; Buhl, W.F.; Huang, Y.J.; Pedersen, C.O.; Strand, R.K.; Liesen, R.J.; Fisher, D.E.; Witte, M.J.; et al. EnergyPlus: Creating a new-generation building energy simulation program. Energy Build. 2001, 33, 319–331. [Google Scholar] [CrossRef]
  29. Implementation Plan for Peaking Carbon Emissions in Urban and Rural Development Sector. Available online: https://www.gov.cn/zhengce/zhengceku/2022-07/13/content_5700752.htm (accessed on 17 April 2022).
  30. Beijing Civil Building Energy Efficiency and Carbon Reduction Work Plan and Green Development Plan for Civil Buildings in the 14th Five-Year Plan Period. Available online: https://www.beijing.gov.cn/zhengce/zhengcefagui/202302/t20230213_2915539.html (accessed on 18 April 2022).
  31. Wei, X.; Yu, Z.; Zhen, Y.; Deyu, S.; Wanming, Q. Nearly Zero Energy Buildings; China Architecture & Building Press: Beijing, China, 2019; pp. 18–24. [Google Scholar]
  32. Yu, S.; Yu, Z.; Liu, P.; Feng, G. Influence of environmental factors on wall mold in underground buildings in Shenyang City, China. Sustain. Cities Soc. 2019, 46, 101452. [Google Scholar] [CrossRef]
  33. Anderson, K.; Coddington, M.; Burman, K.; Hayter, S.; Kroposki, B.; Watson, A. Interconnecting PV on New York City’s Secondary Network Distribution System; National Renewable Energy Lab: Golden, CO, USA, 2009. [Google Scholar] [CrossRef] [Green Version]
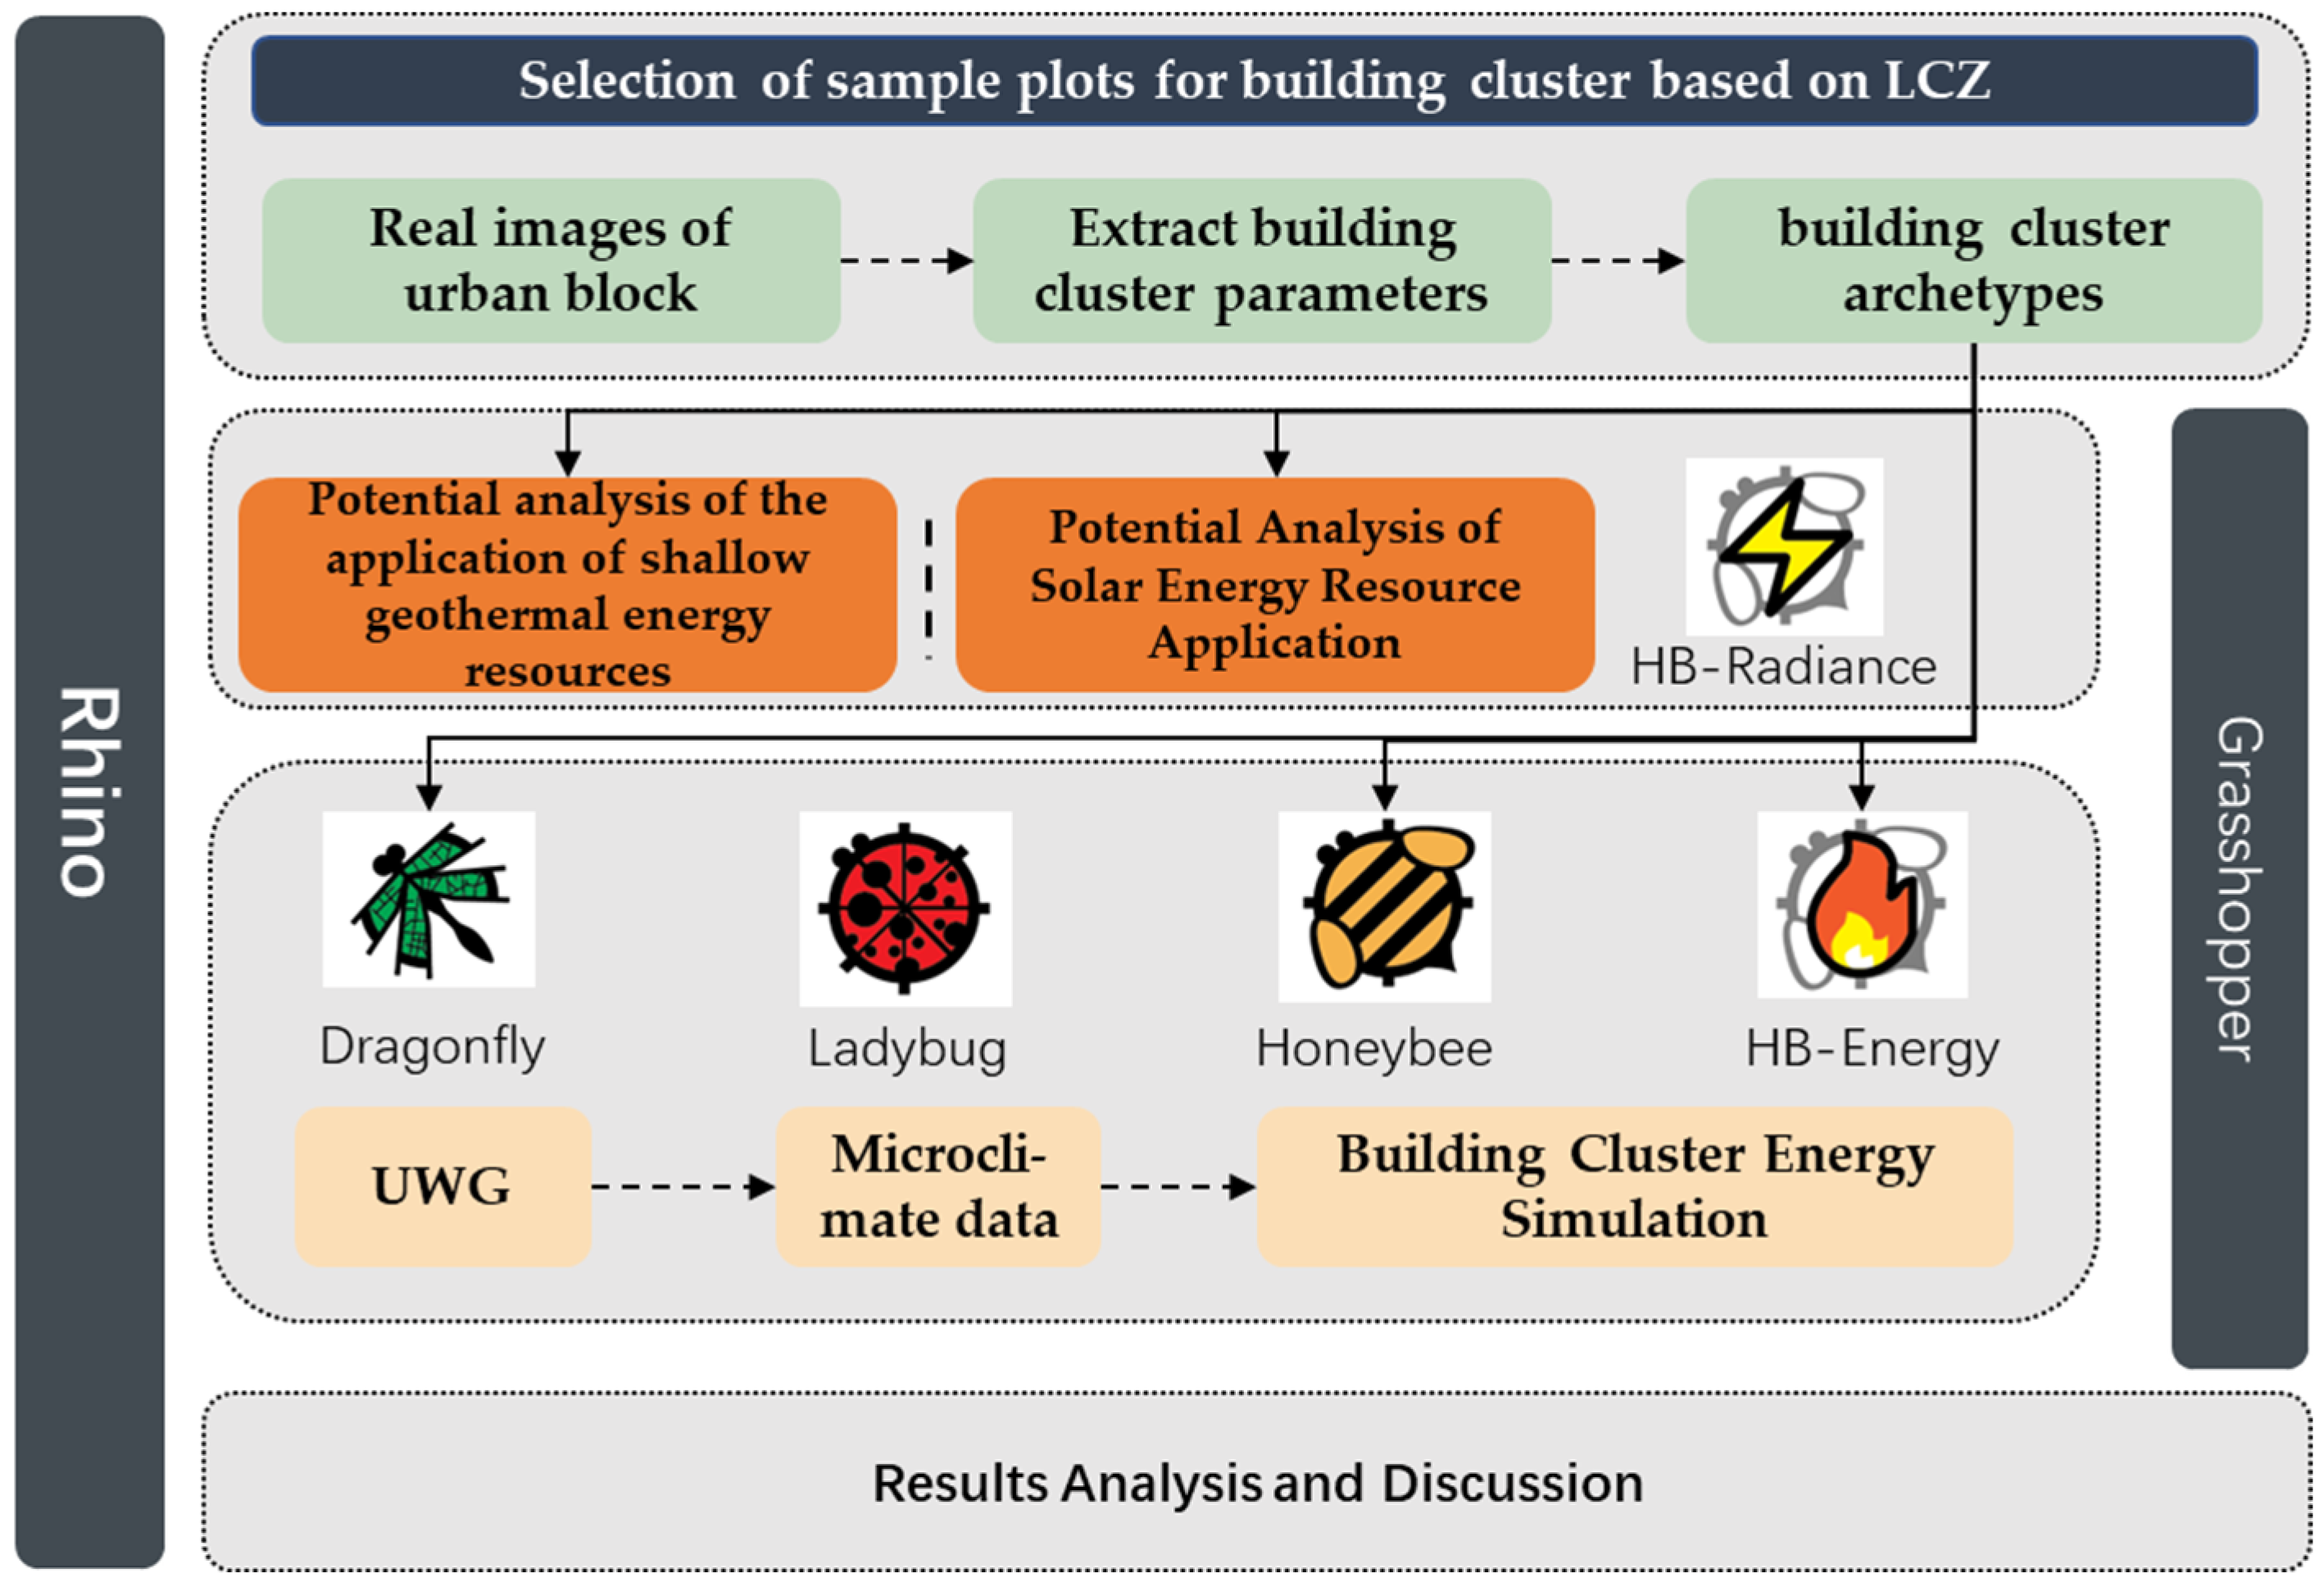
Figure 1. The workflow of this study.
Sustainability 15 11062 g001
Figure 2. Selection of sample plots and their spatial distribution.
Sustainability 15 11062 g002
Figure 3. Number of boreholes for different building clusters.
Sustainability 15 11062 g003
Figure 4. Shallow geothermal energy utilization potential of different building clusters.
Sustainability 15 11062 g004
Figure 5. Percentage of façade area suitable for PV module installation.
Sustainability 15 11062 g005
Figure 6. Solar energy utilization potential of different building clusters.
Sustainability 15 11062 g006
Figure 7. Correlation analysis matrix and scatter plot.
Sustainability 15 11062 g007
Figure 8. Comparison of UWG-generated climate data with the raw data.
Sustainability 15 11062 g008
Figure 9. Scenario settings.
Sustainability 15 11062 g009
Figure 10. Analysis of the impact of heat island effect.
Sustainability 15 11062 g010
Figure 11. Analysis of the impact of the occlusion effect.
Sustainability 15 11062 g011aSustainability 15 11062 g011b
Figure 12. Comparison of heating and cooling efficiency of building clusters in different local climate zones.
Sustainability 15 11062 g012
Figure 13. Comparison of heating and cooling efficiency of different building clusters.
Sustainability 15 11062 g013
Figure 14. Correlation analysis matrix and scatter plot.
Sustainability 15 11062 g014aSustainability 15 11062 g014b
Figure 15. Energy supply is less than the number of hours of demand and total supply.
Sustainability 15 11062 g015
Figure 16. Solar PV capacity penetration rate and energy penetration rate.
Sustainability 15 11062 g016
Figure 17. Average hourly electricity generation (consumption) and annual unconsumed electricity statistics.
Sustainability 15 11062 g017
Figure 18. Unused solar power and its ratio by building cluster.
Sustainability 15 11062 g018
Table 1. Building type and layout pattern.
Real ImageBuilding Prototype Construction
Building typeSustainability 15 11062 i001Sustainability 15 11062 i002Sustainability 15 11062 i003Sustainability 15 11062 i004Sustainability 15 11062 i005Sustainability 15 11062 i006
Slab buildingTower buildingVillaSlab buildingTower buildingVilla
LayoutSustainability 15 11062 i007Sustainability 15 11062 i008Sustainability 15 11062 i009Sustainability 15 11062 i010Sustainability 15 11062 i011Sustainability 15 11062 i012Sustainability 15 11062 i013Sustainability 15 11062 i014
LinearCourtyardStaggeredInterconnectedLinearCourtyardStaggeredInterconnected
Table 2. Main parameters of building clusters prototype.
Building TypeSVFH/WIPSFPSFBHBDBuilding TypeSVFH/WIPSFPSFBHBDFAR
Com-H-0142.521.240.630.1056.000.27Ope-H-0166.590.510.390.4556.000.163.20
Com-H-0240.051.240.630.1056.000.27Ope-H-0263.310.510.390.4556.000.163.20
Com-H-0346.081.240.630.1056.000.27Ope-H-0361.341.120.420.4050.400.183.20
Com-H-0453.590.670.620.1053.200.28Ope-H-0461.420.630.420.4050.400.183.20
Com-H-0558.680.880.640.1570.000.21Ope-H-0573.530.700.390.4556.000.163.20
Com-M-0151.220.880.500.1828.000.32Ope-M-0169.960.420.390.4028.000.212.13
Com-M-0247.970.880.500.1828.000.32Ope-M-0268.680.420.390.4028.000.212.13
Com-M-0354.550.880.500.1828.000.32Ope-M-0367.550.880.390.4028.000.212.13
Com-M-0461.940.350.500.1828.000.32Ope-M-0472.880.480.390.4028.000.212.13
Com-M-0567.410.420.500.2333.600.27Ope-M-0576.650.350.390.4028.000.212.13
Com-L-0166.930.490.350.2811.200.37Ope-L-0179.360.250.230.5011.200.271.07
Com-L-0263.440.490.350.2811.200.37Ope-L-0278.130.250.230.5011.200.271.07
Com-L-0366.020.490.350.2811.200.37Ope-L-0378.760.250.230.5011.200.271.07
Com-L-0476.630.280.360.2811.200.36Ope-L-0485.010.160.230.5011.200.271.07
Com-L-0539.271.400.360.2811.200.36Ope-L-0557.000.750.230.5011.200.271.07
Table 3. Building clusters prototype.
Slab Buildings
-Linear Layout
Slab Buildings
-Interconnected Layout
Slab Buildings
-Staggered Layout
Slab Buildings
-Courtyard Layout
Tower Buildings
-Linear Layout
LCZ1
Compact high-rise
Sustainability 15 11062 i015
Com-H-01
Sustainability 15 11062 i016
Com-H-02
Sustainability 15 11062 i017
Com-H-03
Sustainability 15 11062 i018
Com-H-04
Sustainability 15 11062 i019
Com-H-05
LCZ2
Compact mid-rise
Sustainability 15 11062 i020
Com-M-01
Sustainability 15 11062 i021
Com-M-02
Sustainability 15 11062 i022
Com-M-03
Sustainability 15 11062 i023
Com-M-04
Sustainability 15 11062 i024
Com-M-05
LCZ3
Compact
low-rise
Sustainability 15 11062 i025
Com-L-01
Sustainability 15 11062 i026
Com-L-02
Sustainability 15 11062 i027
Com-L-03
Sustainability 15 11062 i028
Com-L-04
Sustainability 15 11062 i029
Com-L-05
LCZ4
Open
high-rise
Sustainability 15 11062 i030
Ope-H-01
Sustainability 15 11062 i031
Ope-H-02
Sustainability 15 11062 i032
Ope-H-03
Sustainability 15 11062 i033
Ope-H-04
Sustainability 15 11062 i034
Ope-H-05
LCZ5
Open
mid-rise
Sustainability 15 11062 i035
Ope-M-01
Sustainability 15 11062 i036
Ope-M-02
Sustainability 15 11062 i037
Ope-M-03
Sustainability 15 11062 i038
Ope-M-04
Sustainability 15 11062 i039
Ope-M-05
LCZ6
Open
low-rise
Sustainability 15 11062 i040
Ope-L-01
Sustainability 15 11062 i041
Ope-L-02
Sustainability 15 11062 i042
Ope-L-03
Sustainability 15 11062 i043
Ope-L-04
Sustainability 15 11062 i044
Ope-L-05
Table 4. UWG parameter setting.
LCZ1LCZ2LCZ3LCZ4LCZ5LCZ6
Building height (m)562811.2562811.2
Road albedo0.100.100.100.100.100.10
Green coverage0.100.180.280.450.400.50
Forest coverage0.050.10.150.20.250.25
Vegetation albedo0.250.250.250.250.250.25
Building window-to-wall ratio0.350.350.350.350.350.35
Waste heat discharge rate of air conditioning systems0.50.50.50.50.50.5
Traffic parameters (W/m2)1085864
Table 5. Building energy simulation parameter settings.
ParameterSettingParameterSetting
Roof heat transfer coefficient0.1Indoor temperature during the heating season18 °C
Heat transfer coefficient of exterior wall0.15Cooling target temperature26 °C
Window heat transfer coefficient0.8Natural ventilation conditionsOutdoor temperature ≤ 28 °C and relative humidity ≤ 70%
Solar heat gain coefficient0.45Shading formWindow shutter
Window-to-wall ratio0.35Penetration rate0.0002 m3/m2
Occupancy density32 m2/personBuilding floor height2.8 m
Power density of electrical facilities18 w/m2Building lighting power3 w/m2
Water heating power2.5 w/m2Cooking power5 w/m2
Table 6. Visualization of solar irradiance in building clusters.
Slab Buildings
-Linear Layout
Slab Buildings
-Interconnected Layout
Slab Buildings
-Staggered Layout
CourtyardTower Buildings
-Linear Layout
LCZ1
Compact high-rise
Sustainability 15 11062 i045
Com-H-01
Sustainability 15 11062 i046
Com-H-02
Sustainability 15 11062 i047
Com-H-03
Sustainability 15 11062 i048
Com-H-04
Sustainability 15 11062 i049
Com-H-05
LCZ2
Compact mid-rise
Sustainability 15 11062 i050
Com-M-01
Sustainability 15 11062 i051
Com-M-02
Sustainability 15 11062 i052
Com-M-03
Sustainability 15 11062 i053
Com-M-04
Sustainability 15 11062 i054
Com-M-05
LCZ3
Compact
low-rise
Sustainability 15 11062 i055
Com-L-01
Sustainability 15 11062 i056
Com-L-02
Sustainability 15 11062 i057
Com-L-03
Sustainability 15 11062 i058
Com-L-04
Sustainability 15 11062 i059
Com-L-05
LCZ4
Open
high-rise
Sustainability 15 11062 i060
Ope-H-01
Sustainability 15 11062 i061
Ope-H-02
Sustainability 15 11062 i062
Ope-H-03
Sustainability 15 11062 i063
Ope-H-04
Sustainability 15 11062 i064
Ope-H-05
LCZ5
Open
mid-rise
Sustainability 15 11062 i065
Ope-M-01
Sustainability 15 11062 i066
Ope-M-02
Sustainability 15 11062 i067
Ope-M-03
Sustainability 15 11062 i068
Ope-M-04
Sustainability 15 11062 i069
Ope-M-05
LCZ6
Open
low-rise
Sustainability 15 11062 i070
Ope-L-01
Sustainability 15 11062 i071
Ope-L-02
Sustainability 15 11062 i072
Ope-L-03
Sustainability 15 11062 i073
Ope-L-04
Sustainability 15 11062 i074
Ope-L-05
Table 7. Solar energy utilization scenario setting.
Low Utilization ScenarioRooftop Solar PV System
Medium utilization scenarioRoof and façade (irradiance > 1000 kWh/m2) solar PV systems
High utilization scenarioRoof and façade (irradiance > 800 kWh/m2) solar PV systems
Table 8. Ground source heat pump systems and building energy self-sufficiency.
HeatingCooling
30 m80 m120 m30 m80 m120 m
LCZ10.80110.670.971
LCZ20.97110.8711
LCZ30.99110.9911
LCZ41110.9211
LCZ51110.9911
LCZ6111111
Table 9. The average penetration rates of building clusters in the same local climate zone.
Low ScenarioMedium ScenarioHigh Scenario
LCZ10.220.330.41
LCZ20.450.580.67
LCZ31.111.361.40
LCZ40.240.410.48
LCZ50.460.660.70
LCZ61.131.421.45
Disclaimer/Publisher’s Note: The statements, opinions and data contained in all publications are solely those of the individual author(s) and contributor(s) and not of MDPI and/or the editor(s). MDPI and/or the editor(s) disclaim responsibility for any injury to people or property resulting from any ideas, methods, instructions or products referred to in the content.