Article

A Study on the Spatial-Temporal Evolution and Problem Area Identification of High-Quality Urban Development in the Central Region

1
School of Management, China University of Mining and Technology (Beijing), Beijing 100083, China
2
Energy Research Institute, Chinese Academy of Macroeconomic Research, Beijing 100038, China
*
Author to whom correspondence should be addressed.
Sustainability 2023, 15(14), 11098; https://doi.org/10.3390/su151411098
Submission received: 22 May 2023 / Revised: 13 July 2023 / Accepted: 14 July 2023 / Published: 16 July 2023

Abstract

:
The central region is an important strategic area that encompasses the east and the west and connects the south and the north. Promoting high-quality urban development in the central region plays a positive role in comprehensively upgrading the central rising strategy and realizing coordinated regional development. Based on the measurement index system result of the level of high-quality urban development in the central region, this study describes the regional gap and its dynamic evolution through the Dagum Gini coefficient and the kernel density function. In addition, it analyzes the causes of the gap in high-quality development of cities in the central region from the perspective of problem area identification. The result shows that the overall high-quality development of cities in the central region is increasing, with high-level cities clustering around the core cities. The relative regional disparities continue to narrow, but the absolute differences tend to expand. The super-variable density tends to be the main source of the overall difference, and the high-quality development of cities in each region is positively spatial correlated with each other. At present, the lagging economic development and outcomes sharing are the main obstacles to the high-quality development of cities in the central region.

1. Introduction

China’s socioeconomic development has entered a new phase of steady growth. Coordinated regional development is necessary to avoid sluggish growth, accelerate industrial upgrades, prevent ecological degradation, and address regional imbalances [1,2,3]. The concept of high-quality development provides a theoretical reference for addressing these issues and has gradually become a guiding principle for economic development in various regions [4]. High-quality urban development directly affects the overall high-quality development of the country. As a complex, dynamic and multidimensional system, urban development cannot be divorced from economic, social and ecological development. It is the process of industrial, demographic, social, spatial and ecological development changes and comprehensive transformation. As a strategic region connecting the Yangtze and Yellow River basins, as well as the eastern and western regions, the central region’s high-quality development is crucial not only for the economic development quality of the two river basins, but also for promoting positive interaction and coordinated development among the three regions of the east, central and west. Against this background, the party and the state attach great importance to the economic and social development of the central region and have issued a number of guiding documents, from the proposal of the Central Rise Strategy in 2004 to the Outline of the Thirteenth Five-Year Plan for the Rise of the Central Region in 2016 and to the Opinion on Promoting the High-Quality Development of the Central Region in the New Era, issued in 2021 [5]. This indicates that the unbalanced and inadequate development of the central region is still acute. And the level of inland openness needs to be improved, manufacturing innovation capacity needs to be enhanced, the ecological green development pattern needs to be consolidated, and public services, especially in response to public health and other major emergencies, need to be enhanced. Based on clarifying the existing problems of high-quality development in the central region, the opinion outlines a route and suggestions for the central region to achieve high-quality development to meet the new requirements for the development of the central region in the new era. Therefore, in promoting the new journey of high-quality development, describing the current status of high-quality development in the central region can identify the problems of high-quality development in the current stage of the central region, and help in implementing targeted measures in a problem-oriented manner to better promote the high-quality development of the central region.
Scholars have interpreted the connotations of high-quality development from different dimensions. He et al. [6] noted that high-quality development is a model with greater welfare effects, richer GDP connotations, stronger development dynamics, and higher efficiency, as well as more comprehensive, coordinated, and sustainable development, which could promote the urban ecological welfare performance in a concerted manner. Zheng and He [7] believe that accelerating the process of industrial agglomeration and increasing investment in technological innovation could effectively promote high-quality regional development. Yan and Zhang [8] argued that the key to high-quality urban development is the coordinated development of the economy, society, and the environment. In summary, this study argues that high-quality development is the improvement of development quality and efficiency on the basis of quantity; the overall improvement of the economic development process, mode, power, and effect; and the high-level co-progression of economic, environmental, and social systems.
The evaluation of results of high-quality development focuses on two aspects. First, a single indicator is chosen as a proxy for high-quality development, with green total factor productivity [9,10,11,12] and green development efficiency being the main indicators [13]. Although a single indicator can replace high-quality development in one aspect, its broader representation is slightly weak. Second is a substitute for high-quality development through the construction of a comprehensive indicator system. Among them, the literature is mostly constructed based on the five development concepts and growth quality index [14,15,16,17]. Some studies do not construct indicators from the above dimensions but still implement the new development concept to some extent through the content of their indicators. Looking more closely, there are few research results on high-quality development in central regions, mostly focusing on national provincial units as study samples, supplemented by a simple evaluation of the level of high-quality development in central regions. For instance, Guo et al. [18] constructed a high-quality provincial development system based on four aspects: development dynamics, structure, mode, and outcomes. Subregional studies show that the central region was second only to the eastern region in terms of high-quality development, with a faster development trend. Chen et al. [19] constructed an index system in terms of innovation, coordination, sustainability, openness, and sharing, and concluded that high-quality development in China presents an unbalanced development trend, with a characteristic of eastern–northeastern–central–western ladder distribution, and the absolute disparity is gradually decreasing.
In summary, previous studies have provided theoretical references for the high-quality development of cities in the central region. However, further investigations are required in terms of the depth and breadth of this research. Specifically, this includes the following aspects: (1) Research on high-quality development in the central region has mostly focused on the provincial level, and studies have been conducted using non-independent samples. Cities are an important fulcrum for achieving high-quality development, and there is a relative lack of research focusing on them. (2) Few papers have studied their spatial variation and dynamic evolution. (3) Previous studies lacked a multi-dimensional and multi-scale comprehensive examination of the high-quality development of the central region. Thus, the depth and breadth of research on high-quality development in the central region are insufficient to accurately identify the problems that exist in the current stage.
Therefore, this study constructed a high-quality development index system for the central region based on five aspects: economic development, steady improvement in efficiency, coordinated regional development, effective ecological governance, and the sharing of development achievements. Using the entropy weight method, the current state of high-quality development in the central region was evaluated from temporal and spatial perspectives, based on the calculated results. The trend of high-quality development in the urban areas of the central region has also been examined in recent years. Then, the Dagum Gini coefficient and kernel density function method were applied to analyze disparities in the high-quality development and dynamic evolutionary characteristics among various regions. In addition, spatial autocorrelation analysis was used to study whether there was spatial correlation in the level of high-quality development of cities in each province. Finally, starting from the causes of these disparities, this study identified the shortcomings of high-quality development in the central region from five dimensions and sought to leverage strengths and avoid weaknesses to provide a decision-making basis for promoting the high-quality development of cities in the central region.

2. Index System Construction and Data Source

2.1. Construction of Index System for High-Quality Development of Cities

With the pursuit of economic development goals in China’s new era, the implementation of the concept of high-quality development will be influenced by the economy, environment, society, and other areas [20,21]. Following a comprehensive reference to previous studies, this study constructed an index system from five aspects—the development of the economy, the steady improvement of efficiency, coordinated regional development, effective ecological governance, and shared development achievements—to evaluate the level of high-quality development of cities in the central region.

2.1.1. Economic Upside

High-quality development refers to development based on fundamental aspects of the economy, which are typically determined by a country’s major factors, including the basic situation and long-term trends of its economic operations, which possess features of stability, immanence, and long-term sustainability. The fundamental aspects of development ensure that a country’s economy will not undergo elementary changes over the long term and that its economic operation will remain within a reasonable range for a long period of time, while having the ability to resist and prevent systematic risks and better implement existing policies. Specifically, the quantity and stability of economic growth are comprehensive quantity indicators used to assess fundamental aspects, and their changing trends can reflect whether a country’s economy deviates from its original trajectory, thereby affecting the formulation of government macroeconomic policies. Meanwhile, the external orientation of economic development and high-level industrialization of the industry structure influence the fundamental aspects of the economy from the perspective of driving economic growth. It is necessary to continuously optimize the external orientation of development and the high-level industrialization of industry structures to stabilize the fundamental aspects of development [22]. Therefore, four indicators—per capita regional GDP, the coefficient of variation of the economic growth rate, the ratio of imports and exports to regional GDP, and the level of industrial upgrade—were selected to measure the level of economic development toward progress, as shown in Table 1.

2.1.2. Steady Improvement of Efficiency

The development of high-quality technologies requires the progression of both efficiency and quality. Efficiency reform serves as the backbone for constructing a modern economic system, and it is also a crucial support for the realization of high-quality development. To achieve efficiency reform, the market allocation efficiency of the production factors must first be enhanced [23]. The distorted market allocation of factors can have adverse effects on high-quality development via the following channels: lagging factor market structure relative to regional industrial structure adjustments, impeding the upgrading of regional industries; production factors which easily agglomerate towards labor-intensive industries, resulting in low-end industry lock-in and reduced labor income; and an expanding disparity in household income [24,25,26]. At the Central Economic Conference in 2017, General Secretary Xi Jinping proposed that the fundamental basis for structural contradictions in a country’s economy lies in factor allocation distortion. Therefore, the efficient allocation of factors is a fundamental approach to solving structural contradictions in the economy, and is also an objective requirement for high-quality development. The efficient allocation of factors can stimulate vitality, unblock domestic circulation, unleash potential, and promote new drivers of economic growth. Considering that labor and capital are the most basic factors of production, this study measures labor mismatch and capital mismatch at the city level in the central region from the perspective of labor and capital, based on the measurement of labor and capital productivity and drawing on the research method of Bai [27]. Ultimately, four indicators—labor productivity, capital productivity, labor mismatch, and capital mismatch—were selected to measure the efficiency of factor allocation in cities in the central region, as shown in Table 2.

2.1.3. Coordinated Regional Development

High-quality development is a solution for imbalanced growth. Coordinated development is an inherent characteristic of high-quality development and is an important criterion for its measurement. The key to promoting a coordinated development strategy is coordinating regional economic development, promoting urban–rural integration, and optimizing the economic development structure [28]. From an external perspective, an imbalance in development is reflected in uneven regional economic development. Internally, the imbalance in development is reflected in the imbalance between urban and rural development and industrial structure. Therefore, this study chose the ratio of the per capita GDP of prefecture-level cities to the per capita GDP of the entire region, income disparity between urban and rural areas, consumption disparity between urban and rural areas, and industrial rationalization as indicators to measure the level of regional coordinated development, as shown in Table 3. The industrial rationalization level was measured using the Theil index method [29,30], and the larger the Theil index value, the more unbalanced the development among the three industries in the city.

2.1.4. Effective Ecological Governance

High-quality development is the co-development of the economy and the environment. The co-development of the economy and environment means that both gold and silver mountains and green waters and mountains should be considered. With the increasingly obvious reality of resource constraints, worsening environmental pollution, and severe ecological governance [31,32], China needs to attach great importance to ecological governance to avoid falling into the dilemma of lagging ecological and economic development [33,34]. Ecological governance is a persistent and long-term arduous task that requires perseverance and persistence [35]. Currently, environmental pollution in China is primarily concentrated in industrial and household areas [36]. Therefore, the emission of “three wastes” from industries, sewage treatment rate, and household waste treatment rate were chosen to reflect the achievements of ecological governance, as shown in Table 4.

2.1.5. Development Results Sharing

High-quality development is centered on people. The ultimate expression of the effectiveness of high-quality development must still be implemented by the people and reflected in the degree of consistency between high-quality development results and people’s aspirations for a better life. The fundamental purpose of shared development is to solve the problem of social fairness and justice and achieve equal sharing for all. From the perspective of the developmental history of human society, the four aspects of education, healthcare, transportation, and the environment are closely related to people’s quality of life and happiness. Therefore, in this study, we chose the number of students in higher education per 10,000 people, number of doctors per 10,000 people, per capita road area, and per capita park green space area as the four indicators to reflect the shared level of high-quality development achievements [37], as shown in Table 5.

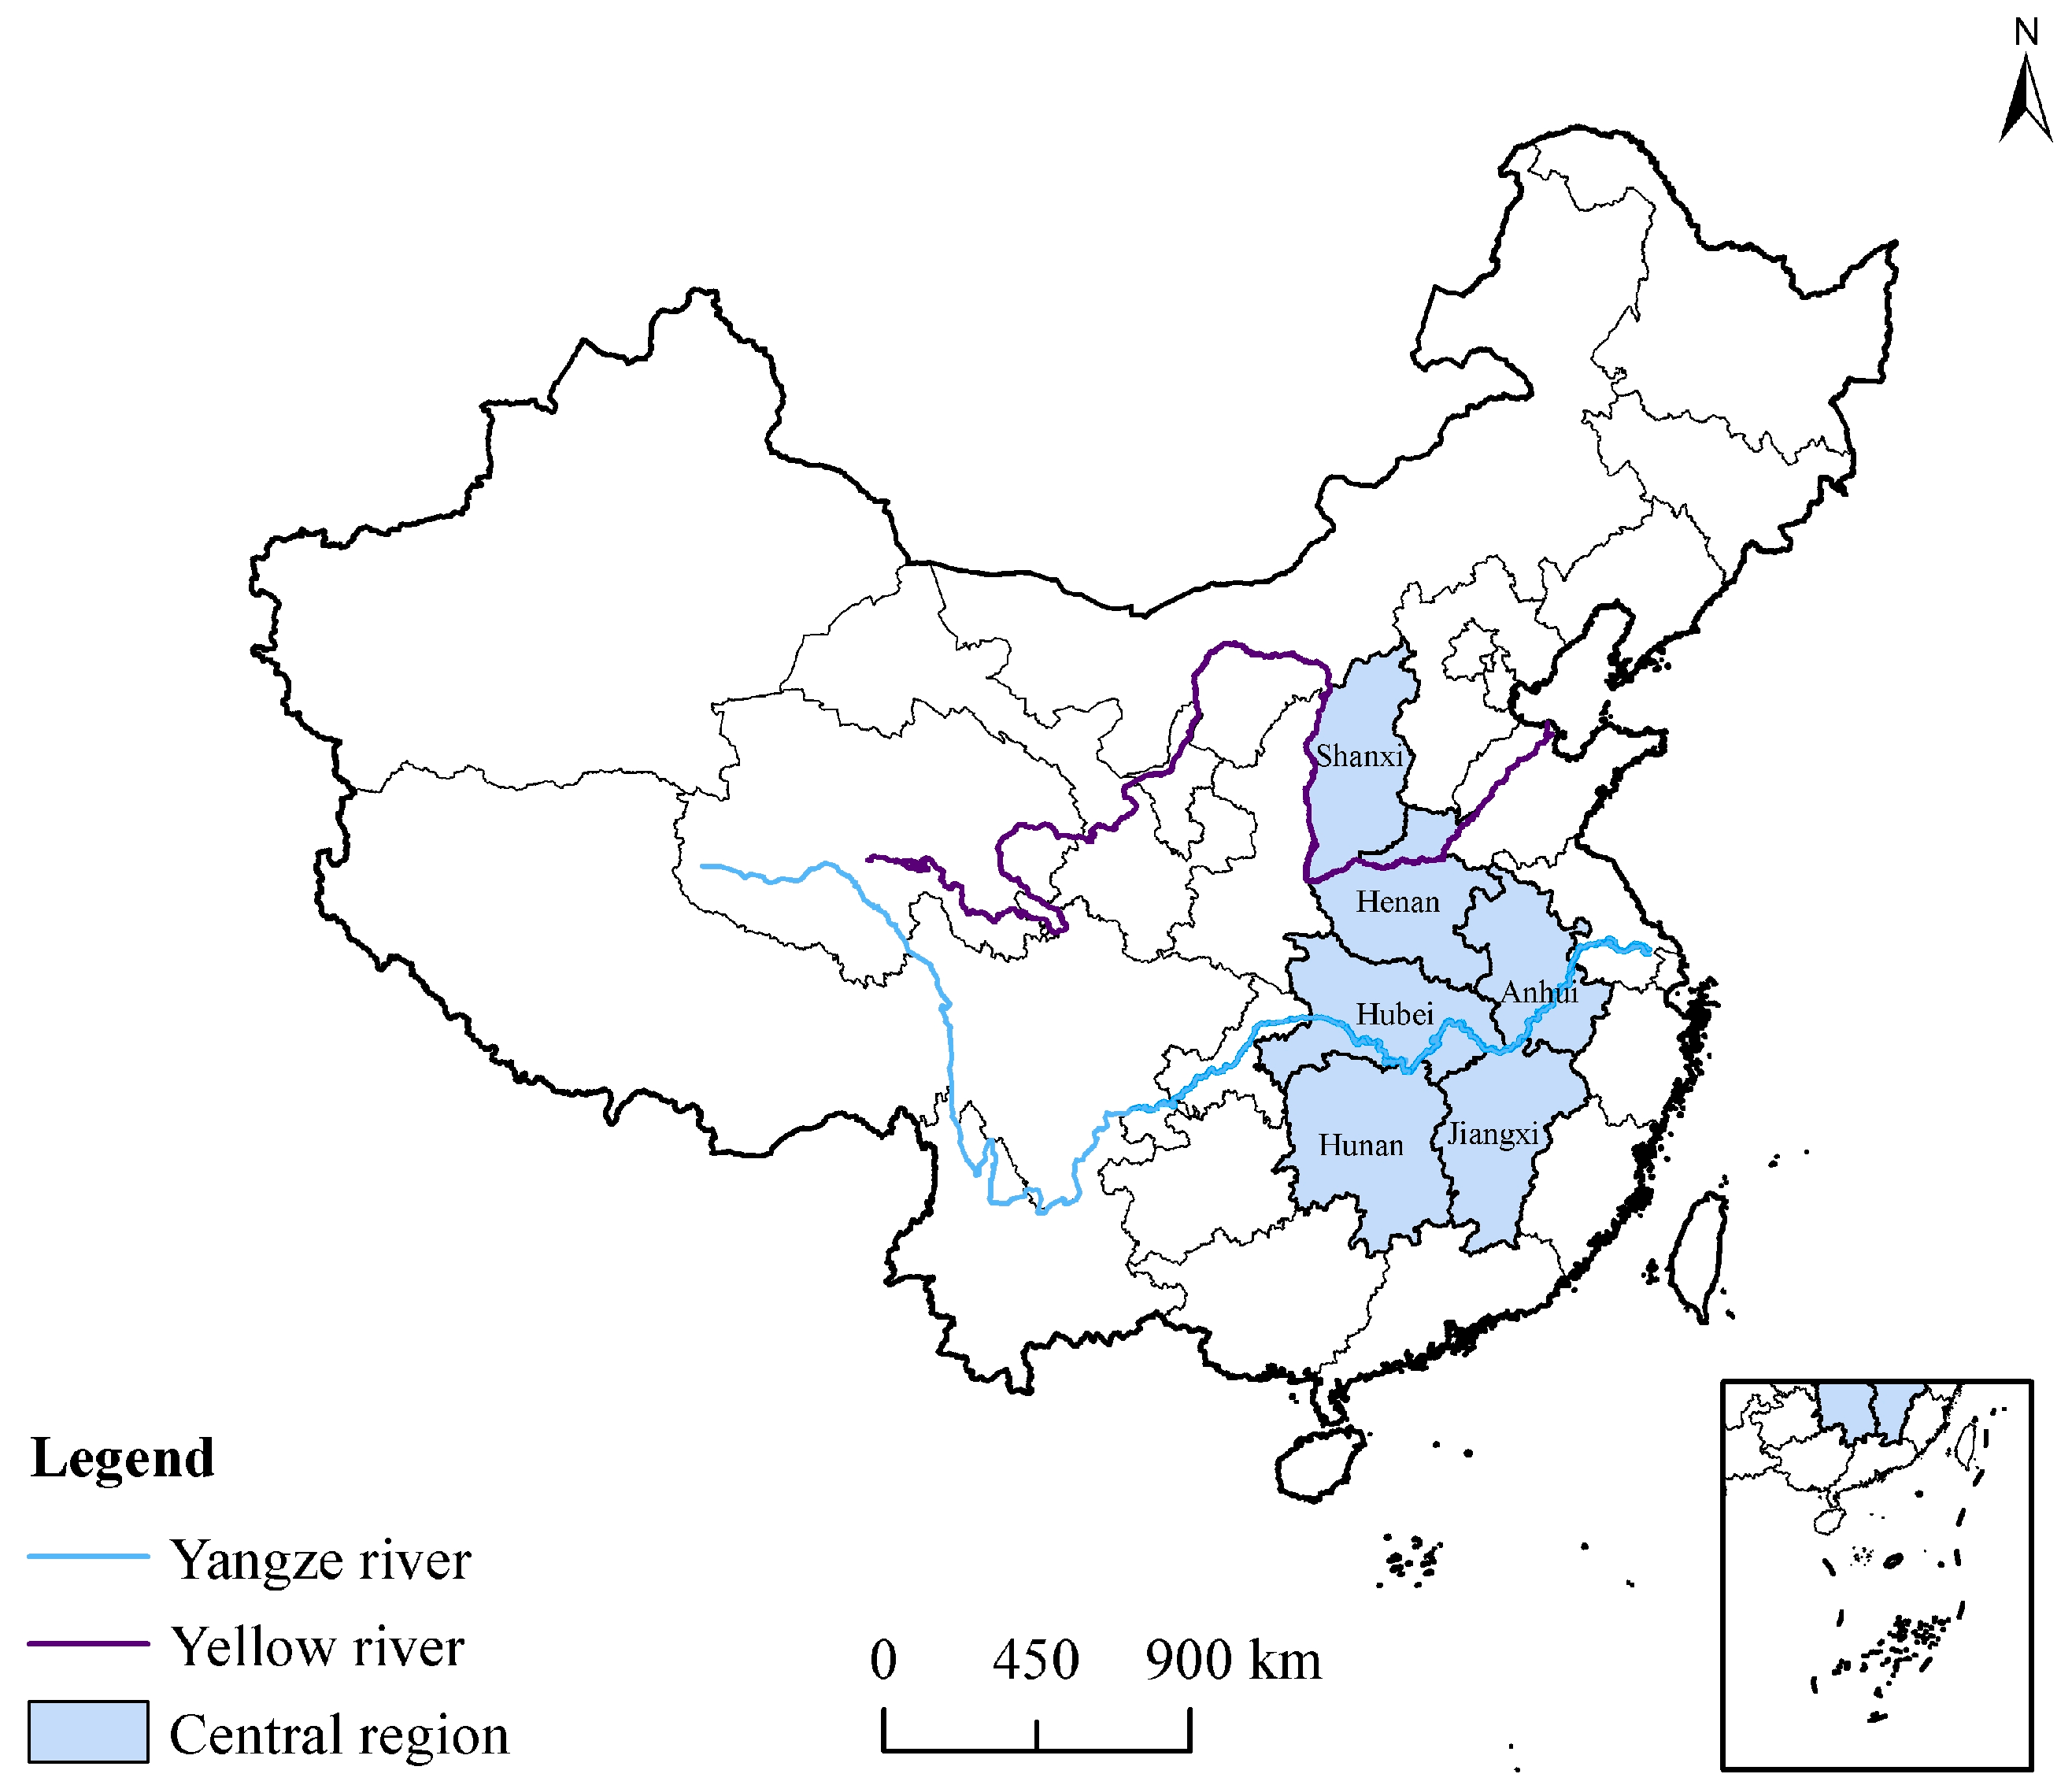
2.2. Study Area and Source of Index Data

The study areas of this study were Shanxi, Anhui, Jiangxi, Henan, Hubei, and Hunan in the Central Region. This is located in the hinterland of China, which connects the Yangtze River Basin and the Yellow River Basin, inheriting the east and enlightening the west. The geographical distribution of the study area is shown in Figure 1.
In this study, 80 prefecture-level cities in 6 central provinces from 2006 to 2019 were used as the research sample (seriously missing data on autonomous regions were excluded). The indicator system for high-quality development was constructed based on five aspects: economic development, steady improvement of efficiency, coordinated regional development, effective ecological governance, and sharing of ecological achievements. The data used in the above index system were from the City Statistical Yearbook, provincial statistical yearbooks, City Construction Yearbook, and some prefecture-level city yearbooks. Finally, the missing data were supplemented using the interpolation method.

3. Research Methods

3.1. Entropy TOPSIS Method

As an objective assignment method, the entropy evaluation method can effectively resolve the inherent conflicts among embedded criteria so as to balance the relationships among evaluation criteria. It adopts the dispersion of data to objectively measure the index weights to obtain more accurate and reasonable evaluation results. With higher accuracy and credibility, the method not only avoids the subjective dependence of the expert scoring method, but also overcomes the limitations of the principal component analysis method, such as being susceptible to the interference of outliers [38]. The entropy weighting method was applied to measure the level of high-quality development in central cities from 2006 to 2019 [39]. First, the extreme value method was used to process the indicators’ dimensionless level. The weight of each indicator in the indicator layer was then determined using information entropy, and the indices of the five dimensions in the criterion layer were calculated [40,41]. Finally, a comprehensive evaluation score was calculated using an objective linear weighted function method. The calculation steps are as follows.
Calculate the proportion of the value of indicator i for index j :
P i j = x i j i = 1 n x i j
Calculate the entropy value for indicator j :
e j = 1 ln ( n ) i = 1 n ( P i j ln P i j )
Calculate the coefficient variation for indicator j :
d j = 1 e j
Calculate the weight for indicator j :
w j = d j j = 1 m d j
Comprehensive evaluation scores: in this study, the comprehensive scores of the five dimensions were calculated using the weighted linear summation method.
s j = j = 1 m w j x i j
where n is the number of central region cities and m is the number of indicators (m = 21, n = 80 in this study); x i j is the dimensionless value of the indicator j for the i city; P i j is the weight of the indicator j for the i city; e j is the information entropy of the indicator j ; d j is the coefficient of variation of the indicator j , which represents the information utility value of a certain indicator, and the larger the d j is, the more importance should be given to the indicator j. w j is the normalized weight coefficient, and s j is the comprehensive evaluation score. Consequently, the higher the comprehensive score, the higher the level of quality development of the city, and the higher the value by dimension, the better the development of the city’s dimensions.

3.2. Dagum’s Gini Coefficient Method

Common methods used to analyze regional disparities are the Theil index and the Dagum Gini coefficient. However, because the Theil index does not consider the cross-sectional distribution of subgroup samples, its analysis of the causes of regional disparities is not comprehensive. Therefore, we used the Dagum Gini coefficient to measure the disparities in urban quality development in the central region. Based on the definition of Dagum [42], the overall Dagum Gini coefficient was defined in conjunction with this study:
G = j = 1 k h = 1 k i = 1 n j r = 1 n h | y j i y h r | 2 n 2 y ¯
where n denotes the number of cities; here, n = 80. y ¯ represents the average value of the high-quality development index of all cities in the central region within each year. k is the number of regions divided, that is, the number of provinces, where k = 6. y j i ( y h r ) represents the level of high-quality development in city i ( r ) in province j ( h ) .
Calculate the Gini coefficient Gjj within province j :
G j j = i = 1 n j r = 1 n j y j i y j r 2 n j 2 y j ¯
Calculate the Gini coefficient Gjh between province j and province h :
G j h = i = 1 n j r = 1 n h y j i y h r n j n h ( y j ¯ + y h ¯ )
where y j i y h r represents the absolute value of the difference in the level of high-quality development within city i ( r ) in province j ( h ) .
The following variables are thus defined:
Q j = n j / n
s j = n j y j ¯ n y ¯
d j h = 0 d F j ( y ) 0 y y x d F h ( x )
q j h = 0 d F h ( y ) 0 y y x d F j ( x )
D j h = d j h p j h d j h + p j h
where Q j represents the ratio of the number of cities in the j province to the total number of cities in the central region, and s j represents the ratio of the total high-quality development levels of all cities in j province to the sum of the high-quality development levels of all cities in the central region. d j h represents the difference in the level of high-quality development between provinces j and h, and can also be defined as the mathematical expectation of the summation of sample values y j i y h r > 0 for all cities in provinces j and h . q j h is the hypervariation of the first moment, representing the mathematical expectation of the summation of sample values yhriyji > 0 for all provinces j and h . D j h reflects the interaction between provinces j and h , which is the mutual influence in evaluating the high-quality development level of provinces j and h in the central region. Function F ( j ) [ F ( h ) ] refers to the cumulative density distribution function of province j ( h ) .
The overall Dagum Gini coefficient G can be decomposed into the intra-provincial disparity G w , inter-provincial disparity G n b , and supervariation density G = G w + G n b + G t , which describes the relationship among the three elements. These three components reflect the reasons for different levels of high-quality urban development in the six central provinces. The formula is as follows:
G w = j = 1 k G j j Q j s j
G n b = j = 2 k h = 1 j 1 G j h D j h Q j s h + Q h s j
G t = j = 2 k h = 1 j 1 G j h 1 D j h Q j s h + Q h s j

3.3. Kernel Density Estimation Method

From the kernel density estimation, a non-parametric method for estimating the density function of random variables can be obtained. It mainly relies on the sample information to provide the best fitting estimation for the data under study, thereby reducing research bias caused by human subjectivity. The kernel density estimation is an effective tool for measuring the spatial imbalance of continuous density curves. The density function of random variable X is assumed to have the following form:
f x = 1 n j l i = 1 n j K ( x j i x l )
where K(x) represents the kernel density function; nj represents the number of cities in province j; Xji represents the independently identically distributed observed values, and x represents the average of observed values; and l represents the bandwidth of the kernel density estimation. The smaller the bandwidth, the higher the estimation accuracy; the distribution of the kernel density curve reflects the level of high-quality development in the central region; the height and width of the peaks in the curve can reflect the degree of agglomeration of high-quality urban development in the central region, and the number of peaks can reflect the polarization of the data; and the tailing degree of the curve can reflect the spatial gap between the cities with the highest or lowest high-quality development level and other cities. If the tail is extended to the right, the difference between cities will be larger.

4. Spatial-Temporal Evolutionary Characteristics and Regional Disparities of High-Quality Development

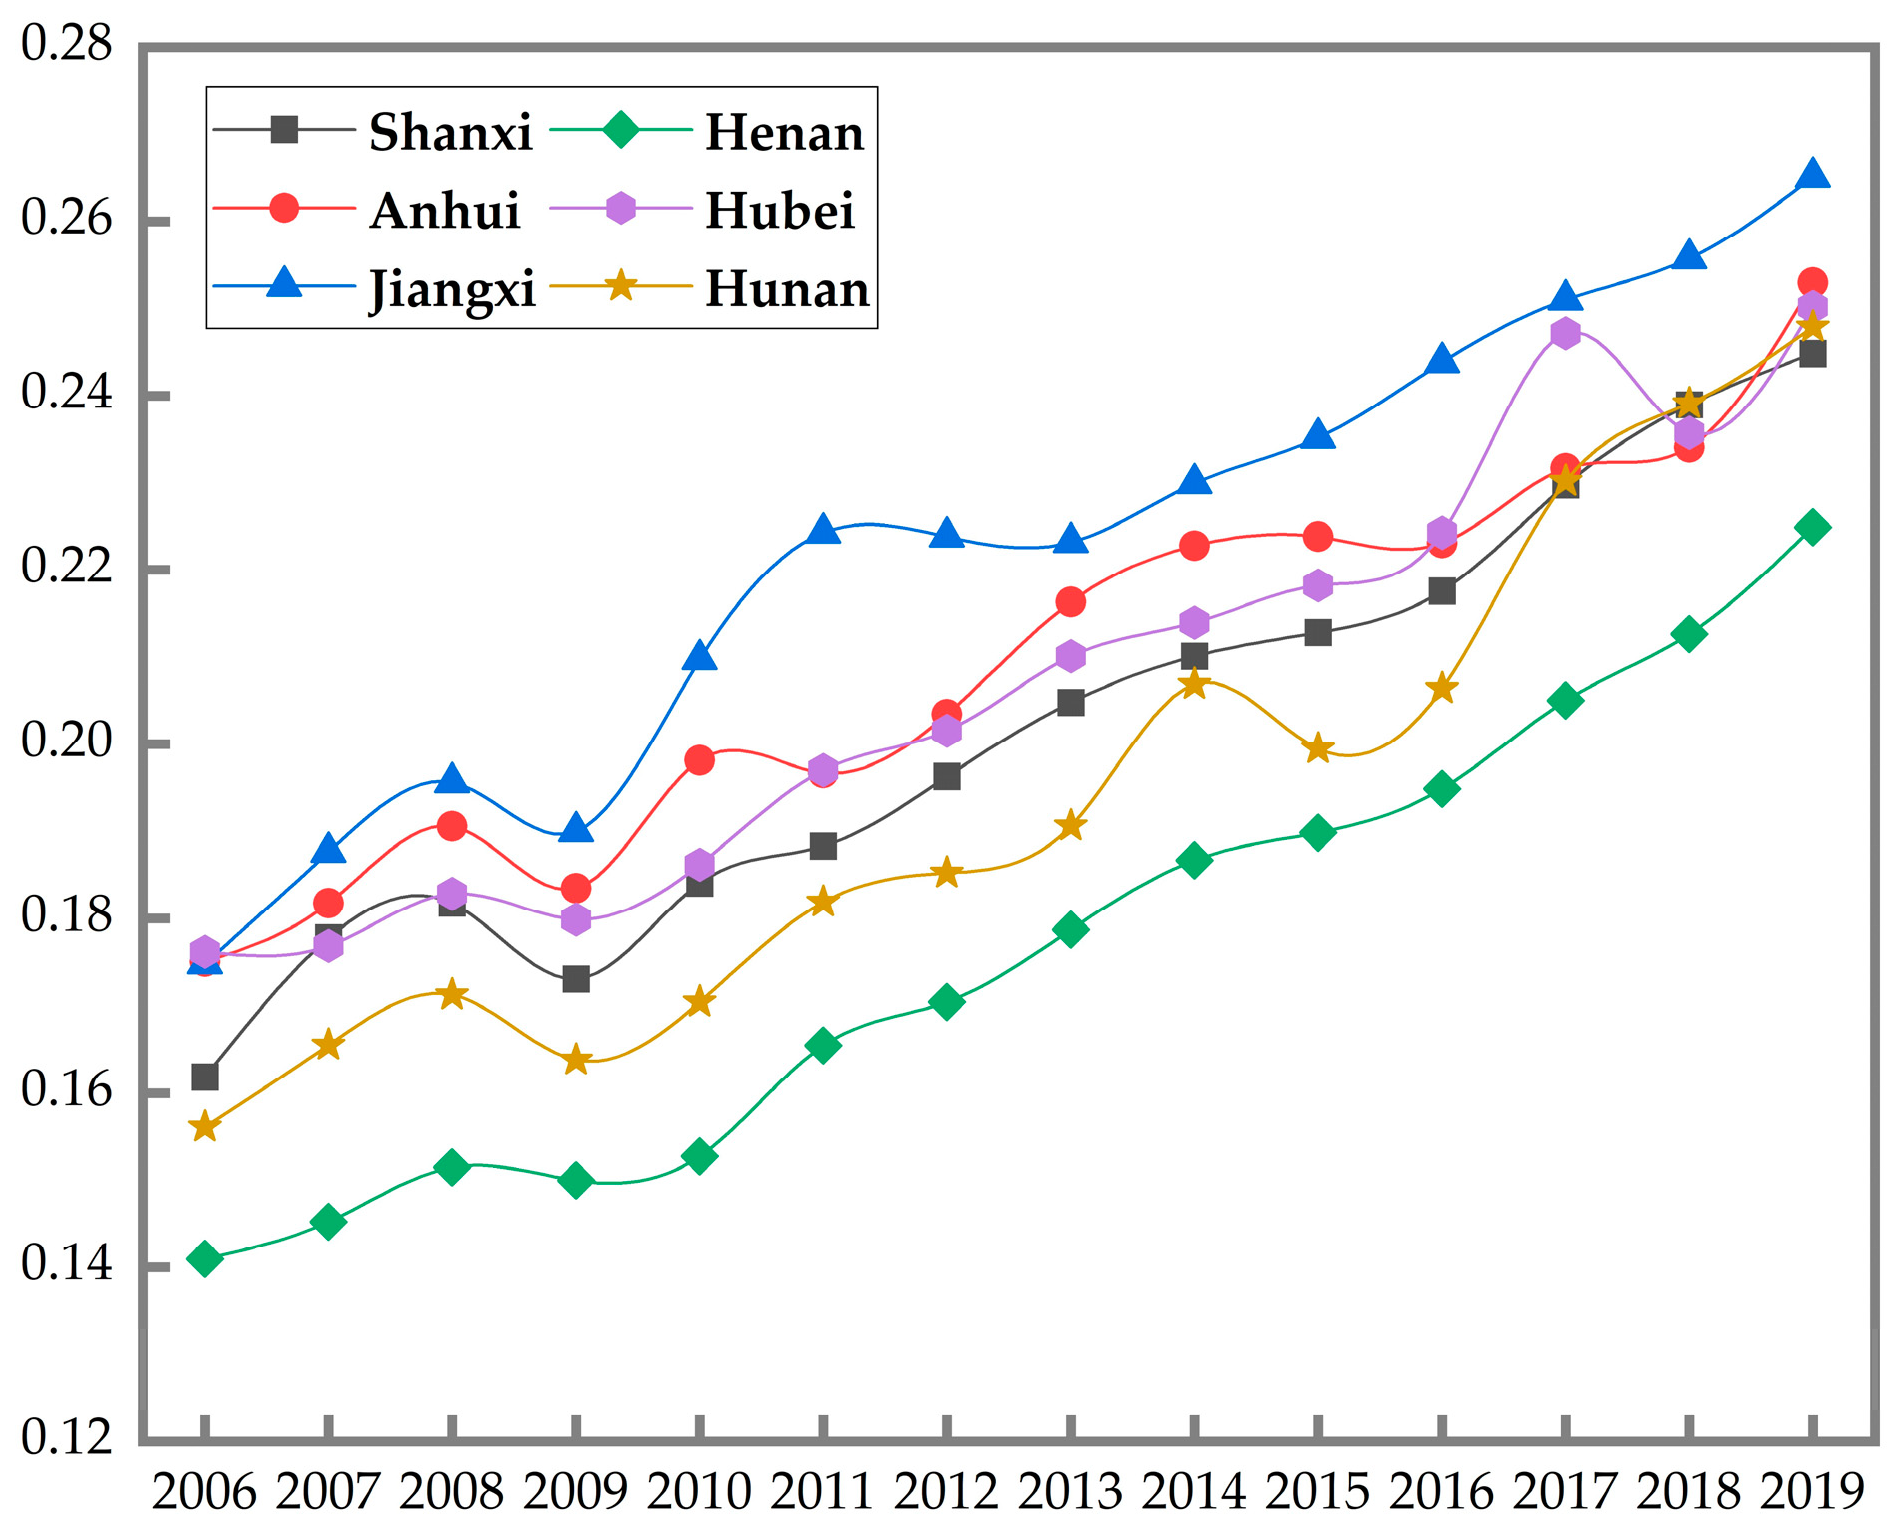
4.1. Time Differences of High-Quality Urban Development

From the perspective of development trends, the overall high-quality development level of cities in the central region during the research period showed an upward trend. However, the degree of increase varied among the provinces, as shown in Figure 2. The city growth rate in Henan Province increased the most, from 0.1409 in 2006 to 0.2249 in 2019, with an overall growth rate of 60.53%. This indicates a good economic development trend in Henan Province in recent years, while emphasizing environmental governance and the sharing of achievements. The city growth rate in Hubei Province increased the least, from 0.1761 in 2006 to 0.2501 in 2019, with an overall growth rate of 43.43%. This may be because, compared with other provinces in the central region, cities in Hubei Province showed a good initial high-quality development foundation, and the degree of improvement was limited. It is thus necessary to find the right focus and strengthen the high-quality development level of cities. In terms of the development level, the cities in Jiangxi and Henan Provinces were consistently ranked first and last, respectively, while the positions of other provinces fluctuated, and the cities in Anhui and Hunan provinces ranked second and fifth in most years. The disparity between Jiangxi Province, which has the highest high-quality development level of cities, and Henan Province, which has the lowest, decreased from 1.2404 in 2006 to 1.1785 in 2019, showing a certain convergence trend.

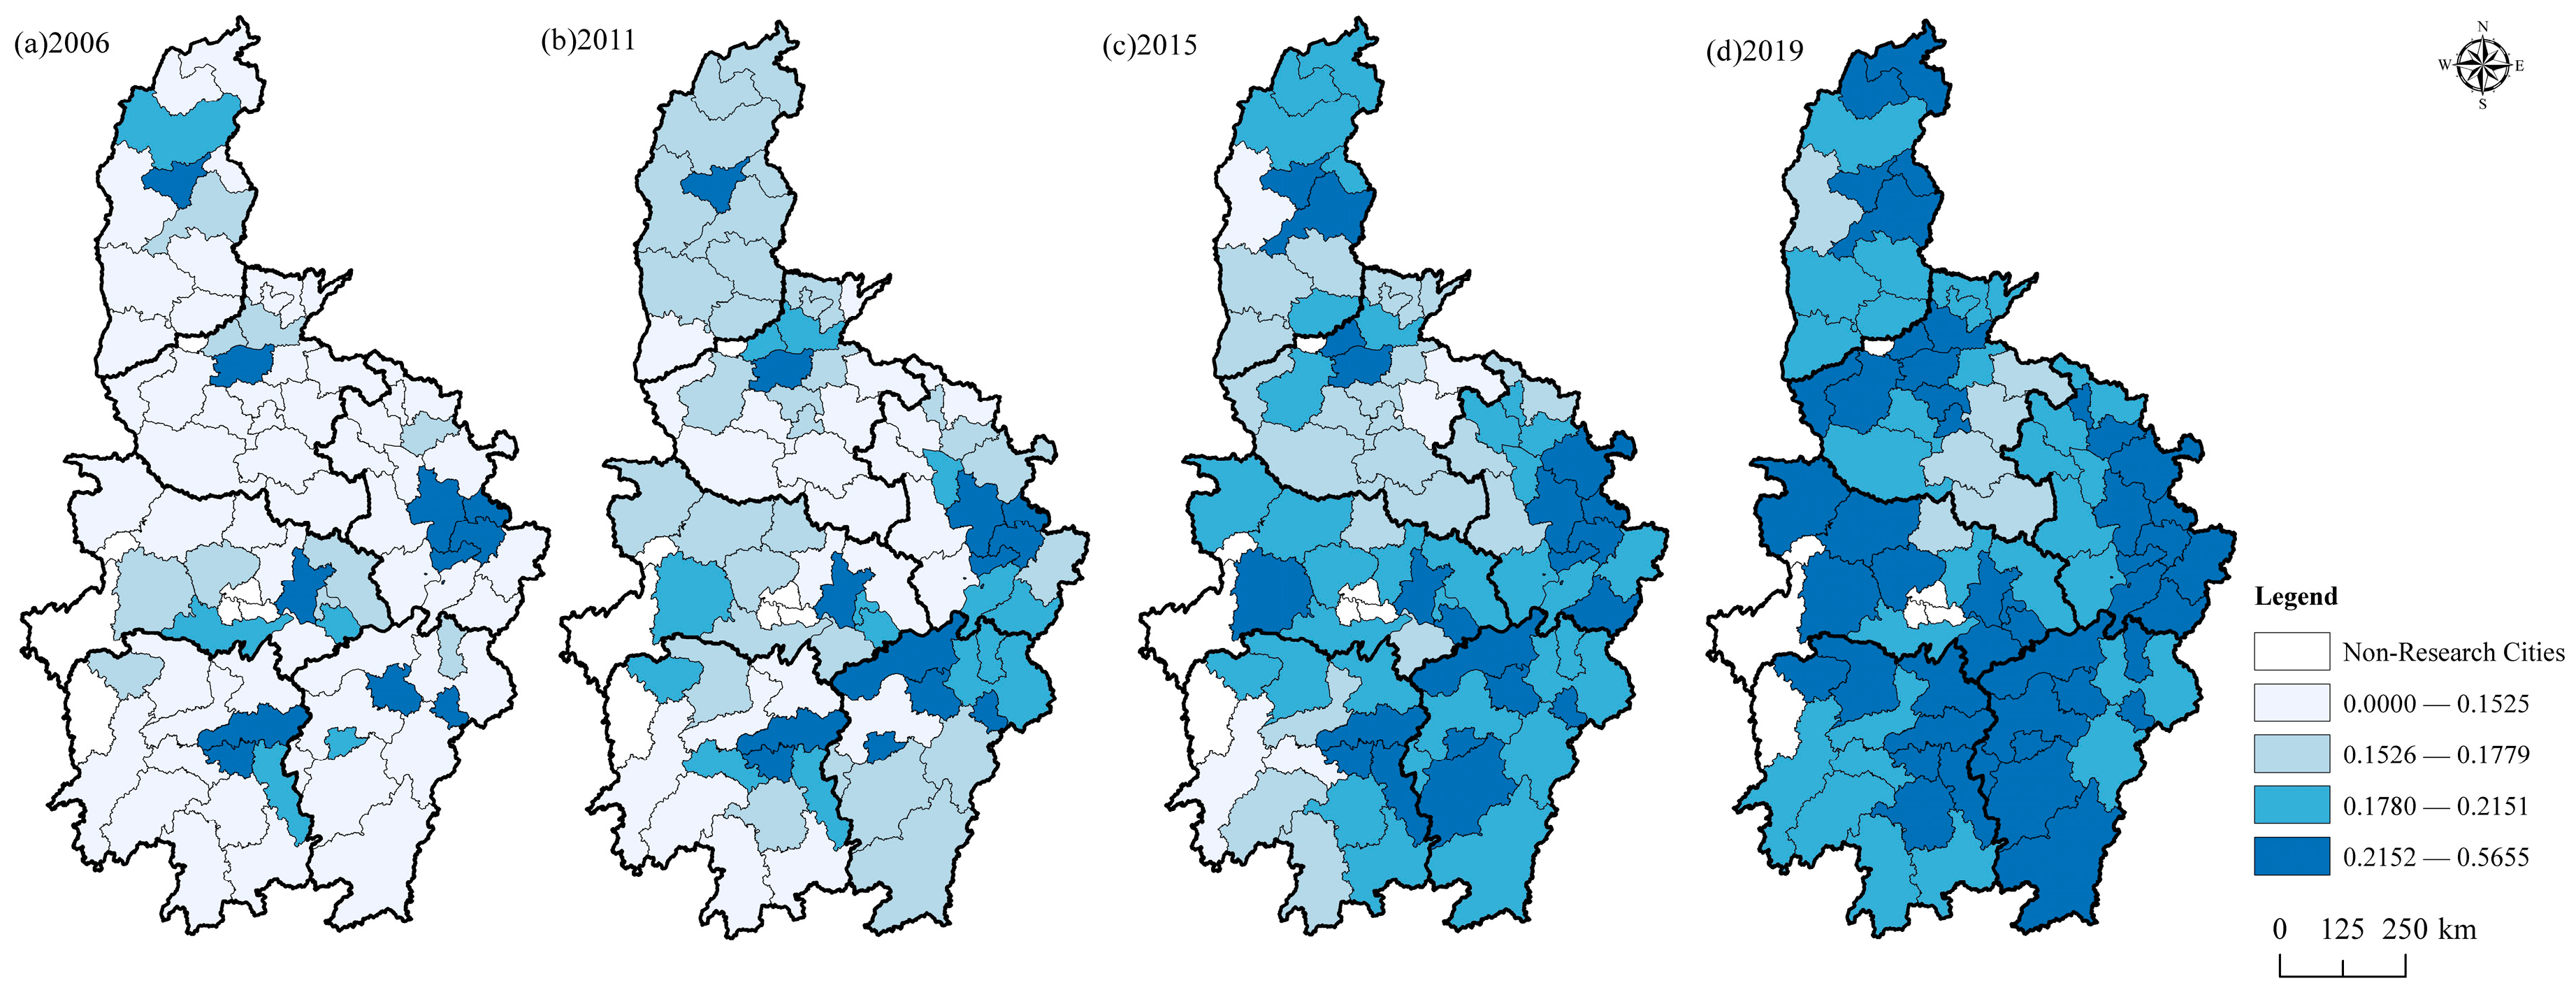
4.2. Spatial Evolutionary Characteristics of High-Quality Development

To better observe the spatial evolution characteristics of the high-quality development level of cities in the central region, the quartile method was first applied to classify the high-quality development level of the entire sample during the study period, followed by visualization and analysis of the high-quality evolution trend of central cities using ArcGIS 10.7 software, as shown in Figure 3. The specific criteria for the quartile method were below 25% for low levels, 25–50% for lower levels, 50–75% for higher levels, and greater than 75% for high levels.
In general, the high-quality development level of cities in the central region showed a universal trend of improvement, with an increasing number of cities reaching high-level grades and the gradual disappearance of those in low-level grades. At the four time points, the numbers of high-level cities were 11, 13, 21, and 46, accounting for 13.75%, 16.25%, 26.25%, and 57.50% of the total, respectively. By comparing the spatial distribution maps at the four time points, significant differences were found in the spatial evolution of high-quality development in the central region, with a basic pattern of aggregation around the core cities and major transportation arteries. Before 2011, high-level cities were mostly scattered and located in provincial capitals. After 2011, high-level cities gradually spread from provincial capitals to neighboring cities, forming high-level clusters driven by the Wuhan Urban Circle, Chang-Zhu-Tan Urban Agglomeration, Poyang Lake Urban Agglomeration, Hefei Metropolitan Circle, and Zhengzhou Metropolitan Circle, with only Shanxi Province having a relatively lower effect. This can be attributed to the fact that the first four city groups belong to the Yangtze River Mid-Lower Reaches Urban Agglomeration, which has a favorable geographic location, high economic interconnectivity, well-established cooperative mechanisms, interconnected industrial chains, and common interests, making it easy for each to play to their strengths and improve their high-quality development level through cooperation. As a national-level central city, Zhengzhou benefits from policy support and favorable location advantages, and its development potential is far greater than that of other cities. The high-speed railway network centered on Zhengzhou promotes interconnectivity among adjacent cities and strengthens its radiating and driving capacities. The driving ability of Taiyuan City for other cities in the province is weak, and the weak linkage between cities is related to the narrow geography of Shanxi Province.
In addition, as is evident in Figure 2, there are significant differences in the high-quality development of cities within each province, revealing clear imbalances. For instance, based on data from 2019, cities with low scores were mainly concentrated in the southern and northwestern parts of Shanxi Province, southeastern Henan Province, western Anhui Province, northeastern Hubei Province, and western Hunan Province, indicating a relatively insufficient driving force for provincial urban agglomerations. Therefore, while focusing on the overall high-quality development of the central region, it is necessary to address the problem of imbalanced internal development to promote the improvement of overall high-quality development through coordinated development.

4.3. Regional Disparities and Causes of High-Quality Development

4.3.1. Overall Variance Fluctuating Downwards

The above analysis shows that there are obvious spatial differences among high-quality urban development in the central region. To further analyze the sources of such spatial differences, we used the Dagum Gini coefficient to measure the overall disparity in the high-quality development of cities in the central region. Furthermore, the changing trends of disparity were analyzed within each province, and the causes of regional disparities were revealed. The results are summarized in Table 6.
As shown in Table 6, the overall disparity in high-quality urban development in the central region showed a narrowing trend during fluctuations. Specifically, after the overall Gini coefficient peaked at 0.1831 in 2007, the overall disparity in high-quality urban development in the central region decreased from 2007 to 2012. There was a trend toward expansion over the next two years. However, in 2015, it gradually decreased to 0.1499. Thus, the overall disparity in high-quality development in the central region during the study period did not show a strict monotonic decreasing trend, and the synergy of development among provinces was weak. To narrow the overall high-quality development disparity, it is necessary to improve regional strategic coordination and cooperation mechanisms, enhance the synergy of policies, and promote mutual integration and supplementation among regions.

4.3.2. Trends and Types of Intra-Regional Differences

As shown in Figure 4, compared with the initial disparity, except for Henan and Hubei provinces, the other four provinces showed a narrowing of the internal disparity of high-quality development, but the change trend was not the same. From the viewpoint of the change trend, it can be divided into three categories. The first is a bimodal trend, in which the internal disparities of these provinces fluctuate significantly, with both large and small disparities in different years. Hubei and Hunan are provinces that reflect deviations in policy implementation consistency. The second is a decreasing trend, represented by the Anhui and Jiangxi provinces, indicating that their internal disparities in high-quality development are narrowing and regional disparities are effectively controlled. The third is a U-shaped trend, represented by Shanxi Province. After a period of narrowing, the internal disparities of high-quality development in Shanxi Province have shown an expanding trend, and attention should be paid to the synergy of internal development in future studies.

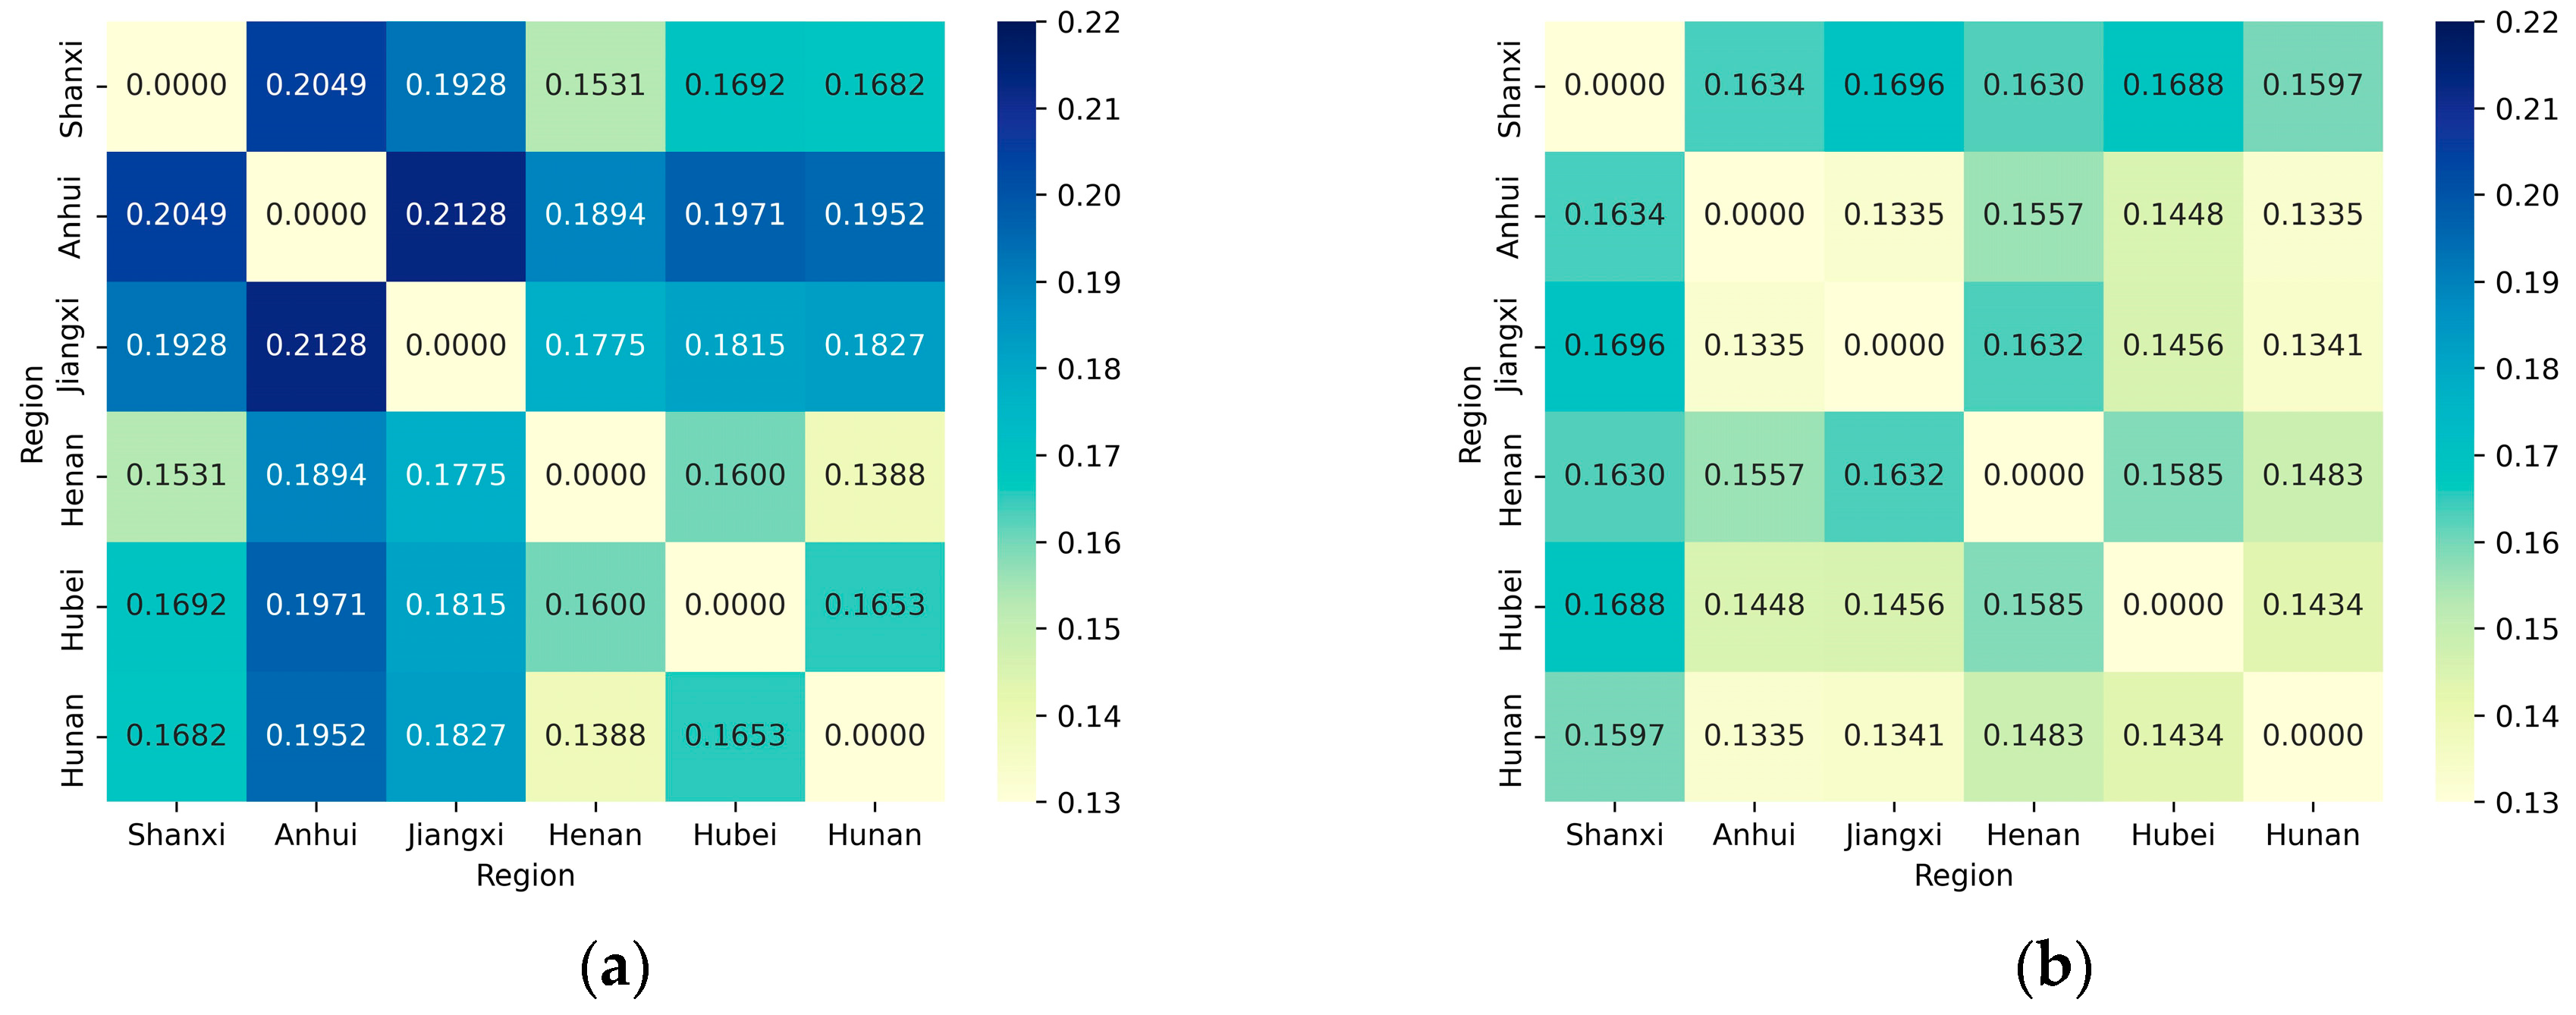
4.3.3. Inter-Regional Disparity Characteristics

Measured using the Gini coefficient, the regional differences in the quality of city development in the central region from 2006 to 2019 are shown in Table 7.
Based on the data in Table 7, the two time points of the base period of 2006 and the final period of 2019 were selected to graph the inter-regional disparity matrix, as shown in Figure 5. The darkness of the matrix color reflected the size of the regional disparities, with darker colors indicating larger disparities between regions. Comparing the difference matrices of the base and final years, the overall color in the final year was lighter than that in the base year, indicating that the disparities in high-quality development among most provinces narrowed during the sample period. The gap between high-quality development in Anhui and Jiangxi decreased the fastest, with an annual decrease of 2.66%. However, the development gap between Henan and Hubei decreased the slowest, almost stagnating, with an annual decrease of only 0.063%. Nevertheless, comparing the colors of the matrices with the same coordinates in the two figures, the color series of some matrices had changed, in contrast to the overall trend, indicating that the gap between some provinces is expanding. Specifically, the development gap between Shanxi and Henan, as well as between Henan and Hunan, is expanding, suggesting that more attention should be paid to reducing the development gap between the north and south.

4.3.4. Inter-Regional Disparity Sources and Contribution Rates

According to the decomposition of the Dagum Gini coefficient differences [43], the contribution of super-variation density during the study period was the main reason for the large development gap in high-quality development in the central region [44,45], followed by inter-regional disparity, as shown in Table 8. Specifically, the contribution of intra-regional disparity remained largely unchanged, increasing from 15.97% in the initial period to 16.04% in 2019, indicating that the overall high-quality development within each province was relatively stable. The contribution of inter-regional disparity decreased from 25.31% in 2006 to 18.03% in 2019. The contribution of super-variation density increased from 58.72% in the initial period to 65.93% in 2019, and the overlap of high-quality development in the central region was the main reason for the high level of urban high-quality development in the central region. Therefore, more attention should be paid to the high-quality spatial unevenness of development and synergistic high-quality development in order to alleviate the regional development disparity.

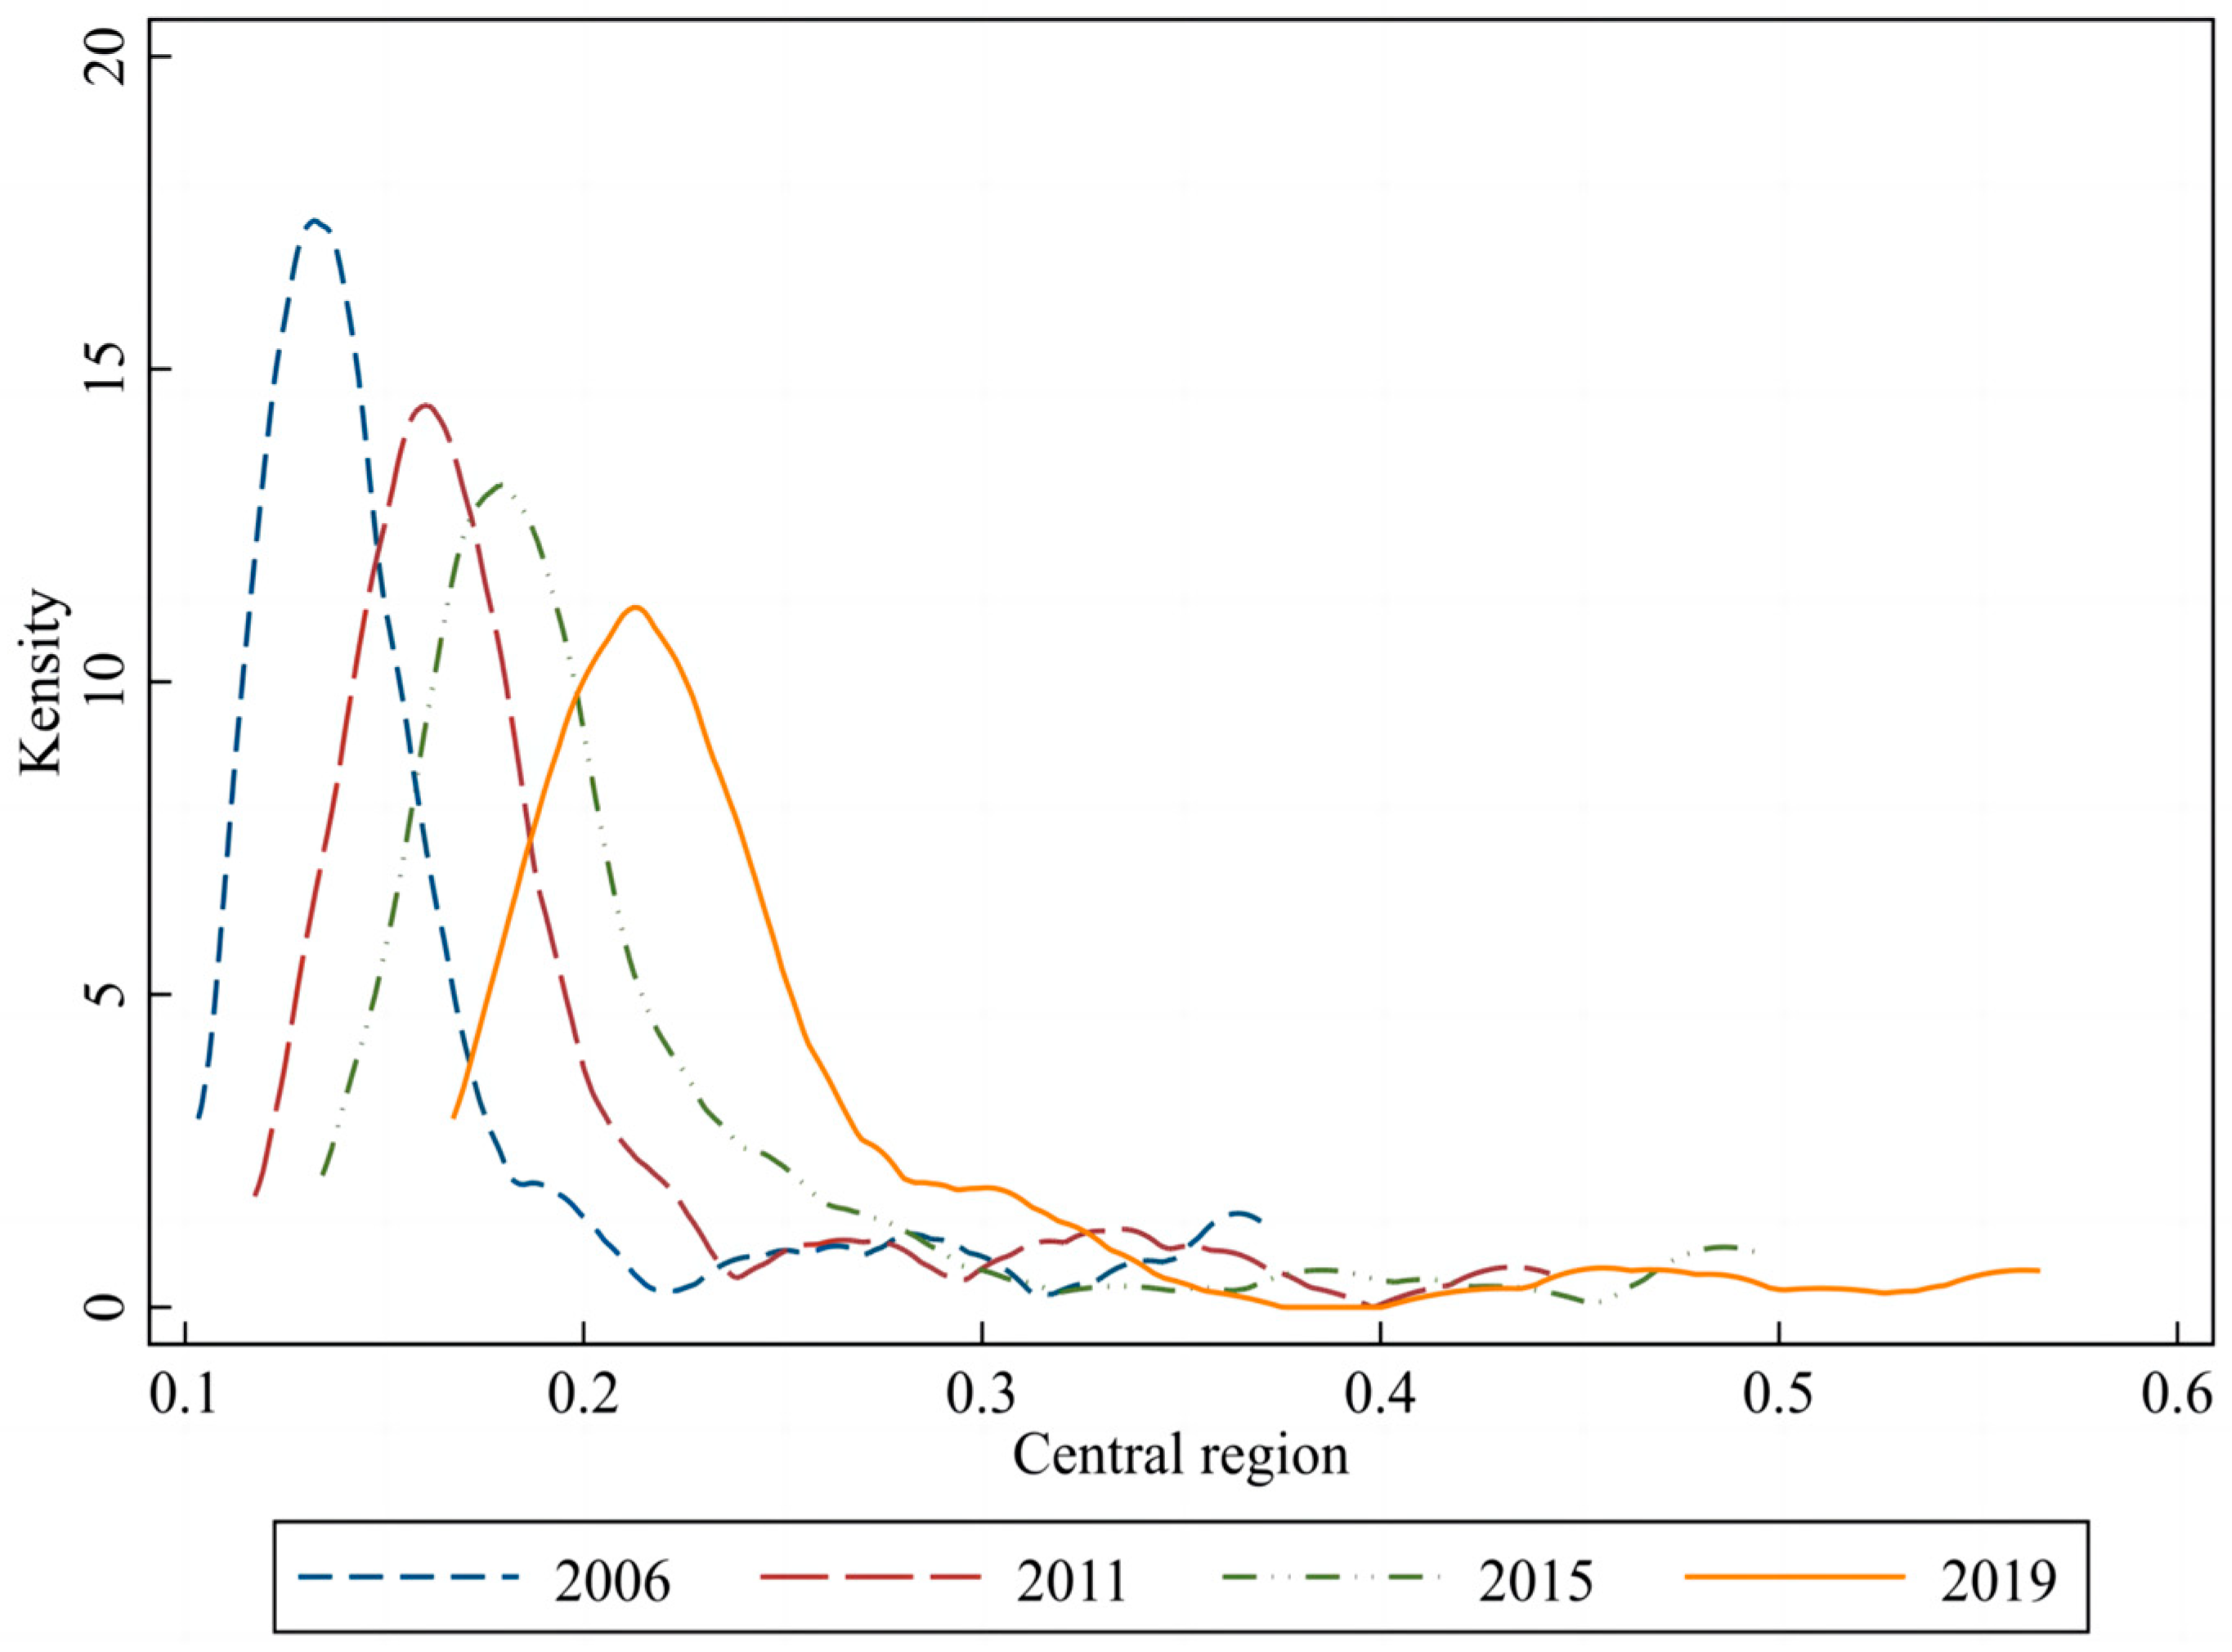
4.4. Nuclear Density Analysis

The Dagum Gini coefficient mainly portrays the relative differences and sources of high-quality urban development in the central region, while the kernel density function can determine the absolute differences in high-quality urban development in the central region through the evolution of curve shapes. Therefore, this section selected four time points, 2006, 2011, 2015, and 2019, and used kernel density estimation to describe the temporal evolution trend and pattern of high-quality development level of cities in the central region. The specific changes are shown in Figure 6.
From the distribution location perspective, the centers of the overall kernel density curves in the central region showed a clear rightward movement. This indicates an upward trend in the overall level of quality urban development in the central region. This fact is mutually verified with the previous description.
From the distribution trend perspective, the overall kernel density curve for high-quality urban development in the central region showed a declining peak value and a gradually increasing width, indicating an expanding trend of absolute differences in high-quality urban development in the central region.
From the distribution extension perspective, the overall central region has alleviated its tailing situation, moving relatively closer to the center, showing a converging trend. This means that cities with lower high-quality development levels within the region have improved and are approaching the average development level of the region, making development more coordinated.
From the distribution polarization perspective, polarization in the central region as a whole was more pronounced in 2006, 2011, and 2015, with the main peak value higher than the side peak value, and the polarization gradually weakened.

4.5. Spatial Correlation Analysis

The purpose of spatial autocorrelation analysis is to study the spatial correlation of the level of quality development of cities in each province. The Moran index is often used to measure the correlation between adjacent regions, with values ranging between (−1, 1). When the Moran index is greater than 0, it indicates a positive correlation and a clustering effect between the urbanization level of the observation area and its neighboring areas. A higher value indicates a stronger spatial correlation. Conversely, when the Moran index is less than 0, it suggests a negative spatial correlation between the observation area and its neighboring regions. When the Moran index is 0 and the test result is significant, it indicates that the distribution of high-quality development levels in the observation area is independent and random.
The high-quality development levels across regions are not independent or random but have spatial dependence and heterogeneity. Therefore, this study utilizes the Moran index to conduct global spatial autocorrelation analysis and reveal the spatial clustering pattern of high-quality development levels in the central region. Considering that factors such as the economy, culture, and institutions also participate in spatial economic activities and mutually influence each other, solely defining spatial relationships based on geographical distance may introduce bias. Hence, this study establishes an economic distance spatial weighting matrix and employs STATA 16.0 to conduct the global Moran’s test on the high-quality development levels in the central region, aiming to examine the spatial correlation between variables. The results are shown in Table 9. It can be observed that, overall, the Moran’s I for the high-quality development levels in the central region was greater than 0 and passed the significance test at the 1% level, indicating a positive spatial correlation within the global spatial domain of the study subject.

5. Problem Area Identification and Optimization Suggestions for High-Quality Development

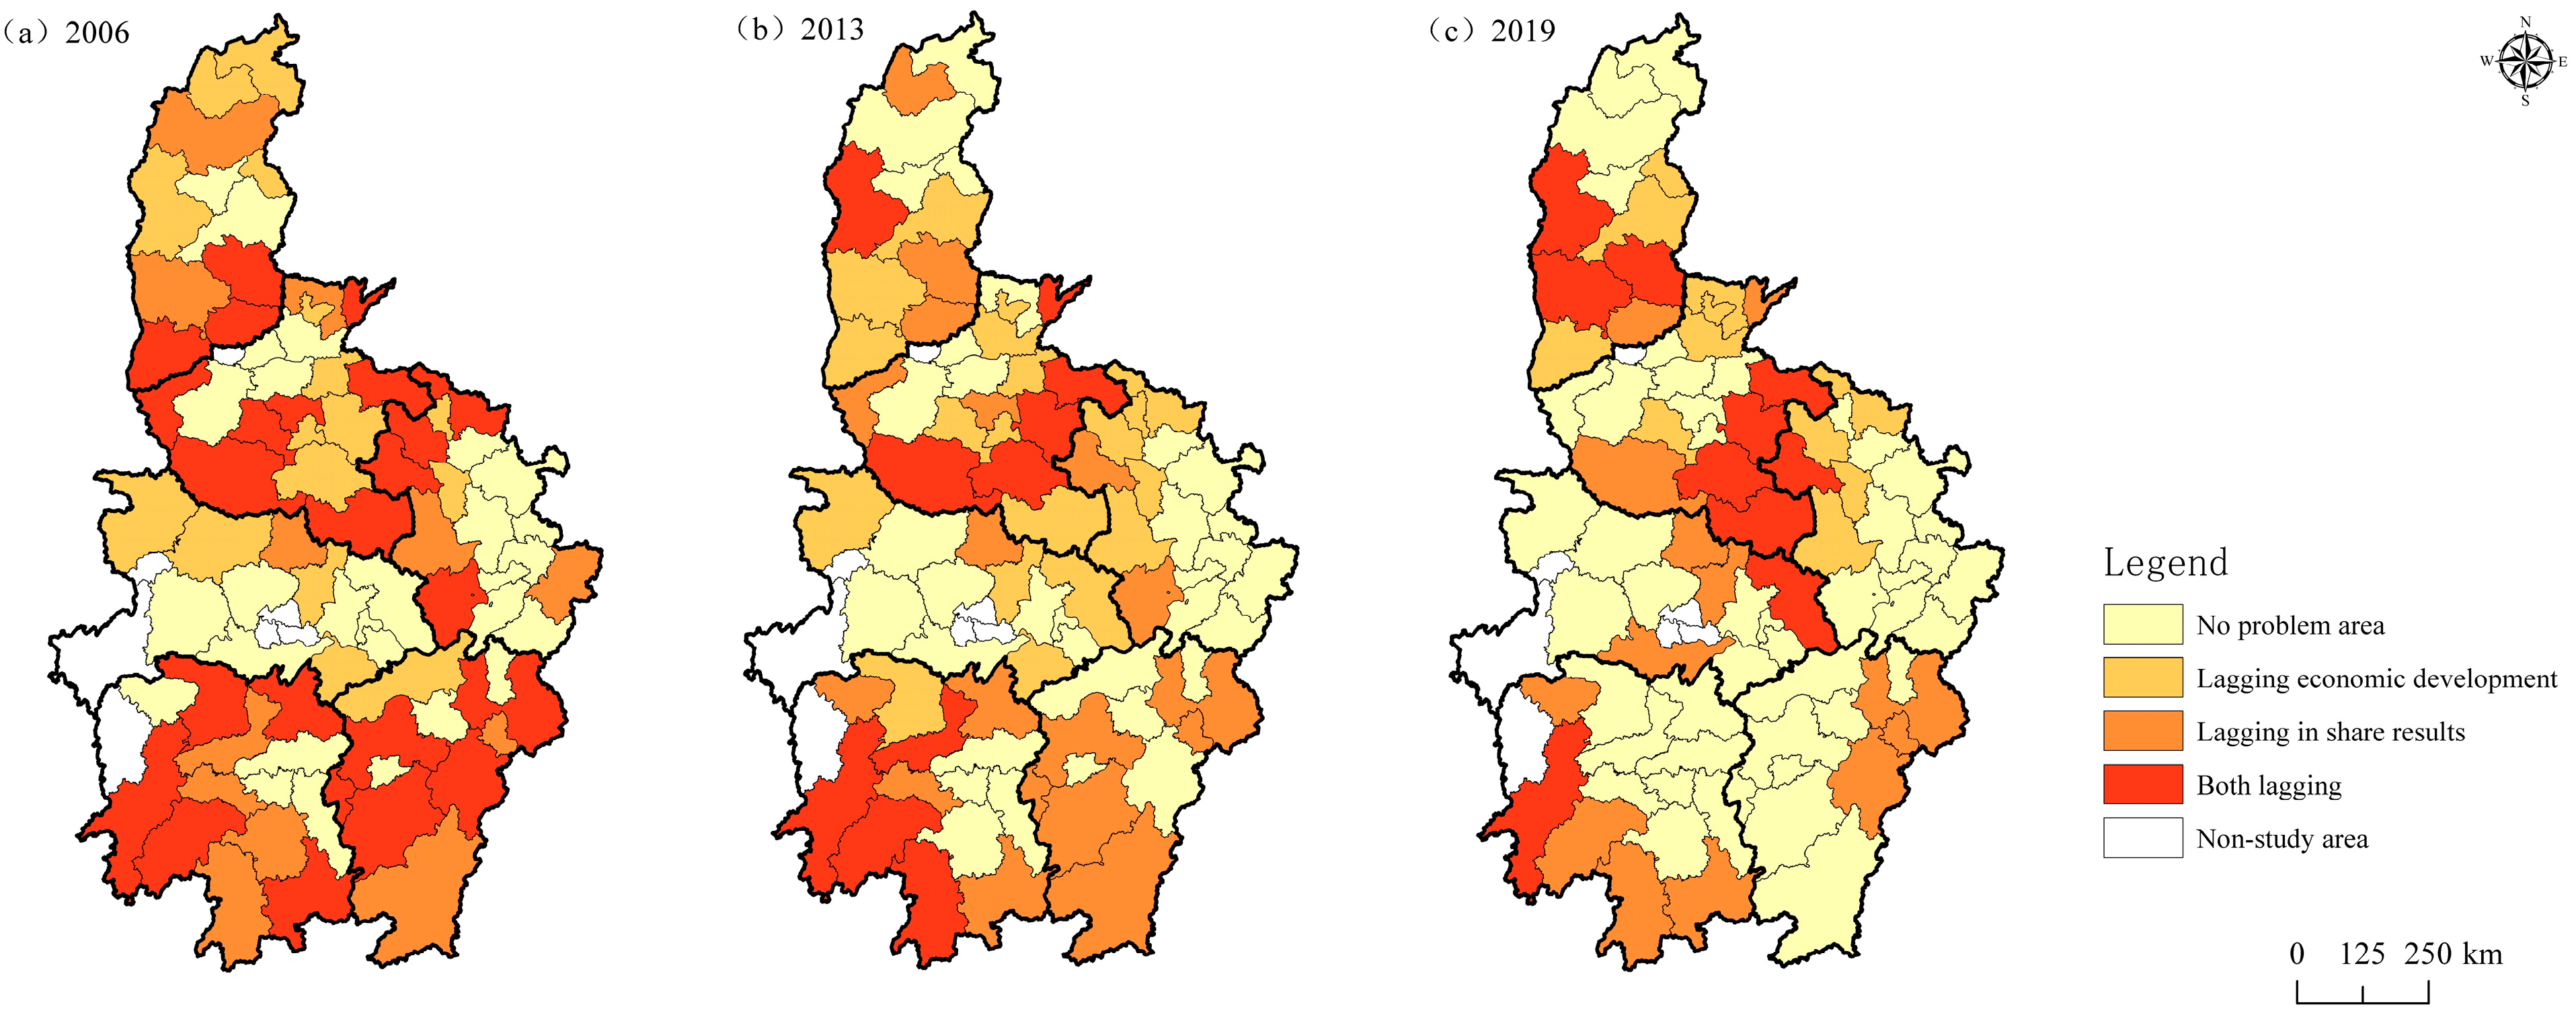
5.1. Problem Area Identification

Enhancing high-quality development relies on balanced improvements in different dimensions. The overall improvement in high-quality development is bound to be affected if the development processes of different dimensions are inconsistent. Therefore, it is necessary to refine the problem areas for the high-quality development of cities in the central region. Considering that different cities in the central region have different resource endowments, economic development, policy biases, and other heterogeneous characteristics, it is feasible to start from different dimensions and conduct a cluster analysis of different city levels in each dimension [46]. By utilizing ArcGIS software, a visual analysis of the problem areas can be conducted to intuitively demonstrate the weaknesses of high-quality development in each city [47], as shown in Figure 5.
To identify the main problem areas, we calculated the scores of the five secondary indicators separately as independent systems. Drawing on the research findings of Li et al. [48], we divided the problem areas and designated cities in which the five dimensions were below 70% of the regional average as problem cities. We then conducted a cluster analysis on these cities to reveal specific problems and analyzed the causes of the gap in the high-quality development of cities in the central region from the perspective of identifying problem areas. From there, three years, 2006, 2013, and 2019, were selected for excerpts of cities lagging in development in each dimension. It can be seen from the extracted results that the main problem dimensions were lagging economic development, ecological governance, and outcome sharing. The lag between efficiency improvement and coordinated development can be ignored. The lag in ecological governance showed a relatively random distribution. For example, in the early stages of the examination, cities with lagging ecological governance were mainly concentrated in Anhui Province, whereas in 2019, cities with lagging ecological governance were concentrated in Henan Province. Most problem cities performed poorly in high-quality development because of lagging economic development, outcome sharing, and slow development caused by both.
Based on the above classification of problem dimensions, three time points (2006, 2013, and 2019) were selected to visualize and express the types of cities lagging in economic development, achievement sharing, and both through ArcGIS software, as described in Figure 7. The results indicated that 52, 47, and 34 cities had problems in different dimensions in 2006, 2013, and 2019, respectively, accounting for 65%, 58.75%, and 42.50% of the cities studied, respectively. The number of cities with problematic attributes decreased, indirectly reflecting an improvement in the high-quality development of central cities. From the subdimensions, we can see that the differences in economic development and sharing of results were relatively large within each year; therefore, the number of problematic cities due to uneven development in these two dimensions accounts for the absolute proportion.

5.2. Optimization Suggestions Based on Problem Areas

(1) Types of cities lagging in economic development.
In 2006, 2013, and 2019, the number of cities with lagging economic development was 16, 19, and 11, respectively, accounting for 30.77%, 40.42%, and 32.35% of the problem cities, respectively, showing a downward trend in general. This type of city did not have problems in other dimensions, but had relatively low economic development, which has led to the current situation of relatively slow development of high-quality cities; the area is widely distributed and includes core city clusters and provincial border areas. Taking 2019 data as an example, cities with lagging economic development included Yangquan, Yuncheng, Anyang, Hebi, Xinxiang, Bozhou, and Huainan, most of which are resource-based cities with weak initial economic foundations and high reliance on heavy industry. The phenomenon of unreasonable industrial structure has existed for a long time, which has led to slow economic growth and slowed the pace of high-quality development. In the future, economic development should be emphasized. Economic construction is still a prerequisite for future development. To solve various residual problems in the development of resource-based cities, abandoning high-polluting, high-emission-heavy industries, upgrading traditional industries, and cultivating and growing new industries is an urgent concern. Key platforms need to be built, such as smart steel, in terms of steel and building materials, energy and chemical industries and other process-oriented industries. By the implementation of these measures, we can promote the digital monitoring and management of production processes. Meanwhile, this can also speed up development, expand the scale and increase the proportion of other emerging industries, such as information technology, new materials, new energy, high-end equipment, biology and new medicine. Traditional industries should be guided towards the high-end value chain so as to enhance industrial development momentum.
(2) Type of cities lagging in results sharing.
The number of cities with lagging results shared at the three time points was 12, 18, and 13, accounting for 23.07%, 38.29%, and 38.24% of the problem cities, respectively. In general, this is consistent with the change in lagging economic development, which showed an overall downward trend. In terms of distribution range, this type of city was distributed across all provinces with a relatively discrete distribution, and included Jincheng, Nanyang, Shiyan, Huaihua, Shaoyang, and Ganzhou. Most of these cities were in poor counties in the region and, relatively speaking, they had large mountainous areas and poor traffic accessibility, which led to poor economic development benefits and insufficient government financial income. This makes ensuring stable and effective growth in social construction investments difficult. On the one hand, the central region can rely on its natural advantages to enhance development, such as biological resources, agricultural resources, national cultural resources, and so on. It should strive to develop the industrial chain and explore the agricultural brand of poor areas. On the other hand, increasing the rate of fiscal expenditure in education, health care, transportation and other public services will have a significant effect. It is fundamental to safeguard people’s basic life, basic rights, and interests, making development results more beneficial for the people.
(3) Cities lag in both economic development and sharing results.
The number of cities of both economic development and fruit sharing lagging types at the three time points was 24, 10, and 10, accounting for 46.15%, 21.27%, and 29.41% of the problem cities, respectively, showing a decreasing trend, but the numbers of this type of city did not change after 2012. In terms of spatial distribution, this type of city has transformed from a momentum of sweeping through to a scattered distribution and is becoming increasingly concentrated. Taking data from 2019 as an example, the problem cities of this type were concentrated in the southern part of Shanxi Province, the junction of the Henan, Hubei, and Anhui provinces, and Huaihua, with resource-based cities and mountainous areas as the main characteristics. The industrial structures of these cities were slow to upgrade, the level of economic development was low, and the proportion of the central transfer payments was high. Local governments lacked sufficient matching funds for economic construction and social governance, leading to development lagging in these two dimensions compared to others. The root cause of this problem is rational resource allocation. This type of city needs to draw the attention of governments at all levels to prevent the aggravation of the problem.
In summary, slow economic development, the slow sharing of achievements, and slow joint development result in slow high-quality development, which is essentially caused by slow economic development and a lack of industrial advantages. This lack of market competitiveness makes it difficult for fiscal revenue to grow steadily.
The spatial distribution of the three types of lagging cities can be divided into two categories. (1) Peripheral areas of core cities such as Lvliang, Yangquan, Xinxiang, Kaifeng, Huainan, Huanggang, Xiaogan, Loudi, and other cities. These cities are mostly adjacent to provincial capital cities, which are easily affected by the siphoning effect of the core cities, making it easy for the resource elements of their own development to gather in core cities with perfect infrastructure, thereby affecting their own technological progress and industrial upgrading. For these cities, the higher-level government needs to formulate city cluster planning at the macro level, explore appropriate cooperation mechanisms within the region, effectively undertake the industrial transfer of core cities, and avoid the expansion of the siphon effect. (2) Cross-provincial border or edge regions. These cities are mainly distributed in southwestern Shanxi and the border areas of Henan, Anhui, Hubei, and Xiangxi. These areas are far from the core cities, have similar industrial structures, serious homogenization, and slow transformation of growth momentum, and are subject to serious market segmentation under different provincial managements. These areas must rely on policy guidance, optimize transportation and other infrastructure conditions, break down administrative barriers, and increase the degree of economic integration.

6. Conclusions and Policy Implications

The strategic significance of promoting high-quality development in the central region, based on its new stage of development, cannot be underestimated. It is imperative to explore how to measure the level of high-quality development in the central region, as it can serve as a policy basis for subsequent regional development efforts. To address this, the present study utilized a set of 21 fundamental indicators from 80 prefecture-level cities in the central region spanning from 2006 to 2019. By employing the entropy method, the study calculated the level of high-quality development for each city and analyzed their spatial-temporal evolution patterns, as well as problem dimensions. The conclusions drawn from the aforementioned studies are as follows. First, the overall trend of high-quality development in the cities of the central region exhibited an increasing pattern. However, significant spatial imbalances persist, with highly developed cities tending to cluster around core urban areas, while the driving effect of the Shanxi provincial urban agglomeration remains insufficient. Second, the overall disparity in high-quality development among cities in the central region has gradually narrowed, displaying a certain degree of convergence. Except for Henan and Hubei, the internal disparities within the remaining four provinces have been diminishing. The lack of coordination in development has consistently been the primary factor contributing to the large disparities in high-quality development within the central region. Third, the main obstacles hindering the current high-quality development of cities in the central region are lagging economic development and the delayed sharing of achievements.
Based on the findings, we posit that the dilemma of high-quality development in the central region lies in the coordination of resources among provinces and municipalities. Therefore, this study presents the following policy recommendations.
Enhancing policy synergy is essential for high-quality development in the central region. The essence of high-quality development in the central region remains an issue of regional collaborative governance. Currently, the central region lacks effective cooperative mechanisms. To tackle this issue, the region should emulate the three-level operation mechanism of “decision-making, coordination, and implementation” employed in the Yangtze River Delta and the annual consultation conference of provincial capitals in the Yangtze River Economic Belt. Regular joint meetings of central provinces should be held to discuss the feasibility of key cooperation areas and related policies in the recent stage; to remove administrative barriers; to give full play to respective comparative advantages; and to consolidate the important advantages of the central region as an important hub for food production, energy and raw materials, modern equipment manufacturing, and comprehensive transportation. Efforts should be made to improve the construction of factor markets, and especially to expand the interconnection of public services such as transportation and education, and improve the degree of integration.
Second, the overall high-quality development of the region can be enhanced by expanding the spillover effect of core cities and improving the intercity correlation. Presently, core cities within the region should establish their own advantageous industries based on their own resources, location, and policy advantages, while playing a leading role in innovation to promote the transformation and upgrading of traditional industries and the development of emerging industries. This will allow them to continuously develop as growth poles of regional development. Additionally, by utilizing the comprehensive advantages of core cities as a starting point, regional cooperation mechanisms should be constructed and improved to form a radiation circle with the surrounding nodal cities. This will allow the sharing of resources, technology, and experience and clarify the functional orientation and industrial layout of each city within the circle. By doing so, homogeneous industries within urban clusters can be reduced, complementary advantages can be achieved, and the positive spillover of core cities can be expanded from economic, environmental, and social perspectives.
Third, to promote the coordinated development of the regional economy, it is crucial to coordinate and refine the three-level distribution system and ensure the equitable allocation of regional resources. Lagging economic development and fruit sharing are the primary factors preventing further breakthroughs in high-quality development in the central region. Furthermore, there is a close nexus between economic development and the equitable distribution of resources. Resource-based cities such as Lvliang, Yangquan, Hebi, Huainan, and Bozhou need to proactively introduce advanced technology and talent, innovate and empower traditional industries, upgrade industrial chains, and increase industrial added value while relying on their mineral resources. At the same time, they should prioritize new infrastructure such as 5G networks and big data to improve transportation and data network construction, provide convenient conditions for absorbing factors and industry transfer, and augment the endogenous driving force of economic growth. However, cities that have performed poorly in sharing results, such as Jincheng, Nanyang, Suizhou, Xiaogan, Shangrao, and Yongzhou, should prioritize economic development while increasing the proportion of fiscal expenditures on social welfare in accordance with their current situation. To ensure that the starting point, process, and results of income growth are fair, and to enhance residents’ senses of well-being, we need to focus on enhancing livelihood security and improving education, transportation, and medical poverty alleviation efforts in rural and remote mountainous areas.

Author Contributions

Conceptualization, methodology, investigation, visualization, writing—original draft, M.Z.; resources, methodology, supervision, funding acquisition, R.Z.; supervision, and funding acquisition, H.L.; data curation, writing—review and editing, X.Z.; software, data curation, Y.W. All authors have read and agreed to the published version of the manuscript.

Funding

This research was funded by the Beijing Natural Science Foundation (No. 9222026), and the China University of Mining and Technology (Beijing) Yuezaki Young Scholars Funded Project (No. 800015Z1121).

Institutional Review Board Statement

Not applicable.

Informed Consent Statement

Not applicable.

Data Availability Statement

The data presented in this study are available on request from the corresponding author.

Conflicts of Interest

The authors declare no conflict of interest.

References

  1. Wei, Y.; Li, H.; Yue, W. Urban land expansion and regional inequality in transitional China. Landsc. Urban. Plan. 2017, 163, 17–31. [Google Scholar] [CrossRef]
  2. Frank, J.; Martinez-Vazquez, J. Decentralization and Infrastructure in the Global Economy; Routledge: London, UK, 2015; pp. 136–180. [Google Scholar]
  3. Salas, J.; Yepes, V. Enhancing Sustainability and Resilience through Multi-Level Infrastructure Planning. Int. J. Environ. Res. Public Health 2020, 17, 962. [Google Scholar] [CrossRef] [PubMed] [Green Version]
  4. Li, G.; Guo, F.; Di, D. Regional competition, environmental decentralization, and target selection of local governments. Sci. Total Environ. 2021, 755, 142536. [Google Scholar] [CrossRef] [PubMed]
  5. Jin, F.; Ma, L. The Direction and Path of Green Rise of Central Region of China in the New Era. Reform 2021, 329, 14–23. [Google Scholar]
  6. He, S.; Fang, B.; Xie, X. Temporal and Spatial Evolution and Driving Mechanism of Urban Ecological Welfare Performance from the Perspective of High-Quality Development: A Case Study of Jiangsu Province, China. Land 2022, 11, 1607. [Google Scholar] [CrossRef]
  7. Zheng, H.; He, Y. How does industrial co-agglomeration affect high-quality economic development? Evidence from Chengdu-Chongqing Economic Circle in China. J. Clean. Prod. 2022, 371, 133485. [Google Scholar] [CrossRef]
  8. Yan, J.; Zhang, W. Regional Disparity and Dynamic Evolution of Distribution of High-Quality Development in Yangze River Economic Belt. Resour. Environ. Yangtze Basin 2022, 31, 259–272. [Google Scholar]
  9. Zhao, X.; Nakonieczny, J.; Jabeen, F.; Shahzad, U.; Jia, W. Does green innovation induce green total factor productivity? Novel findings from Chinese city level data. Technol. Forecast. Soc. 2022, 185, 122021. [Google Scholar] [CrossRef]
  10. Wang, H.; Cui, H.; Zhao, Q. Effect of green technology innovation on green total factor productivity in China: Evidence from spatial durbin model analysis. J. Clean. Prod. 2021, 288, 125624. [Google Scholar] [CrossRef]
  11. Li, Y.; Long, W.; Ning, X.; Zhu, Y.; Guo, Y.; Huang, Z.; Hao, Y. How can China’s sustainable development be damaged in consequence of financial misallocation? Analysis from the perspective of regional innovation capability. Bus. Strat. Environ. 2022, 31, 3649–3668. [Google Scholar] [CrossRef]
  12. Zhang, R.; Qie, X.; Hu, Y.; Chen, X. Does de-capacity policy promote the efficient and green development of the coal industry?—Based on the evidence of China. Resour. Policy 2022, 77, 102717. [Google Scholar] [CrossRef]
  13. Yang, T.; Zhou, K.; Zhang, C. Spatiotemporal patterns and influencing factors of green development efficiency in China’s urban agglomerations. Sustain. Cities Soc. 2022, 85, 104069. [Google Scholar] [CrossRef]
  14. Zhou, B.; Wang, N.; Zhang, Z.; Liu, W.; Lu, W.; Xu, R.; Li, L. Research on the Spatial-Temporal Differentiation and Path Analysis of China’s Provincial Regions’ High-Quality Economic Development. Sustainability 2022, 14, 6348. [Google Scholar] [CrossRef]
  15. Huang, J.; Tian, Y.; Khanal, R.; Wen, F.; Deng, C. Evaluation and prediction of high-quality development in China: A time-spatial analysis from Hubei province. Front. Environ. Sci. 2022, 10, 987188. [Google Scholar] [CrossRef]
  16. Fakher, H.A.; Ahmed, Z.; Alvarado, R.; Murshed, M. Exploring renewable energy, financial development, environmental quality, and economic growth nexus: New evidence from composite indices for environmental quality and financial development. Environ. Sci. Pollut. Res. 2022, 29, 70305–70322. [Google Scholar] [CrossRef] [PubMed]
  17. Huang, Y.; Jiang, X.; Chen, Y. Analysis of the Spatial-Temporal Evolution of Urbanization Quality in Zhejiang Province, China. Int. J. Environ. Res. Public. Health 2023, 20, 4093. [Google Scholar] [CrossRef]
  18. Guo, Y.; Fan, B.; Long, J. Practical Evaluation of China’s Regional High-quality Development and Its Spatiotemporal Evolution Characteristics. J. Quant. Technol. Econ. 2020, 37, 118–132. [Google Scholar]
  19. Chen, J.; Chen, Y.; Chen, M. China’s High-quality Economic Development Level, Regional Differences and Dynamic Evolution of Distribution. J. Quant. Technol. Econ. 2020, 37, 108–126. [Google Scholar]
  20. Li, X.; Lu, Y.; Huang, R. Whether foreign direct investment can promote high-quality economic development under environmental regulation: Evidence from the Yangtze River Economic Belt, China. Environ. Sci. Pollut. Res. 2021, 28, 21674–21683. [Google Scholar] [CrossRef]
  21. Everard, M.; Longhurst, J.W.S. Reasserting the primacy of human needs to reclaim the ‘lost half’ of sustainable development. Sci. Total Environ. 2018, 621, 1243–1254. [Google Scholar] [CrossRef]
  22. Song, M.; Tao, W.; Shen, Z. Improving high-quality development with environmental regulation and industrial structure in China. J. Clean. Prod. 2022, 366, 132997. [Google Scholar] [CrossRef]
  23. Zhu, Y.; Liang, D.; Liu, T.; Song, Y. The impact of production factor distortion on total factor energy productivity: Insight from China’s region level. Environ. Sci. Pollut. Res. 2020, 27, 40715–40731. [Google Scholar] [CrossRef]
  24. Yang, M.; Wang, J.; Jing, Z.; Liu, B.; Niu, H. Evaluation and regulation of resource-based city resilience: Evidence from Shanxi Province, China. Int. J. Disaster Risk Reduct. 2022, 81, 103256. [Google Scholar] [CrossRef]
  25. Yu, S.; Zheng, S.; Li, X.; Li, L. China can peak its energy-related carbon emissions before 2025: Evidence from industry restructuring. Energy Econ. 2018, 73, 91–107. [Google Scholar] [CrossRef]
  26. Zhao, X.; Zhu, J. Industrial restructuring, energy consumption and economic growth: Evidence from China. J. Clean. Prod. 2022, 335, 130242. [Google Scholar]
  27. Bai, J.; Liu, Y. Can Outward Foreign Direct Investment Improve the Resource Misallocation of China. China Ind. Econ. 2018, 358, 60–78. [Google Scholar]
  28. Wei, X.; Liu, L.; Yuan, C.; Xia, Z. Determining urban-rural coordinated development in major grain-producing areas based on urbanization and cultivated land use efficiency coordination level: A case study in Hunan Province, China. Front. Environ. Sci. 2023, 10, 1091898. [Google Scholar] [CrossRef]
  29. Gnidchenko, A.A. Structural transformation and quality ladders: Evidence from the new Theil’s decomposition. Struct. Chang. Econ. Dyn. 2021, 59, 281–291. [Google Scholar] [CrossRef]
  30. Wang, Y.; Gong, X. Analyzing the difference evolution of provincial energy consumption in China using the functional data analysis method. Energy Econ. 2022, 105, 105753. [Google Scholar] [CrossRef]
  31. Shah, S.A.; Jehanzaib, M.; Lee, J.; Kim, T. Exploring the Factors Affecting Streamflow Conditions in the Han River Basin from a Regional Perspective. KSCE J. Civ. Eng. 2021, 25, 4931–4941. [Google Scholar] [CrossRef]
  32. Shah, S.; Jehanzaib, M.; Yoo, J.; Hong, S.; Kim, T. Investigation of the Effects of Climate Variability, Anthropogenic Activities, and Climate Change on Streamflow Using Multi-Model Ensembles. Water 2022, 14, 512. [Google Scholar] [CrossRef]
  33. Liu, Y.; Yang, R.; Sun, M.; Zhang, L.; Li, X.; Meng, L.; Wang, Y.; Liu, Q. Regional sustainable development strategy based on the coordination between ecology and economy: A case study of Sichuan Province, China. Ecol. Indic. 2022, 134, 108445. [Google Scholar] [CrossRef]
  34. Gan, L.; Yang, X.; Chen, L.; Lev, B.; Lv, Y. Optimization path of Economy-Society-Ecology system orienting industrial structure Adjustment: Evidence from Sichuan Province in China. Ecol. Indic. 2022, 144, 109479. [Google Scholar] [CrossRef]
  35. Wang, J.; Wei, X.; Guo, Q. A three-dimensional evaluation model for regional carrying capacity of ecological environment to social economic development: Model development and a case study in China. Ecol. Indic. 2018, 89, 348–355. [Google Scholar] [CrossRef]
  36. Zhang, X.; Zhang, R.; Zhao, M.; Wang, Y.; Chen, X. Policy Orientation, Technological Innovation and Energy-Carbon Performance: An Empirical Study Based on China’s New Energy Demonstration Cities. Front. Environ. Sci. 2022, 10, 846742. [Google Scholar] [CrossRef]
  37. Chen, W.Y.; Wang, D.T. Economic development and natural amenity: An econometric analysis of urban green spaces in China. Urban For. Urban Green. 2013, 12, 435–442. [Google Scholar] [CrossRef]
  38. Xiao, Y.; Li, Y.; Tang, X.; Huang, H.; Wang, R. Assessing spatial-temporal evolution and key factors of urban livability in arid zone: The case study of the Loess Plateau, China. Ecol. Indic. 2022, 140, 108995. [Google Scholar] [CrossRef]
  39. Hou, C.; Chen, H.; Long, R.; Zhang, L.; Yang, M.; Wang, Y. Construction and empirical research on evaluation system of green productivity indicators: Analysis based on the correlation-fuzzy rough set method. J. Clean. Prod. 2021, 279, 123638. [Google Scholar] [CrossRef]
  40. Nabizadeh, R.; Yousefzadeh, S.; Yaghmaeian, K.; Alimohammadi, M.; Mokhtari, Z. Bottled water quality ranking via the multiple-criteria decision-making process: A case study of two-stage fuzzy AHP and TOPSIS. Environ. Sci. Pollut. Res. 2022, 29, 20437–20448. [Google Scholar] [CrossRef]
  41. Wang, L.; Wang, Z.; Ma, Y. Does environmental regulation promote the high-quality development of manufacturing? A quasi-natural experiment based on China’s carbon emission trading pilot scheme. Socio-Econ. Plan. Sci. 2022, 81, 101216. [Google Scholar] [CrossRef]
  42. Liu, K.; Xue, Y.; Chen, Z.; Miao, Y.; Shi, J. Economic spatial structure of China’s urban agglomerations: Regional differences, distribution dynamics, and convergence. Sustain. Cities Soc. 2022, 87, 104253. [Google Scholar] [CrossRef]
  43. Ma, T.; Liu, Y.; Yang, M. Spatial-Temporal Heterogeneity for Commercial Building Carbon Emissions in China: Based the Dagum Gini Coefficient. Sustainability 2022, 14, 5243. [Google Scholar] [CrossRef]
  44. Luo, H.; Qu, X. Spatiotemporal Evolution Trends of Urban Total Factor Carbon Efficiency under the Dual-Carbon Background. Land 2023, 12, 69. [Google Scholar] [CrossRef]
  45. Shi, T.; Qiao, Y.; Zhou, Q.; Zhang, J. The Regional Differences and Random Convergence of Urban Resilience in China. Technol. Econ. Dev. Econ. 2022, 28, 979–1002. [Google Scholar] [CrossRef]
  46. He, L.; Tao, J.; Meng, P.; Chen, D.; Yan, M.; Vasa, L. Analysis of socio-economic spatial structure of urban agglomeration in China based on spatial gradient and clustering. Oeconomia Copernic. 2021, 12, 789–819. [Google Scholar] [CrossRef]
  47. Zhu, W.; Xu, L.; Tang, L.; Xiang, X. Eco-efficiency of the Western Taiwan Straits Economic Zone: An evaluation based on a novel eco-efficiency model and empirical analysis of influencing factors. J. Clean. Prod. 2019, 234, 638–652. [Google Scholar] [CrossRef]
  48. Li, J.; Liang, M.; Zhong, Y. The Spatial-temporal Pattern of the Coordinated Development between Economy and Environment in the Yangtze River Economic Belt and Problem Areas Identification. Resour. Environ. Yangtze Basin 2020, 29, 2584–2596. [Google Scholar]
Figure 1. Geography of the Central Region.
Sustainability 15 11098 g001
Figure 2. Average of the high-quality development index of cities in the central region.
Sustainability 15 11098 g002
Figure 3. Spatial dynamic evolution of high-quality development level in central region cities.
Sustainability 15 11098 g003
Figure 4. Trends in intra-regional disparities of high-quality urban development.
Sustainability 15 11098 g004
Figure 5. Inter-regional disparity matrix for high-quality urban development in the central region; (a) 2006, (b) 2019.
Sustainability 15 11098 g005
Figure 6. Evolutionary features of kernel density curve density function in central region cities.
Sustainability 15 11098 g006
Figure 7. Spatial distribution pattern of problem areas for high-quality urban development in the central region.
Sustainability 15 11098 g007
Table 1. Index of the dimension of economic upside.
DimensionsVariablesProperty
Economic upsideGross regional product per capita (CNY per person)Positive
Coefficient of variation of economic growth rate (%)Negative
Import and export trade/GDP (%)Positive
Industrial advancementNegative
Table 2. Index of the dimension of steady improvement in efficiency.
DimensionsVariablesProperty
Steady Improvement of EfficiencyLabor Productivity (%)Positive
Capital productivity (%)Positive
Labor MismatchNegative
Capital MismatchNegative
Table 3. Index of the dimensions of regional coordination development.
DimensionsVariablesProperty
Coordinated Regional DevelopmentRatio of urban and rural residents’ income (%)Negative
Ratio of urban and rural residents’ consumption (%)Negative
GDP per capita/GDP per capita of the whole region (%)Negative
Industrial rationalizationNegative
Table 4. Index of the dimensions of effective ecological management.
DimensionsVariablesProperty
Effective Ecological GovernanceIndustrial wastewater discharge per unit GDP (tons)Negative
Industrial sulfur dioxide emissions per unit GDP (tons)Negative
Industrial soot emissions per unit GDP (tons)Negative
Wastewater treatment rate (%)Positive
Domestic waste treatment rate (%)Positive
Table 5. Index of the dimensions of sharing the fruits of development.
DimensionsVariablesProperty
Development Results SharingNumber of students in higher education per 10,000 population (person)Positive
Number of doctors per 10,000 people (person)Positive
Road area per capita (square meters)Positive
Park green space per capita (square meters)Positive
Table 6. Overall and intra-regional disparities of high-quality urban development.
YearOverallShanxiAnhuiJiangxiHenanHubeiHunan
20060.17740.17500.22110.19940.11200.13670.1513
20070.18310.18310.22690.19710.12700.14080.1489
20080.18030.16740.22060.20960.11690.14190.1527
20090.16210.13710.18510.17850.11390.13210.1492
20100.17080.14070.19540.18400.10480.14570.1603
20110.16470.13640.17080.17030.11840.15600.1607
20120.15640.13400.15550.15240.12570.15110.1425
20130.16000.14810.16460.13070.13430.14270.1602
20140.16610.16420.15320.14690.13820.14860.1924
20150.16020.17020.13920.14280.14620.14600.1516
20160.15650.17350.12570.13650.14560.14150.1507
20170.16130.17150.13130.13950.14920.16870.1503
20180.15530.17230.13660.13650.14860.15020.1431
20190.14990.17300.13110.12640.14410.15150.1292
Table 7. Inter-regional disparity in high-quality urban development in the central region.
Year2006200920112013201520172019Average
Shanxi–Anhui0.20490.17530.16640.16750.16760.16140.16340.1724
Shanxi–Jiangxi0.19280.17650.18350.15680.17240.17480.16960.1752
Shanxi–Henan0.15310.14260.14040.15480.16720.16840.16300.1641
Shanxi–Hubei0.16920.13990.15210.14870.16170.17950.16880.1556
Shanxi–Hunan0.16820.15290.15900.16240.16450.16920.15970.1707
Anhui–Jiangxi0.21280.18410.18090.15270.14470.14010.13350.1798
Anhui–Henan0.18940.17480.16230.17690.17380.16190.15570.1600
Anhui–Hubei0.19710.16980.17070.16110.15030.15350.14480.1639
Anhui–Hunan0.19520.17610.16990.17420.15800.14450.13350.1625
Jiangxi–Henan0.17750.17860.19430.17690.18590.18200.16320.1618
Jiangxi–Hubei0.18150.16950.18090.14810.15380.15820.14560.1623
Jiangxi–Hunan0.18270.17750.18930.16860.16590.15430.13410.1645
Henan–Hubei0.16000.15150.15450.15970.16380.18460.15850.1675
Henan–Hunan0.13880.13760.14630.15220.15540.16720.14830.1494
Hubei–Hunan0.16530.15450.16690.16330.15600.16510.14340.1592
Table 8. Sources and contributions of regional disparities in high-quality urban development in the central region.
YearIntra-Regional
Variation
Contribution
Rate/%
Inter-Regional
Differences
Contribution
Rate/%
Super-Variation
Density
Contribution
Rate/%
20060.02830.04490.104215.97%25.31%58.72%
20070.02930.04610.107716.01%25.16%58.83%
20080.02880.04710.104415.96%26.15%57.89%
20090.02560.04520.091415.77%27.85%56.38%
20100.02650.05900.085315.52%34.55%49.93%
20110.02570.05070.088315.63%30.78%53.60%
20120.02440.04730.084715.60%30.25%54.15%
20130.02520.04370.091115.77%27.27%56.95%
20140.02660.03760.102015.98%22.65%61.37%
20150.02520.04100.094015.72%25.59%58.69%
20160.02440.03920.093015.58%25.03%59.39%
20170.02540.03570.100215.75%22.15%62.09%
20180.02500.02900.101416.07%18.64%65.29%
20190.02400.02700.098816.04%18.03%65.93%
Table 9. Overall Moran index of urbanization development level.
YearMoran’s Ip
20060.33300.0000
20070.33390.0000
20080.41150.0000
20090.36470.0000
20100.34300.0000
20110.35700.0000
20120.34940.0000
20130.32920.0000
20140.32000.0000
20150.32340.0000
20160.29670.0000
20170.29860.0000
20180.30540.0000
20190.32130.0000
Disclaimer/Publisher’s Note: The statements, opinions and data contained in all publications are solely those of the individual author(s) and contributor(s) and not of MDPI and/or the editor(s). MDPI and/or the editor(s) disclaim responsibility for any injury to people or property resulting from any ideas, methods, instructions or products referred to in the content.

