A Study on the Spatial-Temporal Evolution and Problem Area Identification of High-Quality Urban Development in the Central Region
Abstract
:1. Introduction
2. Index System Construction and Data Source
2.1. Construction of Index System for High-Quality Development of Cities
2.1.1. Economic Upside
2.1.2. Steady Improvement of Efficiency
2.1.3. Coordinated Regional Development
2.1.4. Effective Ecological Governance
2.1.5. Development Results Sharing
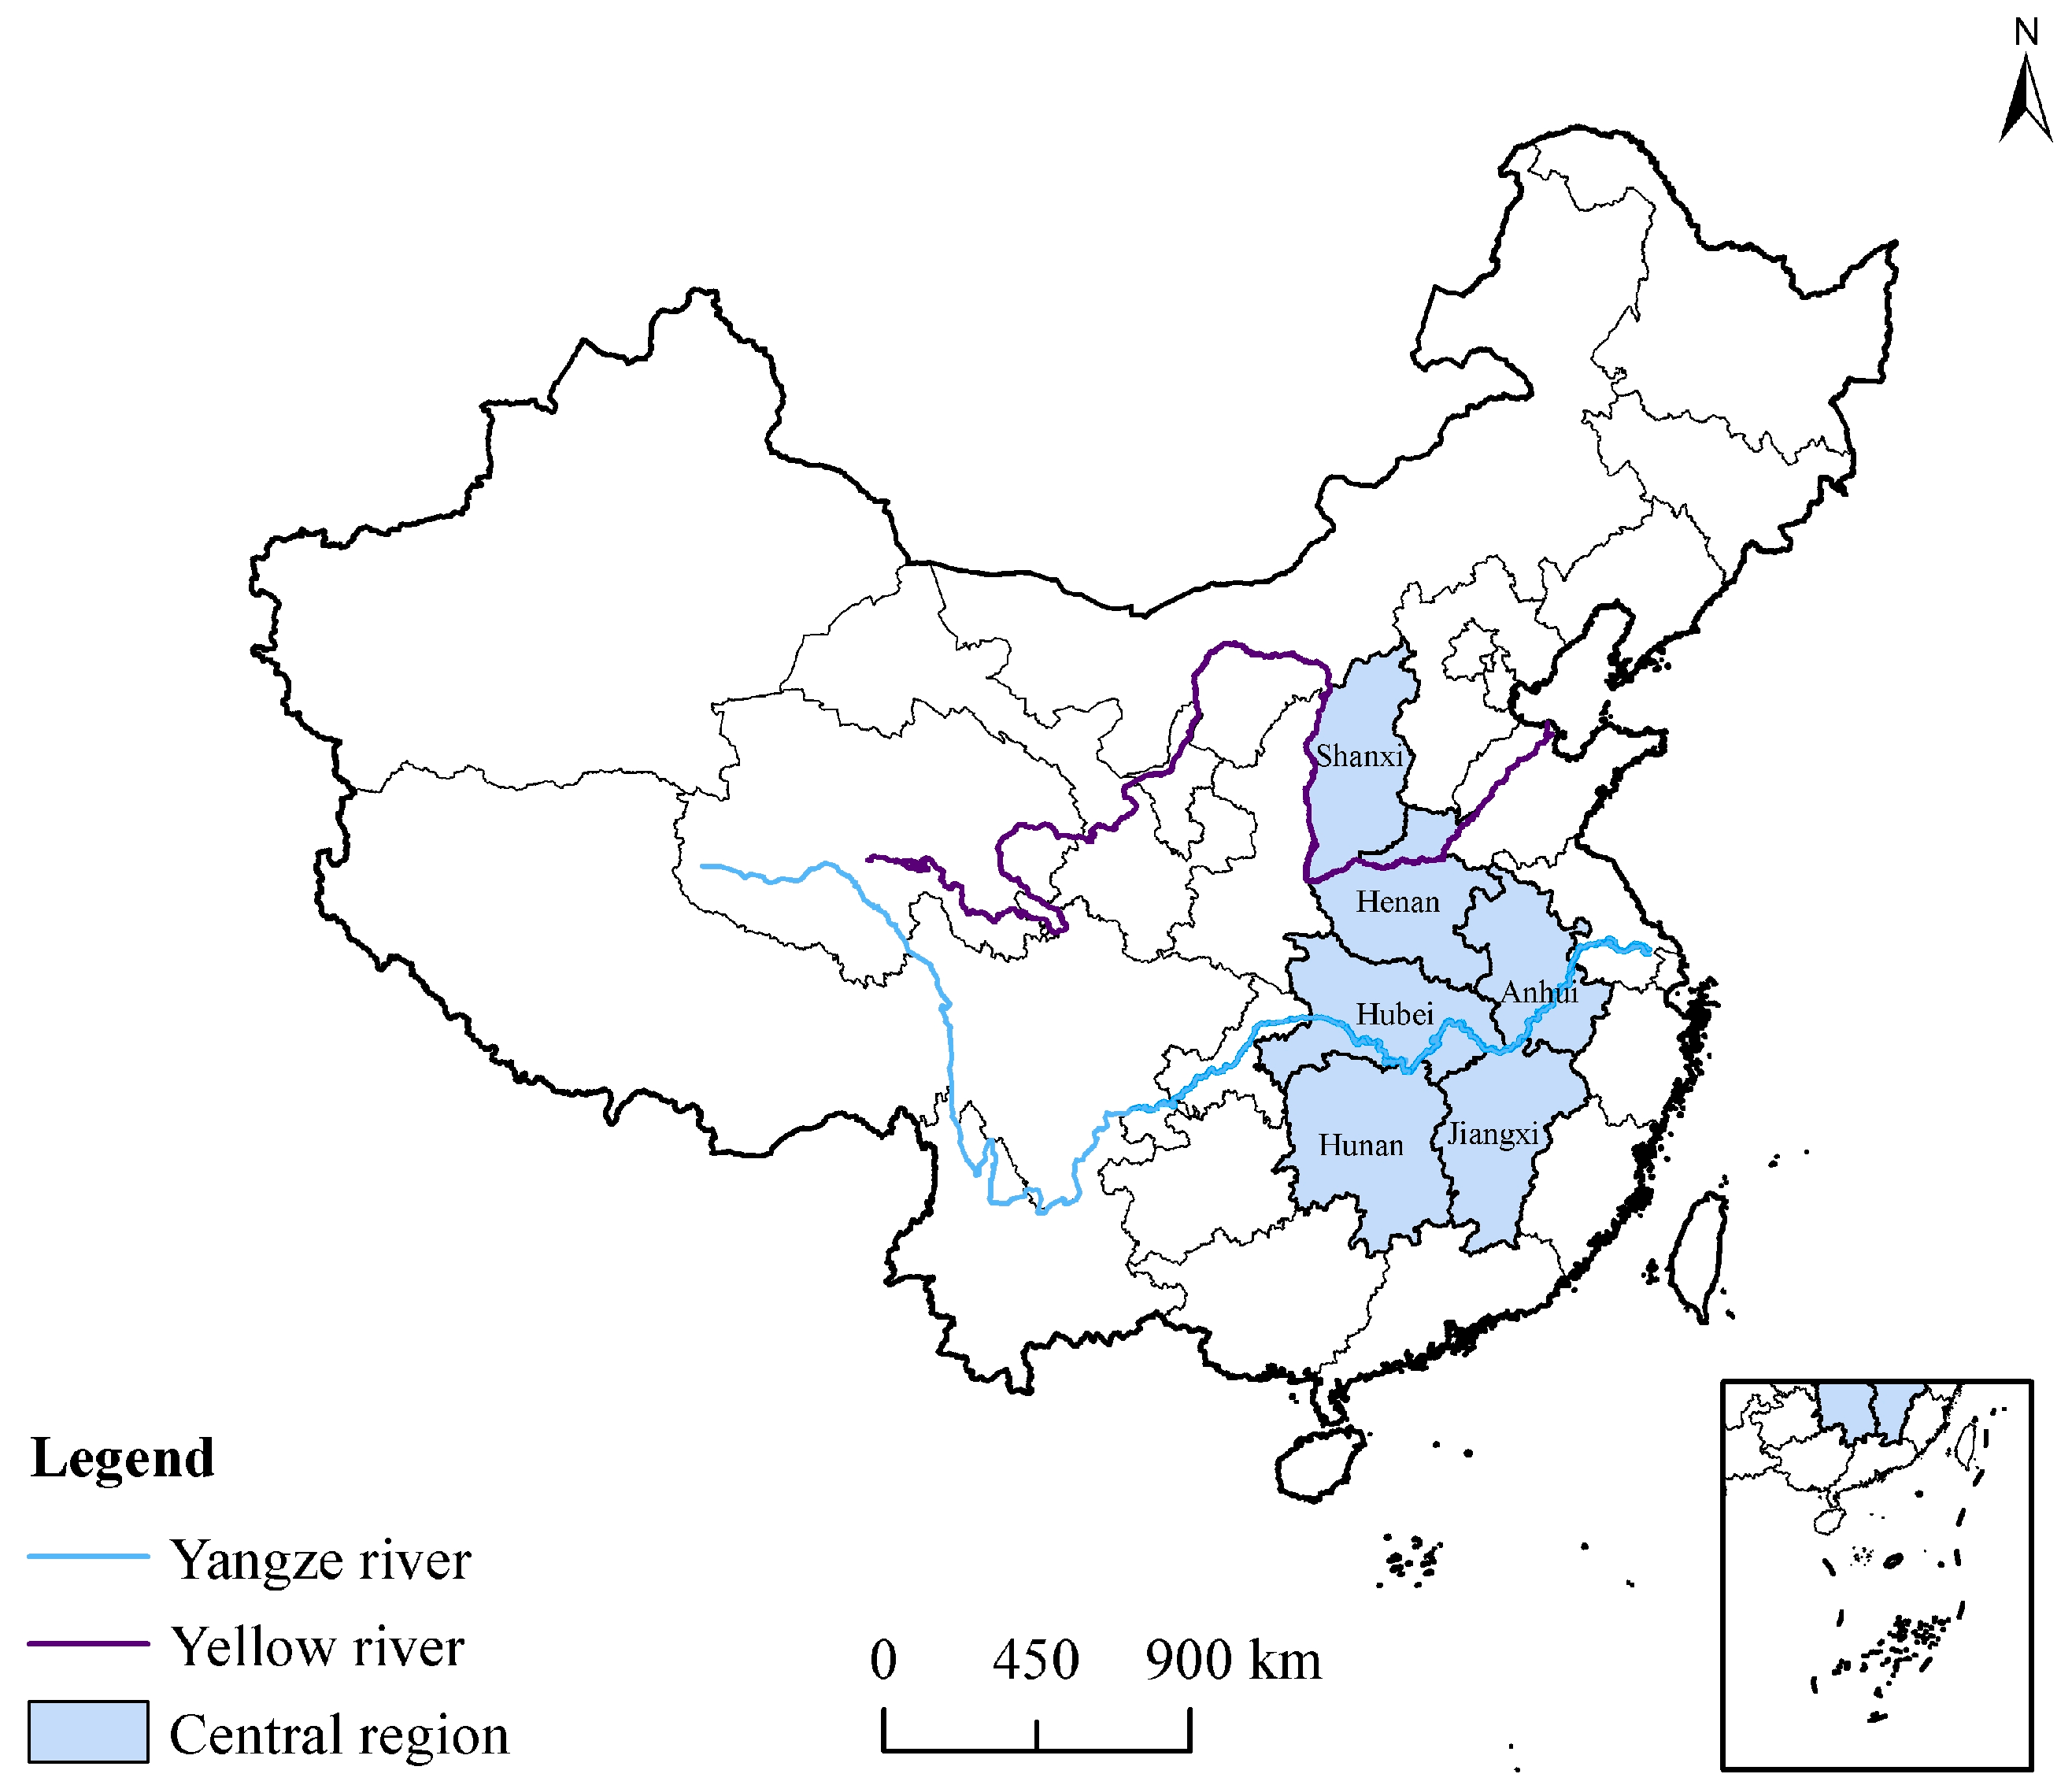
2.2. Study Area and Source of Index Data
3. Research Methods
3.1. Entropy TOPSIS Method
3.2. Dagum’s Gini Coefficient Method
3.3. Kernel Density Estimation Method
4. Spatial-Temporal Evolutionary Characteristics and Regional Disparities of High-Quality Development
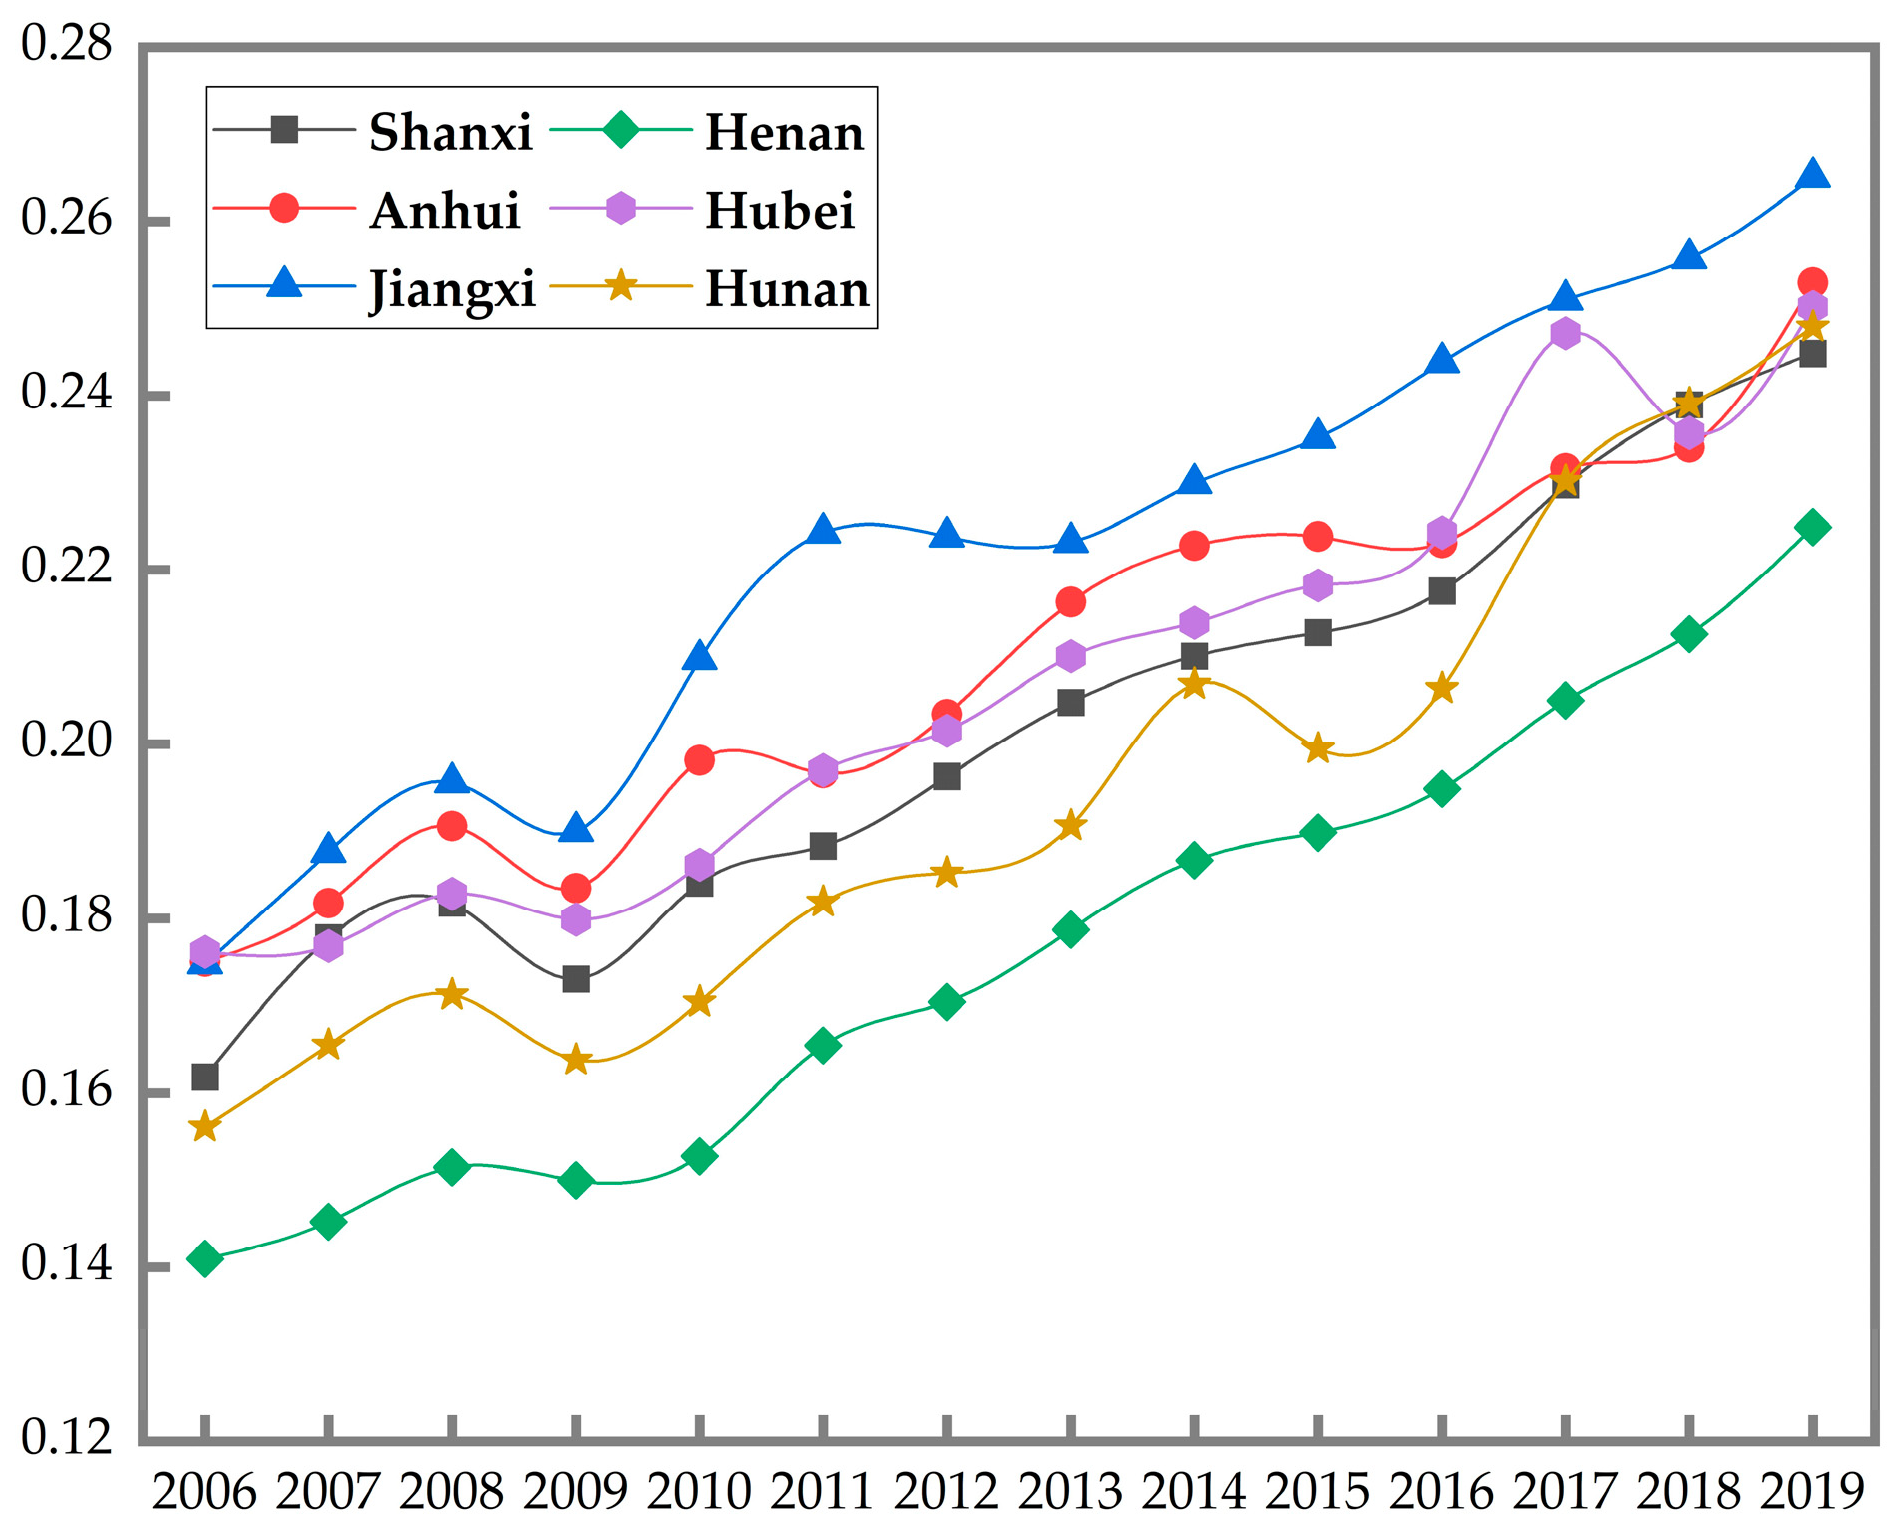
4.1. Time Differences of High-Quality Urban Development
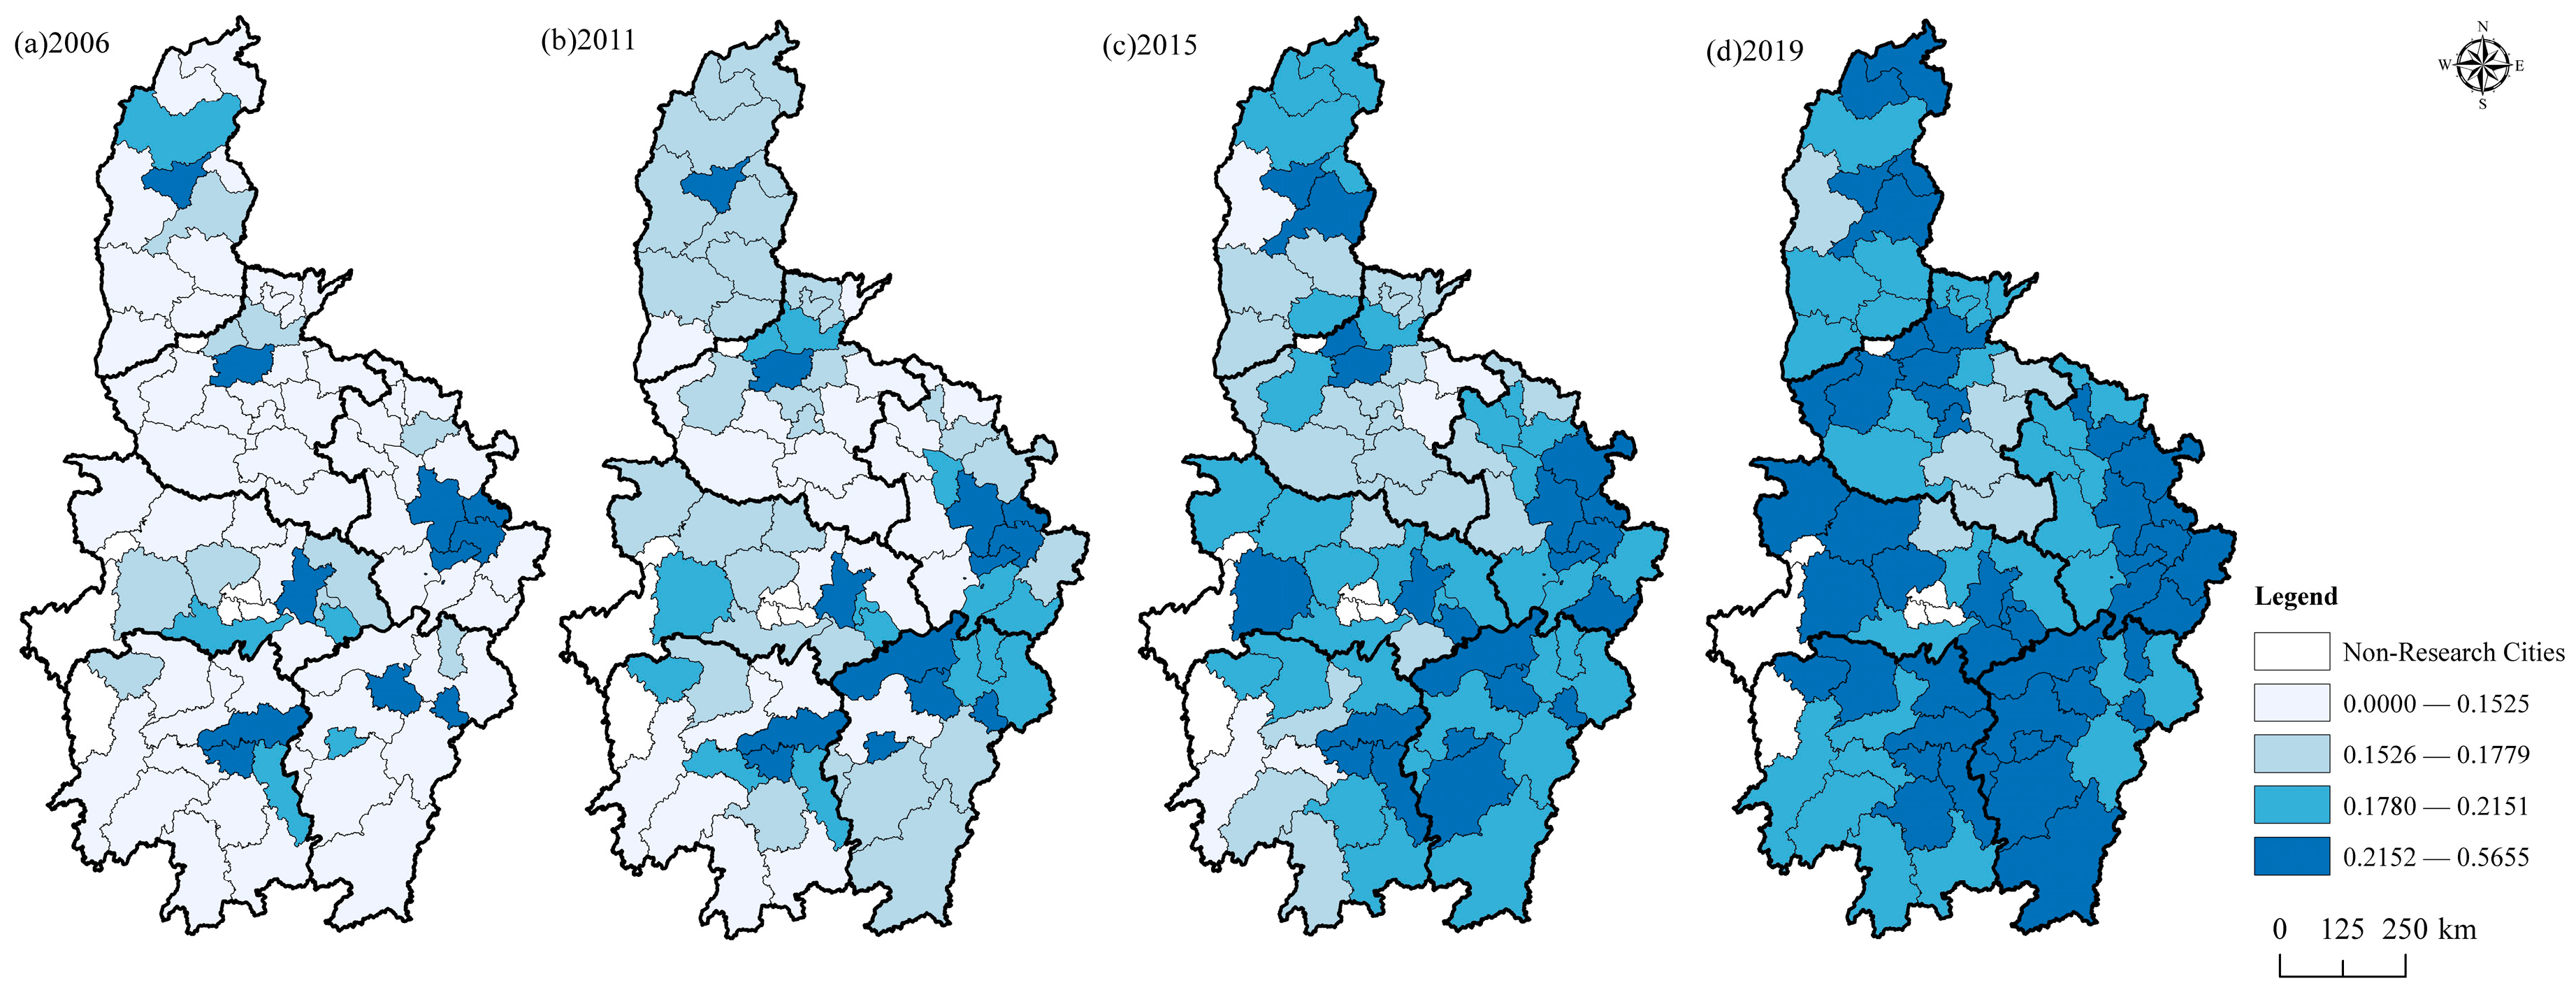
4.2. Spatial Evolutionary Characteristics of High-Quality Development
4.3. Regional Disparities and Causes of High-Quality Development
4.3.1. Overall Variance Fluctuating Downwards
4.3.2. Trends and Types of Intra-Regional Differences
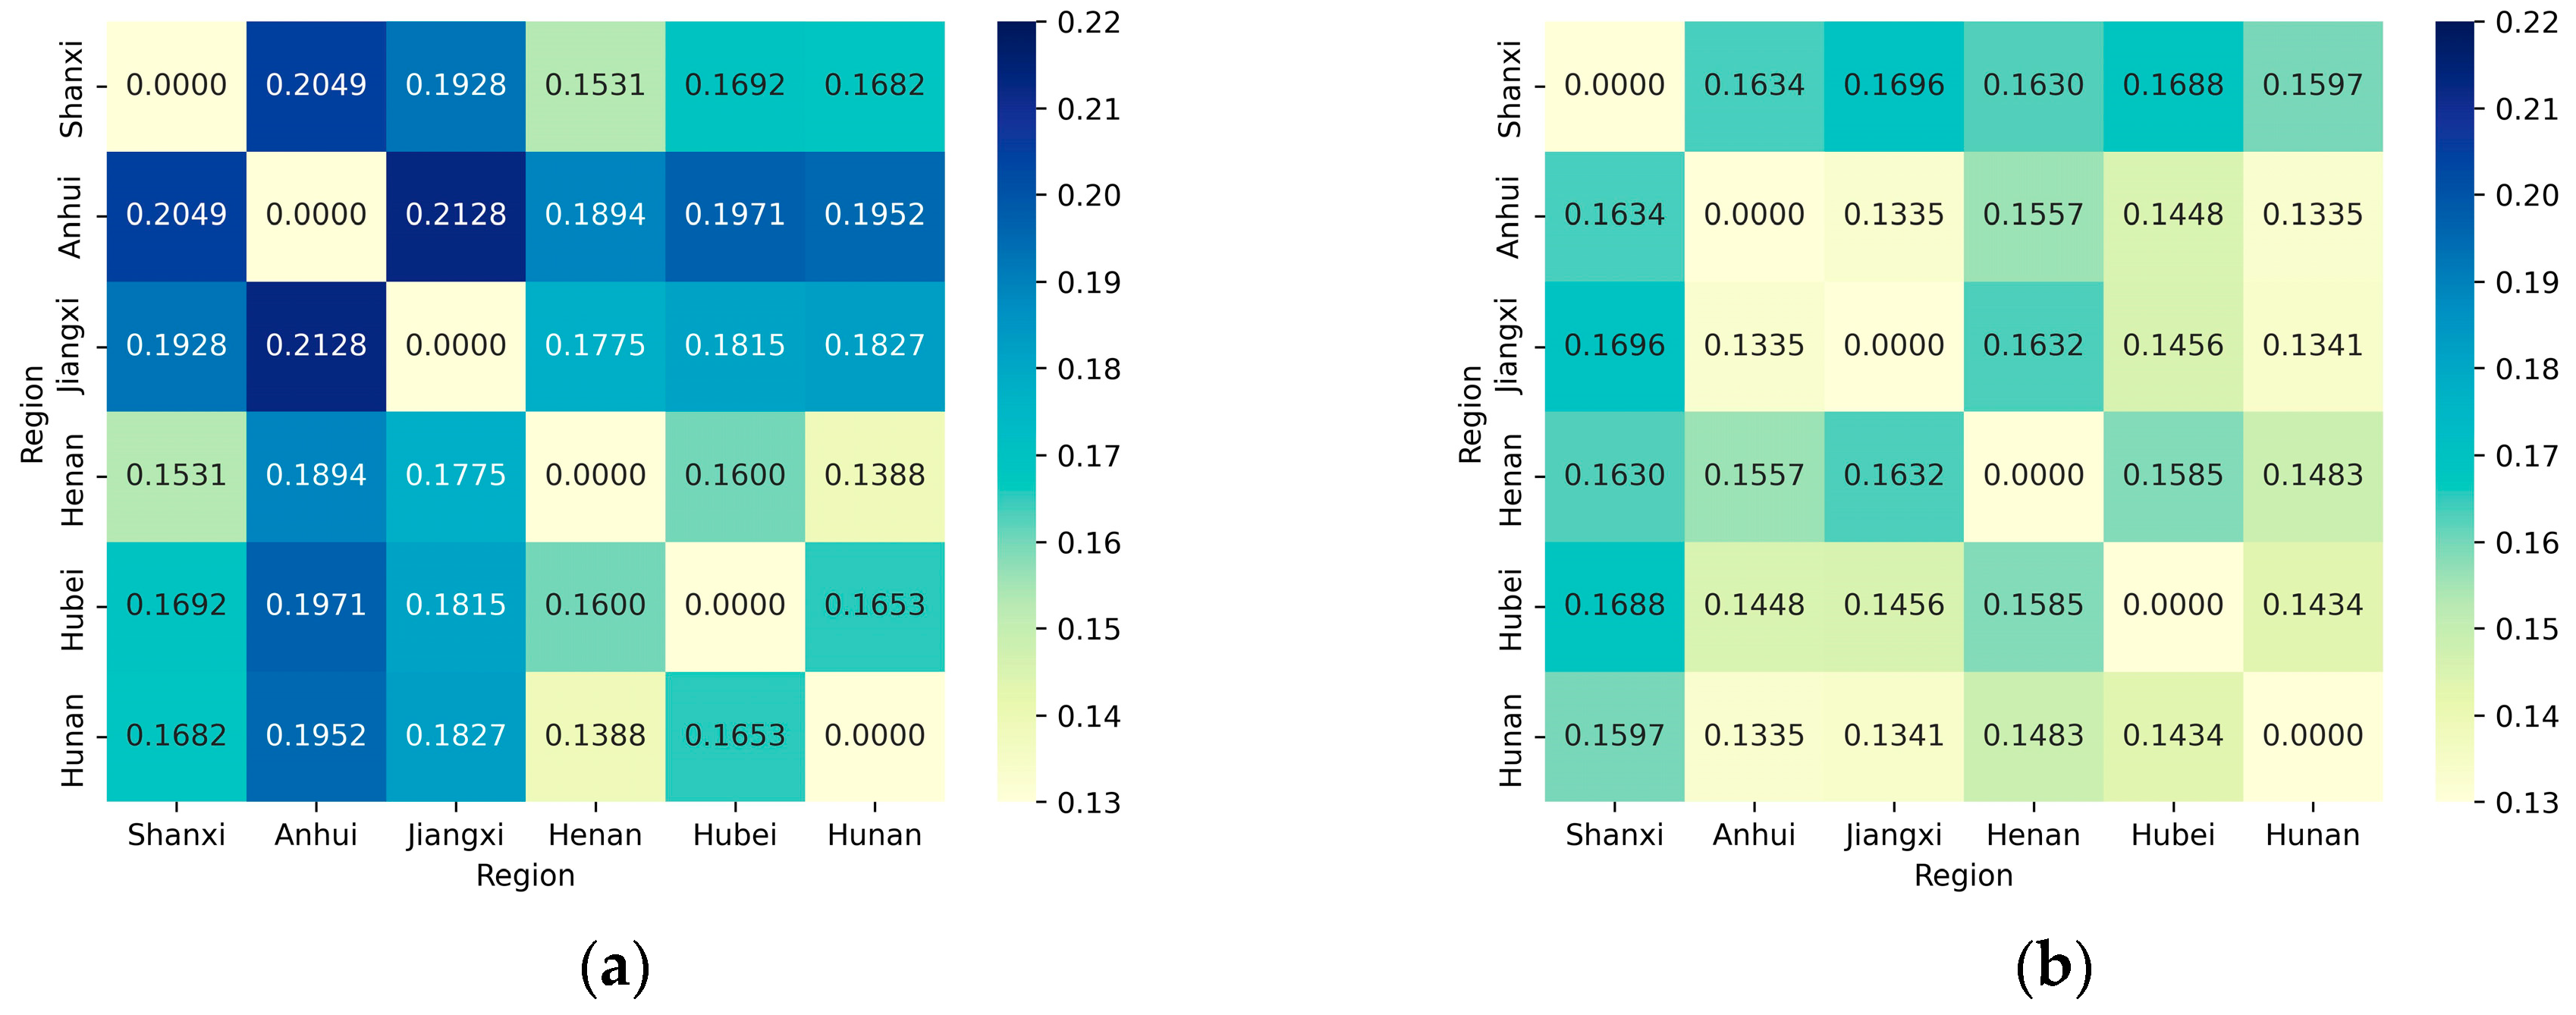
4.3.3. Inter-Regional Disparity Characteristics
4.3.4. Inter-Regional Disparity Sources and Contribution Rates
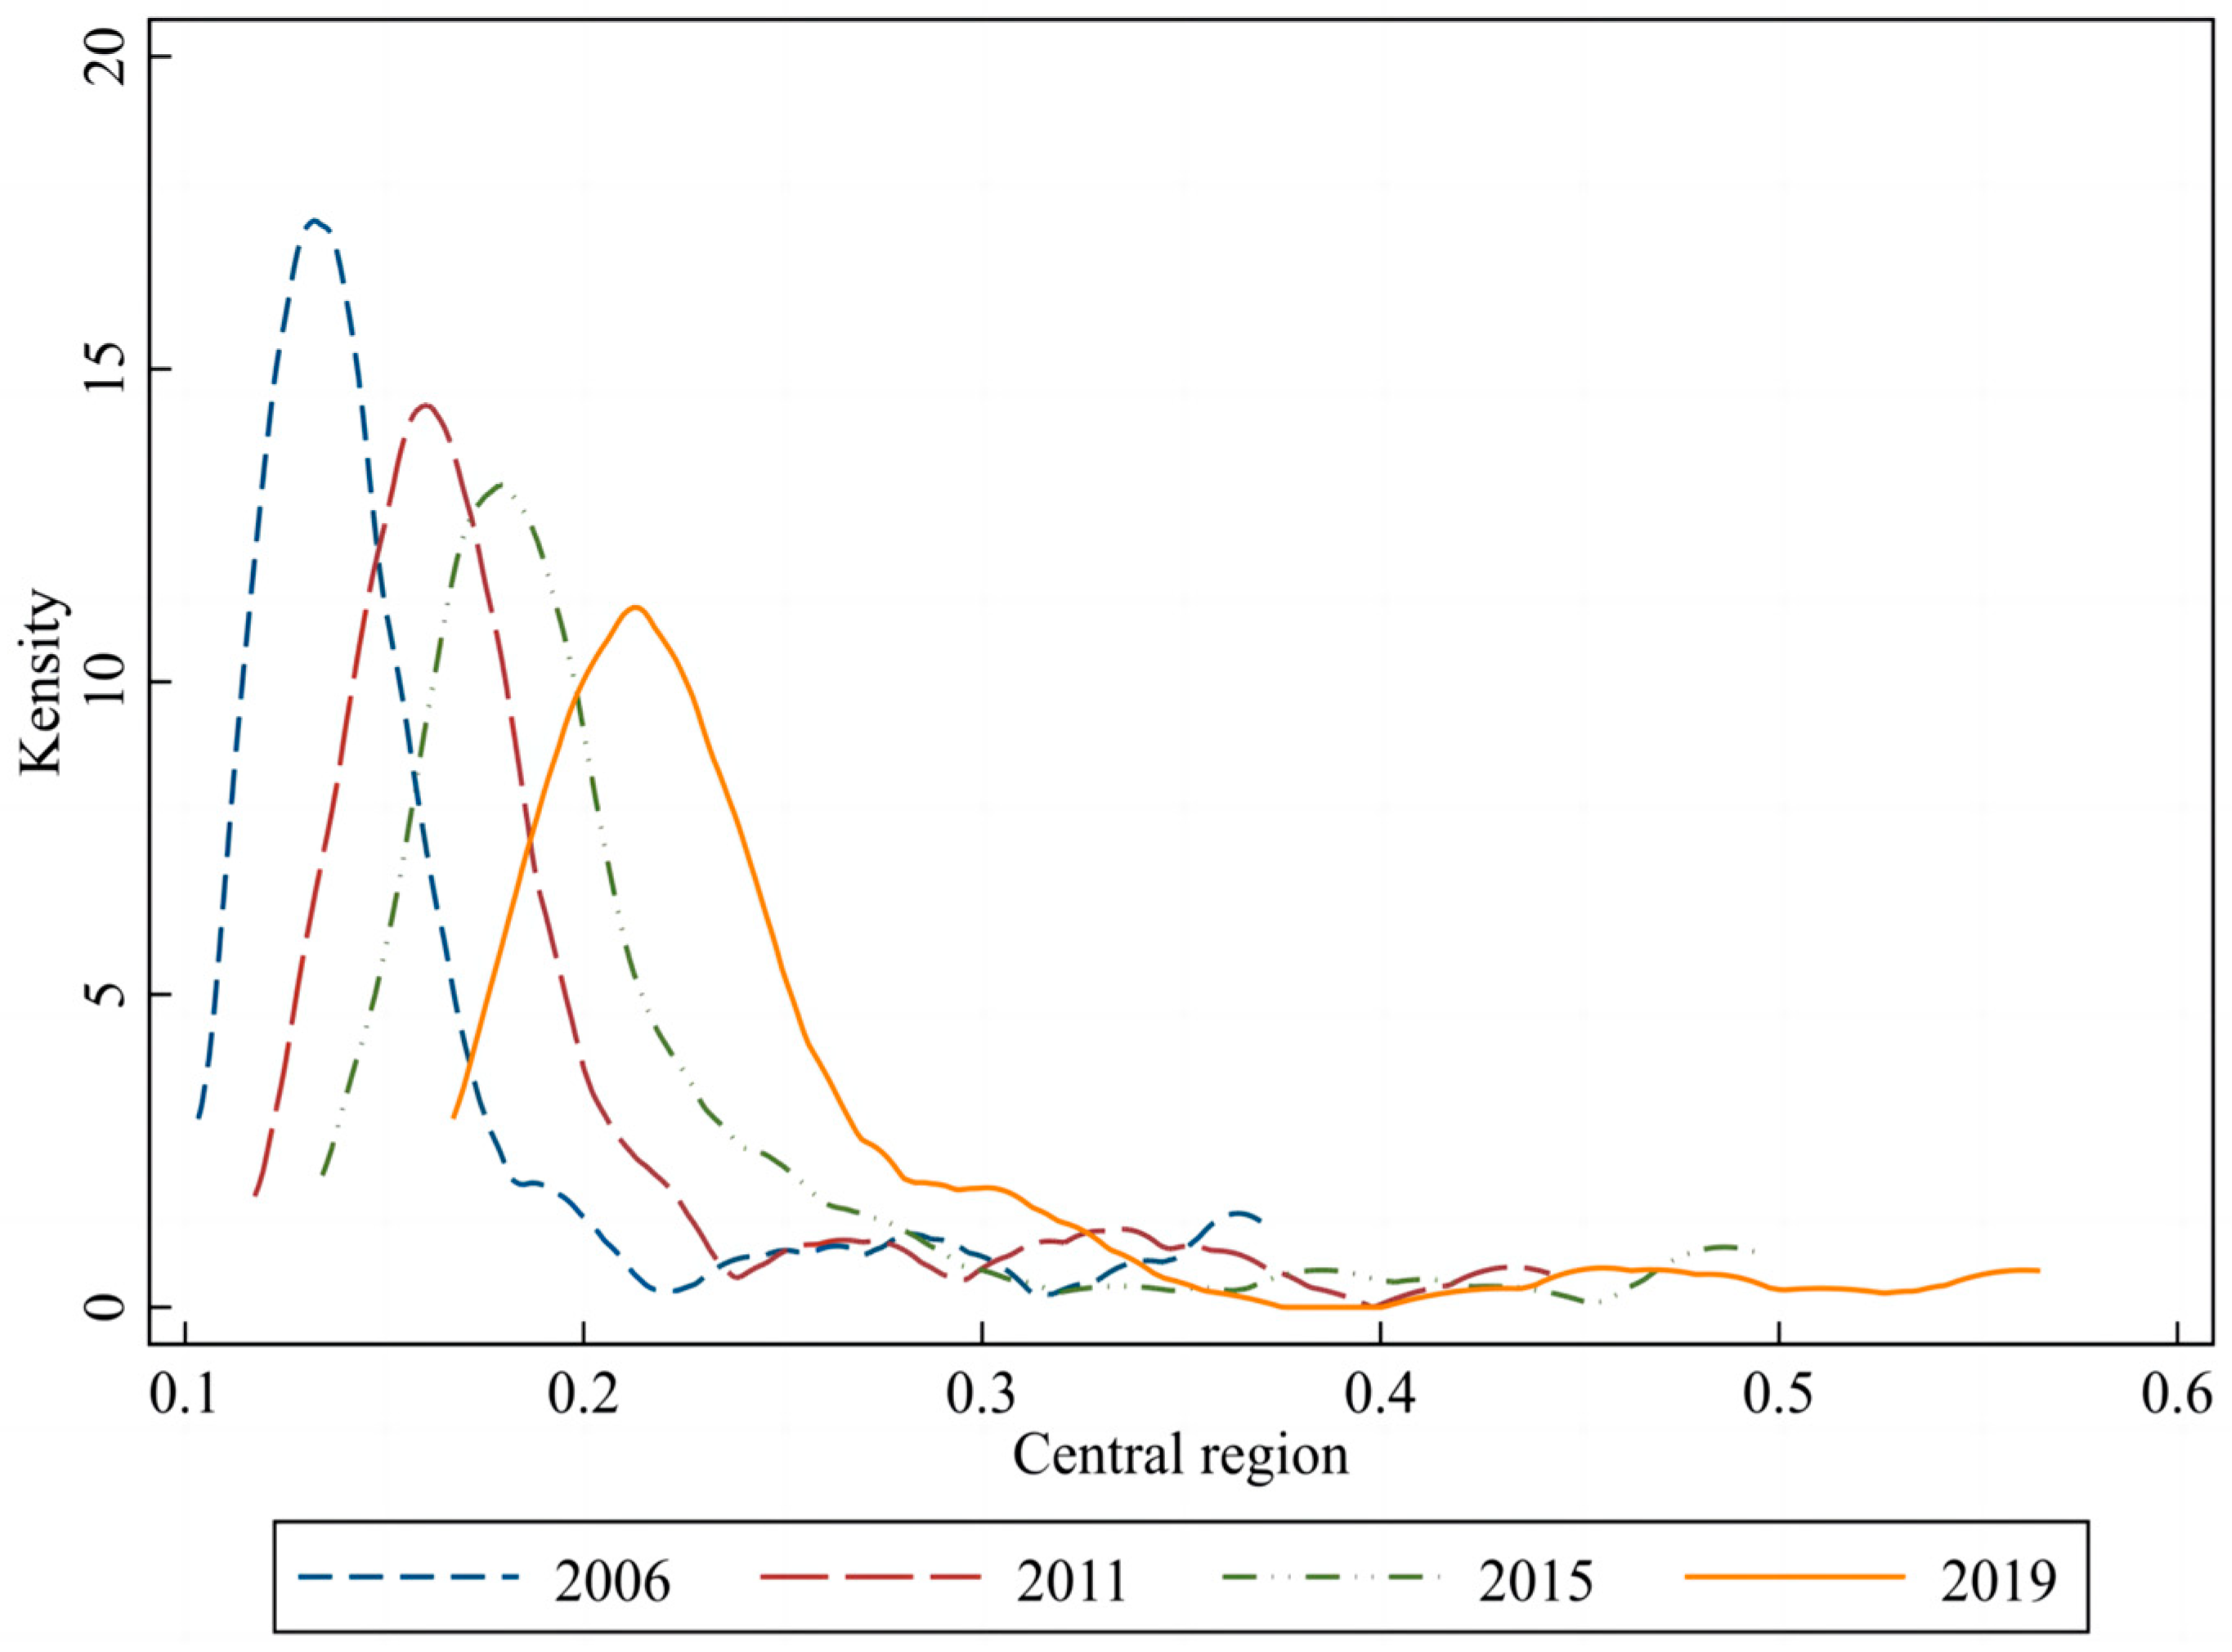
4.4. Nuclear Density Analysis
4.5. Spatial Correlation Analysis
5. Problem Area Identification and Optimization Suggestions for High-Quality Development
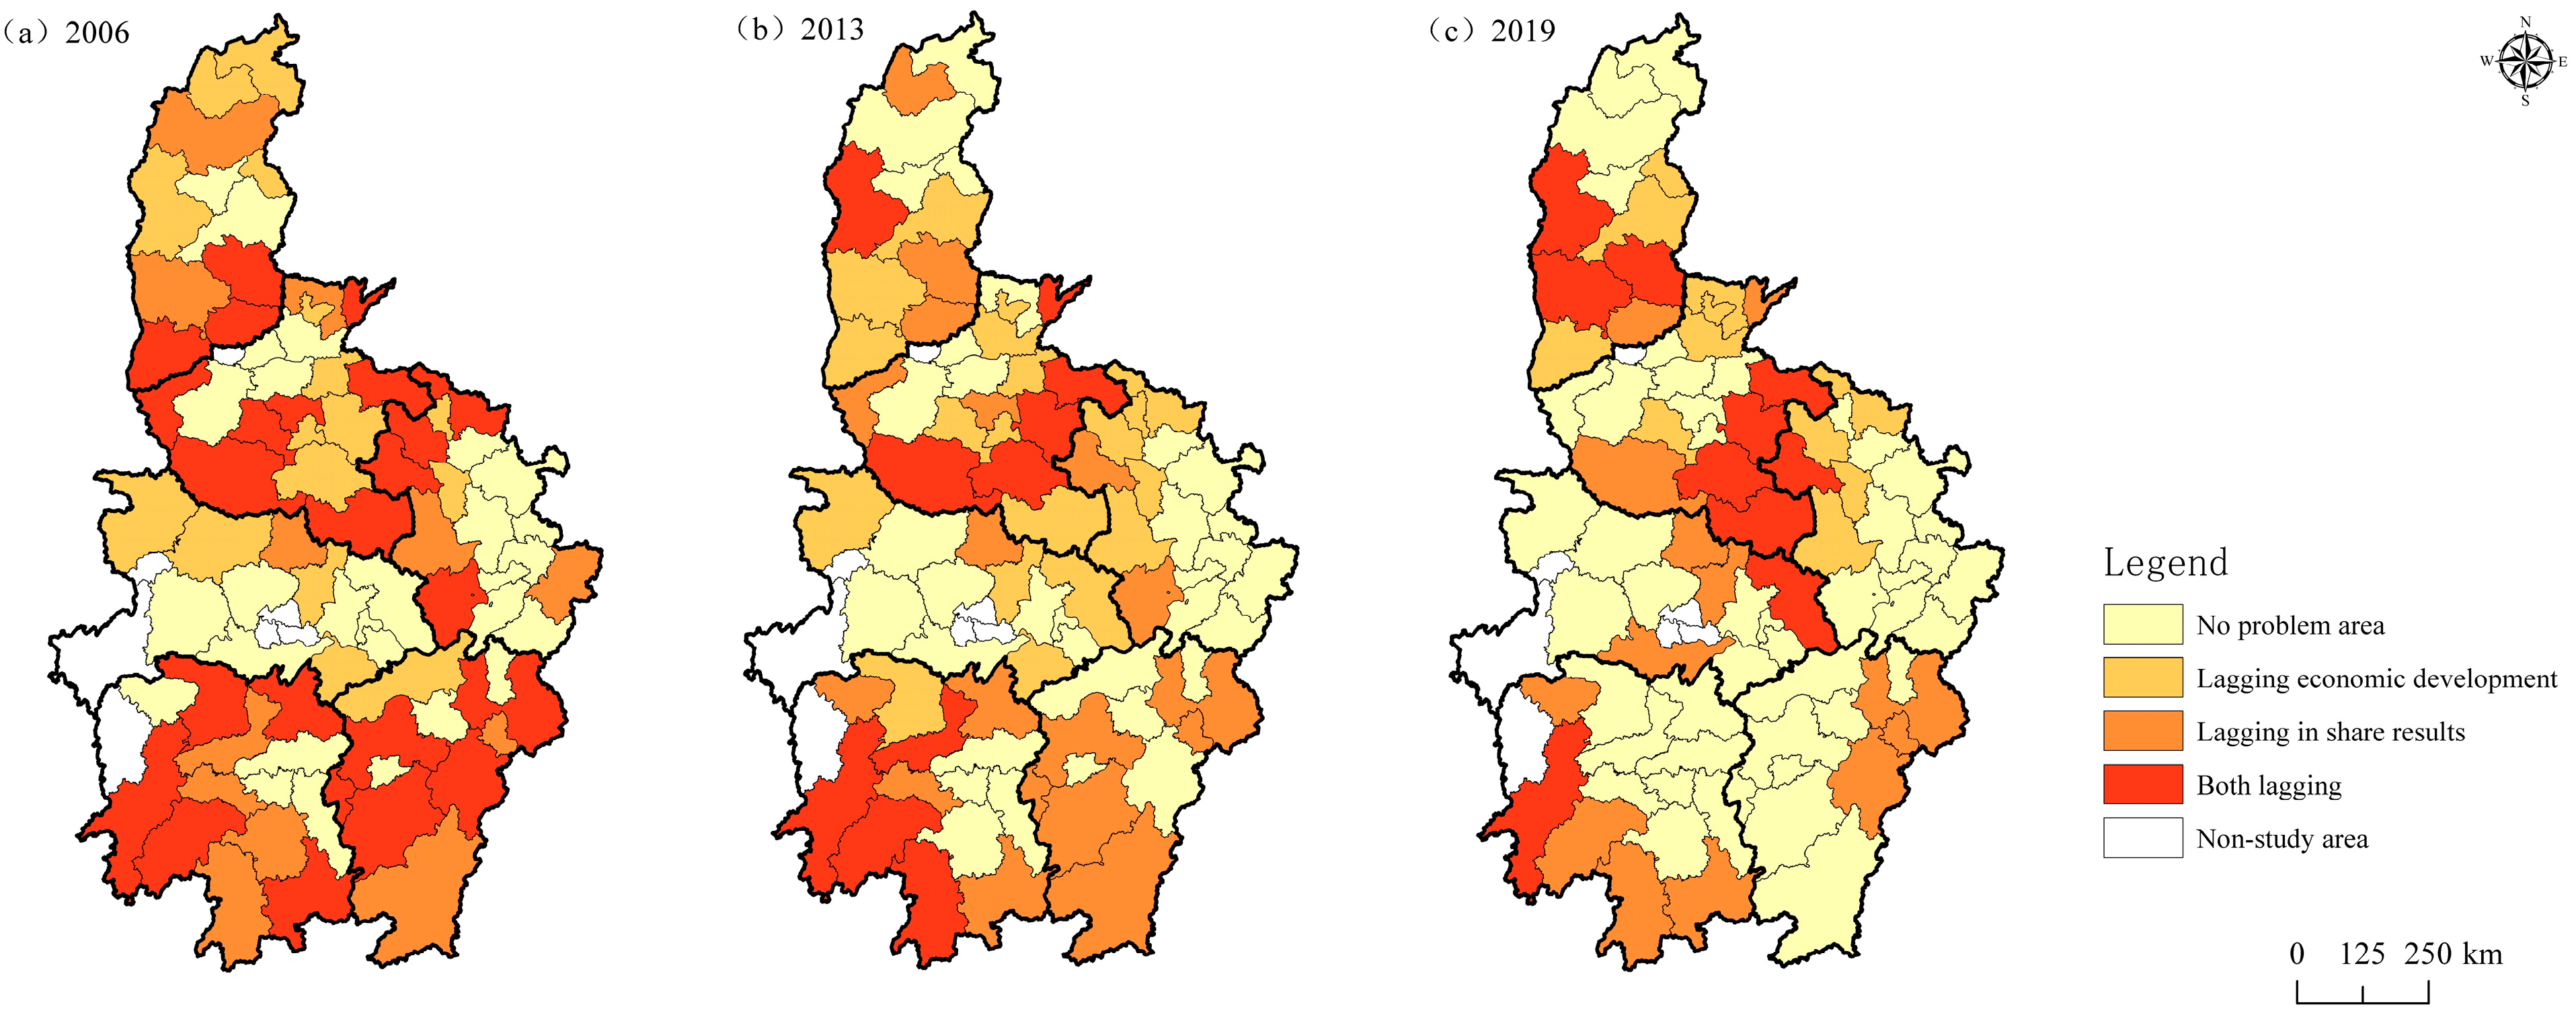
5.1. Problem Area Identification
5.2. Optimization Suggestions Based on Problem Areas
6. Conclusions and Policy Implications
Author Contributions
Funding
Institutional Review Board Statement
Informed Consent Statement
Data Availability Statement
Conflicts of Interest
References
- Wei, Y.; Li, H.; Yue, W. Urban land expansion and regional inequality in transitional China. Landsc. Urban. Plan. 2017, 163, 17–31. [Google Scholar] [CrossRef]
- Frank, J.; Martinez-Vazquez, J. Decentralization and Infrastructure in the Global Economy; Routledge: London, UK, 2015; pp. 136–180. [Google Scholar]
- Salas, J.; Yepes, V. Enhancing Sustainability and Resilience through Multi-Level Infrastructure Planning. Int. J. Environ. Res. Public Health 2020, 17, 962. [Google Scholar] [CrossRef] [PubMed] [Green Version]
- Li, G.; Guo, F.; Di, D. Regional competition, environmental decentralization, and target selection of local governments. Sci. Total Environ. 2021, 755, 142536. [Google Scholar] [CrossRef] [PubMed]
- Jin, F.; Ma, L. The Direction and Path of Green Rise of Central Region of China in the New Era. Reform 2021, 329, 14–23. [Google Scholar]
- He, S.; Fang, B.; Xie, X. Temporal and Spatial Evolution and Driving Mechanism of Urban Ecological Welfare Performance from the Perspective of High-Quality Development: A Case Study of Jiangsu Province, China. Land 2022, 11, 1607. [Google Scholar] [CrossRef]
- Zheng, H.; He, Y. How does industrial co-agglomeration affect high-quality economic development? Evidence from Chengdu-Chongqing Economic Circle in China. J. Clean. Prod. 2022, 371, 133485. [Google Scholar] [CrossRef]
- Yan, J.; Zhang, W. Regional Disparity and Dynamic Evolution of Distribution of High-Quality Development in Yangze River Economic Belt. Resour. Environ. Yangtze Basin 2022, 31, 259–272. [Google Scholar]
- Zhao, X.; Nakonieczny, J.; Jabeen, F.; Shahzad, U.; Jia, W. Does green innovation induce green total factor productivity? Novel findings from Chinese city level data. Technol. Forecast. Soc. 2022, 185, 122021. [Google Scholar] [CrossRef]
- Wang, H.; Cui, H.; Zhao, Q. Effect of green technology innovation on green total factor productivity in China: Evidence from spatial durbin model analysis. J. Clean. Prod. 2021, 288, 125624. [Google Scholar] [CrossRef]
- Li, Y.; Long, W.; Ning, X.; Zhu, Y.; Guo, Y.; Huang, Z.; Hao, Y. How can China’s sustainable development be damaged in consequence of financial misallocation? Analysis from the perspective of regional innovation capability. Bus. Strat. Environ. 2022, 31, 3649–3668. [Google Scholar] [CrossRef]
- Zhang, R.; Qie, X.; Hu, Y.; Chen, X. Does de-capacity policy promote the efficient and green development of the coal industry?—Based on the evidence of China. Resour. Policy 2022, 77, 102717. [Google Scholar] [CrossRef]
- Yang, T.; Zhou, K.; Zhang, C. Spatiotemporal patterns and influencing factors of green development efficiency in China’s urban agglomerations. Sustain. Cities Soc. 2022, 85, 104069. [Google Scholar] [CrossRef]
- Zhou, B.; Wang, N.; Zhang, Z.; Liu, W.; Lu, W.; Xu, R.; Li, L. Research on the Spatial-Temporal Differentiation and Path Analysis of China’s Provincial Regions’ High-Quality Economic Development. Sustainability 2022, 14, 6348. [Google Scholar] [CrossRef]
- Huang, J.; Tian, Y.; Khanal, R.; Wen, F.; Deng, C. Evaluation and prediction of high-quality development in China: A time-spatial analysis from Hubei province. Front. Environ. Sci. 2022, 10, 987188. [Google Scholar] [CrossRef]
- Fakher, H.A.; Ahmed, Z.; Alvarado, R.; Murshed, M. Exploring renewable energy, financial development, environmental quality, and economic growth nexus: New evidence from composite indices for environmental quality and financial development. Environ. Sci. Pollut. Res. 2022, 29, 70305–70322. [Google Scholar] [CrossRef] [PubMed]
- Huang, Y.; Jiang, X.; Chen, Y. Analysis of the Spatial-Temporal Evolution of Urbanization Quality in Zhejiang Province, China. Int. J. Environ. Res. Public. Health 2023, 20, 4093. [Google Scholar] [CrossRef]
- Guo, Y.; Fan, B.; Long, J. Practical Evaluation of China’s Regional High-quality Development and Its Spatiotemporal Evolution Characteristics. J. Quant. Technol. Econ. 2020, 37, 118–132. [Google Scholar]
- Chen, J.; Chen, Y.; Chen, M. China’s High-quality Economic Development Level, Regional Differences and Dynamic Evolution of Distribution. J. Quant. Technol. Econ. 2020, 37, 108–126. [Google Scholar]
- Li, X.; Lu, Y.; Huang, R. Whether foreign direct investment can promote high-quality economic development under environmental regulation: Evidence from the Yangtze River Economic Belt, China. Environ. Sci. Pollut. Res. 2021, 28, 21674–21683. [Google Scholar] [CrossRef]
- Everard, M.; Longhurst, J.W.S. Reasserting the primacy of human needs to reclaim the ‘lost half’ of sustainable development. Sci. Total Environ. 2018, 621, 1243–1254. [Google Scholar] [CrossRef]
- Song, M.; Tao, W.; Shen, Z. Improving high-quality development with environmental regulation and industrial structure in China. J. Clean. Prod. 2022, 366, 132997. [Google Scholar] [CrossRef]
- Zhu, Y.; Liang, D.; Liu, T.; Song, Y. The impact of production factor distortion on total factor energy productivity: Insight from China’s region level. Environ. Sci. Pollut. Res. 2020, 27, 40715–40731. [Google Scholar] [CrossRef]
- Yang, M.; Wang, J.; Jing, Z.; Liu, B.; Niu, H. Evaluation and regulation of resource-based city resilience: Evidence from Shanxi Province, China. Int. J. Disaster Risk Reduct. 2022, 81, 103256. [Google Scholar] [CrossRef]
- Yu, S.; Zheng, S.; Li, X.; Li, L. China can peak its energy-related carbon emissions before 2025: Evidence from industry restructuring. Energy Econ. 2018, 73, 91–107. [Google Scholar] [CrossRef]
- Zhao, X.; Zhu, J. Industrial restructuring, energy consumption and economic growth: Evidence from China. J. Clean. Prod. 2022, 335, 130242. [Google Scholar]
- Bai, J.; Liu, Y. Can Outward Foreign Direct Investment Improve the Resource Misallocation of China. China Ind. Econ. 2018, 358, 60–78. [Google Scholar]
- Wei, X.; Liu, L.; Yuan, C.; Xia, Z. Determining urban-rural coordinated development in major grain-producing areas based on urbanization and cultivated land use efficiency coordination level: A case study in Hunan Province, China. Front. Environ. Sci. 2023, 10, 1091898. [Google Scholar] [CrossRef]
- Gnidchenko, A.A. Structural transformation and quality ladders: Evidence from the new Theil’s decomposition. Struct. Chang. Econ. Dyn. 2021, 59, 281–291. [Google Scholar] [CrossRef]
- Wang, Y.; Gong, X. Analyzing the difference evolution of provincial energy consumption in China using the functional data analysis method. Energy Econ. 2022, 105, 105753. [Google Scholar] [CrossRef]
- Shah, S.A.; Jehanzaib, M.; Lee, J.; Kim, T. Exploring the Factors Affecting Streamflow Conditions in the Han River Basin from a Regional Perspective. KSCE J. Civ. Eng. 2021, 25, 4931–4941. [Google Scholar] [CrossRef]
- Shah, S.; Jehanzaib, M.; Yoo, J.; Hong, S.; Kim, T. Investigation of the Effects of Climate Variability, Anthropogenic Activities, and Climate Change on Streamflow Using Multi-Model Ensembles. Water 2022, 14, 512. [Google Scholar] [CrossRef]
- Liu, Y.; Yang, R.; Sun, M.; Zhang, L.; Li, X.; Meng, L.; Wang, Y.; Liu, Q. Regional sustainable development strategy based on the coordination between ecology and economy: A case study of Sichuan Province, China. Ecol. Indic. 2022, 134, 108445. [Google Scholar] [CrossRef]
- Gan, L.; Yang, X.; Chen, L.; Lev, B.; Lv, Y. Optimization path of Economy-Society-Ecology system orienting industrial structure Adjustment: Evidence from Sichuan Province in China. Ecol. Indic. 2022, 144, 109479. [Google Scholar] [CrossRef]
- Wang, J.; Wei, X.; Guo, Q. A three-dimensional evaluation model for regional carrying capacity of ecological environment to social economic development: Model development and a case study in China. Ecol. Indic. 2018, 89, 348–355. [Google Scholar] [CrossRef]
- Zhang, X.; Zhang, R.; Zhao, M.; Wang, Y.; Chen, X. Policy Orientation, Technological Innovation and Energy-Carbon Performance: An Empirical Study Based on China’s New Energy Demonstration Cities. Front. Environ. Sci. 2022, 10, 846742. [Google Scholar] [CrossRef]
- Chen, W.Y.; Wang, D.T. Economic development and natural amenity: An econometric analysis of urban green spaces in China. Urban For. Urban Green. 2013, 12, 435–442. [Google Scholar] [CrossRef]
- Xiao, Y.; Li, Y.; Tang, X.; Huang, H.; Wang, R. Assessing spatial-temporal evolution and key factors of urban livability in arid zone: The case study of the Loess Plateau, China. Ecol. Indic. 2022, 140, 108995. [Google Scholar] [CrossRef]
- Hou, C.; Chen, H.; Long, R.; Zhang, L.; Yang, M.; Wang, Y. Construction and empirical research on evaluation system of green productivity indicators: Analysis based on the correlation-fuzzy rough set method. J. Clean. Prod. 2021, 279, 123638. [Google Scholar] [CrossRef]
- Nabizadeh, R.; Yousefzadeh, S.; Yaghmaeian, K.; Alimohammadi, M.; Mokhtari, Z. Bottled water quality ranking via the multiple-criteria decision-making process: A case study of two-stage fuzzy AHP and TOPSIS. Environ. Sci. Pollut. Res. 2022, 29, 20437–20448. [Google Scholar] [CrossRef]
- Wang, L.; Wang, Z.; Ma, Y. Does environmental regulation promote the high-quality development of manufacturing? A quasi-natural experiment based on China’s carbon emission trading pilot scheme. Socio-Econ. Plan. Sci. 2022, 81, 101216. [Google Scholar] [CrossRef]
- Liu, K.; Xue, Y.; Chen, Z.; Miao, Y.; Shi, J. Economic spatial structure of China’s urban agglomerations: Regional differences, distribution dynamics, and convergence. Sustain. Cities Soc. 2022, 87, 104253. [Google Scholar] [CrossRef]
- Ma, T.; Liu, Y.; Yang, M. Spatial-Temporal Heterogeneity for Commercial Building Carbon Emissions in China: Based the Dagum Gini Coefficient. Sustainability 2022, 14, 5243. [Google Scholar] [CrossRef]
- Luo, H.; Qu, X. Spatiotemporal Evolution Trends of Urban Total Factor Carbon Efficiency under the Dual-Carbon Background. Land 2023, 12, 69. [Google Scholar] [CrossRef]
- Shi, T.; Qiao, Y.; Zhou, Q.; Zhang, J. The Regional Differences and Random Convergence of Urban Resilience in China. Technol. Econ. Dev. Econ. 2022, 28, 979–1002. [Google Scholar] [CrossRef]
- He, L.; Tao, J.; Meng, P.; Chen, D.; Yan, M.; Vasa, L. Analysis of socio-economic spatial structure of urban agglomeration in China based on spatial gradient and clustering. Oeconomia Copernic. 2021, 12, 789–819. [Google Scholar] [CrossRef]
- Zhu, W.; Xu, L.; Tang, L.; Xiang, X. Eco-efficiency of the Western Taiwan Straits Economic Zone: An evaluation based on a novel eco-efficiency model and empirical analysis of influencing factors. J. Clean. Prod. 2019, 234, 638–652. [Google Scholar] [CrossRef]
- Li, J.; Liang, M.; Zhong, Y. The Spatial-temporal Pattern of the Coordinated Development between Economy and Environment in the Yangtze River Economic Belt and Problem Areas Identification. Resour. Environ. Yangtze Basin 2020, 29, 2584–2596. [Google Scholar]

| Dimensions | Variables | Property |
|---|---|---|
| Economic upside | Gross regional product per capita (CNY per person) | Positive |
| Coefficient of variation of economic growth rate (%) | Negative | |
| Import and export trade/GDP (%) | Positive | |
| Industrial advancement | Negative |
| Dimensions | Variables | Property |
|---|---|---|
| Steady Improvement of Efficiency | Labor Productivity (%) | Positive |
| Capital productivity (%) | Positive | |
| Labor Mismatch | Negative | |
| Capital Mismatch | Negative |
| Dimensions | Variables | Property |
|---|---|---|
| Coordinated Regional Development | Ratio of urban and rural residents’ income (%) | Negative |
| Ratio of urban and rural residents’ consumption (%) | Negative | |
| GDP per capita/GDP per capita of the whole region (%) | Negative | |
| Industrial rationalization | Negative |
| Dimensions | Variables | Property |
|---|---|---|
| Effective Ecological Governance | Industrial wastewater discharge per unit GDP (tons) | Negative |
| Industrial sulfur dioxide emissions per unit GDP (tons) | Negative | |
| Industrial soot emissions per unit GDP (tons) | Negative | |
| Wastewater treatment rate (%) | Positive | |
| Domestic waste treatment rate (%) | Positive |
| Dimensions | Variables | Property |
|---|---|---|
| Development Results Sharing | Number of students in higher education per 10,000 population (person) | Positive |
| Number of doctors per 10,000 people (person) | Positive | |
| Road area per capita (square meters) | Positive | |
| Park green space per capita (square meters) | Positive |
| Year | Overall | Shanxi | Anhui | Jiangxi | Henan | Hubei | Hunan |
|---|---|---|---|---|---|---|---|
| 2006 | 0.1774 | 0.1750 | 0.2211 | 0.1994 | 0.1120 | 0.1367 | 0.1513 |
| 2007 | 0.1831 | 0.1831 | 0.2269 | 0.1971 | 0.1270 | 0.1408 | 0.1489 |
| 2008 | 0.1803 | 0.1674 | 0.2206 | 0.2096 | 0.1169 | 0.1419 | 0.1527 |
| 2009 | 0.1621 | 0.1371 | 0.1851 | 0.1785 | 0.1139 | 0.1321 | 0.1492 |
| 2010 | 0.1708 | 0.1407 | 0.1954 | 0.1840 | 0.1048 | 0.1457 | 0.1603 |
| 2011 | 0.1647 | 0.1364 | 0.1708 | 0.1703 | 0.1184 | 0.1560 | 0.1607 |
| 2012 | 0.1564 | 0.1340 | 0.1555 | 0.1524 | 0.1257 | 0.1511 | 0.1425 |
| 2013 | 0.1600 | 0.1481 | 0.1646 | 0.1307 | 0.1343 | 0.1427 | 0.1602 |
| 2014 | 0.1661 | 0.1642 | 0.1532 | 0.1469 | 0.1382 | 0.1486 | 0.1924 |
| 2015 | 0.1602 | 0.1702 | 0.1392 | 0.1428 | 0.1462 | 0.1460 | 0.1516 |
| 2016 | 0.1565 | 0.1735 | 0.1257 | 0.1365 | 0.1456 | 0.1415 | 0.1507 |
| 2017 | 0.1613 | 0.1715 | 0.1313 | 0.1395 | 0.1492 | 0.1687 | 0.1503 |
| 2018 | 0.1553 | 0.1723 | 0.1366 | 0.1365 | 0.1486 | 0.1502 | 0.1431 |
| 2019 | 0.1499 | 0.1730 | 0.1311 | 0.1264 | 0.1441 | 0.1515 | 0.1292 |
| Year | 2006 | 2009 | 2011 | 2013 | 2015 | 2017 | 2019 | Average |
|---|---|---|---|---|---|---|---|---|
| Shanxi–Anhui | 0.2049 | 0.1753 | 0.1664 | 0.1675 | 0.1676 | 0.1614 | 0.1634 | 0.1724 |
| Shanxi–Jiangxi | 0.1928 | 0.1765 | 0.1835 | 0.1568 | 0.1724 | 0.1748 | 0.1696 | 0.1752 |
| Shanxi–Henan | 0.1531 | 0.1426 | 0.1404 | 0.1548 | 0.1672 | 0.1684 | 0.1630 | 0.1641 |
| Shanxi–Hubei | 0.1692 | 0.1399 | 0.1521 | 0.1487 | 0.1617 | 0.1795 | 0.1688 | 0.1556 |
| Shanxi–Hunan | 0.1682 | 0.1529 | 0.1590 | 0.1624 | 0.1645 | 0.1692 | 0.1597 | 0.1707 |
| Anhui–Jiangxi | 0.2128 | 0.1841 | 0.1809 | 0.1527 | 0.1447 | 0.1401 | 0.1335 | 0.1798 |
| Anhui–Henan | 0.1894 | 0.1748 | 0.1623 | 0.1769 | 0.1738 | 0.1619 | 0.1557 | 0.1600 |
| Anhui–Hubei | 0.1971 | 0.1698 | 0.1707 | 0.1611 | 0.1503 | 0.1535 | 0.1448 | 0.1639 |
| Anhui–Hunan | 0.1952 | 0.1761 | 0.1699 | 0.1742 | 0.1580 | 0.1445 | 0.1335 | 0.1625 |
| Jiangxi–Henan | 0.1775 | 0.1786 | 0.1943 | 0.1769 | 0.1859 | 0.1820 | 0.1632 | 0.1618 |
| Jiangxi–Hubei | 0.1815 | 0.1695 | 0.1809 | 0.1481 | 0.1538 | 0.1582 | 0.1456 | 0.1623 |
| Jiangxi–Hunan | 0.1827 | 0.1775 | 0.1893 | 0.1686 | 0.1659 | 0.1543 | 0.1341 | 0.1645 |
| Henan–Hubei | 0.1600 | 0.1515 | 0.1545 | 0.1597 | 0.1638 | 0.1846 | 0.1585 | 0.1675 |
| Henan–Hunan | 0.1388 | 0.1376 | 0.1463 | 0.1522 | 0.1554 | 0.1672 | 0.1483 | 0.1494 |
| Hubei–Hunan | 0.1653 | 0.1545 | 0.1669 | 0.1633 | 0.1560 | 0.1651 | 0.1434 | 0.1592 |
| Year | Intra-Regional Variation | Contribution Rate/% | Inter-Regional Differences | Contribution Rate/% | Super-Variation Density | Contribution Rate/% |
|---|---|---|---|---|---|---|
| 2006 | 0.0283 | 0.0449 | 0.1042 | 15.97% | 25.31% | 58.72% |
| 2007 | 0.0293 | 0.0461 | 0.1077 | 16.01% | 25.16% | 58.83% |
| 2008 | 0.0288 | 0.0471 | 0.1044 | 15.96% | 26.15% | 57.89% |
| 2009 | 0.0256 | 0.0452 | 0.0914 | 15.77% | 27.85% | 56.38% |
| 2010 | 0.0265 | 0.0590 | 0.0853 | 15.52% | 34.55% | 49.93% |
| 2011 | 0.0257 | 0.0507 | 0.0883 | 15.63% | 30.78% | 53.60% |
| 2012 | 0.0244 | 0.0473 | 0.0847 | 15.60% | 30.25% | 54.15% |
| 2013 | 0.0252 | 0.0437 | 0.0911 | 15.77% | 27.27% | 56.95% |
| 2014 | 0.0266 | 0.0376 | 0.1020 | 15.98% | 22.65% | 61.37% |
| 2015 | 0.0252 | 0.0410 | 0.0940 | 15.72% | 25.59% | 58.69% |
| 2016 | 0.0244 | 0.0392 | 0.0930 | 15.58% | 25.03% | 59.39% |
| 2017 | 0.0254 | 0.0357 | 0.1002 | 15.75% | 22.15% | 62.09% |
| 2018 | 0.0250 | 0.0290 | 0.1014 | 16.07% | 18.64% | 65.29% |
| 2019 | 0.0240 | 0.0270 | 0.0988 | 16.04% | 18.03% | 65.93% |
| Year | Moran’s I | p |
|---|---|---|
| 2006 | 0.3330 | 0.0000 |
| 2007 | 0.3339 | 0.0000 |
| 2008 | 0.4115 | 0.0000 |
| 2009 | 0.3647 | 0.0000 |
| 2010 | 0.3430 | 0.0000 |
| 2011 | 0.3570 | 0.0000 |
| 2012 | 0.3494 | 0.0000 |
| 2013 | 0.3292 | 0.0000 |
| 2014 | 0.3200 | 0.0000 |
| 2015 | 0.3234 | 0.0000 |
| 2016 | 0.2967 | 0.0000 |
| 2017 | 0.2986 | 0.0000 |
| 2018 | 0.3054 | 0.0000 |
| 2019 | 0.3213 | 0.0000 |
Disclaimer/Publisher’s Note: The statements, opinions and data contained in all publications are solely those of the individual author(s) and contributor(s) and not of MDPI and/or the editor(s). MDPI and/or the editor(s) disclaim responsibility for any injury to people or property resulting from any ideas, methods, instructions or products referred to in the content. |
© 2023 by the authors. Licensee MDPI, Basel, Switzerland. This article is an open access article distributed under the terms and conditions of the Creative Commons Attribution (CC BY) license (https://creativecommons.org/licenses/by/4.0/).
Share and Cite
Zhao, M.; Zhang, R.; Liu, H.; Zhang, X.; Wang, Y. A Study on the Spatial-Temporal Evolution and Problem Area Identification of High-Quality Urban Development in the Central Region. Sustainability 2023, 15, 11098. https://doi.org/10.3390/su151411098
Zhao M, Zhang R, Liu H, Zhang X, Wang Y. A Study on the Spatial-Temporal Evolution and Problem Area Identification of High-Quality Urban Development in the Central Region. Sustainability. 2023; 15(14):11098. https://doi.org/10.3390/su151411098
Chicago/Turabian StyleZhao, Meilin, Rui Zhang, Hong Liu, Xiaoyi Zhang, and Yue Wang. 2023. "A Study on the Spatial-Temporal Evolution and Problem Area Identification of High-Quality Urban Development in the Central Region" Sustainability 15, no. 14: 11098. https://doi.org/10.3390/su151411098
APA StyleZhao, M., Zhang, R., Liu, H., Zhang, X., & Wang, Y. (2023). A Study on the Spatial-Temporal Evolution and Problem Area Identification of High-Quality Urban Development in the Central Region. Sustainability, 15(14), 11098. https://doi.org/10.3390/su151411098


