
Thermal Performance Assessment of Lightweight Aggregate Concrete by Different Test Methods

 ,
,  ,
, 
Abstract
:1. Introduction
2. Experimental Program
2.1. Materials, Compositions and Production
2.2. Specimen Production
2.3. Modified Transient Pulse Method
2.4. Quasi-Stationary Method
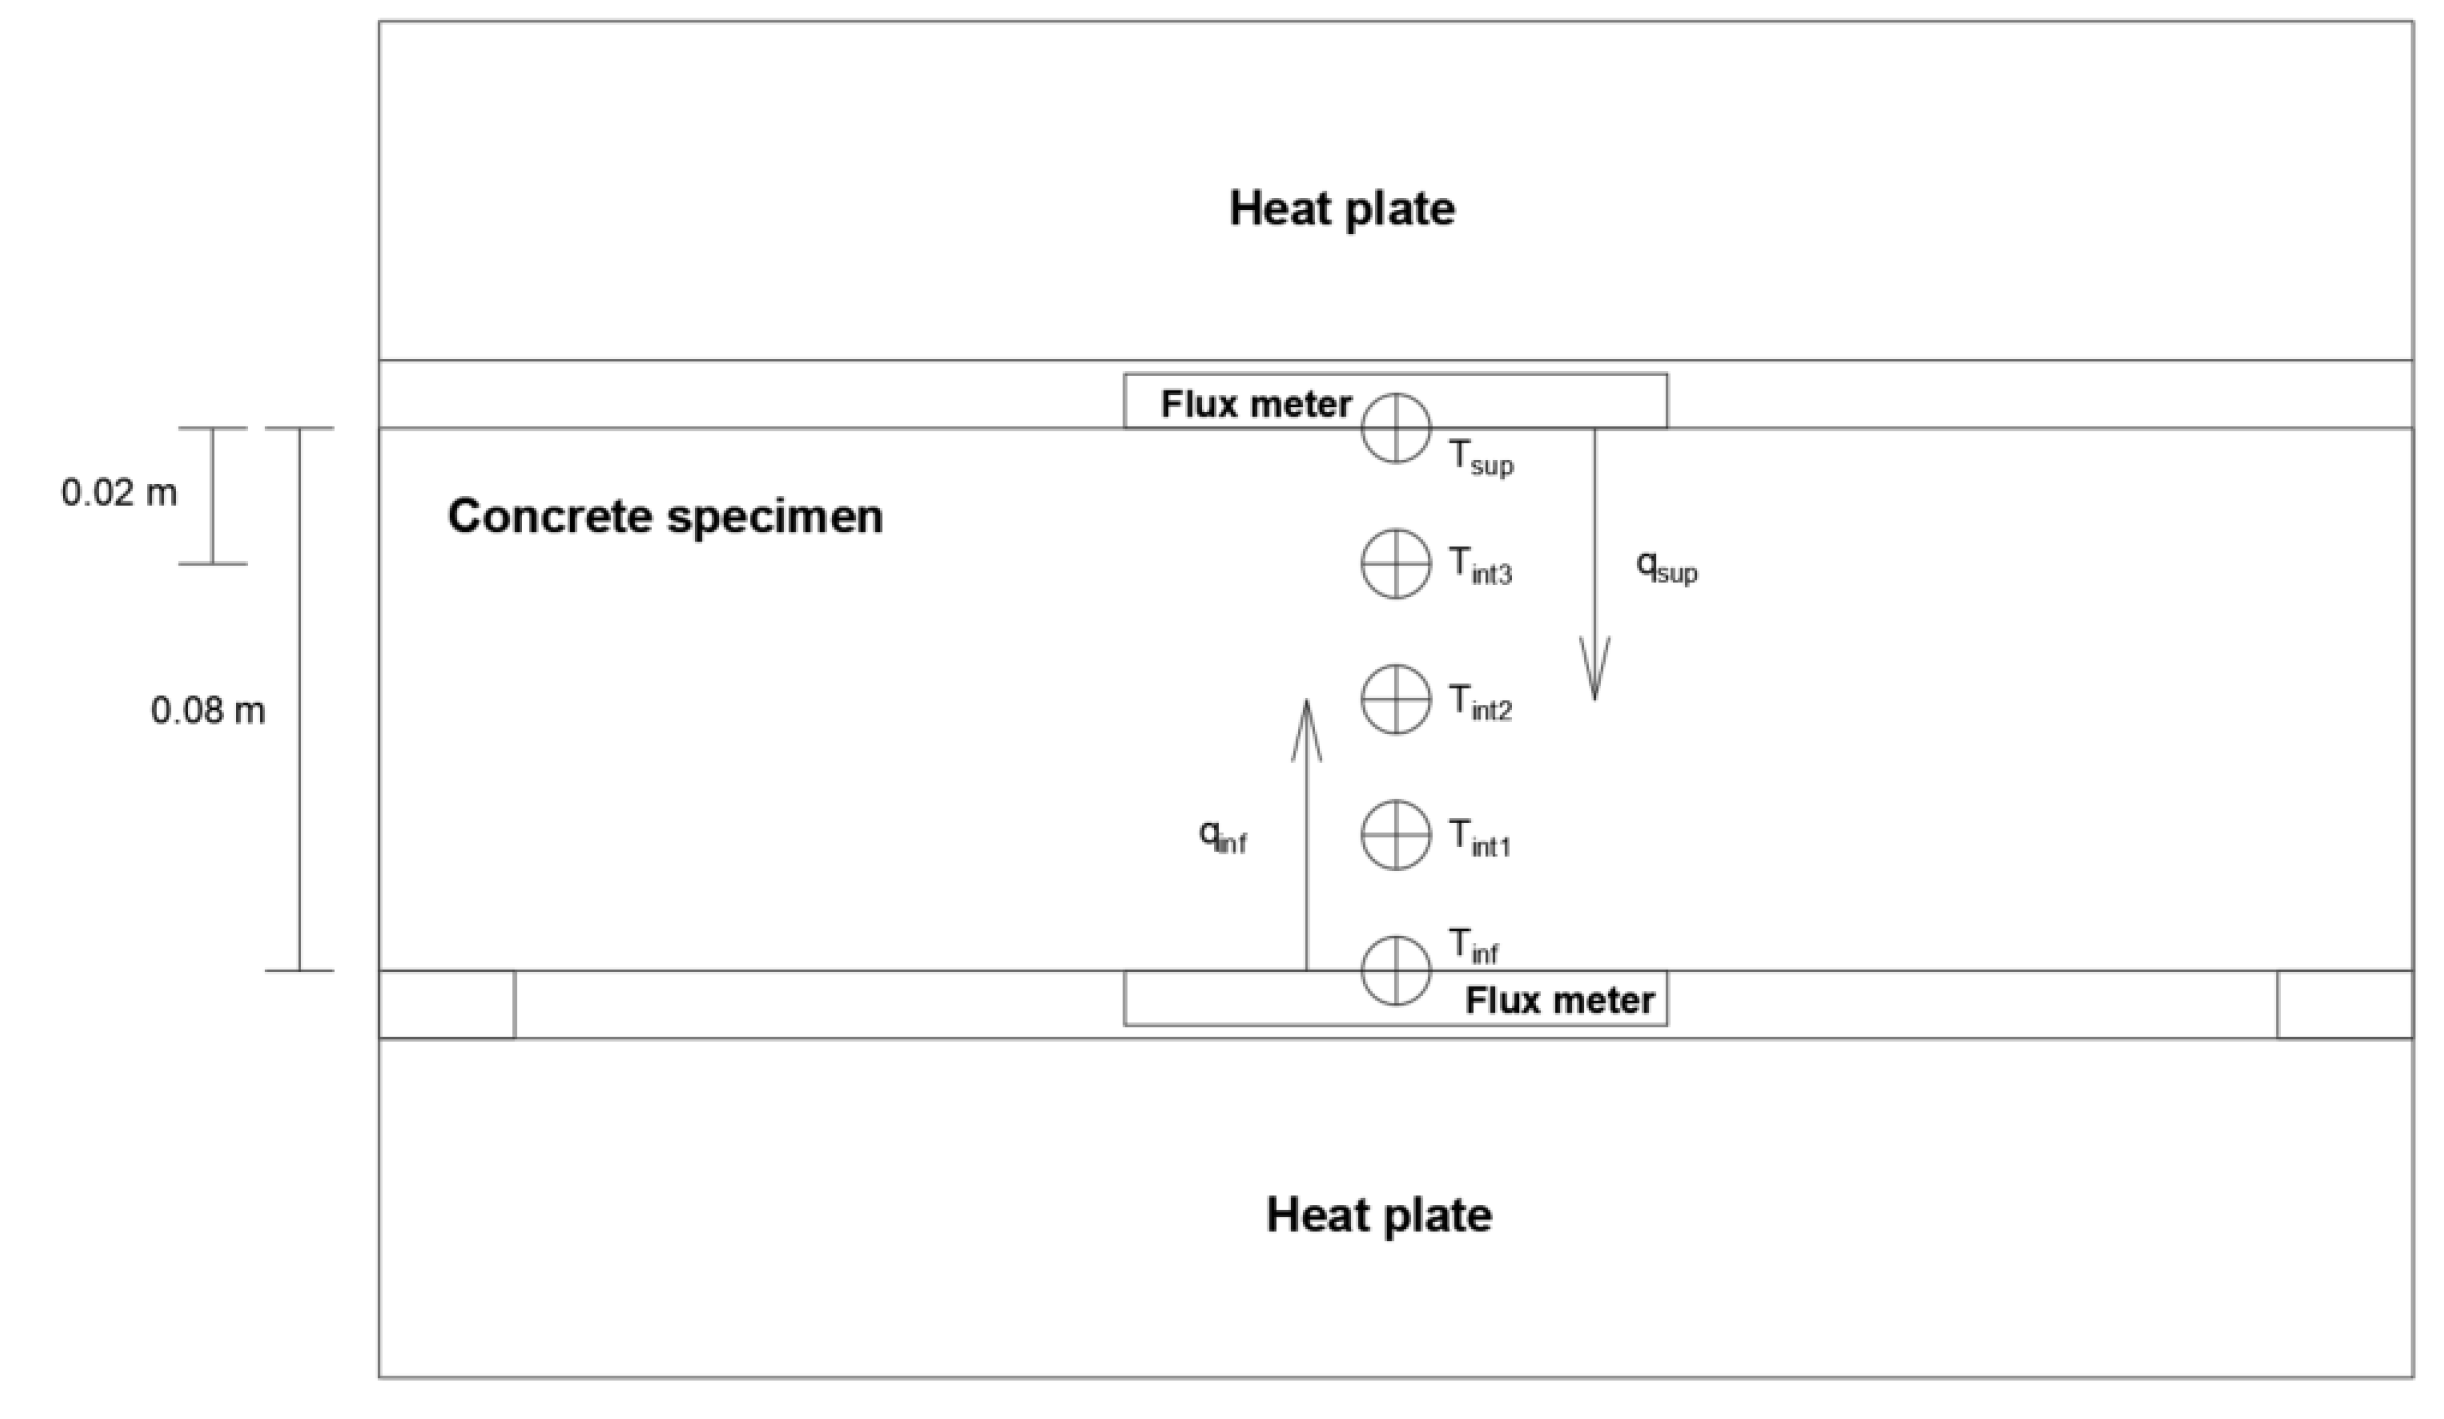
2.5. Heat Transfer Method
3. Results
3.1. Thermal Properties from the Modified Transient Pulse Method
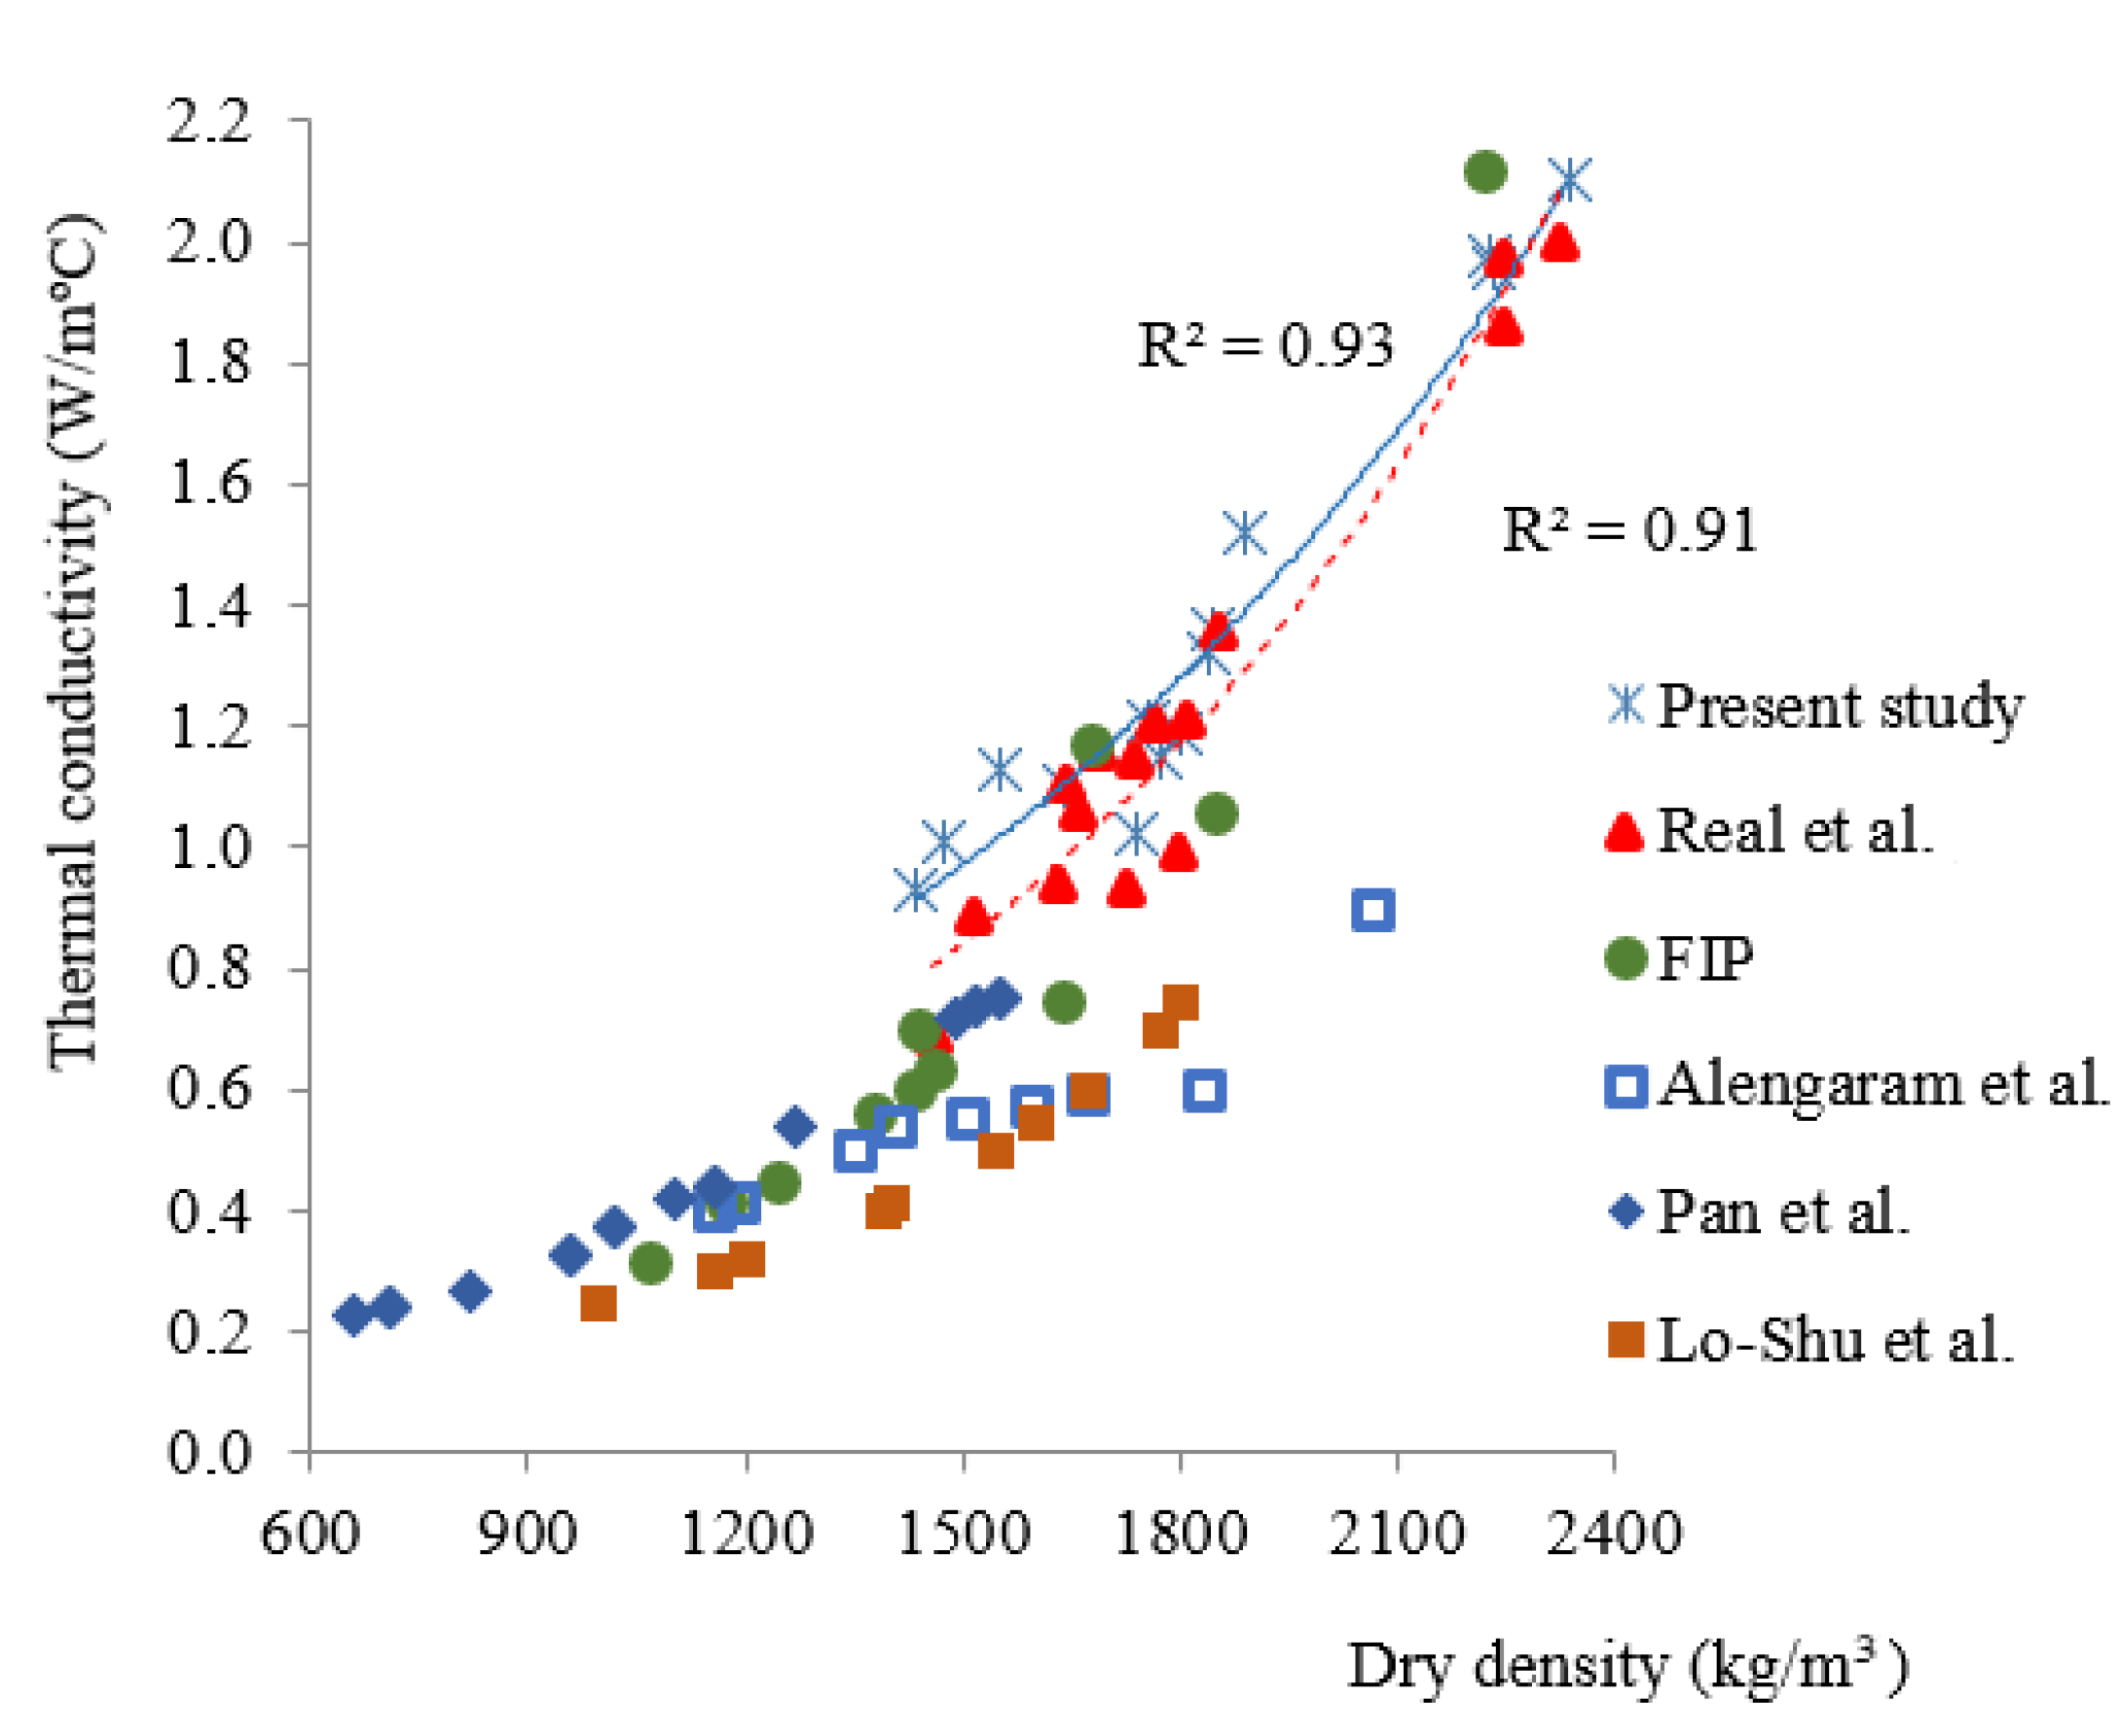
3.2. Thermal Conductivity from the Quasi-Stationary Method
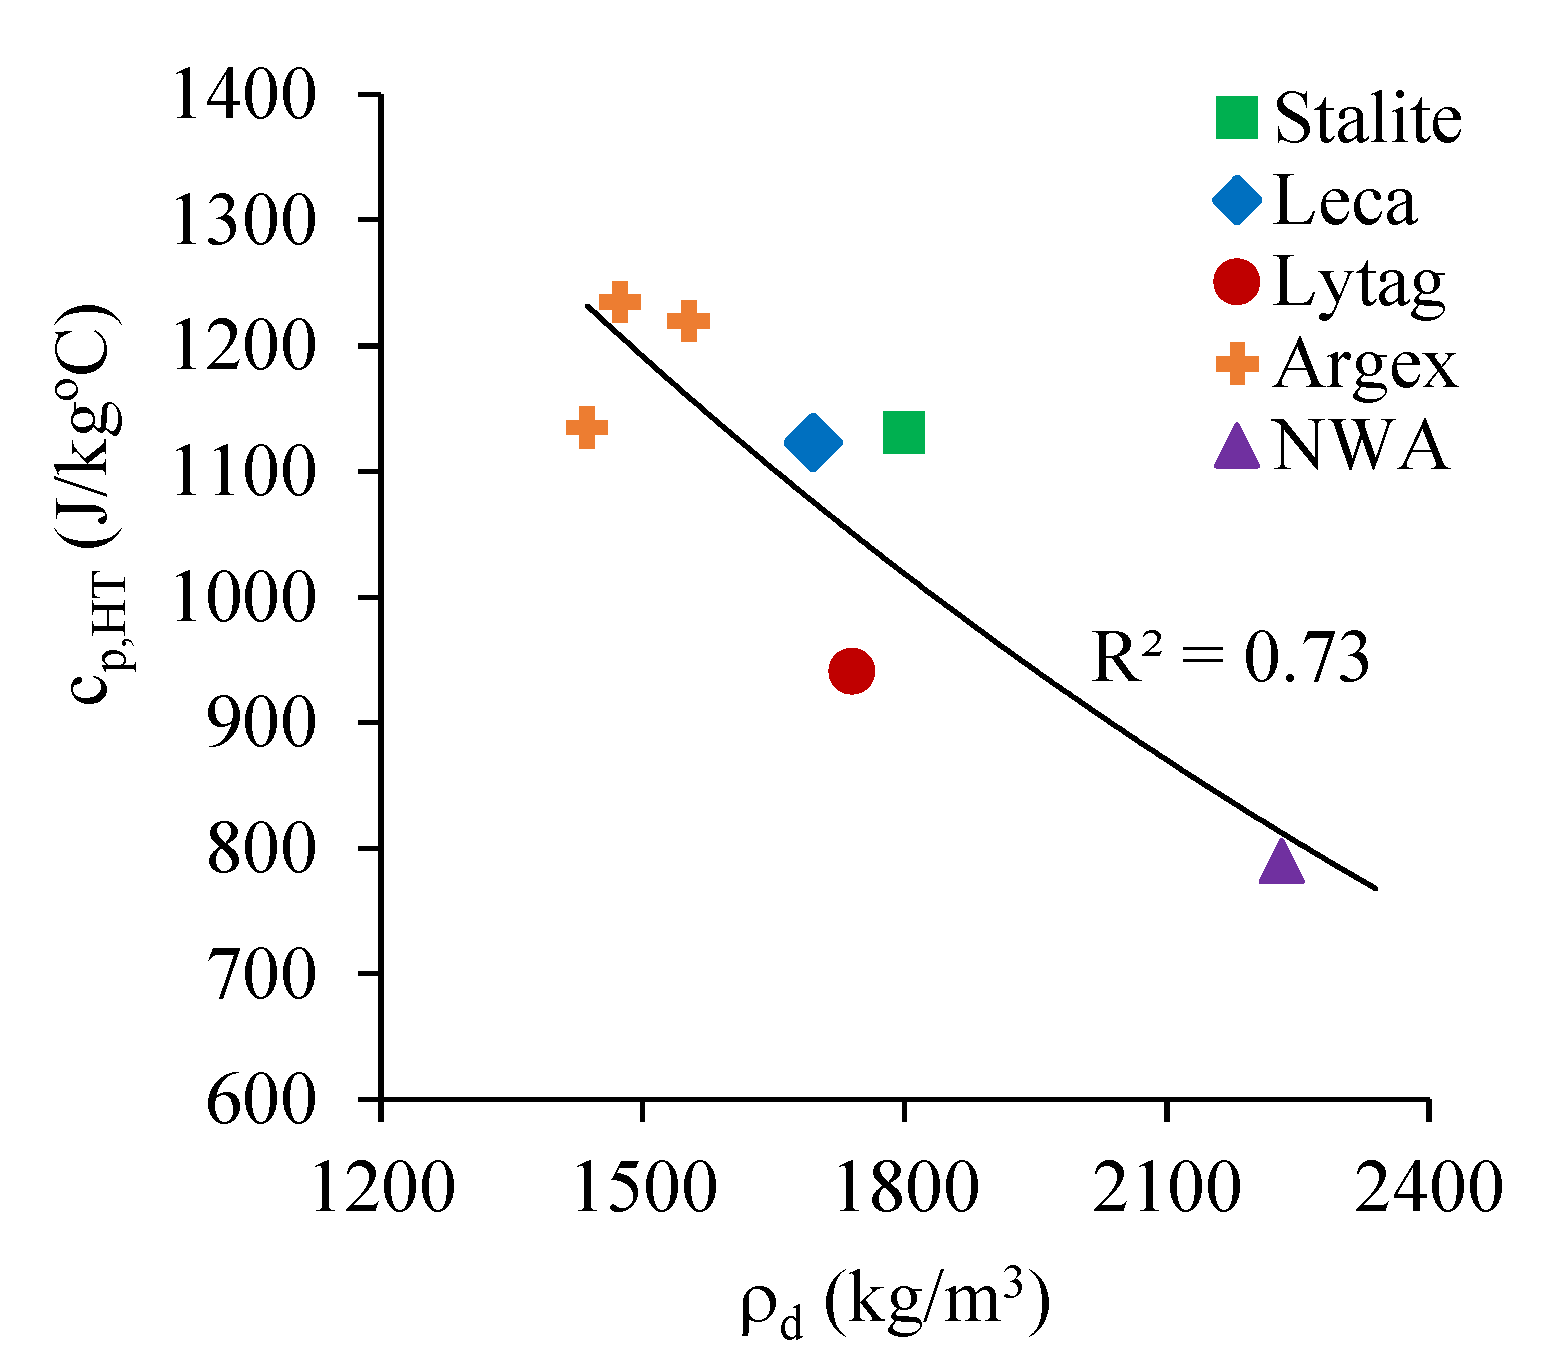
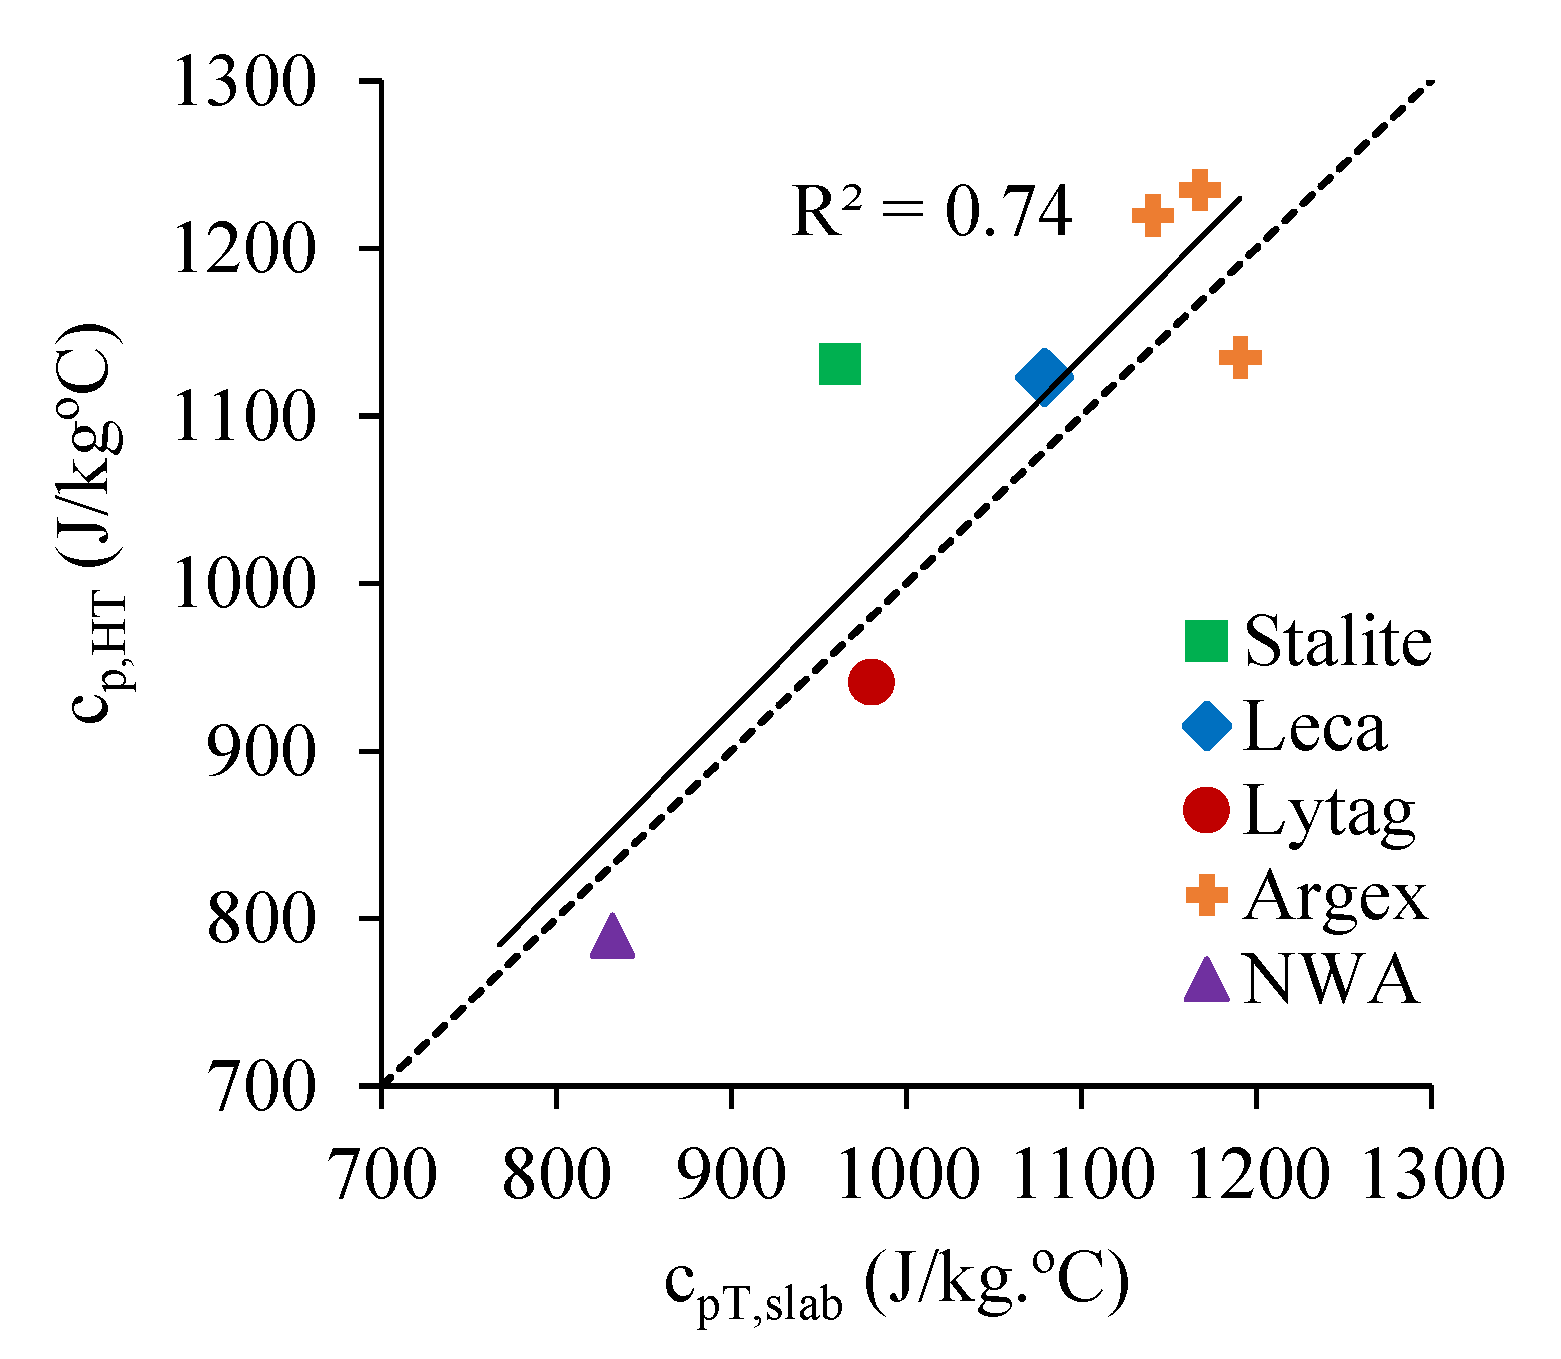
3.3. Specific Heat Capacity from the Heat Transfer Method
4. Conclusions
Author Contributions
Funding
Institutional Review Board Statement
Informed Consent Statement
Data Availability Statement
Acknowledgments
Conflicts of Interest
References
- Dong, B.; Cao, C.; Lee, S. Applying support vector machines to predict building energy consumption in tropical region. Energy Build. 2005, 37, 545–553. [Google Scholar] [CrossRef]
- Cao, X.; Dai, X.; Liu, J. Building energy-consumption status worldwide and the state-of-the-art technologies for zero-energy buildings during the past decade. Energy Build. 2016, 128, 198–213. [Google Scholar] [CrossRef]
- Liu, M.Y.J.; Alengaram, U.J.; Jumaat, M.Z.; Mo, K.H. Evaluation of thermal conductivity, mechanical and transport properties of lightweight aggregate foamed geopolymer concrete. Energy Build. 2014, 72, 238–245. [Google Scholar] [CrossRef]
- Real, S.; Bogas, J.; Gomes, M.; Ferrer, B. Thermal conductivity of structural lightweight aggregate concrete. Mag. Concr. Res. 2015, 68, 798–808. [Google Scholar] [CrossRef]
- Real, S.; Gomes, M.G.; Moret Rodrigues, A.; Bogas, J.A. Contribution of structural lightweight aggregate concrete to the reduction of thermal bridging effect in buildings. Constr. Build. Mater. 2016, 121, 460–470. [Google Scholar] [CrossRef]
- Holm, T.; Bremner, T. State-of-the-Art Report on High-Strength, High Durability Structural Low-Density Concrete for Applications in Severe Marine Environments; ERDC/SL TR-00-3; US Army Corps of Engineers, Structural Laboratory: Washington, DC, USA, 2000. [Google Scholar]
- Real, S.; Maia, C.; Bogas, J.; Gomes, M. Thermal conductivity modelling of structural lightweight aggregate concrete. Mag. Concr. Res. 2021, 73, 798–809. [Google Scholar] [CrossRef]
- Kim, H.K.; Jeon, J.H.; Lee, H.K. Workability, and mechanical, acoustic and thermal properties of lightweight aggregate concrete with a high volume of entrained air. Constr. Build. Mater. 2012, 29, 193–200. [Google Scholar] [CrossRef]
- Mousa, A.; Mahgoub, M.; Hussein, M. Lightweight concrete in America: Presence and challenges. Sustain. Prod. Consum. 2018, 15, 131–144. [Google Scholar] [CrossRef]
- Tajra, F.; Elrahman, M.; Stephan, D. The production and properties of cold-bonded aggregate and its applications in concrete: A review. Constr. Build. Mater. 2019, 225, 29–43. [Google Scholar] [CrossRef]
- Kumar, P.; Pasla, D.; Jothi Saravanan, T. Self-compacting lightweight aggregate concrete and its properties: A review. Constr. Build. Mater. 2023, 375, 130861. [Google Scholar] [CrossRef]
- Vives, I.; Varona, F.; Tenza-Abril, A.; Pereiro-Barceló, J. A parametric study to assess lightweight aggregate concrete for future sustainable construction of reinforced concrete beams. Sustainability 2021, 13, 13893. [Google Scholar] [CrossRef]
- Ries, J.; Speck, J.; Harmon, K. Lightweight aggregate optimizes the sustainability of concrete, through weight reduction, internal curing, extended service life, and lower carbon footprint. In Proceedings of the Concrete Sustainability Conference, National Ready Mixed Concrete Association, Tempe, AZ, USA, 13–15 April 2010. [Google Scholar]
- Tajra, F.; Elrahman, M.; Lehmann, C.; Stephan, D. Properties of lightweight concrete made with core-shell structured lightweight aggregate. Constr. Build. Mater. 2019, 205, 39–51. [Google Scholar] [CrossRef]
- Bessenouci, M.Z.; Bibi Triki, N.E.; Khelladi, S.; Draoui, B.; Abene, A. The apparent thermal conductivity of pozzolana concrete. Phys. Procedia 2011, 21, 59–66. [Google Scholar] [CrossRef] [Green Version]
- FIP. FIP Manual of Lightweight Aggregate Concrete, 2nd ed.; FIP/Surrey University Press: Glasgow, Scotland, 1983. [Google Scholar]
- Chi, J.; Huang, R.; Yang, C.C.; Chang, J.J. Effect of aggregate properties on the strength and stiffness of lightweight concrete. Cem. Concr. Compos. 2003, 25, 197–205. [Google Scholar] [CrossRef]
- ACI 213R; Guide for Structural Lightweight-Aggregate Concrete. American Concrete Institute (ACI): Farmington Hills, MI, USA, 2003.
- Uysal, H.; Demirboǧa, R.; Sahin, R.; Gül, R. The effects of different cement dosages, slumps and pumice aggregate ratios on the freezing and thawing of concrete. Comput. Concr. 2004, 34, 845–848. [Google Scholar] [CrossRef]
- Alengaram, U.J.; Al Muhit, B.A.; Jumaat, M.Z.; Jing, M.L.Y. A comparison of the thermal conductivity of oil palm shell foamed concrete with conventional materials. Mater. Des. 2013, 51, 522–529. [Google Scholar] [CrossRef]
- Gomes, M.; Rodrigues, A.; Bogas, J.; Freitas, A. Thermophysical properties under different hygroscopic conditions of an innovative composite concrete pre-walls system. Constr. Build. Mater. 2021, 307, 124938. [Google Scholar] [CrossRef]
- Demirboǧa, R.; Gül, R. The effects of expanded perlite aggregate, silica fume and fly ash on the thermal conductivity of lightweight concrete. Cem. Concr. Res. 2003, 33, 723–727. [Google Scholar] [CrossRef]
- EuroLightCon R2. LWAC material properties—State-of-the-art. In European Union—Brite EuRam III; BE96-3942/R2; Delft University of Technology: Delft, The Netherlands, 1998. [Google Scholar]
- Bogas, J.; Gomes, A. Compressive behavior and failure modes of structural lightweight aggregate concrete—Characterization and strength prediction. Mater. Des. 2013, 46, 832–841. [Google Scholar] [CrossRef]
- Ferone, C.; Colangelo, F.; Messina, F.; Lucolano, F.; Liguori, B.; Cioffi, R. Coal combustion wastes reuse in low energy artificial aggregates manufacturing. Materials 2013, 6, 5000–5015. [Google Scholar] [CrossRef] [Green Version]
- Thomas, J.; Harilal, B. Properties of cold bonded quarry dust coarse aggregates and its use in concrete. Cem. Concr. Compos. 2015, 62, 67–75. [Google Scholar] [CrossRef]
- Hwang, C.-L.; Tran, V.-A. A study of the properties of foamed lightweight aggregate for self-consolidating concrete. Constr. Build. Mater. 2015, 87, 78–85. [Google Scholar] [CrossRef]
- Bogas, J.A.; Real, S. A review on the carbonation and chloride penetration resistance of structural lightweight aggregate concrete. Materials 2019, 12, 3456. [Google Scholar] [CrossRef] [PubMed] [Green Version]
- Oktay, H.; Yumrutaş, R.; Akpolat, A. Mechanical and thermophysical properties of lightweight aggregate concretes. Constr. Build. Mater. 2015, 96, 217–225. [Google Scholar] [CrossRef]
- Fu, X.; Chung, D.D.L. Effects of silica fume, latex, methylcellulose, and carbon fibers on the thermal conductivity and specific heat of cement paste. Cem. Concr. Res. 1997, 27, 1799–1804. [Google Scholar] [CrossRef]
- Xu, Y.; Chung, D. Effect of sand addition on the specific heat and thermal conductivity of cement. Cem. Concr. Res. 2000, 30, 59–61. [Google Scholar] [CrossRef]
- Hoff, G. High strength lightweight aggregate concrete for artic applications—Part 1–3. In Structural Lightweight Aggregate Concrete Performance; ACI SP-136; Holm, T.A., Vaysburd, A.M., Eds.; ACI: Farmington Hills, MI, USA, 1992. [Google Scholar]
- ITE 50. Thermal Transmittance Coefficients of Building Envelope Elements; Laboratório de Engenharia Civil (LNEC): Lisbon, Portugal, 2006. (In Portuguese) [Google Scholar]
- Neville, A. Properties of Concrete, 4th ed.; Standards Updated to 2002; Longman: Harlow, UK, 2004. [Google Scholar]
- Nguyen, L.H.; Beaucour, A.L.; Ortola, S.; Noumowé, A. Influence of the volume fraction and the nature of fine lightweight aggregates on the thermal and mechanical properties of structural concrete. Constr. Build. Mater. 2014, 51, 121–132. [Google Scholar] [CrossRef]
- Malešev, M.; Radonjanin, V.; Lukić, I.; Bulatović, V. The effect of aggregate, type and quantity of cement on modulus of elasticity of lightweight aggregate concrete. Arab. J. Sci. Eng. 2014, 39, 705–711. [Google Scholar] [CrossRef]
- Weigler, H.; Karl, S. Structural lightweight aggregate concrete with reduced density- lightweight aggregate foamed concrete. Int. J. Cem. Compos. Light. Concr. 1980, 2, 101–104. [Google Scholar] [CrossRef]
- Bogas, J.A.; Carriço, A.; Pontes, J. Influence of cracking on the capillary absorption and carbonation of structural lightweight aggregate concrete. Cem. Concr. Compos. 2019, 104, 103382. [Google Scholar] [CrossRef]
- Van Geem, M.; Fiorato, A.; Musser, D. Calibrated hot box tests of thermal performance of concrete walls. In Proceedings of the ASHRAE/DOE Conference on Thermal Performance of the Exterior Envelopes of Buildings II, Las Vegas, NV, USA, 6–9 December 1982; ASHRAE: Atlanta, GA, USA, 1982. [Google Scholar]
- Asadi, I.; Shafigh, P.; Hassan, Z.; Mahyuddin, N. Thermal conductivity of concrete—A review. J. Build. Eng. 2018, 20, 81–93. [Google Scholar] [CrossRef]
- Gomes, M.; Flores-Colen, I.; Silva, F.; Pedroso, M. Thermal conductivity measurement of thermal insulating mortars with EPS and silica aerogel by steady-state and transient methods. Constr. Build. Mater. 2018, 172, 696–705. [Google Scholar] [CrossRef]
- Bristow, K. Thermal Conductivity, Methods of Soil Analysis: Part 4: Physical Methods; Wiley Online Library: Hoboken, NJ, USA, 2002. [Google Scholar]
- EN 12667; Thermal Performance of Building Materials and Products-Determination of Thermal Resistance by Means of Guarded Hot Plate and Heat Flow Meter Methods-Products of High and Medium Thermal Resistance. European Committee for Standardization (CEN): Brussels, Belgium, 2001.
- Gandage, A.; Rao, V.; Sivakumar, M.; Vasan, A.; Venu, M.; Yaswanth, A. Effect of perlite on thermal conductivity of self-compacting concrete. Procedia Soc. Behav. Sci. 2013, 104, 188–197. [Google Scholar] [CrossRef] [Green Version]
- EN 197-1; Cement-Part 1: Composition, Specifications and Conformity Criteria for Common Cements. European Committee for Standardization (CEN): Brussels, Belgium, 2011.
- EN 12620; Aggregates for Concrete. European Committee for Standardization (CEN): Brussels, Belgium, 2013.
- Bogas, J.; Gomes, A. A simple mix design method for structural lightweight aggregate concrete. Mater. Struct. 2013, 46, 1919–1932. [Google Scholar] [CrossRef]
- Bogas, J.; Gomes, A.; Gomes, M. Estimation of water absorbed by expanding clay aggregates during structural lightweight concrete production. Mater. Struct. 2012, 45, 1565–1576. [Google Scholar] [CrossRef]
- EN 12390-3; Testing Hardened Concrete. Compressive Strength of Test Specimens. European Committee for Standardization (CEN): Brussels, Belgium, 2019.
- EN 12390-7; Testing Hardened Concrete—Part 7: Density of Hardened Concrete. European Committee for Standardization (CEN): Brussels, Belgium, 2009.
- ASTM D5334; Standard Test Method for Determination of Thermal Conductivity of Soil and Soft Rock by Thermal Needle Probe Procedure. American Society for Testing & Materials (ASTM): West Conshohocken, PL, USA, 2014.
- ASTM D5930; Thermal Conductivity of Plastics by Means of a Transient Line-Source Technique. American Society for Testing & Materials (ASTM): West Conshohocken, PL, USA, 2009.
- ISO 9869-1; Thermal Insulation. Building Elements. In-Situ Measurement of Thermal Resistance and Thermal Transmittance. Part 1: Heat Flow Meter Method. International Organization for Standardization (ISO): Geneva, Switzerland, 2014.
- ISO/FDIS 10456; Building Materials and Products—Hygrothermal Properties—Tabulated Design Values and Procedures for Determining Declared and Design Thermal Values. International Standards Organization (ISO): Geneva, Switzerland, 2007.
- Cheng, R.; Pomianowski, M.; Wang, X.; Heiselberg, P.; Zhang, Y. A new method to determine thermophysical properties of PCM-concrete brick. Appl. Energy 2013, 112, 988–998. [Google Scholar] [CrossRef]
- Prince, K.; Storn, R.; Lampinen, J. Differential Evolution: A Practical Approach to Global Optimization; Springer: Berlin/Heidelberg, Germany, 2005. [Google Scholar]
- EN 206; Concrete. Specification, Performance, Production and Conformity. European Committee for Standardization (CEN): Brussels, Belgium, 2013.
- Pan, Z.; Hiromi, F.; Wee, T. Preparation of High-Performance Foamed Concrete from Cement, Sand and Mineral Admixtures. J. Wuhan Univ. Technol. Mater. Sci. Ed. 2007, 22, 295–298. [Google Scholar] [CrossRef]
- Lo-Shu, K.; Man-Qing, S.; Xing-Sheng, S.; Yun-Xiu, L. Research on several physicomechanical properties of lightweight aggregate concrete. Int. J. Light. Concr. 1980, 2, 185–191. [Google Scholar] [CrossRef]
- Van Geem, M.; Fiorato, A. Thermal Properties of Masonry Materials for Passive Solar Design—A State-of-the-Art Review; Construction Technology Laboratories, Portland Cement Association: Skokie, IL, USA, 1983. [Google Scholar]
- Bogas, J.Á.; Nogueira, R.; Almeida, N.G. Influence of mineral additions and different compositional parameters on the shrinkage of structural expanded clay lightweight concrete. Mater. Des. 2014, 56, 1039–1048. [Google Scholar] [CrossRef]


| Property | Lightweight Aggregates | Normal-Weight Aggregates | |||||||
|---|---|---|---|---|---|---|---|---|---|
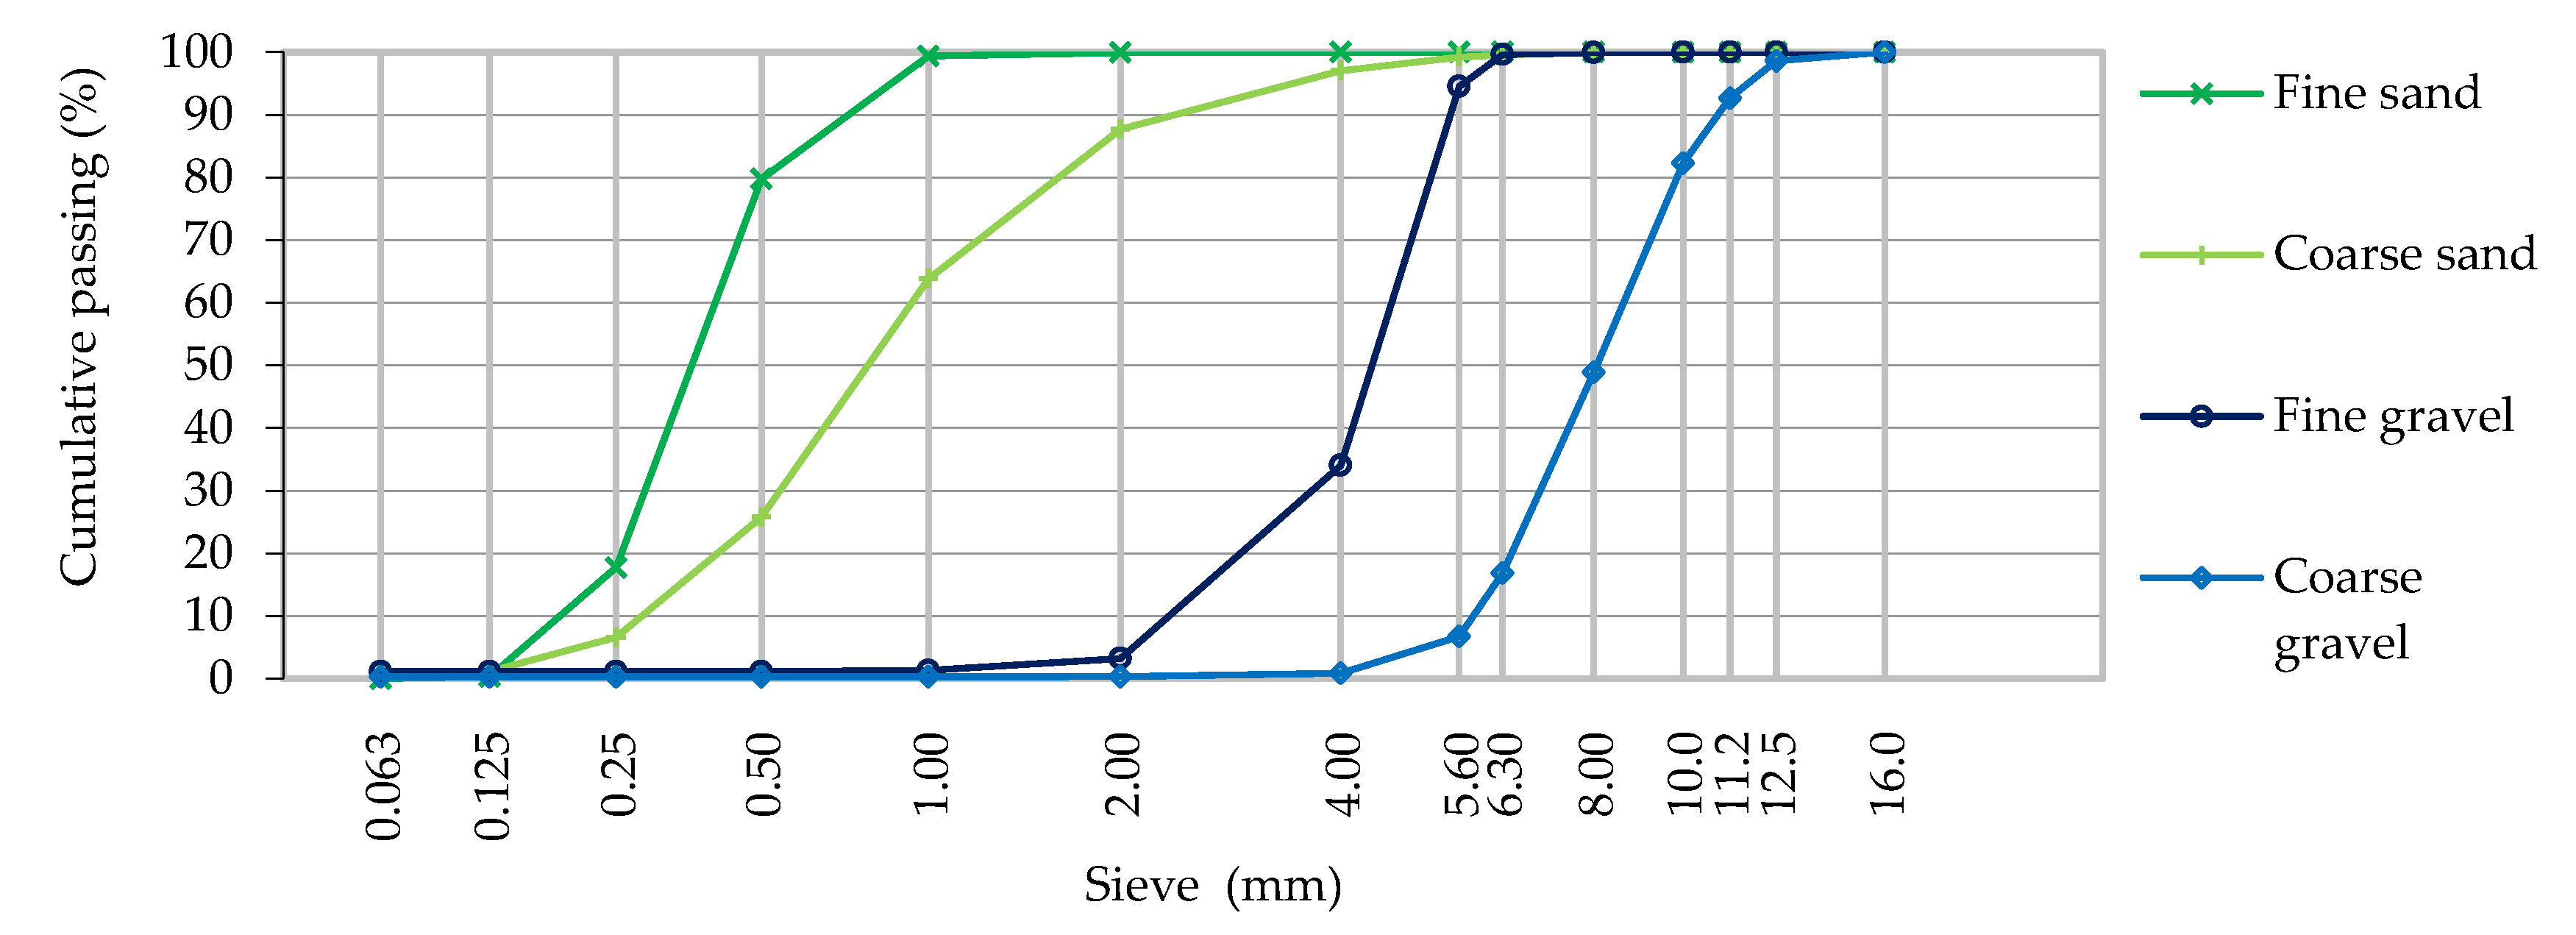
| Stalite | Lytag | Leca | Argex 3–8F | Argex 2–4 | Coarse Sand | Fine Sand | Coarse Gravel | Fine Gravel | |
| Loose bulk density (kg/m3) | 760 | 750 | 624 | 330 | 377 | 1708 | 1569 | 1346 | 1309 |
| Dry density (kg/m3) | 1483 | 1338 | 1076 | 597 | 669 | 2617 | 2605 | 2683 | 2646 |
| Absorption at 24 h (%) | 3.6 | 17.9 | 15.8 | 19.3 | 21.4 | 0.3 | 0.2 | 0.4 | 0.7 |
| Granulometric fraction (di/Di) a | 8/16 | 4/11.2 | 4/11.2 | 4/11.2 | 4/8 | 0/4 | 0/1 | 4/11.2 | 0/8 |
| Total porosity (%) | 43.1 | 47 | 58.9 | 76.1 | 73.1 | - | - | - | - |
| Type of Aggregate (350 L/m3) | w/c | MCEM I (kg/m3) | Vsand (L/m3) | ρd (kg/m3) | fcm,28d (kg/m3) | Modified Transient Pulse Method | Quasi-Stationary Method | Heat Transfer Method | |||||||
|---|---|---|---|---|---|---|---|---|---|---|---|---|---|---|---|
| λT,cyl (W/m°C) [3] | CVλT,cyl (%) | λT,slab (W/m°C) | CVλT,slab (%) | cpT,slab (J/kg°C) | CVcpT,slab (%) | αT,slab (×10−6 m2/s) | λQS (W/m°C) | CVλQS (%) | cpHT (J/kg°C) | ||||||
| NWA | 0.35 | 450 | 314 | 2340 | 76.3 | 2.00 | - | 2.10 | 3 | 767 | 4 | 1.17 | 2.37 | 7 | - |
| 0.45 | 400 | 310 | 2230 | 57.7 | 1.98 | 4 | 1.98 | 0 | 787 | 1 | 1.13 | 2.22 | 6 | - | |
| 0.55 | 350 | 315 | 2230 | 47.8 | 1.86 | 1 | 1.96 | 1 | 832 | 3 | 1.06 | 2.16 | 5 | 790 | |
| Stalite | 0.35 | 450 | 314 | 1890 | 66.8 | 1.36 | 3 | 1.52 | 3 | 1000 | 4 | 0.80 | 1.55 | 1 | - |
| 0.45 | 400 | 310 | 1840 | 49.9 | 1.21 | 3 | 1.36 | 4 | 1006 | 0 | 0.73 | 1.30 | 0 | - | |
| 0.55 | 350 | 315 | 1800 | 41.5 | 0.99 | 2 | 1.19 | 1 | 962 | 5 | 0.69 | 1.20 | 0 | 1131 | |
| Leca | 0.35 | 450 | 314 | 1760 | 43.3 | 1.16 | 5 | 1.21 | 3 | 1034 | 1 | 0.67 | 1.27 | 6 | - |
| 0.45 | 400 | 310 | 1700 | 37.6 | 1.06 | 4 | 1.16 | 0 | 1079 | 0 | 0.63 | 1.14 | 5 | 1123 | |
| 0.55 | 350 | 315 | 1640 | 32.6 | 0.94 | 6 | 1.10 | 2 | 1014 | 1 | 0.66 | 1.04 | 2 | - | |
| Lytag | 0.35 | 450 | 314 | 1840 | 47.8 | 1.20 | 5 | 1.32 | 4 | 986 | 2 | 0.73 | 1.35 | - | - |
| 0.45 | 400 | 310 | 1770 | 41.2 | 1.14 | 1 | 1.15 | 2 | 1000 | 2 | 0.65 | 1.25 | - | - | |
| 0.55 | 350 | 315 | 1740 | 37.3 | 0.93 | 3 | 1.02 | 5 | 980 | 4 | 0.60 | - | - | 941 | |
| Argex | 0.35 | 450 | 314 | 1550 | 28.5 | 1.10 | 11 | 1.13 | - | 1141 | - | 0.64 | 1.02 | - | 1220 |
| 0.45 | 400 | 310 | 1470 | 26.1 | 0.94 | 3 | 1.01 | 3 | 1168 | 2 | 0.59 | 0.95 | - | 1235 | |
| 0.55 | 350 | 315 | 1440 | 22.5 | 0.87 | 2 | 0.93 | 3 | 1191 | 0 | 0.54 | 0.88 | - | 1135 | |
Disclaimer/Publisher’s Note: The statements, opinions and data contained in all publications are solely those of the individual author(s) and contributor(s) and not of MDPI and/or the editor(s). MDPI and/or the editor(s) disclaim responsibility for any injury to people or property resulting from any ideas, methods, instructions or products referred to in the content. |
© 2023 by the authors. Licensee MDPI, Basel, Switzerland. This article is an open access article distributed under the terms and conditions of the Creative Commons Attribution (CC BY) license (https://creativecommons.org/licenses/by/4.0/).
Share and Cite
Gomes, M.d.G.; Bogas, J.A.; Real, S.; Moret Rodrigues, A.; Machete, R. Thermal Performance Assessment of Lightweight Aggregate Concrete by Different Test Methods. Sustainability 2023, 15, 11105. https://doi.org/10.3390/su151411105
Gomes MdG, Bogas JA, Real S, Moret Rodrigues A, Machete R. Thermal Performance Assessment of Lightweight Aggregate Concrete by Different Test Methods. Sustainability. 2023; 15(14):11105. https://doi.org/10.3390/su151411105
Chicago/Turabian StyleGomes, Maria da Glória, José Alexandre Bogas, Sofia Real, António Moret Rodrigues, and Rita Machete. 2023. "Thermal Performance Assessment of Lightweight Aggregate Concrete by Different Test Methods" Sustainability 15, no. 14: 11105. https://doi.org/10.3390/su151411105
APA StyleGomes, M. d. G., Bogas, J. A., Real, S., Moret Rodrigues, A., & Machete, R. (2023). Thermal Performance Assessment of Lightweight Aggregate Concrete by Different Test Methods. Sustainability, 15(14), 11105. https://doi.org/10.3390/su151411105