Article

Potential of Integrated Nutrient Management to Rehabilitate the Dieback-Affected Mango Cultivar Sammer Bahisht Chaunsa

1
Mango Research Institute, Multan P.O. Box 60000, Pakistan
2
Central Cotton Research Institute, Multan P.O. Box 60000, Pakistan
3
Department of Soil Science, Lasbela University of Agriculture, Water and Marine Sciences, Uthal P.O. Box 00150, Pakistan
4
Soil and Water Testing Laboratory, Multan P.O. Box 60000, Pakistan
5
Department of Biotechnology, University of Okara, Okara P.O. Box 56300, Pakistan
6
Department of Botany and Microbiology, College of Science, King Saud University, Riyadh P.O. Box 11451, Saudi Arabia
7
Faculty of Biotechnology, October University for Modern Sciences & Arts (MSA), 6th of October City P.O. Box 12451, Giza, Egypt
8
Department of Chemistry and Biochemistry, Faculty of Medicine and Pharmacy, Ibn Zohr University, Laayoune 70000, Morocco
9
Department of Food Science, Faculty of Agricultural and Food Sciences, Laval University, Quebec City, QC G1V 0A6, Canada
*
Authors to whom correspondence should be addressed.
Sustainability 2023, 15(14), 11118; https://doi.org/10.3390/su151411118
Submission received: 14 May 2023 / Revised: 17 June 2023 / Accepted: 11 July 2023 / Published: 17 July 2023

Abstract

:
The mango cultivar Summer Bahisht (SB) Chaunsa is the most sensitive and susceptible to dieback disease among other cultivars. Despite the environmental variables, low nutritional value contributes to the drastic prevalence of the disease. Therefore, it was hypothesized that providing balanced nutrition through an integrated nutrient approach could rehabilitate plants affected by dieback disease. Treatments were NPK at the recommended dose (control), NPK + farmyard manure, NPK + press mud, NPK + poultry litter, and NPK + city effluent, and NPK + sulfur. Sulfur was applied at 3 kg per plant, while the organic amendments were applied at 100 kg per plant NPK was applied at the recommended dose per square feet of tree canopy. Leaf samples were taken 5 months after treatment application. Results were analyzed through two-way ANOVA analysis using R statistical language software. Although the disease recovery rate was slow and we did not find any plant that recovered one year after treatment application, the reduction in disease was prominent in the treatment where poultry litter + NPK was applied. The poultry litter with the recommended NPK treatment showed 20% and 50% reductions in disease intensity in the 2nd and 3rd years of the experiment, respectively, as compared to NPK alone.

1. Introduction

Sustainable agriculture is important for maintaining the productivity of land, increasing the farmer’s income, and reducing the problems caused by environmental degradation. Keeping view of this context, the dieback disease problem on mango trees was addressed in the present study. Soil health was maintained and plant health was restored by providing organic nutrition to the soil and plant along with chemical fertilizer. Mango, being the national fruit of Pakistan, is the king of summer-season fruits [1]. Among approximately 30 commercial cultivars, ‘Sammer Bahisht Chaunsa (SB Chaunsa)’ is the most important mango cultivar in Pakistan. SB Chaunsa has a delicious taste and awesome aroma liked all over the world [2]. SB Chaunsa has a 37% export share among other cultivars of mango in Pakistan.
Pakistan is facing water shortages [3,4], climate change [3], poor nutritional management [5], and frequent disease incidences [6,7] in commercial and exportable mango varieties [8]. The common diseases of mango are malformation [9,10], quick decline [11], and dieback [12], which contribute to lower yields in Pakistan [6]. Dieback occurrence is more common in SB Chaunsa [13]. The soil fungus Lesiodiplodia theobromae is reported in mango plant’s twigs, leaves, and branches [12,14]. The symptoms of dieback appear as drying of the leaves and branches, gummosis, bark splitting, wilting, and defoliation [12]. The disease intensity is measured in plants by using a disease scoring scale [12]; however, the use of fungicides could be helpful to treat dieback disease in mango plants. However, biological control through the use of bacteria is more useful in the treatment of dieback plants [15].
The dieback disease mostly attacks and spreads when the plants are under stress [13,16,17]. Drought, the existence of hardpan, high temperatures, humidity, salinity, and nutritional deficiency are major abiotic stresses that support disease prevalence. The soils of Pakistan are highly alkaline and calcareous due to high pH and the presence of carbonates, respectively [18]. The most pronounced reason for salinity development in Punjab Pakistan’s soil is the arid climate. Due to low rainfall and precipitation [19], the presence of salts in the root zone hinders nutrient uptake and plant growth [18,20]. The nutritional-use efficiency of the saline soils is far less than that of normal soils due to the presence of specific ions (Na) on exchange sites as compared to essential nutrients [21].
Integrated nutrient management can be a rational approach to improve the health of dieback-affected plants. Nutrients play a greater role in disease resistance and tolerance [22]. Studies have indicated the importance of N, P, K, Mn, Zn, B, Cl, and S in the reduction of disease severity. In Pakistan, organic manures are easily available as a cheap source of organic matter. The organic amendments improve the soil structure and help in the aggregation of soil particles. Soil with high particle aggregation helps in the water-holding and nutrient-holding capacity of the soil [23]. Chemical fertilizer application in combination with organic manures was found to be more useful for nutrient availability, especially for P, K, Zn, Fe, Mn, and Cu [24]. Farmyard manure can be effective in improving plant growth during salinity stress [21]. When manures were applied with chemical fertilizer, these mixtures improve organic matter contents and lower soil pH [25,26]. The main objective of this study was to explore the potential of integrated nutrient management in the reduction of dieback-affected plants.

2. Materials and Methods

2.1. Site Description

An experiment on SB Bahisht Chaunsa plants affected by dieback disorder was conducted during 2016–2019 at the Research Farm of Mango Research Institute Multan, Pakistan (30°09′16.9″ N 71°26′52.9″ E). The climate of the study area was sub-tropical with hot summers and cold winters. Monthly mean values of the parameters (temperature, rainfall, and humidity) during the experiment period were recorded at a meteorological observatory located at the Central Cotton Research Institute (CCRI), 2 km away from the experimental site (Figure 1).

2.2. Identification of Dieback-Affected Plants

L. theobromae- or dieback-affected plants were identified by the presence of symptoms, like drying of leaves, branches, and twigs and defoliation, according to Malik, et al. [12]. Plants of the same age (approximately 20 years old) affected by the disease were selected for the current study.

2.3. Treatment Plan

The field experiment was conducted with six treatments (Table A1). The sources of NPK were calcium ammonium nitrate (CAN), single super phosphate (SSP), and sulfate of potash (SOP), respectively. Four organic sources, farmyard manure, city waste, poultry litter, and press mud, were used as organic amendments. The farmyard manure was collected from a cattle farm adjacent to Tawakal Town Old Shujabad road, Multan, Pakistan (30.1368, 71.44); city waste was from a municipal disposal near a dairy farm, Pak Army Multan (30.173, 71.426); poultry litter was from a poultry farm, Kayyan Pur Multan (30.127, 71.437); and press mud was from Fatma sugar mill, Kot Addu Muzaffar Garh, Pakistan (30.127, 71.437) (Table A1). All organic amendments were air-dried for approximately three months before application to experimental trees. The characterization of amendments was carried out in the Plant Nutrition Laboratory, Mango Research Institute, Multan, Pakistan (Table A2). The soil samples were collected from 0–15 cm and analyzed for the physiochemical properties of the soil [27] (Table A2).

2.4. Field Experiment

After fruit harvesting in 2016, standard horticultural practices in mango production were adapted for all plants, like the pruning of branches and fruit panicles, application of a Bordeaux mixture at the ratio of 1:1:10 (CuSO4, CaCO3, and H2O) on pruned branches and panicles, and irrigation. The upper soil layers up to 0–3 inches were removed under mango tree canopy areas and soil silt collected from the Chenab River bed near Sher Shah, Multan, Pakistan, and was spread under each tree canopy. Commercial-grade copper sulfate at 2 kg plant−1 was applied to the soil during March of each year during the study period. In order to ensure plant vigor, plant reproductive parts were removed in mid-February to mid-March.
Fertilizers were applied using the broadcast method under the canopy area of the tree after the manual removal of weeds. The recommended dose of NPK was 1.5, 1.2, and 1.2 g per square foot of tree canopy, respectively. The average canopy area of the selected plants was 25 × 32 (height × width) sq. ft. The full phosphorus dose was applied in August, while nitrogen and potassium were applied in two half splits, July and February, 2016). Elemental sulfur was applied at 3 kg plant−1 just after fertilizer application in August. The organic amendments were applied at 100 kg plant−1 in December. The soil application of micronutrients (Zn, Cu, Mn, and Fe) was practiced each year in February–March. The recommended rates of Zn, Cu, Mn, and Fe were 250, 70, 150, and 250 g plant−1, which were applied, respectively. The sources for micronutrients were ZnSO4, CuSO4, MnSO4, and FeSO4.

2.5. Soil and Leaf Sampling and Analysis

Before applying treatments to experimental plants, initial soil samples from 0–15 and 15–30 cm depths were collected from each plant just after fruit harvesting in the year 2016. The results obtained from these samples for soil pH, electrical conductivity (EC), P, K, and organic matter were considered pre-treatment results. These pre-treatment soil fertility status assessments were used to compare the effect of chemical fertilizer and organic amendment application on soil health and chemical properties. Leaf samples were taken five months after treatment application to assess the plant nutrient status. Soil samples were brought to the laboratory in polythene bags and kept for air drying. Plant debris was removed from samples and ground with mesh 10. Samples were analyzed for EC at 1:10 with a Neomet EC-400L EC meter (Istek cooperation, Seoul, Republic of Korea) and for pH at a 1:1 ratio with a pH meter (pH 200 lovibond, SensoDirect pH meter, Fisher Scientific, Leicestershire UK), respectively. The available phosphorus was determined according to the Olsen method [28] using a Spectrophotometer (T60 UV-Visible PG Instruments, Leicestershire, UK) [28]. The available potassium was determined in the soil using a Flame Photometer (Spectrolab England, UK) [28]. The organic matter was determined using the potassium dichromate method [29]. The soil textural class was determined using the hydrometer method [30].
Leaf samples were collected after treatment application during October at an above 5″ height from the ground level. The fifth leaf of the branch was taken. Around 50–60 leaves were taken from a tree to make a truly representative sample. Leaves were washed with tap water before air drying to remove dust particles. Afterward, samples were kept in an oven at 70 °C in brown paper bags until a constant weight was obtained. Samples were ground in a poly-mix kinematica AG mill and preserved in plastic zipper bags. The 1 g leaf sample was digested in a di-acid mixture (HNO3:HClO4) on a hot plate until a colorless solution was obtained [31]. The digested material was diluted and filtered to run it on a flame photometer to observe the readings for K [32]. The filtered samples were prepared for the determination of phosphorus using the yellow color method on a spectrophotometer [33]. Leaf samples were also digested with a digestion mixture and sulfuric acid for the determination of nitrogen [34]. Ammoniacal nitrogen was measured through Kjelhal’s distillation on a VELP UDK 132.

2.6. Disease Intensity

Disease intensity was measured by using a disease score. The scale ranged from 1 to 5, where 1 represents minimum disease intensity and 5 represents the maximum in plants. Disease symptoms include drying of leaves, twigs, and branches, defoliation, gummosis, and bark splitting. The following formula was used for calculating disease intensity:
Disease Intensity % = [1(n) + 2(n) + 3(n) + 4(n) + 5(n)]/replication × 5/100,
where n is the no. of trees in each level.

2.7. Statistical Analysis

The data of soil, leaves, and disease intensity were statistically analyzed using a linear model in R software version 40.0 (R_Core_Team, 2020). The treatment effect was analyzed within a year of soil, leaf, and disease scoring. The means of the treatments were speared via least square means and Tukey multiple comparison tests at p < 0.05. The “emmeans” package in R software was used for the analysis of least square means and Tukey multiple comparisons [35].

3. Results

3.1. Plant Tissue Nitrogen, Phosphorus, and Potassium

The nitrogen concentration in the plant was significantly different between treatments and years (main plot treatment, subplot year) (treatment p < 0.01; F = 20.99; DF = 5) (subplot year, p-value < 0.01; F-value = 1216.21; DF = 1). The interaction treatment × year was also highly significant (p < 0.01; F-value 6.7688; DF = 5) (Figure 1). In 2016, the maximum concentration of nitrogen (0.57%) was recorded where NPK + CW was applied (Figure 1), but this remained non-significant with other treatments; however, an inconsistent response of treatments was observed during 2017, 2018, and 2019. The NPK + poultry litter showed a higher response in all years, except 2016, where NPK + CW showed a 3.5% higher nitrogen concentration over NPK + poultry litter (Figure 1).
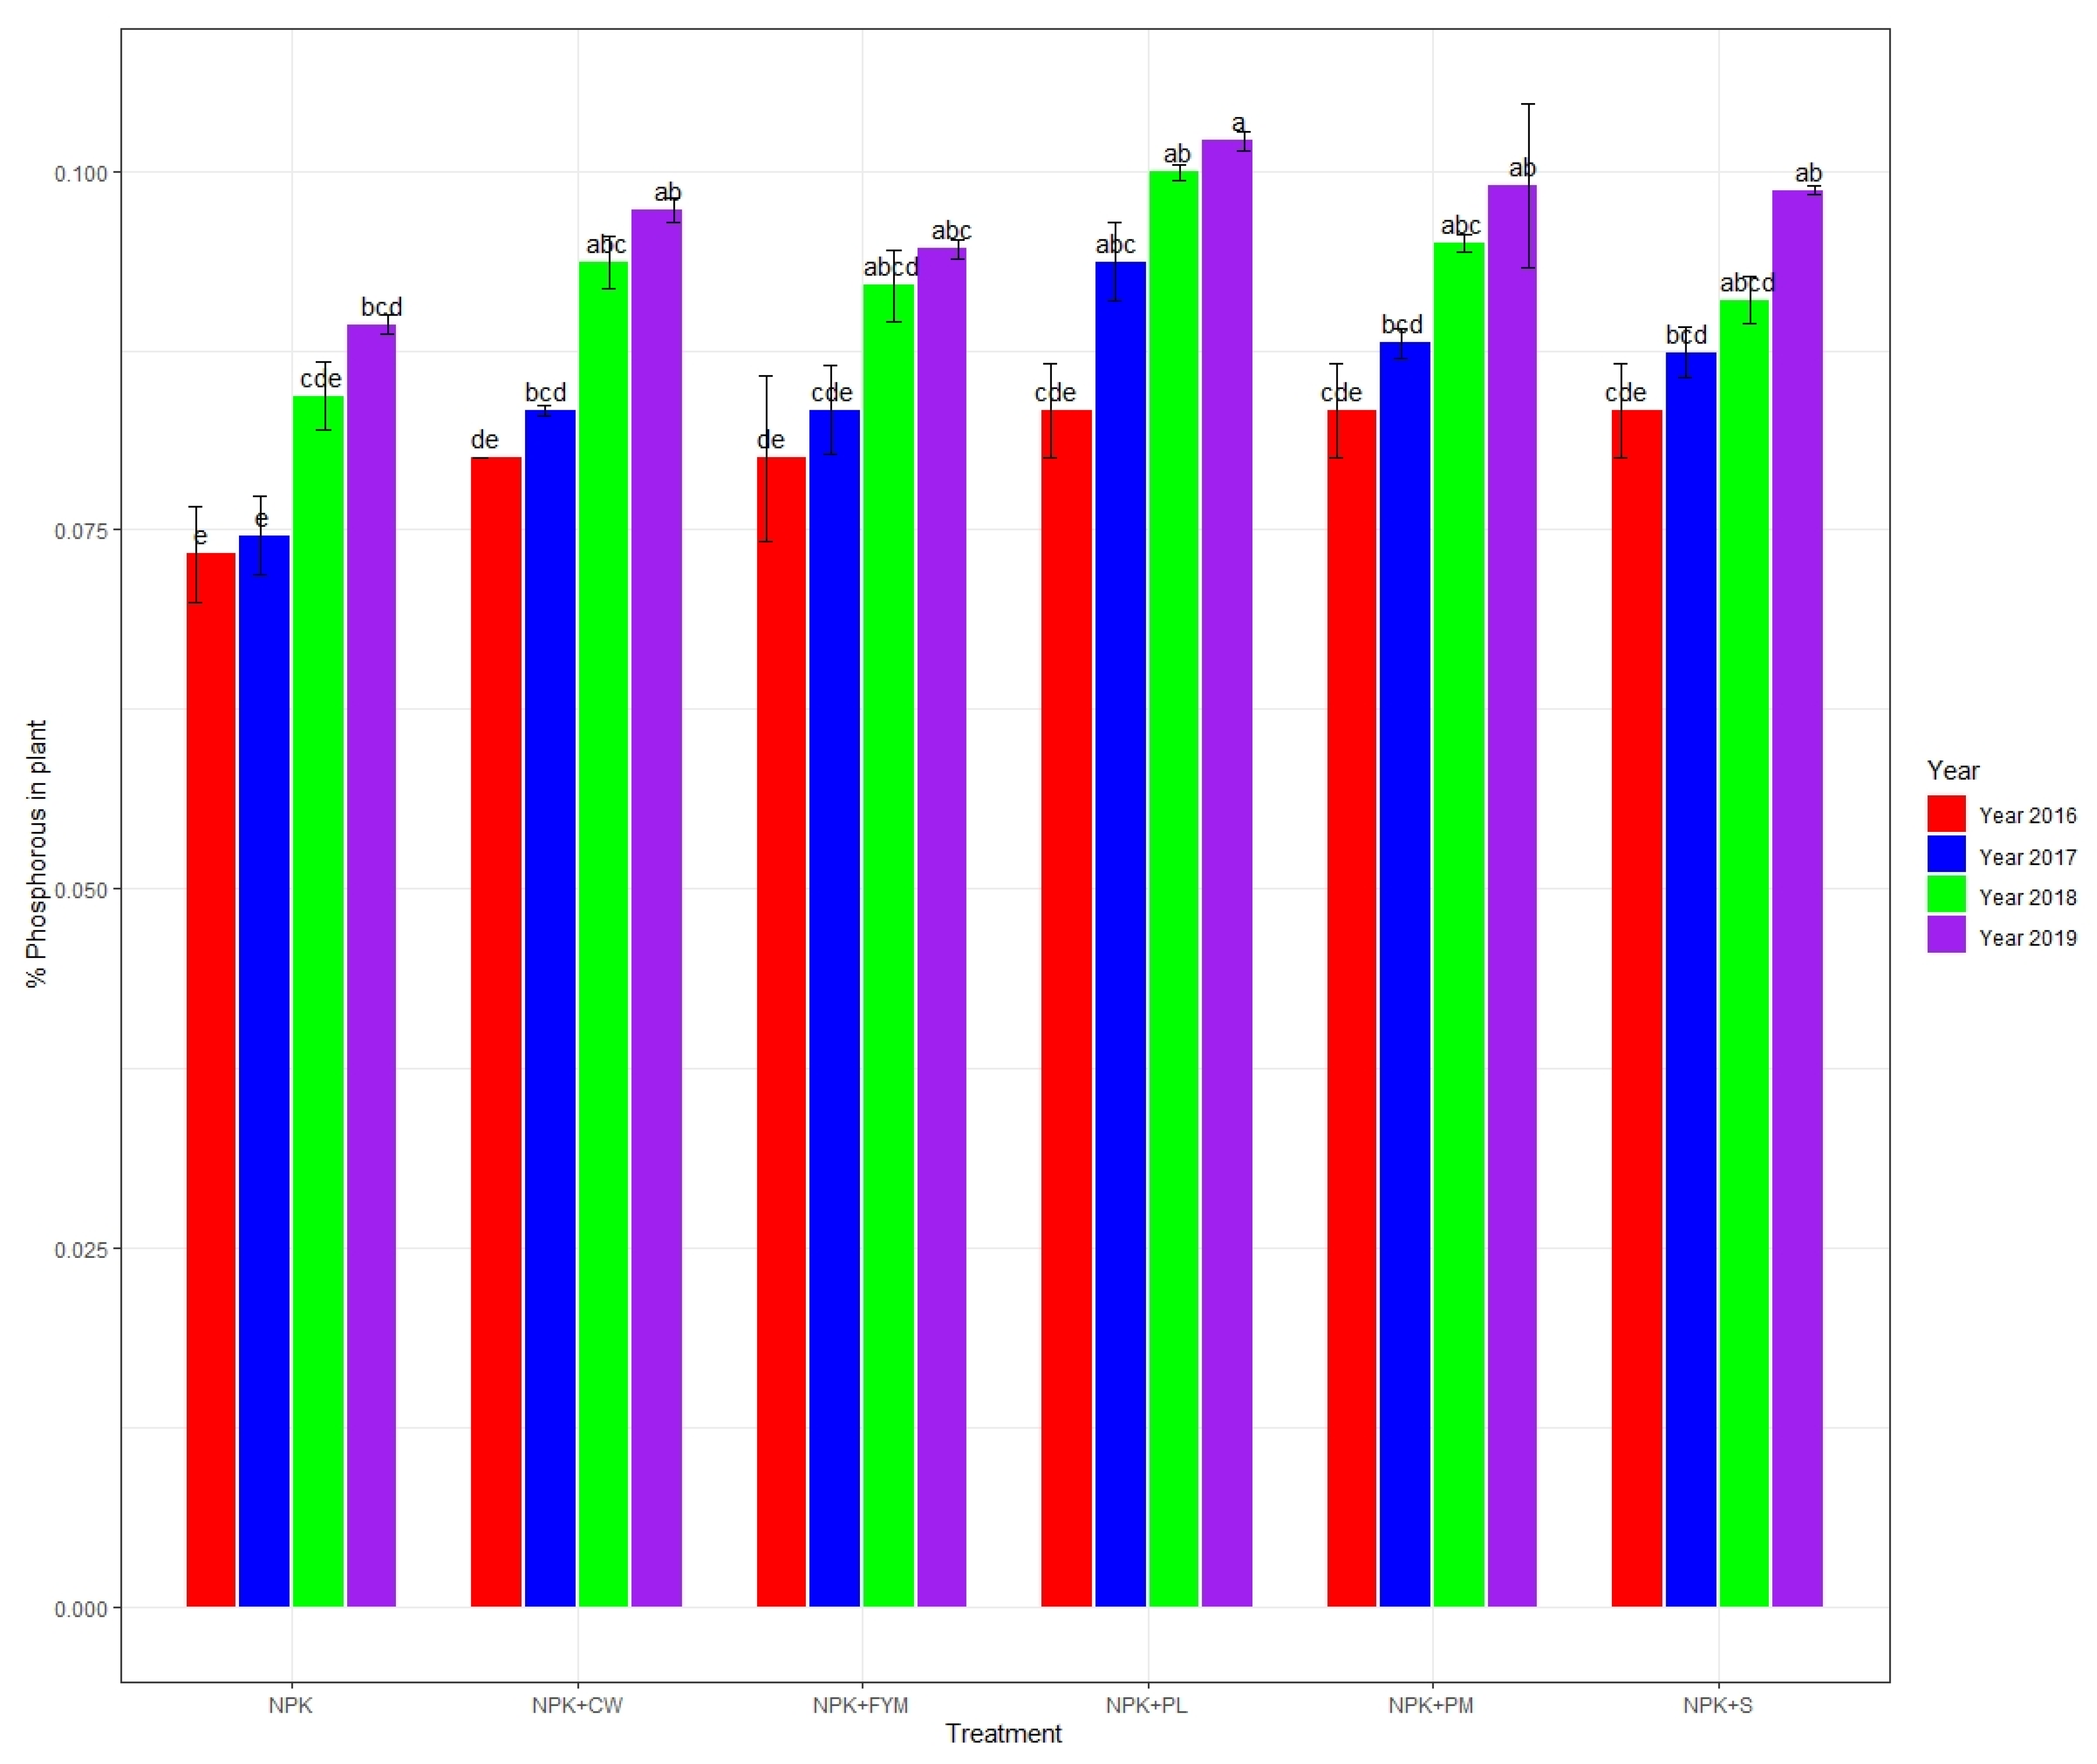
The effect of the treatment on the plant tissue phosphorus concentration was found to be non-significant during the year 2016 but significant in 2017, 2018, and 2019 (Figure 2). The treatment response of NPK + PM was statistically similar to NPK + PL in 2018. In 2019, a maximum phosphorus concentration (0.1%) was obtained with the application of NPK + poultry litter. The increase in the phosphorus concentration was 25% and 11% in 2018 and 2019, respectively, over NPK alone. The phosphorus concentration in mango leaf remained lower from the standard value (0.1–0.2) [36] in the years 2016, 2017, and 2018; however, it was non-significantly higher in 2019. In all years, NPK alone showed a lower concentration as compared to all treatments.
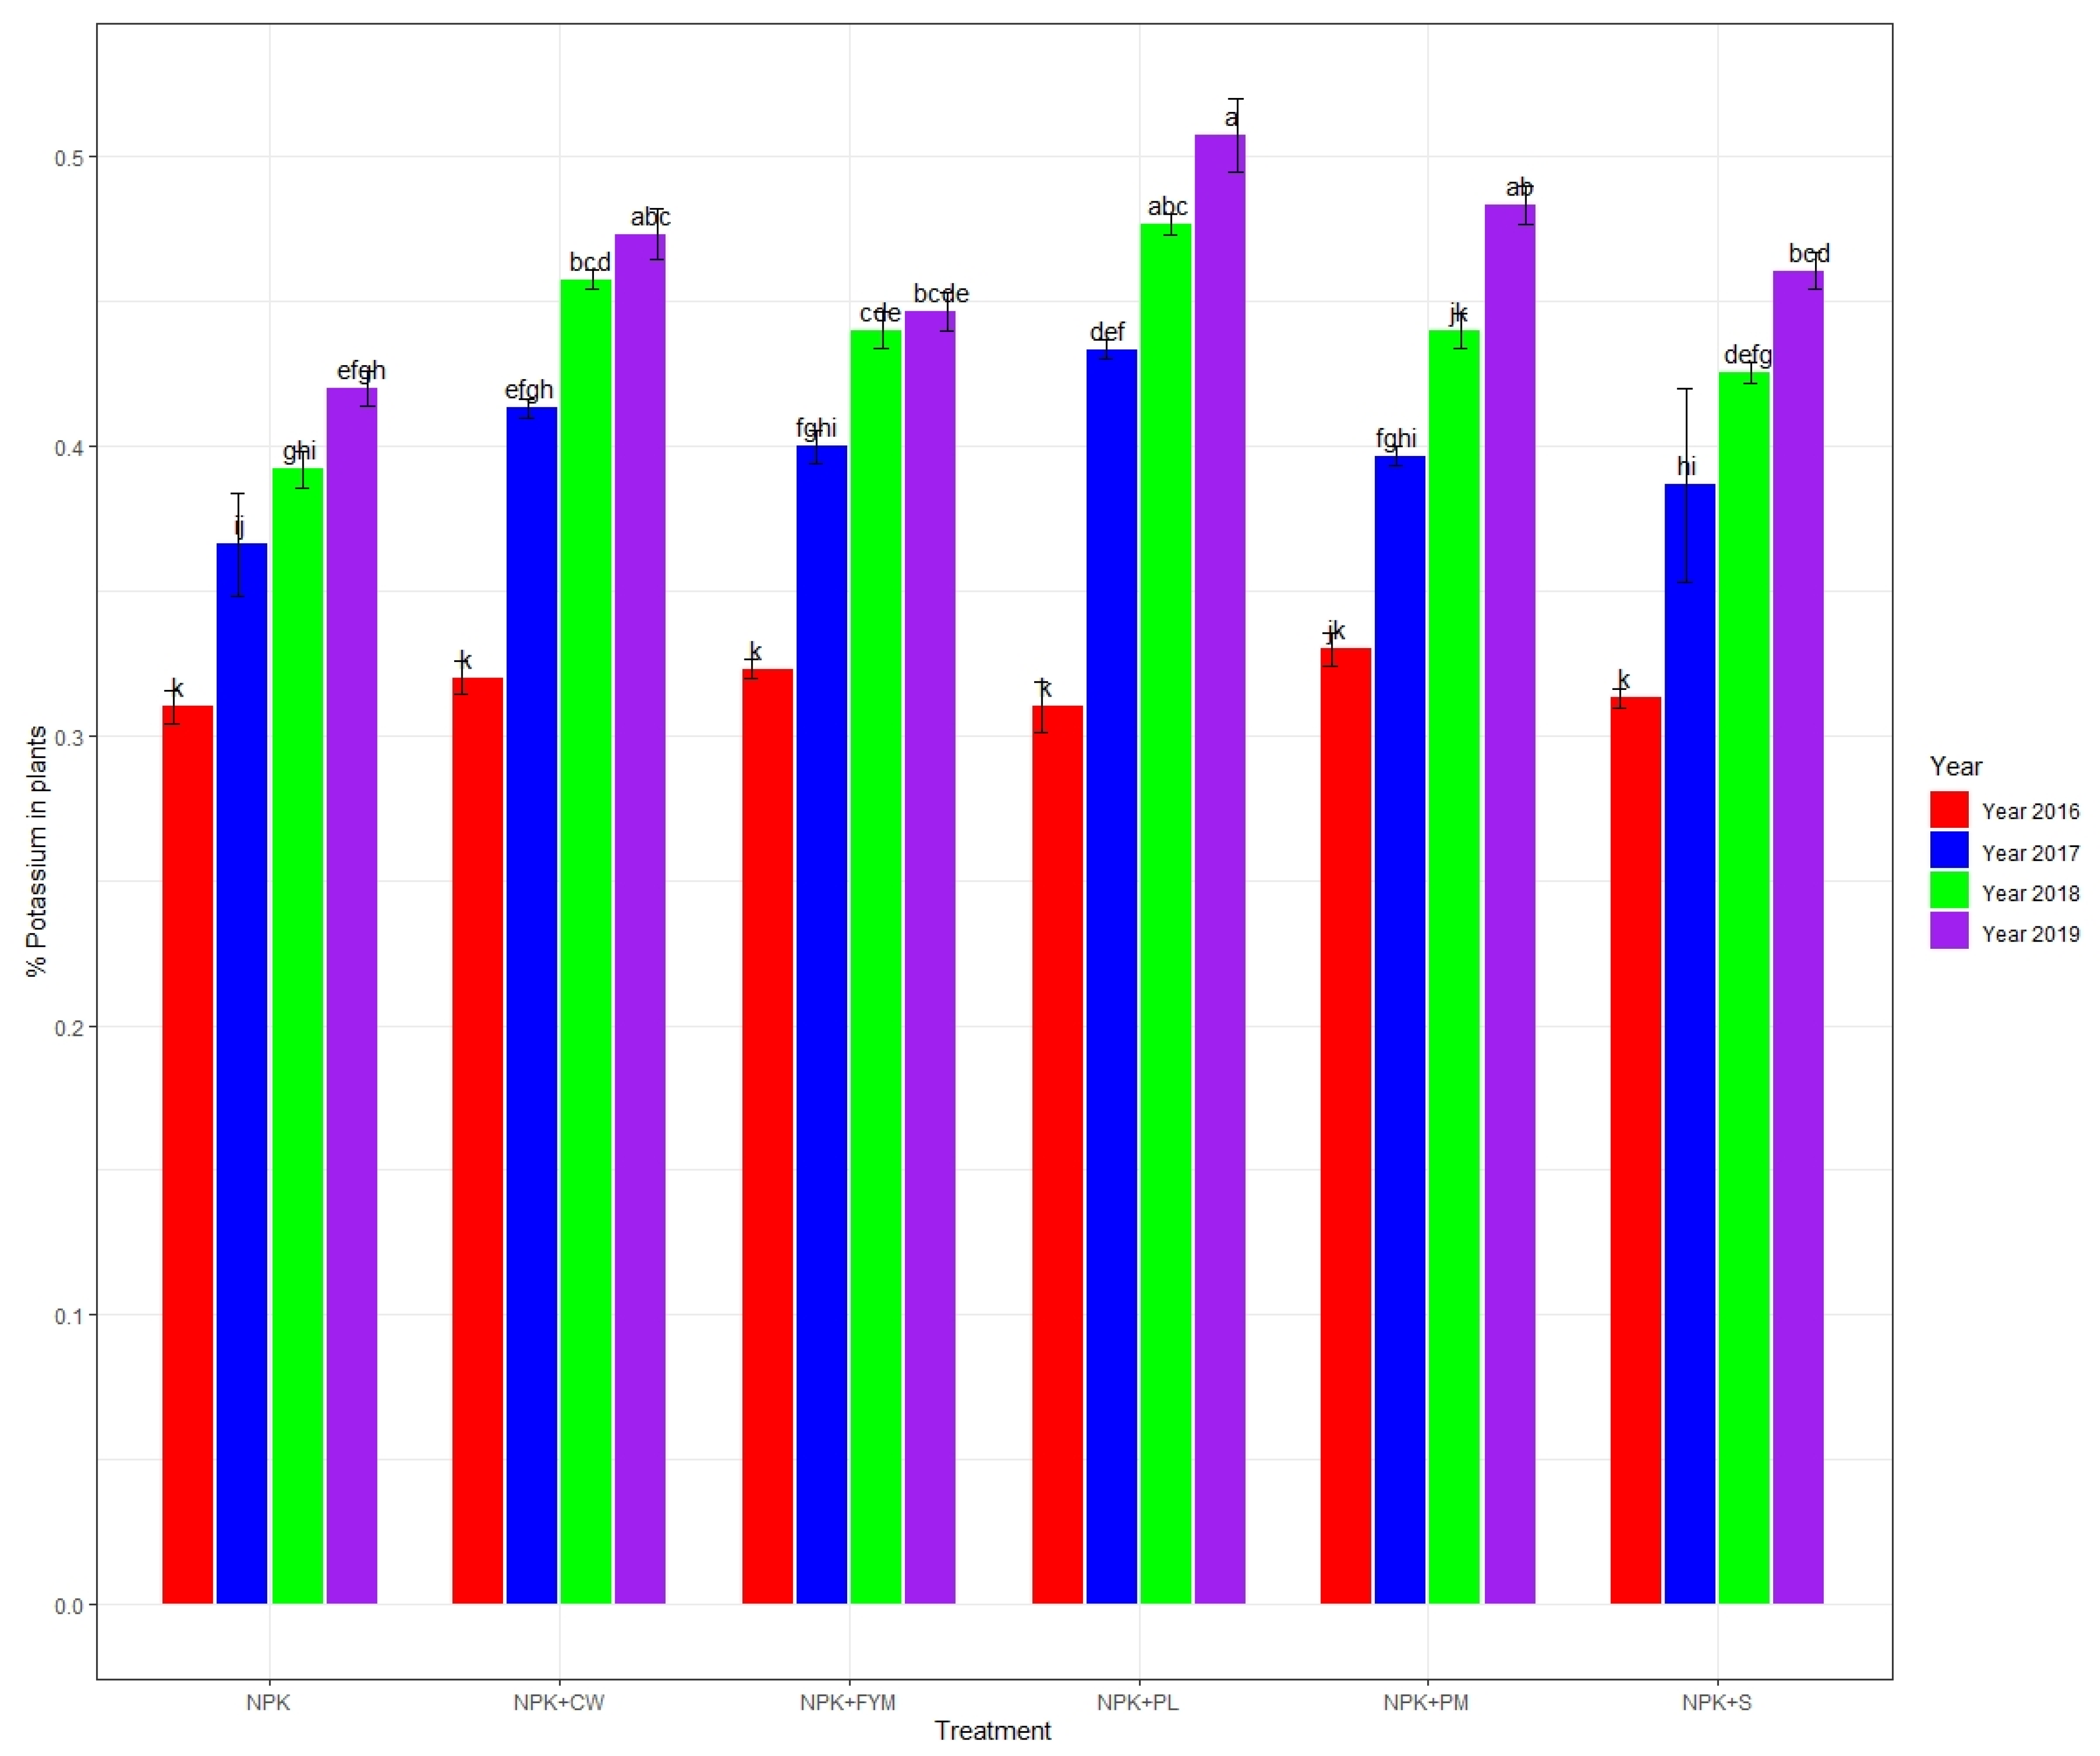
The treatment effect on plant tissue potassium concentrations within the years 2017, 2018, and 2019 was found to be significantly different (DF = 5; F-value = 3.18; p-value < 0.05) (Figure 3). The NPK + CW and NPK + FYM treatments showed a 3.23% and 3.20% increase over NPK in the year 2016, respectively (Figure 3). The NPK + PM treatment showed a maximum increase in the potassium concentration (6.45%) over NPK in 2016 as compared to other treatments (Figure 3). The NPK + poultry litter treatment showed higher values of potassium in 2017, 2018, and 2019 as compared to all other treatments (Figure 3). In the year 2019, NPK + poultry liter showed a 29.03% increase in the potassium concentration over NPK, while NPK + PM and NPK + S showed 19.35 and 12.9% increases in the potassium concentration over NPK alone, respectively (Figure 3).

3.2. Soil pH, EC, Phosphorus, Potassium, and Organic Matter

The treatment effect on soil pH, EC, phosphorous, potassium, and organic matter was significant during the study period.
Soil pH decreased due to the application of organic amendments along with chemical fertilizers (DF = 5; F-value = 5.980; p < 0.01). pH was at par in NPK, NPK + CW, NPK + FYM, NPK + PM, and NPK + S (Table 1). NPK + PL was effective in reducing soil pH (Table 1). Soil pH decreased through the application of organic amendments along with the chemical fertilizer, over the period of time (Table 2). The pH was higher in 2016, while it was reduced in the following years (Table 2).
Soil EC was higher in NPK compared to the treatments where NPK was applied with organic amendments and sulfur (S) (Table 1) (DF = 5; F-value = 3.02; p-value < 0.05). NPK + PL significantly lowered the EC (Table 1), while NPK + CW, NPK + FYM, NPK + PM, and NPK + S remained at par. The EC did not change over the period of time (DF = 3; F-value = 2.21; p-value > 0.05) (Table 2).
Soil phosphorous was greater where NPK + PL was applied (DF = 5; F-value = 2.62; p-value < 0.05) (Table 1). The application of chemical fertilizer without organic amendments (NPK) resulted in the lowest phosphorous concentration in soil (Table 1). With the passage of time, a gradual increase in the phosphorous concentration was recorded in soil (Table 2) (DF = 3; F-value = 1.84; p-value > 0.05).
The application of chemical fertilizer (NPK) and organic amendments along with NPK, had no effect on the potassium concentration in the soil, except NPK + PL, while the lowest potassium concentration was observed in NPK + S (Table 1) (DF = 5; F-value = 2.11; p-value ≤ 0.05). Over the years, the potassium content increased in soil through the application of organic amendments along with the chemical fertilizer (Table 2) (DF = 3; F-value = 23.44; p < 0.01).
Organic matter in soil increased with application of organic amendments along with chemical fertilizer (Table 1) (DF = 5; F-value = 10.87; p-value < 0.01). NPK + PL and NPK + CW application increased the organic matter in soil, while the application of NPK and NPK + S did not increase the organic matter in soil (Table 1). The organic matter content in soil increased with time in soil (Table 2) (DF = 3; F-value = 35.74; p-value < 0.001). Higher organic matter content in the soil was recorded in 2019, followed by 2018, 2017, and 2016, respectively (Table 2).
NPK + PL improved the soil chemical properties (pH and EC), increased the soil nutrient contents (P and K), and contributed to overall soil fertility and health (OM) by improving the soil structure due to the organic amendments, applied along with chemical fertilizer (NPK).

3.3. Plant Tissue Disease Score (Disease Intensity)

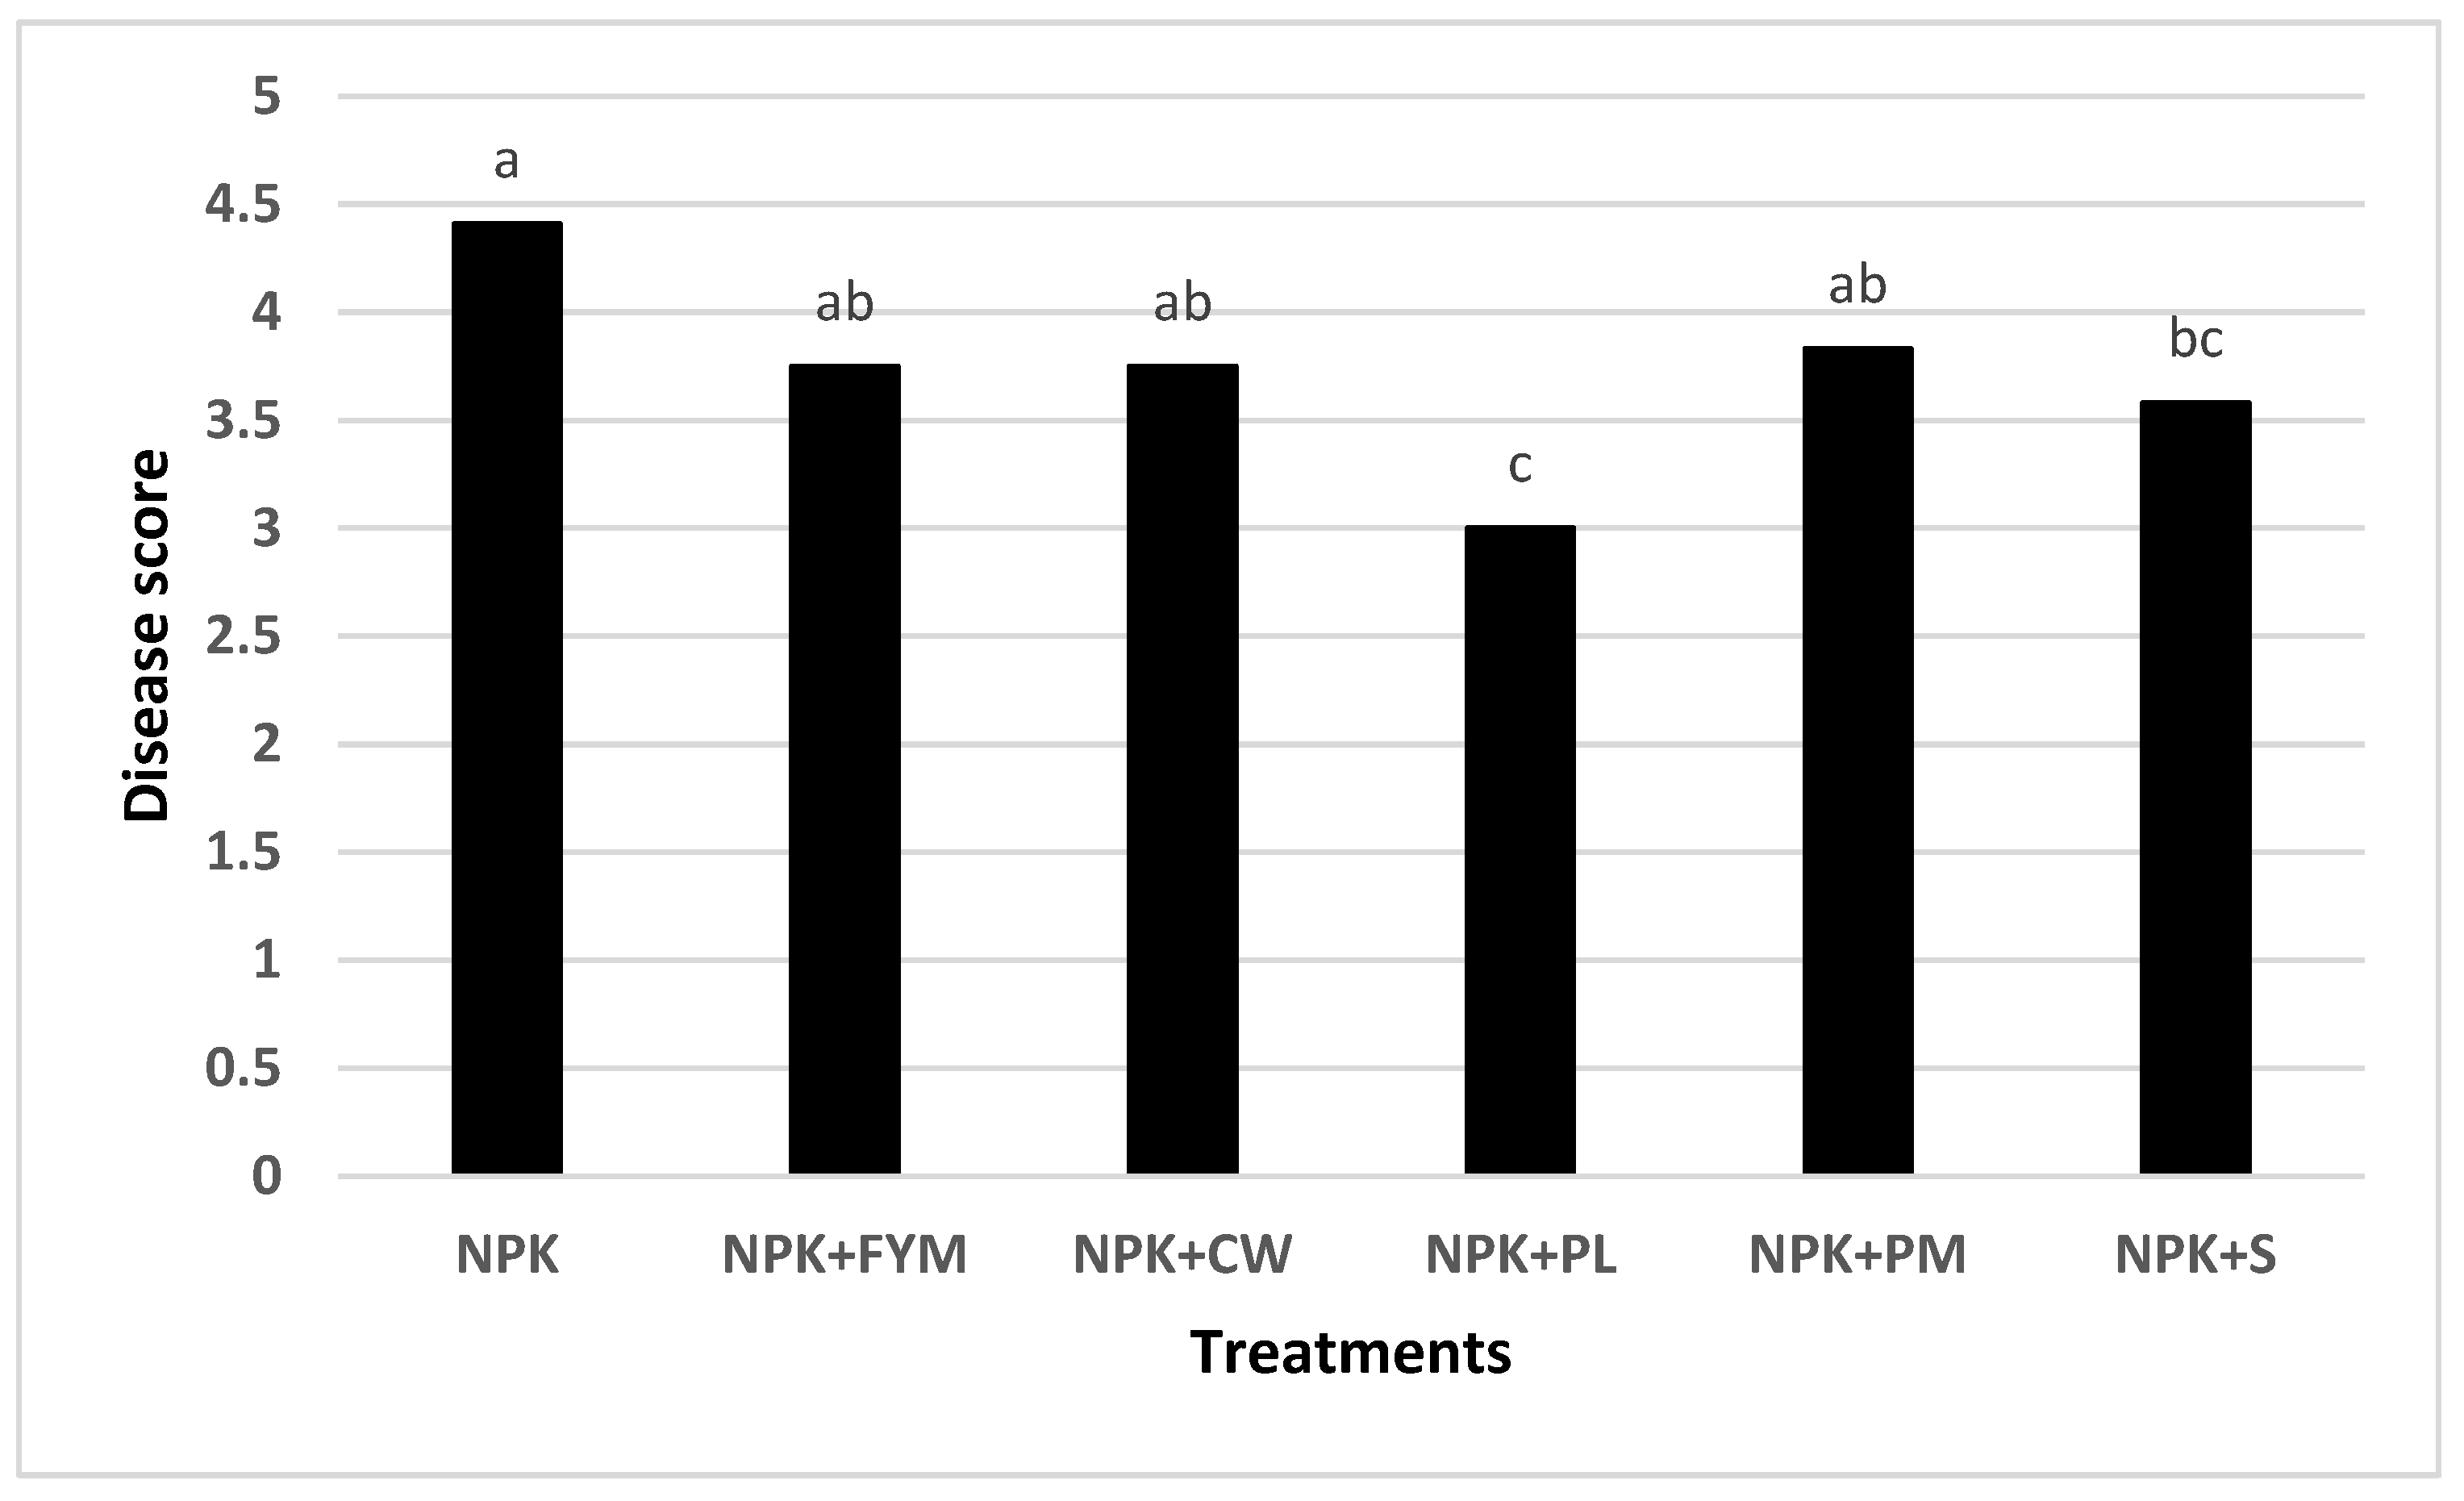
The effect of treatment was significant against the rehabilitation of dieback-affected plants (main plot treatment; DF = 5; F-value = 7.79; p-value < 0.001) (Figure 4). The disease severity decreased with the passage of time in experimental trees (DF = 3; F-value = 12.637; p-value < 0.001). The disease score was higher in the year 2016 and lowest in 2019 (Figure 5). The interaction of the treatment and year was non-significant (DF = 15; F-value = 0.533; p-value > 0.05). A maximum decrease in the disease score (%) was recorded with the application NPK + poultry litter in 2017, 2018, and 2019, as compared to other treatments (Figure 4).

4. Discussion

In the present studies, the effect of chemical fertilizer along with organic amendments, on dieback disease intensity was determined over a period of four years, 2016–2019. Integrated nutrient management helped to rehabilitate the dieback-affected mango plants by improving plant health by optimizing nutrient availability and promoting overall plant vigor. Nitrogen content in plant leaves increased through the application of NPK + PL (Figure 1). Over the years 2016–2019, the nitrogen content in plant leaves increased (Figure 1). Nitrogen contents in leaves were lowest in 2016 (Figure 1). The phosphorous concentration was maximum in plant leaves with the treatment NPK + PL in 2019 (Figure 2). NPK + PL application gradually increased the potassium concentration in plant leaves in 2017, 2018, and 2019, respectively (Figure 3). About a 29% increase in the K concentration was recorded in NPK + PL compared to NPK. (Figure 3). Soil chemical properties improved through the application of chemical fertilizer along with amendments. Soil pH and EC decreased with the application of NPK + PL (Table 1). The maximum decrease in soil pH and EC was observed in the present studies with the application of NPK + PL in 2019. The application of NPK + PL resulted in higher phosphorous concentrations in soil. The case with the soil potassium concentration was similar. The organic matter content was higher in NPK + PL (0.64%). A maximum decrease in disease intensity was recorded where NPK + PL was applied. The application of organic amendments along with chemical fertilizer improved the soil chemical composition, nutrient availability, soil health, and plant vigor and reduced disease intensity.
In the current study, we reported a decrease in EC and pH over the period of time through the application of chemical fertilizer and organic amendments. The change in soil pH and EC over the period of application to sampling depends on the nature of organic amendments applied, the soil type, moisture contents, and the temperature of the area. In 2017, the small change in the pH of the soil with the use of organic amendments was due to a temporary change in the pH value (Table 2). Similar results were reported by Van Averbeke, et al. [37] and Brautigan, et al. [38]. Averbeke et al. [34] described that the temporary change in pH occurred due to the use of biological amendments, while little or no change was observed with humus and horse manure during their studies. Averbeke et al. [34] further described that a sharp change in the EC of the soil was observed with the use of organic amendments in clayey soils. However, our results related to the decrease in pH and EC of soil with the passage of time were contrary to the findings of Van Averbeke, et al. [37] and Azeez and Van Averbeke [39] that pH and EC were found to be significantly increased when poultry litter was applied due to variations in the soil type and temperature of the study area. These findings support the lowest effect of treatments in 2017. In the current study, due to the lowest change in soil pH, changes in N, P, and K in plants and soil (compared to initial soil data obtained in 2016) were minimal in 2017. This minimum change was related to the low soil pH change and the nature of organic amendments (Table A1). Poulsen, et al. [40] reported similar results.
During 2017, the change in the N, P, and K concentration in plant tissue remained lowest, similar to the results of Dewes and Hünsche [41]. The nature of organic amendments applied resulting in the slow release of H+ from organic manures was attributed to the lowest effect of treatments in 2017 [42]. The efficiency of organic and inorganic fertilizers for the release of nutrients also depends on targeted nutrients; in our studies, the release of combined phosphates with calcium in high-pH soils increased due to the application of chemical fertilizer along with amendments [23,43].
A more pronounced response of treatments to soil health and nutrient availability in soil and plant tissues during 2019 was due to changes in soil physical and chemical properties (Table 1 and Table 2; Figure 1, Figure 2 and Figure 3). The addition of organic amendments with chemical fertilizers increased organic matter, improved soil fertility and soil health, and increased plant vigor by enhancing nutrient uptake [44,45].
In the present study, we found that the application of only chemical fertilizers improved nutrient availability in plant tissues but less than that with chemical fertilizer + organic amendments (Figure 4) [44,45]. The integrated use of organic and inorganic fertilizers not only improves the biological properties of soils but also helps with nutrient availability [26]. In the present studies, trends in N, P, and K uptake in plants increased with the combined application of chemical fertilizers and organic amendments in all treatments; however, the effects were more pronounced with NPK + PL [25,43,44].
In the present studies, the poor plant health due to nutritional deficiency was addressed by enhancing nutrient uptake to reduce plant susceptibility and disease intensity. Unhealthy and nutritionally deficient mango plants with low vigor are prone to dieback disease [45]. Overall, plant health was improved with the application of all treatments, but NPK + PL was most effective in reducing dieback disease intensity. The permanent presence of mango plants in orchards did not allow for the soil fertility status to be restored, as nutrients are being consumed continuously by plants; therefore, poor plant health ensures more chances of disease. In the current study, the pre-analysis of soil justified the exhausted condition of orchard soils where plants were present for more than 15 years. The use of organic wastes with chemical fertilizers was indispensable in regaining the soil quality status for plant propagation. This is why the use of NPK alone resulted in a minimum response in all years of application, from 2017 to 2019, as compared to the integrated use of fertilizers with organic amendments [46].
The combined use of NPK and PL was found to be best, as compared to other treatments, in 2017, 2018, and 2019 (Table 1 and Table 2). The characterization of organic manures used in our study justified the results (Table A2). The pH of the poultry litter used in our study was very low (Table A2) and the release of H+ from poultry litter lowered the pH of the soil to a level where nutrient availability from soil to plants became significantly higher as compared to other organic amendments along with NPK fertilizers. Also, the phosphorus and potassium contents of the poultry litter were greater, as compared to other organic amendments. Therefore, the response of NPK + PL was more pronounced in terms of the EC, pH, N, P, K, and organic matter in all years of the study. Similar results were reported by Geng, et al. [47]. High nutrient-use efficiency encouraged good plant health and disease escape more profoundly during the last year of the study.
Balanced nutrition helped plants to rehabilitate from dieback as reported in present studies (NPK + PL), but the supply of particular nutrients (NPK + S) might not result in the complete control of the disease [22]. In the present studies, we rehabilitated the dieback-affected plants and restored plant health, which would ultimately improve the livelihoods of farmers, by increasing farmer incomes. In the present studies, we added organic manures along with the chemical fertilizer; this ultimately improved the soil pH and EC and increased the nitrogen, phosphorus, and potassium concentration in plant leaves. Through this, plant health was restored. Dieback disease was managed and soil health was restored. By opting for this approach, farmers can slowly decrease the intensity of damage to dieback-infected plants.

5. Conclusions

Integrated nutrient management increases the yield of farmers and decreases the overall burden on the economy of the country produced by lowering the livelihood standard of common people. This ultimately increases the sustainability of the environment, soil, and plant health. The results of the current four-year study, in 2016–2019, indicate that the INM strategy has great potential to rehabilitate mango plants affected by dieback disease. NPK + PL was to be found best among all other combinations of organic amendments and inorganic fertilizers in reducing dieback disease severity. This was due to improved soil physical, chemical, and biological conditions and plant health. The high availability of nutrients in soil increased the uptake of nutrients in plant tissue, and this helped plants to fight against disease. Therefore, it is recommended to apply the INM system instead of only mineral fertilizers where dieback problem arise. However, long-term studies in different geographical locations are recommended to further explore the potential of integrated nutrient application to cope with problems with the cultivar Samar Bahisht Chaunsa.

Author Contributions

Conceptualization, F.B. and I.A.; methodology, T.A.S., A.-R.Z.G., M.S.H. and F.B.; software, A.H.; validation, A.H., F.B. and I.A.; formal analysis, A.H.; investigation, N.M. and F.B.; resources, F.B.; data curation, F.B.; writing—original draft preparation, F.B. and K.S.; writing—review and editing, M.B., H.-A.N. and A.H.; visualization, K.S.; supervision, I.A.; project administration, T.A.S. and I.A.; funding acquisition, F.B. All authors have read and agreed to the published version of the manuscript.

Funding

This research work was funded by the Researchers Supporting Project number RSPD2023R686, King Saud University, Riyadh, Saudi Arabia.

Institutional Review Board Statement

Not applicable.

Informed Consent Statement

Not applicable.

Data Availability Statement

Not applicable.

Acknowledgments

The authors extend their appreciation to the Researchers Supporting Project number RSPD2023R686, King Saud University, Riyadh, Saudi Arabia. We thank the ministry of Agriculture, Government of Punjab Pakistan for providing regular funds for the research. Help and support were from Muhammad Rafique, Lab attendant, and Mirza Nadeem Baig, Lab Assistant, who helped us during data collection and the soil survey.

Conflicts of Interest

The authors declare no conflict of interest.

Appendix A

Table A1. Treatments and their sources.
TreatmentsSourceCompany/Locations
NPK (control)CAN, SSP, SOP
NPK + farm yard manureManure from cattle farm
NPK + city wasteMunicipal waste
NPK + poultry litterPoultry farm litter
NPK + press mudSugar mill wasteFatima Sugar Mills Limited (30.297787, 70.970250)
+NPK + sulfurCommercial-grade elemental sulfur
Table A2. Characteristics of organic manures used in the study.
ParametersUnitsSoilFarmyard ManureCity WastePoultry LitterPress Mud
pH 8.497.707.596.037.89
ECdSm−13.214.123.1874.013.54
Available Phosphorusppm7.910.580.431.710.72
Available Potassiumppm1600.400.620.920.79
Organic Matter%0.6566.2237.0241.7564.32

References

  1. Tharanathan, R.; Yashoda, H.; Prabha, T. Mango (Mangifera indica L.),“The king of fruits”—An overview. Food Rev. Int. 2006, 22, 95–123. [Google Scholar] [CrossRef]
  2. Amin, M.; Malik, A.; Khalid, M.; Anwar, R. Fruit harvest maturity indicators for mango cultivars ‘Sindhri’ and ‘Samar Bahisht Chaunsa’. In Proceedings of the IX International Mango Symposium, Sanya, China, 8–12 April 2010; pp. 561–567. [Google Scholar]
  3. Ramay, S.A. Climate change killing agriculture. The Express Tribune, 1 May 2023. [Google Scholar]
  4. Khan, A.A. Pakistan’s Climate-Induced Water Scarcity and Its Impact on Agriculture. Available online: https://www.hilal.gov.pk/index.php/detail/pakistan%E2%80%99s-climate-induced-water-scarcity-and-its-impact-on-agriculture (accessed on 3 May 2023).
  5. Ahmed, N.; Umer, A.; Ali, M.A.; Iqbal, J.; Mubashir, M.; Grewal, A.G.; Butt, B.; Rasheed, M.K.; Chaudhry, U.K. Micronutrients status of mango (Mangifera indica) orchards in Multan region, Punjab, Pakistan, and relationship with soil properties. Open Agric. 2020, 5, 271–279. [Google Scholar] [CrossRef]
  6. Mohsin, M.; Jamal, F.; Ajmal, F. Impact of mango orchard diseases on growers economic life in Ahmedpur East, Bahawalpur, Pakistan. Acad. Res. Int. 2014, 5, 196. [Google Scholar]
  7. Jiskani, M.M.; Pathan, M.A.; Wagan, K.H.; Khaskheli, M. Documentation of identified and unidentified diseases of mango in Sindh, Pakistan. In Proceedings of the International Symposium on Prospects of Horticultural Industry in Pakistan, Institute of Horticultural Science, University of Agriculture, Faisalabad, Pakistan, 28–30 March 2007; pp. 176–190. [Google Scholar]
  8. Hussain, T.; Ishttiaq, M.; Zafar, B.; Parveen, A.; Maqbool, M.; Khan, F.A. Morphometric characterization of different mango varieties cultivated in tehsil Bernala district Bhimber Azad Kashmir, Pakistan. Pak. J. Bot 2023, 55, 1805–1812. [Google Scholar] [CrossRef]
  9. Ahmad, F.; Hafiz, I.A.; Asi, A.A.; Ahmad, S.; Khan, M. Mango varietal susceptibility to malformation and its control. Asian J. Plant Sci. 2002, 1, 158–159. [Google Scholar] [CrossRef]
  10. Akhtar, K.; Asif, M.; Khan, M.; Jaskani, M.; Khan, I. Isolation and Characterization of Fusarium moniliforme var. subglutinans from Malformed Mango. J. Agric. Mar. Sci. 1999, 4, 19–25. [Google Scholar] [CrossRef] [Green Version]
  11. Masood, A.; Saeed, S.; Silveira, S.; Akem, C.N.; Hussain, N.; Farooq, M. Quick decline of mango in Pakistan: Survey and pathogenicity of fungi isolated from mango tree and bark beetle. Pak. J. Bot. 2011, 43, 1793–1798. [Google Scholar]
  12. Malik, M.; Ammar, M.; Ranan, M.; Rehman, A.; Bally, I.S. Chemical and cultural management of die back disease of mango in Pakistan. In Proceedings of the XXIX International Horticultural Congress on Horticulture: Sustaining Lives, Livelihoods and Landscapes (IHC2014): IV International Symposium on Papaya, VIII International Pineapple Symposium, and International Symposium on Mango, Brisbane, Australia, 17 August 2014; pp. 363–368. [Google Scholar]
  13. Umar, U.D.; Ahmed, N.; Zafar, M.Z.; Rehman, A.; Naqvi, S.A.H.; Zulfiqar, M.A.; Malik, M.T.; Ali, B.; Saleem, M.H.; Marc, R.A. Micronutrients foliar and drench application mitigate mango sudden decline disorder and impact fruit yield. Agronomy 2022, 12, 2449. [Google Scholar] [CrossRef]
  14. Saeed, E.E.; Sham, A.; AbuZarqa, A.; Al Shurafa, K.A.; Al Naqbi, T.S.; Iratni, R.; El-Tarabily, K.; AbuQamar, S.F. Detection and management of mango dieback disease in the United Arab Emirates. Int. J. Mol. Sci. 2017, 18, 2086. [Google Scholar] [CrossRef] [Green Version]
  15. Kamil, F.H.; Saeed, E.E.; El-Tarabily, K.A.; AbuQamar, S.F. Biological control of mango dieback disease caused by Lasiodiplodia theobromae using streptomycete and non-streptomycete actinobacteria in the United Arab Emirates. Front. Microbiol. 2018, 9, 829. [Google Scholar] [CrossRef] [PubMed] [Green Version]
  16. Masood, A.; Saeed, S.; Mahmood, A.; Malik, S.A.; Hussain, N. Role of nutrients in management of mango sudden death disease in Punjab, Pakistan. Pak. J. Zool. 2012, 44, 675–683. [Google Scholar]
  17. Ayyaz, S.; Shad, M.; Nawaz, H.; Ahmad, F. Influence of Dieback Disease on Soil Chemistry and Bacterial Diversity in the Rhizosphere of Mango Plants. Proc. Bulg. Acad. Sci. 2023, 76, 486–494. [Google Scholar] [CrossRef]
  18. Ishfaq, M.; Wakeel, A.; Shahzad, M.N.; Kiran, A.; Li, X. Severity of zinc and iron malnutrition linked to low intake through a staple crop: A case study in east-central Pakistan. Environ. Geochem. Health 2021, 43, 4219–4233. [Google Scholar] [CrossRef]
  19. Quereshi, A.S.; Sarwar, A. Managing salinity in the Indus Basin of Pakistan. Int. J. River Basin Manag. 2009, 7, 111–117. [Google Scholar] [CrossRef]
  20. Ishfaq, M.; Kiran, A.; Khaliq, A.; Cheema, S.A.; Alaraidh, I.A.; Hirotsu, N.; Wakeel, A. Zinc biofortified wheat cultivar lessens grain cadmium accumulation under cadmium contaminated conditions. Int. J. Agric. Biol. 2018, 20, 2842–2846. [Google Scholar]
  21. Fageria, N.; Gheyi, H.; Moreira, A. Nutrient bioavailability in salt affected soils. J. Plant Nutr. 2011, 34, 945–962. [Google Scholar] [CrossRef]
  22. Dordas, C. Role of nutrients in controlling plant diseases in sustainable agriculture. A review. Agron. Sustain. Dev. 2008, 28, 33–46. [Google Scholar] [CrossRef] [Green Version]
  23. Bibi, F.; Saleem, I.; Javid, S.; Ehsan, S.; Danish, S.; Ahmad, I. Phosphorus release kinetics of applied phosphate is influenced by time and organic sources in clay loam and sandy clay loam soils. Soil Environ. 2018, 37, 136–142. [Google Scholar]
  24. Antil, R.S.; Singh, M. Effects of organic manures and fertilizers on organic matter and nutrients status of the soil. Arch. Agron. Soil Sci. 2007, 53, 519–528. [Google Scholar] [CrossRef]
  25. Awasthi, L. Recent Advances in the Diagnosis and Management of Plant Diseases; Springer: Berlin/Heidelberg, Germany, 2015; pp. 93–125. [Google Scholar]
  26. Jat, L.K.; Singh, Y.; Meena, S.K.; Meena, S.K.; Parihar, M.; Jatav, H.; Meena, R.K.; Meena, V.S. Does integrated nutrient management enhance agricultural productivity. J. Pure Appl. Microbiol. 2015, 9, 1211–1221. [Google Scholar]
  27. Rowell, D.L. Soil Science: Methods & Applications; Routledge: London, UK, 2014. [Google Scholar]
  28. Walkley, A. A critical examination of a rapid method for determining organic carbon in soils—Effect of variations in digestion conditions and of inorganic soil constituents. Soil Sci. 1947, 63, 251–264. [Google Scholar] [CrossRef]
  29. Bouyoucos, G.J. Hydrometer method improved for making particle size analyses of soils 1. Agron. J. 1962, 54, 464–465. [Google Scholar] [CrossRef]
  30. Mason, J. Flame Photometric Determination of Potassium in Unashed Plant Leaves. Anal. Chem. 1963, 35, 874–875. [Google Scholar] [CrossRef]
  31. Gupta, A.; Neue, H.; Singh, V. Phosphorus determination in rice plants containing variable manganese content by the phospho-molybdo-vanadate (yellow) and phosphomolybdate (blue) colorimetric methods. Commun. Soil Sci. Plant Anal. 1993, 24, 1309–1318. [Google Scholar] [CrossRef]
  32. Amin, M.; Flowers, T. Evaluation of Kjeldahl digestion method. J. Res. Sci. 2004, 15, 159–179. [Google Scholar]
  33. Lenth, R. Emmeans: Estimated Marginal Means, Aka Least-Squares Means. R Packag, Version 1.0. 2017. Available online: https://cran.r-project.org/web/packages/emmeans/index.html (accessed on 17 November 2022).
  34. Saúco, V.G. Nutrition and Fertilization in Mango. Literature Review; Spain. 2018; pp. 1–74. Available online: https://www.google.com/url?sa=t&rct=j&q=&esrc=s&source=web&cd=&ved=2ahUKEwify8mozYuAAxVugf0HHQgjAIQQFnoECBIQAQ&url=https%3A%2F%2Fwww.mango.org%2Fwp-content%2Fuploads%2F2020%2F02%2FNutrition_Fertilization_ENG.pdf&usg=AOvVaw0Es7Btfmjm0gro7qwWzS4y&opi=89978449 (accessed on 10 November 2022).
  35. Van Averbeke, W.; Chabalala, M.; Okorogbona, A.; Rumania, T.; Azeez, J.; Slabbert, M. Plant nutrient requirements of African leafy vegetables. In Nutritional Value and Water Use of African Leafy Vegetables for Improved Livelihoods; WRC TT535/12; Water Research Commission: Gezina, South Africa, 2012; pp. 1–302. [Google Scholar]
  36. Brautigan, D.; Rengasamy, P.; Chittleborough, D. Amelioration of alkaline phytotoxicity by lowering soil pH. Crop Pasture Sci. 2014, 65, 1278–1287. [Google Scholar] [CrossRef]
  37. Azeez, J.; Van Averbeke, W. Dynamics of soil pH and electrical conductivity with the application of three animal manures. Commun. Soil Sci. Plant Anal. 2012, 43, 865–874. [Google Scholar] [CrossRef]
  38. Poulsen, P.H.; Al-Soud, W.A.; Bergmark, L.; Magid, J.; Hansen, L.H.; Sørensen, S.J. Effects of fertilization with urban and agricultural organic wastes in a field trial–Prokaryotic diversity investigated by pyrosequencing. Soil Biol. Biochem. 2013, 57, 784–793. [Google Scholar] [CrossRef]
  39. Dewes, T.; Hünsche, E. Composition and microbial degradability in the soil of farmyard manure from ecologically-managed farms. Biol. Agric. Hortic. 1998, 16, 251–268. [Google Scholar] [CrossRef]
  40. Dey, A.; Srivastava, P.C.; Pachauri, S.P.; Shukla, A.K. Time-dependent release of some plant nutrients from different organic amendments in a laboratory study. Int. J. Recycl. Org. Waste Agric. 2019, 8, 173–188. [Google Scholar] [CrossRef] [Green Version]
  41. Sayara, T.; Basheer-Salimia, R.; Hawamde, F.; Sánchez, A. Recycling of organic wastes through composting: Process performance and compost application in agriculture. Agronomy 2020, 10, 1838. [Google Scholar] [CrossRef]
  42. Wang, X.; Yan, J.; Zhang, X.; Zhang, S.; Chen, Y. Organic manure input improves soil water and nutrients use for sustainable maize (Zea mays L.) productivity on the Loess Plateau. PLoS ONE 2020, 15, e0238042. [Google Scholar] [CrossRef] [PubMed]
  43. Zhang, J.; Terrones, M.; Park, C.R.; Mukherjee, R.; Monthioux, M.; Koratkar, N.; Kim, Y.S.; Hurt, R.; Frackowiak, E.; Enoki, T. Carbon science in 2016: Status, challenges and perspectives. Carbon 2016, 98, 708–732. [Google Scholar] [CrossRef]
  44. Hasnain, M.; Chen, J.; Ahmed, N.; Memon, S.; Wang, L.; Wang, Y.; Wang, P. The effects of fertilizer type and application time on soil properties, plant traits, yield and quality of tomato. Sustainability 2020, 12, 9065. [Google Scholar] [CrossRef]
  45. McMahon, P. Effect of nutrition and soil function on pathogens of tropical tree crops. Plant Pathol. 2012, 4, 243–272. [Google Scholar]
  46. Majhi, P.; Rout, K.; Nanda, G.; Singh, M. Soil quality for rice productivity and yield sustainability under long-term fertilizer and manure application. Commun. Soil Sci. Plant Anal. 2019, 50, 1330–1343. [Google Scholar] [CrossRef]
  47. Geng, Y.; Cao, G.; Wang, L.; Wang, S. Effects of equal chemical fertilizer substitutions with organic manure on yield, dry matter, and nitrogen uptake of spring maize and soil nitrogen distribution. PLoS ONE 2019, 14, e0219512. [Google Scholar] [CrossRef] [Green Version]
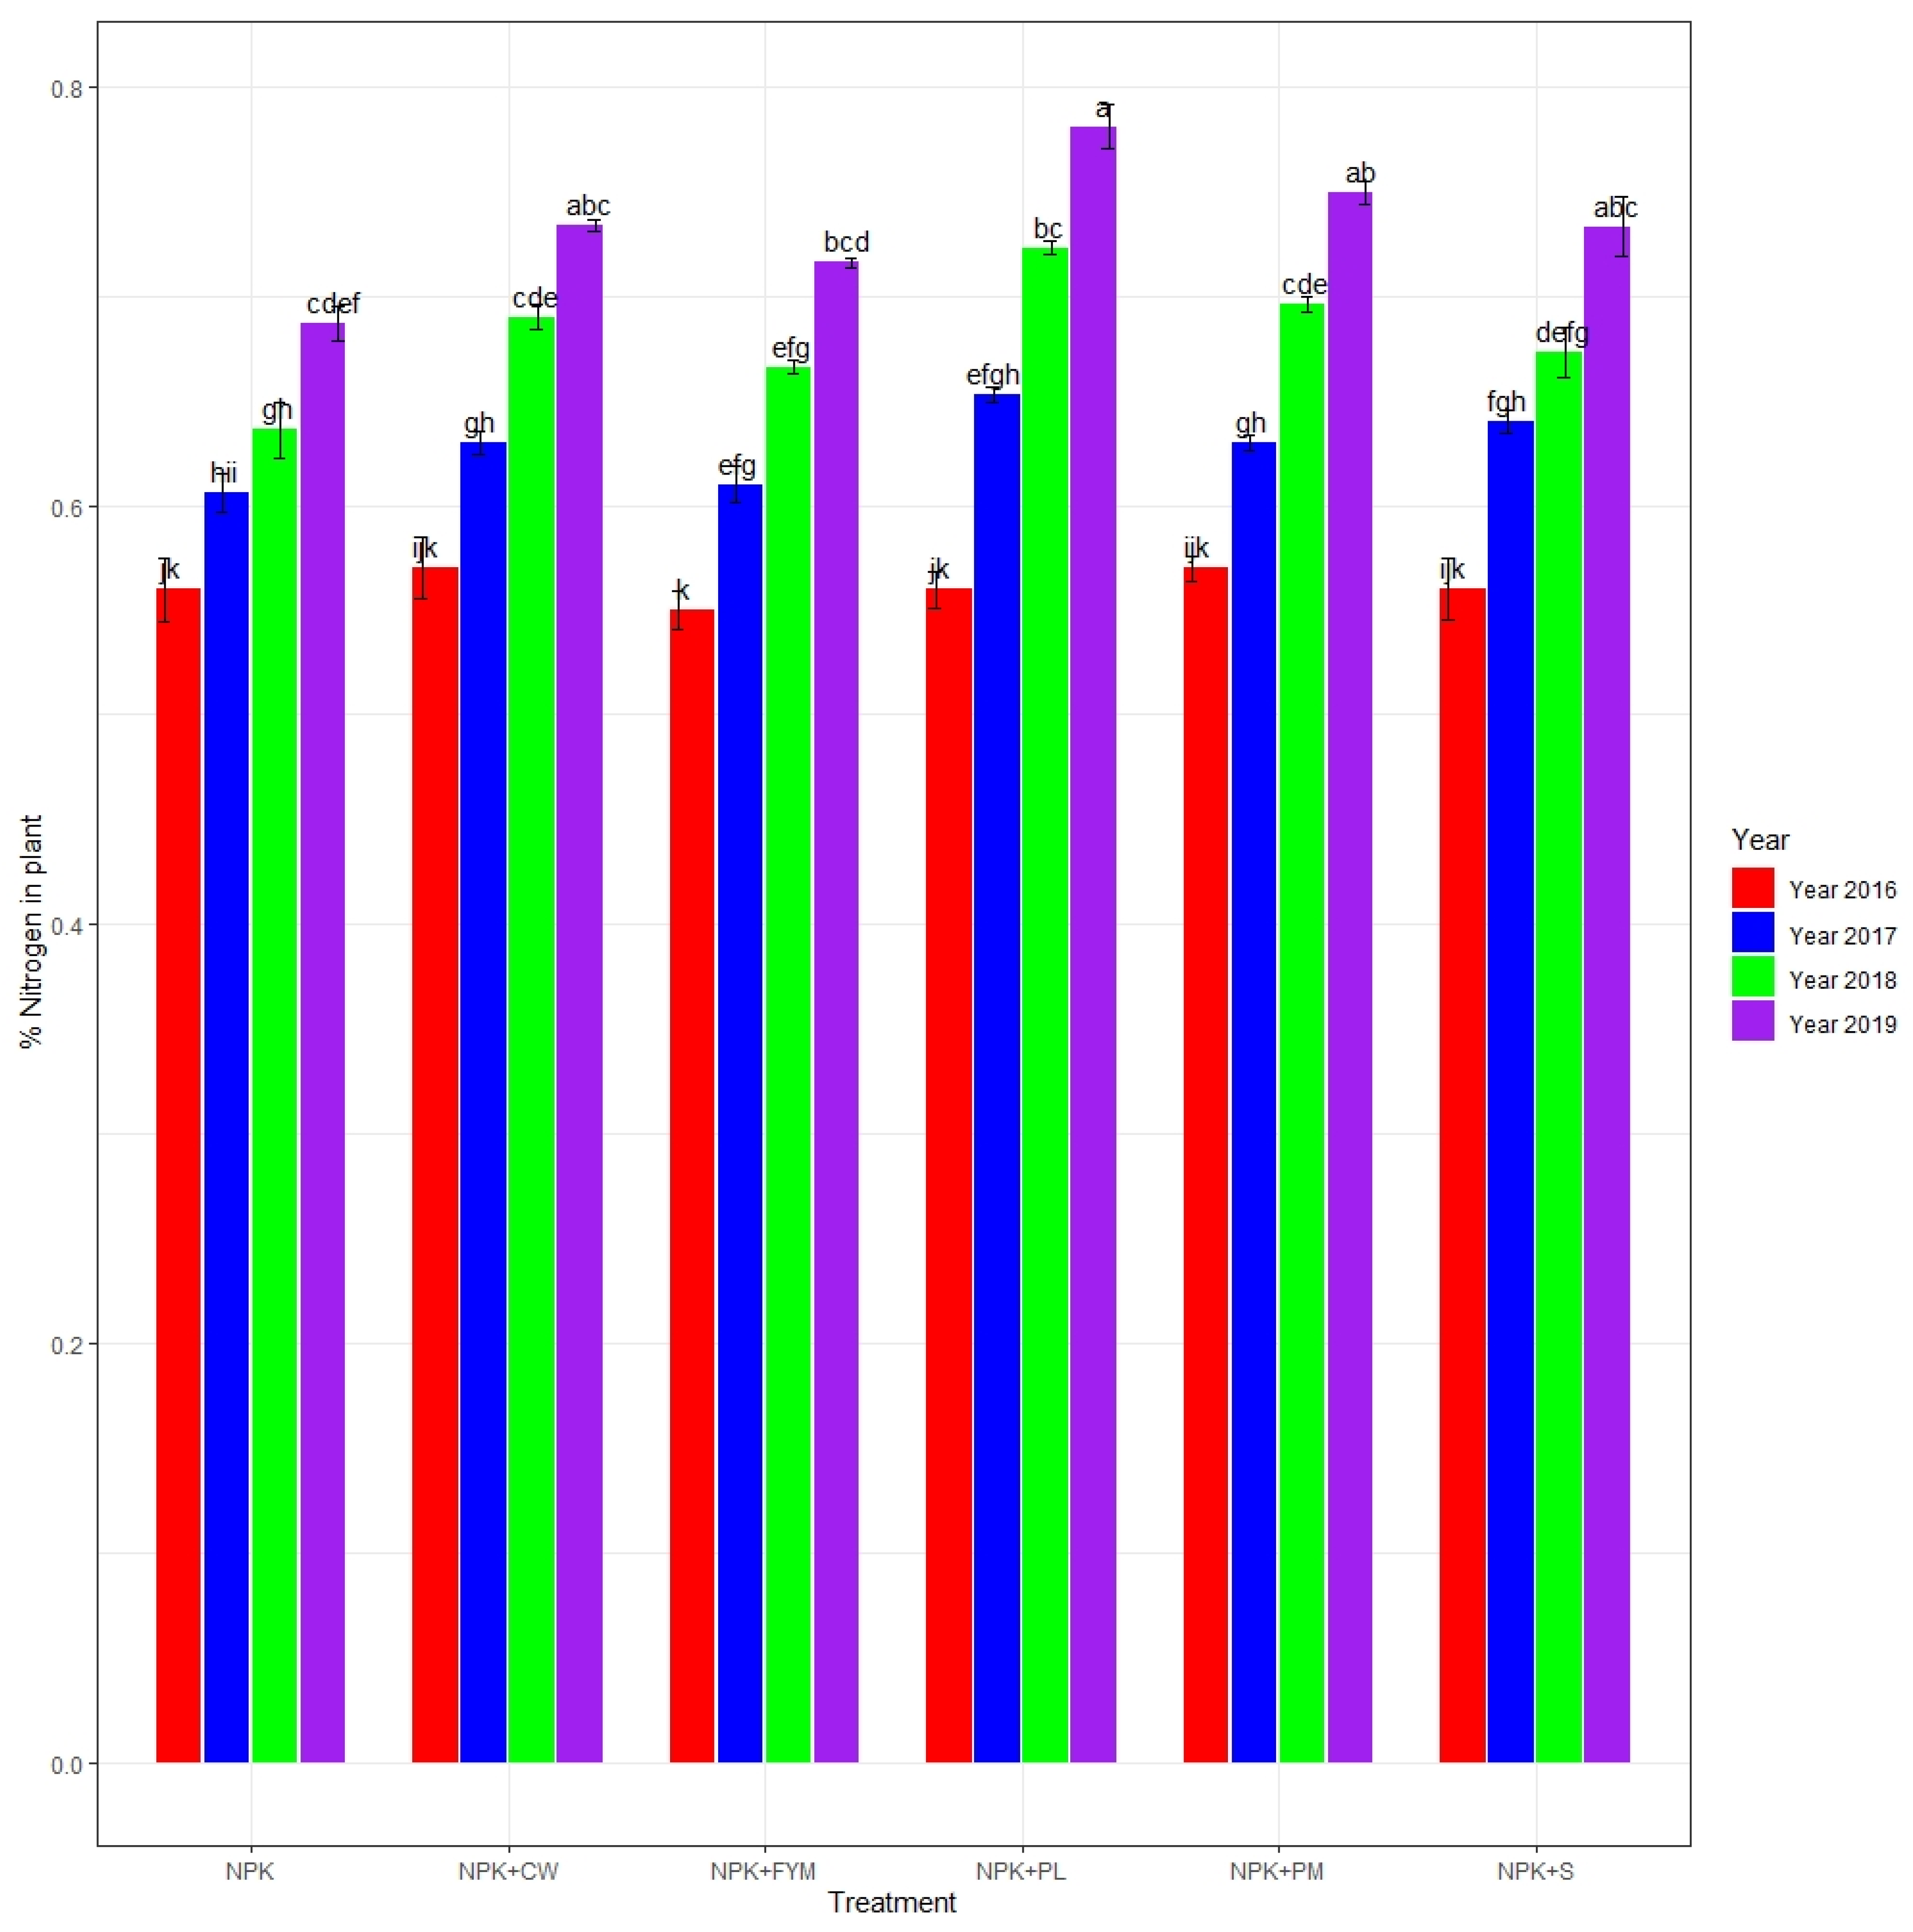
Figure 1. Percent nitrogen content in plant tissues during 2016–2019. Here, the main plot = treatment; subplot = year. The main plot treatment was significant, p < 0.01; F-value = 20.93; DF = 5. The sub-plot year was also significant (p-value < 0.01; F-value = 1216.21; DF = 1). The treatment × year interaction was also significant (p-value < 0.01; F-value = 6.768; DF = 5). Here lowercase letters, represents statistical ranks based upon difference between treatments.
Sustainability 15 11118 g001
Figure 2. Percent phosphorous content in plant tissues during 2016–2019. Here, the main plot = treatment; subplot = year. The main plot treatment was significant, p < 0.01; F-value = 18.4350; DF = 5. The sub-plot year was also significant (p-value < 0.01; F-value = 187.18; DF = 1). The interaction of treatment × year was non- significant (p-value > 0.05; F-value = 0.1714; DF = 5). Here lowercase letters, represents statistical ranks based upon difference between treatments.
Sustainability 15 11118 g002
Figure 3. Percent potassium content in plant tissues during 2016–2019. Here, the main plot = treatment; subplot = year. The main plot treatment was significant p < 0.01; F-value = 12.49; DF = 5. The sub-plot year was also significant (p-value < 0.01; F-value = 513.50; DF = 1). The interaction of treatment × year was significant (p-value < 0.05; F-value = 3.1837; DF = 5). Here lowercase letters, represents statistical ranks based upon difference between treatments.
Sustainability 15 11118 g003
Figure 4. Effect of treatments on dieback disease score during 2016–2019. Here a, b, c, represents statistical ranks based upon difference between treatments.
Sustainability 15 11118 g004
Figure 5. Reduction in dieback disease with the passage of time in disease-infected plants. Here a, b, c, represents statistical ranks based upon difference between treatments.
Sustainability 15 11118 g005
Table 1. The impact of inorganic and organic treatments on the soil chemical properties from the years 2016–2019.
TreatmentpHEC (dS m−1)Phosphorus (mg kg−1)Potassium (mg kg−1)Organic Matter (%)
NPK8.38 ± 0.03 a4.2 ± 0.08 a7.38 ± 0.18 b149.70 ± 5.13 ab0.608 ± 0.003 c
NPK + CW8.32 ± 0.02 a3.85 ± 0.21 ab7.80 ± 0.07 ab149.79 ± 3.19 ab0.637 ± 0.009 a
NPK + FYM8.38 ± 0.04 a3.80 ± 0.06 ab7.76 ± 0.16 ab148.29 ± 4.17 ab0.629 ± 0.006 ab
NPK + PL8.14 ± 0.07 b3.58 ± 0.05 b7.95 ± 0.05 a159.37 ± 4.53 a0.64 ± 0.015 a
NPK + PM8.38 ± 0.05 a3.93 ± 0.1 ab7.47 ± 0.11 ab150.12 ± 4.22 ab0.61 ± 0.009 bc
NPK + S8.34 ± 0.01 a3.88 ± 0.09 ab7.70 ± 0.09 ab146.29 ± 3.81 b0.60 ± 0.005 c
p-value<0.01<0.05<0.05≤0.05<0.01
F-value5.983.022.622.1110.87
DF55555
Here letters a, b, c, represents statistical ranks based upon difference between treatments.
Table 2. Change in soil chemical properties from the year 2016–2019.
YearpHEC (dS m−1)Phosphorus (mg kg−1)Potassium (mg kg−1)Organic Matter (%)
20168.47 ± 0.03 a4.08 ± 0.15 a7.51 ± 0.13 a133.33 ± 3.35 c0.59 ± 0.004 c
20178.29 ± 0.03 b3.81 ± 0.06 a7.60 ± 0.10 a150.61 ± 2.16 b0.60 ±0.004 c
20188.27 ± 0.03 b3.81 ± 0.06 a7.76 ± 0.09 a157.33 ± 2.17 ab0.62 ± 0.007 b
20198.27 ± 0.03 b3.79 ± 0.06 a7.83 ± 0.08 a161.11 ± 1.67 a0.65 ± 0.008 a
p-value<0.01>0.05>0.05<0.05<0.01
F-value515.392.211.842.1135.74
DF33333
Here letters a, b, c, represents statistical ranks based upon difference between treatments.
Disclaimer/Publisher’s Note: The statements, opinions and data contained in all publications are solely those of the individual author(s) and contributor(s) and not of MDPI and/or the editor(s). MDPI and/or the editor(s) disclaim responsibility for any injury to people or property resulting from any ideas, methods, instructions or products referred to in the content.