Article

Developing an Integration of Smart-Inverter-Based Hosting-Capacity Enhancement in Dynamic Expansion Planning of PV-Penetrated LV Distribution Networks

1
Energy Management Research Center, University of Mohaghegh Ardabili, Ardabil 5619911367, Iran
2
Department of Electrical Engineering, Azarbaijan Shahid Madani University, Tabriz 5375171379, Iran
3
Department of Electrical and Computer Engineering, University of Connecticut, Storrs, CT 06269, USA
4
Faculty of Electronics, Communication and Computers, University of Pitesti, 110040 Pitest, Romania
*
Author to whom correspondence should be addressed.
Sustainability 2023, 15(14), 11183; https://doi.org/10.3390/su151411183
Submission received: 3 June 2023 / Revised: 8 July 2023 / Accepted: 13 July 2023 / Published: 18 July 2023

Abstract

:
With the penetration of distributed energy resources (DERs), new network challenges arise that limit the hosting capacity of the network, which consequently makes the current expansion-planning models inadequate. Smart inverters as a promising tool can be utilized to enhance the hosting capacity. Therefore, in response to technical, economic, and environmental challenges, as well as government support for renewable resources, especially domestic solar resources located at the point of consumption, this paper is an endeavor to propose a smart-inverter-based low-voltage (LV) distribution expansion-planning model. The proposed model is capable of dynamic planning, where multiple periods are considered over the planning horizon. In this model, a distribution company (DISCO), as the owner of the network, intends to minimize the planning and operational costs. Optimal loading of transformers is considered, which is utilized to operate the transformers efficiently. Here, to model the problem, a mixed-integer nonlinear programming (MINLP) model is utilized. Using the GAMS software, the decision variables of the problem, such as the site and size of the installation of distribution transformers, and their service areas specified by the LV lines over the planning years, and the reactive power generation/absorption of the smart inverters over the years, seasons, and hours are determined. To tackle the operational challenges such as voltage control in the points of common coupling (PCC) and the limitations in the hosting capacity of the network for the maximized penetration level of PV cells, a smart-inverter model with voltage control capability in PCC points is integrated into the expansion-planning problem. Then, a two-stage procedure is proposed to integrate the reactive power exchange capability of smart inverters in the distribution expansion planning. Based on the simulations of a residential district with PV penetration, results show that by a 14.7% share of PV energy generation, the loss cost of LV feeders is reduced by 28.3%. Also, it is observed that by optimally making use of the reactive power absorption capability of the smart inverters, the hosting capacity of the network is increased by 50%.

1. Introduction

1.1. Background

Technical issues related to the integration of the new energy resources require the development of new expansion-planning models. In recent years, renewable energies have been increasingly integrated into distribution systems worldwide due to government support for dealing with technical, economic, and environmental challenges. This level of penetration of distributed energy resources (DER), especially small-scale domestic solar resources that are scattered in different parts of the LV distribution network, can be a challenge due to the mismatch of solar power generation and consumption in low-load conditions or the uncertainty of load and solar irradiation. It has caused operational issues such as voltage increase, voltage drop, protection, imbalance, and thermal loading of conductors and transformers for distribution service providers. Violation of standard ranges, especially the voltage level, has resulted in hosting-capacity problems in the weak distribution network (with high impedance) and this prevents the integration of more solar resources.

1.2. Literature Review

The penetration of the DERs, while having benefits, causes some technical challenges, which emphasizes the need for mitigation techniques. Wankhede et al. [1] provided an organized classification of different technical challenges along with mitigation measures. To solve the technical challenges caused by the widespread integration of renewable resources, Ghiani and Pilo [2] emphasized the revision of the grid connection standards with the aim of flexibility in the performance of the resources distributed in the network. Ghiani and Gregorio [3] addressed the challenges caused by the extensive connection of photovoltaic resources in weak power distribution networks with high impedance and prompted traditional and modern ways to control the voltage in the appropriate operating range.
The deployment of smart management technologies can be a promising solution to newly emerging challenges [4]. Zhou et al. [5] presented the importance of energy integration and interaction between buildings, renewable resources, and electric vehicles, and showed the technical, economic, and environmental benefits of such a precise integration. The interoperability concept is introduced in the literature [6,7], which makes use of the potentials of multiple micro-grids and their interactions to resolve the mismatch of power issues in the LV distribution network. Zhou and Cao [8] developed a flexible energy management system and a flexible energy control strategy, which are important to promote the efficiency of energy-flexible buildings, and the participation of policy makers and building owners. Also, they studied the techno-economic performance of building–electric vehicle systems by transferring the energy paradigm from negative to positive, along with a series of effective solutions such as the use of renewable resources and energy storage devices [9]. AlKaabi et al. [10] proposed several Photovoltaic Inverter Control (PVIC) schemes depending on the active power generation of PV arrays, the size of the inverter, and the desired reactive power settings. Mahmoud and Lehtonen [11] proposed a three-level control strategy (local, regional, and coordinated control) based on the simultaneous optimization of the intelligent functions of PV inverters and control devices. This strategy is studied to minimize deviations and voltage flicker under the conditions of the penetration of renewable resources in the distribution network. Vijayan et al. [12] suggested a procedure using demand-response strategies with V-VaR optimization for unbalanced active distribution systems. In addition to voltage management, the proposed formulation minimizes peak load, losses, and unbalances more effectively. Lee et al. [13] proposed the Sparrow search algorithm to optimize the setting points of the voltage control equipment to provide separate phase voltage regulation strategies in a large-scale unbalanced distribution network with high photovoltaic penetration. Dutta et al. [14] presented a prediction-based voltage control scheme model that coordinates the performance of the traditional and modern voltage control equipment in distribution networks to maintain the voltage resulting from the widespread integration of solar resources. Sun et al. [15] proposed a protective voltage reduction strategy based on V-VaR optimization using multi-stage data, reducing total energy consumption and at the same time reducing rapid voltage violations in distribution networks. Wang et al. [16] showed that the risk of system voltage is reduced through the allocation of VaR capacity of inverters in an economical way. Hassan et al. [17] proposed the evaluation of network hosting capacity to integrate the maximum installed capacity of DERs in a distribution system by observing the operating range. The work presented in [18] dealt with the methods of evaluating and upgrading the hosting capacity of the distribution network through a comprehensive review of various research studies and practical projects.
Distribution expansion planning is a complex optimization problem to maximize or minimize one or more objective functions, taking into account technical and operational constraints, with technical, economic, and environmental objectives. Studies on the planning of power networks are known as component placement, reinforcement, and upgrades (CRU) [19].
There are a few studies on planning that have dealt with new smart management technologies. Ghiani and Psiano [20] presented the effective results of using renewable energy resources and energy storage technologies in the operation and planning of intelligent distribution networks. The authors suggested that the optimal and coordinated management of DERs can reduce some of the technical challenges of operation and postpone investments for transformers and line reinforcement. Chihtoa and Bekker [21] considered the inadequacy of traditional planning methods due to the lack of consideration of the uncertainty of DER resources. It included planning requirements for Active Distribution Networks (ADN) with DER penetration. Then, the impact of different planning approaches on the technical performance of ADNs and their hosting capacity for the presence of more DERs has been investigated. Dashtaki et al. [22] presented a new management method to find the optimal operation of a grid-connected microgrid (MG). In this paper, the objectives included minimizing the total cost of operation and planning of the MG system, improving the voltage profile, and reducing the total power loss of the distribution system.
Table 1 presents research works related to CRU planning techniques in active LV distribution network planning over the last eight years (2015–2023), which are studied and summarized from different aspects including objective functions, distribution voltage level, the time horizon of the study, type of objective function, components of the active distribution network, model, and solution algorithm.

1.3. Scientific Gaps and Contributions

The review of the previous studies shows that the problem of dynamic planning of an LV distribution network in the presence of small-scale domestic solar resources has received less attention. Also, in the field of the emergence of operational challenges caused by the widespread integration of small-scale solar resources, most of the studies have been related to the issue of optimal operation of the distribution network. Therefore, considering the above-mentioned gaps, what distinguishes the present study from previous research is the integration of the above two parts. In other words, we are determined to provide an innovative method of dynamic planning for the expansion of an LV distribution network under the conditions of the presence of small-scale solar resources with the requirements of voltage control and improving the hosting capacity of the network. Based on Table 1, smart inverters, as a promising solution to enhance the hosting capacity of the distribution network in LV distribution expansion-planning studies, have been neglected, and are a challenge waiting to be addressed.
Therefore, the present research is designed based on the following requirements.
  • The importance of the power-quality issue in the LV network is much higher than in the MV distribution network.
  • Major energy losses in the distribution network are related to the LV network.
  • Distributed loads and resources located in the LV network are scattered at different points of the network unlike in the MV network, which is centralized.
  • Renewable resources based on LV networks are developing with significant growth in response to technical, economic, and environmental benefits as well as government support.
  • The widespread integration of small-scale solar resources into LV networks has created significant technical challenges for customers and distribution network planners.
Considering the above requirements, in this paper, an innovative method is proposed for the dynamic planning of LV distribution network development in the large presence of small-scale solar resources during planning years. In the proposed method, the model of smart inverters has been integrated into the expansion-planning problem in response to the challenge of over-voltage and the improvement of hosting capacity. The issue has been looked at from the point of view of the electricity distribution company (DISCO). The DISCO, as the owner and planner of the network, minimizes the costs of construction and operation by complying with all technical constraints. The optimal route of the distribution lines and the hourly power values of the smart inverter are determined under the conditions of annual load growth, new loads, and the penetration level of small-scale solar resources. The MINLP mathematical algorithm is used to model the problem and GAMS optimization software v.43.4.1 is used to solve the model.
Finally, the main contributions of this paper can be summarized as follows.
  • Dynamic planning of the LV distribution network under the conditions of the widespread penetration of small-scale domestic solar energy resources over a multi-year time horizon;
  • Integration of the optimal loading model of the transformers in a dynamic planning problem of the expansion of the distribution network with cost minimization;
  • Integrating the model of smart inverters in the dynamic planning problem of the distribution network to respond to the over-voltage challenge of customers and improve the hosting capacity for the maximum penetration of DERs.

2. Smart-Inverter-Based Hosting-Capacity Enhancement

2.1. The Concept of Hosting-Capacity Enhancement

In recent years, in response to technical, economic, and environmental challenges and the support of governments, renewable energies, especially home-based solar resources, have been increasingly integrated into distribution systems. Meanwhile, the distribution system can accommodate new energy resources to a certain extent. The widespread penetration of distributed energy resources is limited by the emergence of operational challenges. The mismatch of solar power generation and consumption in off-peak conditions or uncertainty in load or solar irradiation are among the operational challenges that limit the hosting capacity of the network for the presence of more solar resources. Therefore, it can be said that the hosting capacity of the network refers to the capacity of DERs that can be integrated into the network without any violation of the operational indicators.
The assessment of hosting capacity allows us to determine the maximum allowable installed capacity of DERs in a distribution system within its operating range to obtain additional benefits. To evaluate the hosting capacity, suitable performance indicators such as voltage violation, thermal overload, power-quality issues, and protection problems have been developed. The review of the studies shows that among the above indicators, two indicators of over-voltage and thermal capacity of the conductor (loading) have been identified as the main factors limiting the hosting capacity of the network. As illustrated in Figure 1 [31], the hosting capacity of the distribution network for the penetration of renewable resources can be increased to the extent that the voltage of the consumption points does not exceed the maximum allowable voltage level. According to [18], by making it possible to control the voltage of consumption points and depending on the configuration of the distribution network, the hosting capacity can be increased from 1.5 to 3 times the power of the consumed load.

2.2. Voltage Regulation in Active Distribution Networks

The studies have proposed different strategies to mitigate voltage violations in small-scale grid-connected PV systems based on the standards. According to the concept of voltage violation reduction methods [32], there are different strategies such as feeder enhancement, tap changer transformer, demand side management, active power curtailment, reactive power exchange, energy storage systems, static transfer switch, and hybrid systems. Among the reactive power exchange strategies can mention STATCOM and PV-inverter capability.
The issues related to the voltage regulation of load points discussed in this paper are a consequence of the possible negative impact of DG on radial distribution networks. The effects of voltage increase due to the integration of higher values of DG on weak distribution networks are well known. These effects are significant in weak radial distribution networks, with high a R/X ratio in network impedance and long-distance LV distribution lines.
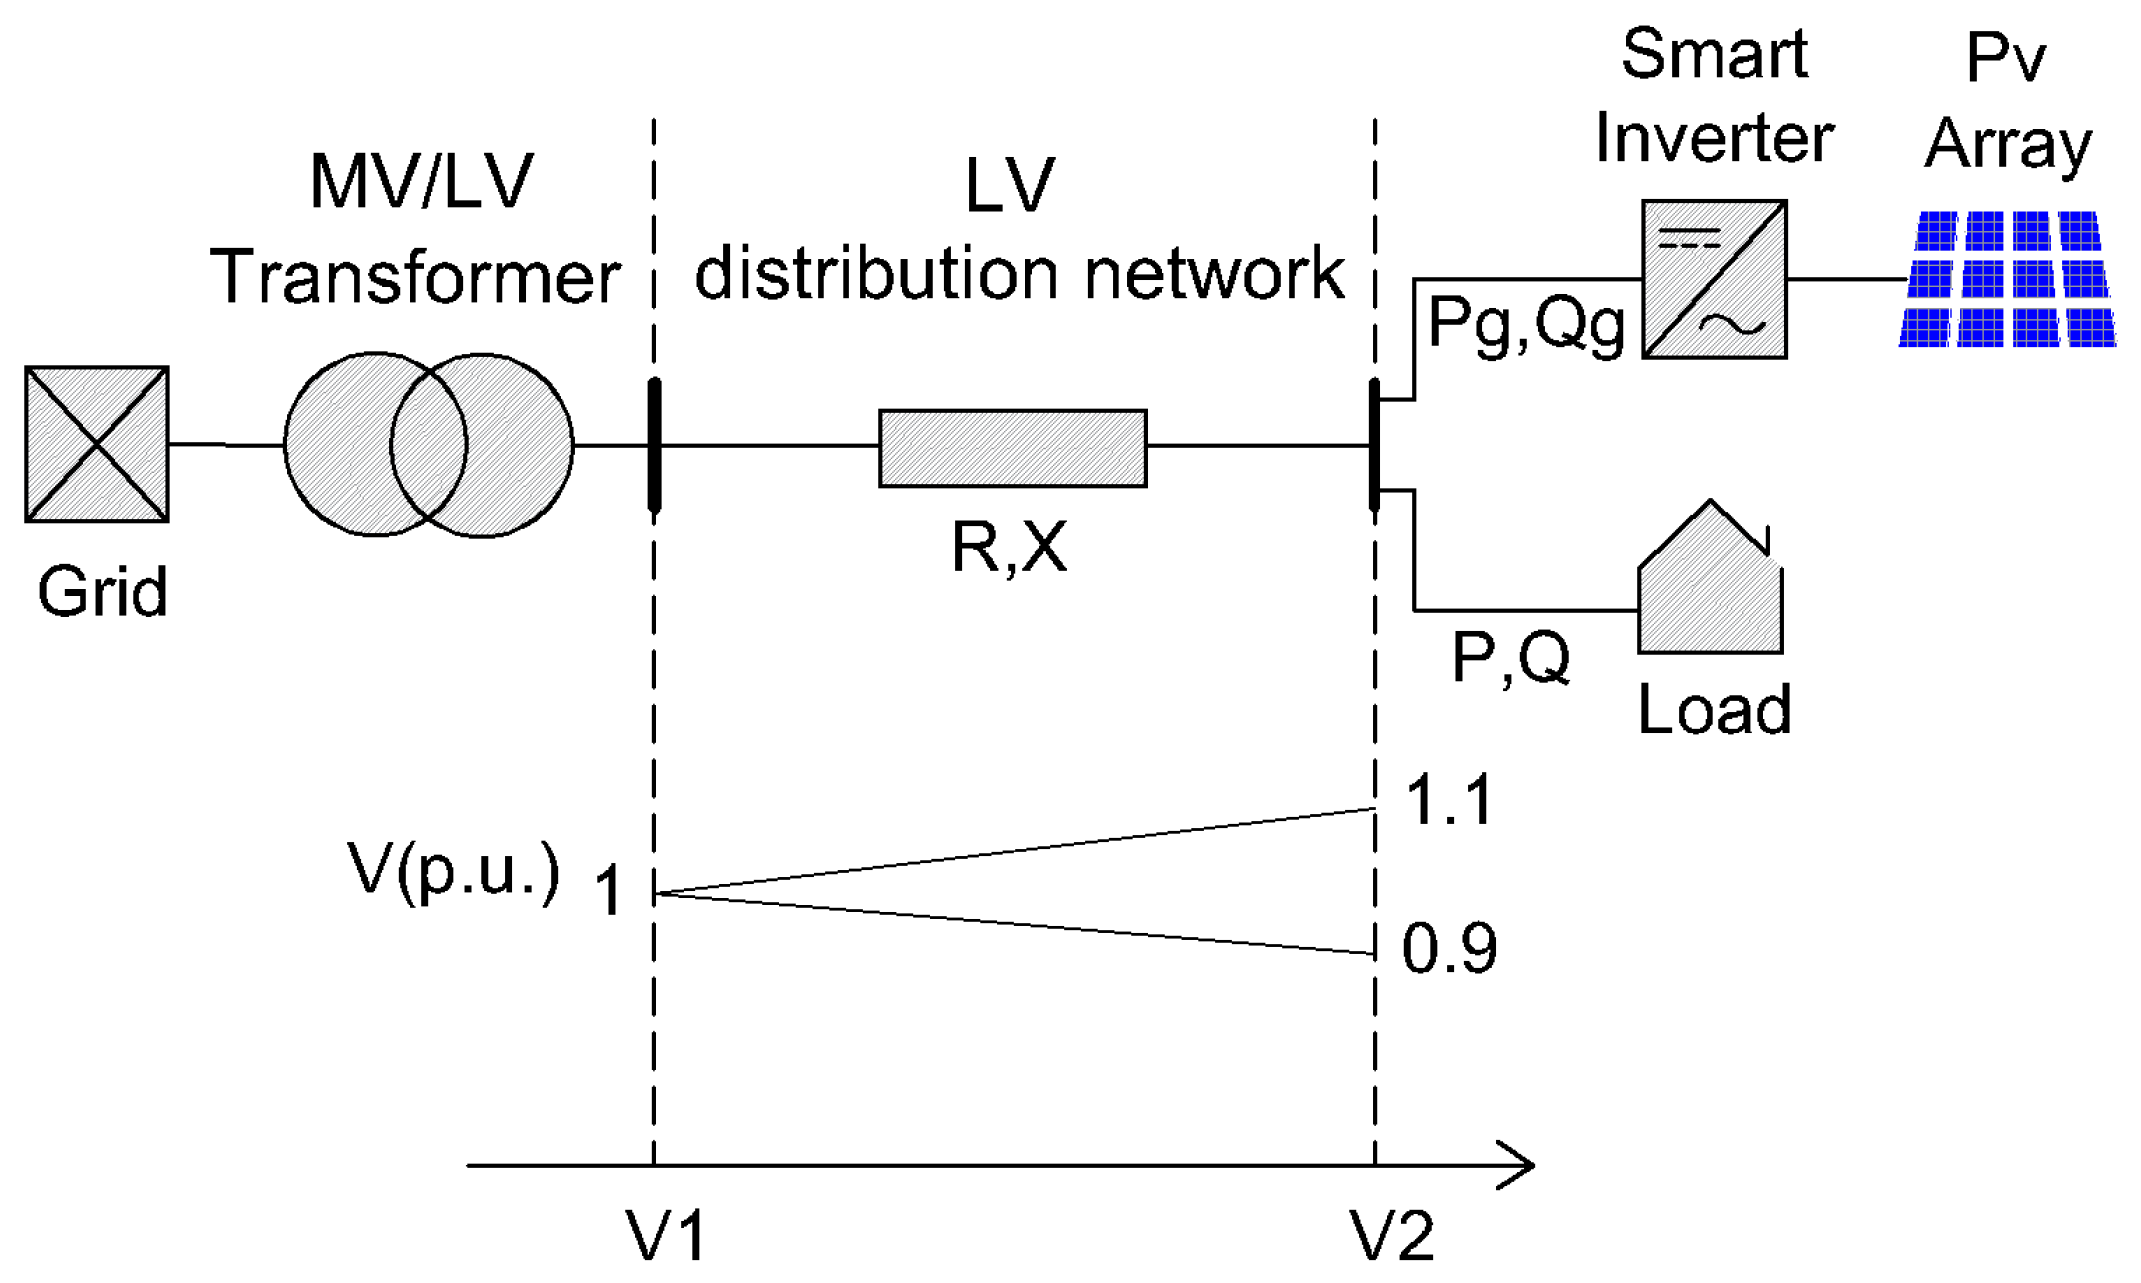
According to Figure 2 [2], the effects of voltage increase in radial weak distribution networks are shown where a small-scale solar power plant and a household load are connected at the end of the line. The continuous switching on and off of the inverter and increasing the voltage by more than the standard permissible values is one of the main consequences of the widespread integration of small-scale solar power plants in the LV distribution network. Relationships governing the problem are expressed as follows:
The voltage change in the feeder can be expressed by (1).
V = V 1 V 2 = R ( P P g ) + X ( Q ± Q g ) V
where V 1 is the voltage at the beginning of the feeder; V 2 is the voltage at the end of the feeder; R is the resistance of the feeder; X is the reactance of the feeder; P is the active power absorbed by the load at the end of the feeder; Q is the reactive power absorbed by the load at the end of the feeder; P g is the active power produced by the solar power plant at the end of the feeder; and ± Q g is the reactive power absorbed/produced by the solar power plant at the end of the feeder. In the absence of load ( P = Q = 0 ), Equation (1) can be rewritten as (2), which shows the relationship between the injected power and the voltage at the point of common coupling (PCC).
V 1 = V 2 + R ( P g ) + X ( ± Q g ) V
According to (2), the PV can provide voltage support to raise V 2 at the end of the LV feeder, but in the case of minimal/no load and high values of R, the magnitude of V 2 can lead to over-voltage. This will limit the injectable active power or the integration capacity of PVs at the end of the line. According to the above equation, by absorbing the reactive power ( Q ) in the smart inverter, the voltage of the load points ( V 2 ) can be reduced.
In this study, the reactive power exchange strategy of smart inverters of domestic solar resources has been used in the dynamic planning of the LV distribution network to maintain the voltage within the permissible operating range.

2.3. Smart Inverters as a Means to Control Reactive Power

With the widespread integration of distributed energy resources with distribution networks, high technical challenges arise that require appropriate tools and techniques. One of the best possible solutions to solve these challenges is a smart inverter with multiple control functions. Inverters are traditionally used to produce real power at a unity power factor. A smart inverter is a multi-purpose inverter that generates/modulates real power, exchanges (injects/absorbs) reactive power, and, in addition, in response to system conditions, can work in different lagging and leading power factors.
Smart inverters are rapidly emerging and used worldwide in response to the above challenges. These require compliance with specific standards and guidelines for connecting distributed energy resources.
In this paper, the capability of a smart inverter is utilized in voltage control through reactive power exchange (V-VaR) in the dynamic planning of an LV distribution network. In the process of exchanging reactive power with the grid, the maximum reactive power is determined based on PV-inverter capabilities and their installation location. The standards define the upper voltage limit, lower limit, and the allowed band. If the voltage exceeds the limit, the PV inverter injects/absorbs the reactive power. Figure 3 shows the operation of the described smart inverter [1].

2.4. Control Scheme of the PV Inverters

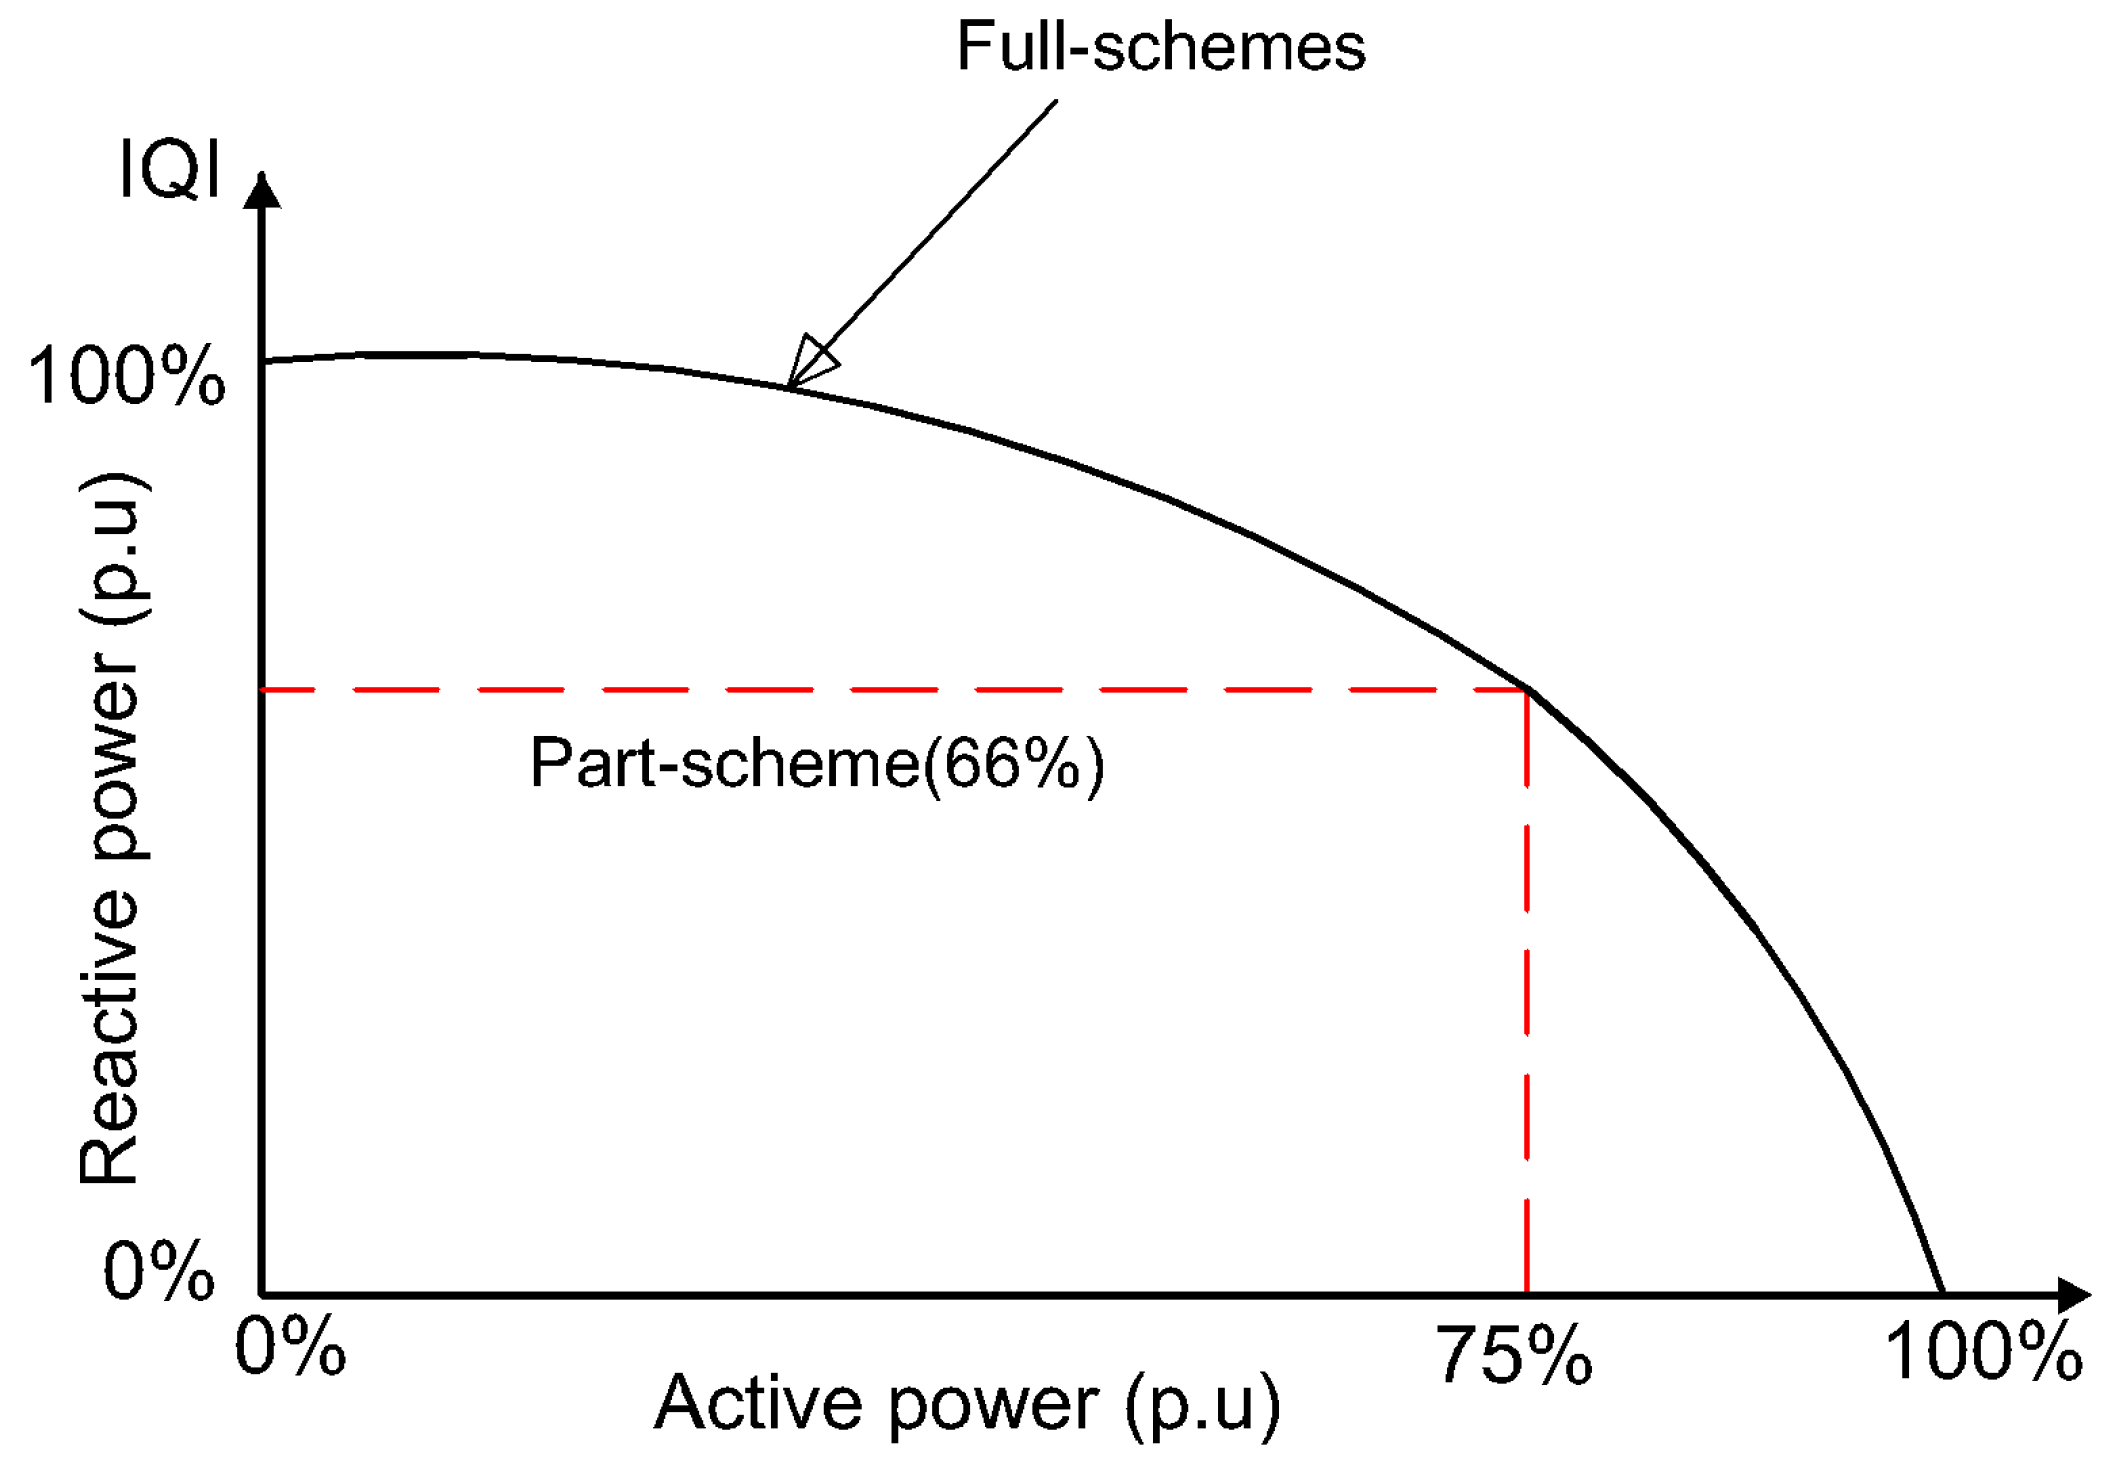
Various plans for using the reactive power of smart PV inverters have been proposed based on the output power of PV arrays, the desired reactive power support, and the size of the inverter [10]. In this paper, due to the availability of irradiation information and the active power output of solar panels in different seasons of the year, a partial utilization plan has been used for planning the active distribution network. In this scheme, based on historical PV data, grid planners can determine the amount of unused inverter capacity in all the usage times. For example, the irradiation data in the Tennessee region of America, which is the basis of this paper, shows that the maximum active power of solar panels in the sample area is 65% in the spring season. Considering the 10% uncertainty of irradiation, the remaining 25% of the active power capacity of the inverter can be used to support the voltage of the load points. As shown in Figure 4 [10], considering S = P 2 + Q 2 , it can be determined that if 75% of the capacity of the smart inverter is used to supply active power, 66% of the capacity of the inverter can be considered for exchanging reactive power and controlling the voltage.
In this study, taking into account the permissible voltage increase level of the load points (3%), one of the main indicators of the hosting capacity, i.e., the voltage level, is controlled through the reactive power control of the smart inverter.

3. The Methodology

The proposed methodology contains two parts, namely Section 3.1 and Section 3.2, where in Section 3.1 the optimization model is presented and in Section 3.2, the reactive power allocation of smart inverters is explained in two stages.

3.1. The Proposed Expansion Planning Model

The proposed optimization model for the dynamic expansion planning of an LV distribution network is expressed using the objective function as in (3)–(16) and two sets of operational and logical constraints as in (17)–(30), which are explained in the following subsections.

3.1.1. Cost Functions

The objective function is the yearly sum of the total cost function as in (3), where the total cost function consists of installation and operational costs as given in (4). δ y i n s and δ y o p e r are utilized to calculate the net present value, as given in (5). These two terms help to apply the investment cost at the start of each year and the operational cost at the end of each year.
C t o t = y C y ( u , r , z , g )
C y ( u , r , z , g ) = δ y i n s C y i n s , t r a n s + C y i n s , l v f + δ y o p e r ( C y l o s s , t r a n s , i r + C y l o s s , t r a n s , c u + C y l o s s , l v f + C y p o l + C y p r o d )
δ y i n s = 1 + α i n f r 1 + α i n t r y 1 , δ y o p e r = 1 + α i n f r 1 + α i n t r y
In (4), the installation cost is related to the distribution transformers (DTs) and LV lines, which are obtained as given in (6)–(8), respectively. u t n y as a binary decision variable shows that whether size n is selected for DT t at Year y or not. A combination of Equations (6) and (7) is utilized to model the expansion costs of DTs. A DT investment cost is applied when the size of a specific DT changes. The price of DT with size n is shown by λ n t r a n s and accordingly, the price of LV line is shown by λ l v f . Also, z t l y as a binary decision variable shows whether the line from DT t to load point l at Year y is invested or not. D t l is the distance from DT t to load point l. In the construction of LV distribution networks, unlike transmission networks, which are generally radial, to respect the privacy of residential buildings, the distance between the load and transformer is generally the sum of horizontal and vertical distances.
C y i n s , t r a n s = t n u t n y λ n t r a n s C y 1 i n s , t r a n s y 1
C 1 i n s , t r a n s = t n u t n 1 λ n t r a n s
C y i n s , l v f = t l z t l y D t l λ l v f
In addition, the operational cost comprises the copper and the iron loss costs of DTs, the loss cost of LV lines, the pollution cost, and the production cost, as given in (9)–(13), respectively. In (9), β is the yearly loss factor, which is utilized to obtain yearly energy losses. Also, λ p r and λ e l e c are used to consider cost savings due to peak reductions and energy consumption cost, respectively. As in (9), the cu loss cost of the transformer is related to its loading, whereas the iron loss cost just depends on the size of DT as in (10). Γ n is the size n of DT alternatives. Also, the loss cost of LV lines is modeled by R I 2 as in (11). In (11), r t l y is a binary decision variable that shows whether at Year y, load point l is connected to DT t or not. Yearly energy consumption is modeled considering some typical days over a year indexed by p. N p d a y is the number of days in a year with power scenario p. Therefore, the cost of pollution and production are modeled as (12) and (13), respectively. E p g p is a factor to obtain the weight of gas pollution with respect to energy consumption as kg per kWh.
C y l o s s , t r a n s , c u = λ p r + 8760 λ e l e c β · t n u t n y L n c u g t y p e a k Γ n
C y l o s s , t r a n s , i r = λ p r + 8760 λ e l e c · t n u t n y L n i r
C y l o s s , l v f = λ p r + 8760 λ e l e c β · t l r t l y D t l R v 2 ( S l y p e a k ) 2
C y p o l = t h p N p d a y g t h p y E p g p cos ϕ λ p o l
C y p r o d = t h p N p d a y g t h p y cos ϕ λ e l e c
g t h p y is the load of transformer t, at hour h, power scenario p, and Year y, which can be obtained as (14). It is obtained by collecting loads connected to each transformer and by subtracting load ( S l h p y l o a d ) from the generation ( S l h p y g e n ) in the load point. g t y p e a k , as the peak load of DT t at Year y, can be obtained as (15), which is the maximum value among the power scenarios and daily hours. Accordingly, the peak load of load point l at Year y can be obtained as (16).
g t h p y = l r t l y ( S l h p y l o a d S l h p y g e n )
g t y p e a k = max h , p g t h p y
S l y p e a k = max h , p S l h p y l o a d S l h p y g e n

3.1.2. Operational Constraints

The loading of the transformer is one of the main operational constraints in distribution networks. Thus, the loading constraints are modeled by Equations (17)–(22). According to (17), a transformer’s loading must not violate a specified limit, which is, from the authors’ experience, about 80% of its rating. W t y is the rating of DT t at Year y, which is obtained as (18). To operate the distribution transformers optimally and economically, the concept of optimal transformer loading is adopted in this paper. There are two types of loading, namely fixed and cyclic loading, where the latter is common in distribution networks. The idea of optimal transformer loading is to increase the loading in the peak hours if the transformer is loaded less in off-peak hours. There are some standards [33,34] that suggest the use of this concept. In IEEE Std. C57.91 [34], it is considered possible to load distribution transformers above the average hot-spot temperature of 110 degrees Celsius for short periods of work, provided that they are operated for much longer periods at a temperature lower than 110 degrees Celsius. This is because thermal aging is a cumulative process. This allows higher loads to be carried safely under specified conditions without exceeding the normal lifetime of the transformer. According to IEC60076-7 [33], if the off-peak and peak periods are 20 and 4 h a day, respectively, at an ambient temperature of 40 degrees Celsius, if the loading of the transformer is 20% in the off-peak period, the transformer can be loaded up to 115% during the peak period.
Based on IEC 60076-7 [23,33], the optimal loading of a transformer can be modeled using Equations (19)–(21). The optimal loading factor of a transformer ( k t p y p e a k ) is defined based on k t p y o f f p e a k as in (19) with three coefficients as a, b, and c. As given in (20), k t p y o f f p e a k is based on the loading of the transformer over the off-peak hours. The average off-peak and peak powers can be calculated as given in (21), where N o h and N p h are the off-peak and peak hours, respectively. In addition, to load the transformers more optimally, the off-peak and peak loadings must be greater than specified limits according to (22).
g t p y p e a k k t p y p e a k W t y
W t y = n u t n y Γ n
k t p y p e a k = a + b ln ( c k t p y o f f p e a k )
k t p y o f f p e a k = g t p y o f f p e a k W t y
g t p y o f f p e a k = 1 N o h i g t i p y , g t p y p e a k = 1 N p h j g t j p y
g t p y o f f p e a k μ m i n W t y , g t p y p e a k μ m a x W t y
Another operational constraint is the voltage drop/increase constraint, which is defined as (23). The voltage drop/increase must be less than a specified parameter as Λ m a x . The voltage drop/increase on each of the LV lines can be obtained from (24). Active power generation ( P l h p y g e n ) and reactive power absorption ( Q l h p y a b s ) are also considered in (24). In this paper, it is considered that the PV modules are equipped with smart inverters. Thus, it is possible to consider the reactive power absorption as a means to contribute to the decrease of the voltage value in the PCC points. Also, the active and reactive power consumption of each load point l can be obtained as (25).
| V t l h p y V Λ m a x
V t l h p y = r t l y D t l [ R P l o a d l h p y P l h p y g e n + X Q l h p y l o a d Q l h p y a b s ]
P l h p y l o a d = S l h p y l o a d cos ϕ , Q l h p y l o a d = S l h p y l o a d sin ϕ

3.1.3. Logical Constraints

To model dynamic expansion planning of active LV distribution networks, some logical constraints are proposed. The upper limit of (26) shows that for transformer t at Year y, only one alternative size can be selected. In addition, the lower limit shows that a line from transformer t to load point l can be invested if the transformer t is invested. Also, as in (27), the line can be invested if it is connected to a non-zero load point. According to (28), each year, each non-zero load point must be connected to only one transformer. A l y is a binary parameter that shows there is a non-zero load in load point l at Year y. It should be indicated that as in (29), a load point can be connected to just one specified transformer over all the planning years. Finally, as in (30), an LV line can be utilized if it is invested.
z t l y n u t n y 1
z t l y A l y
t r t l y = A l y
t y z t l y = 1
r t l y = τ = 1 y z t l τ

3.2. Two-Stage Reactive Power Allocation

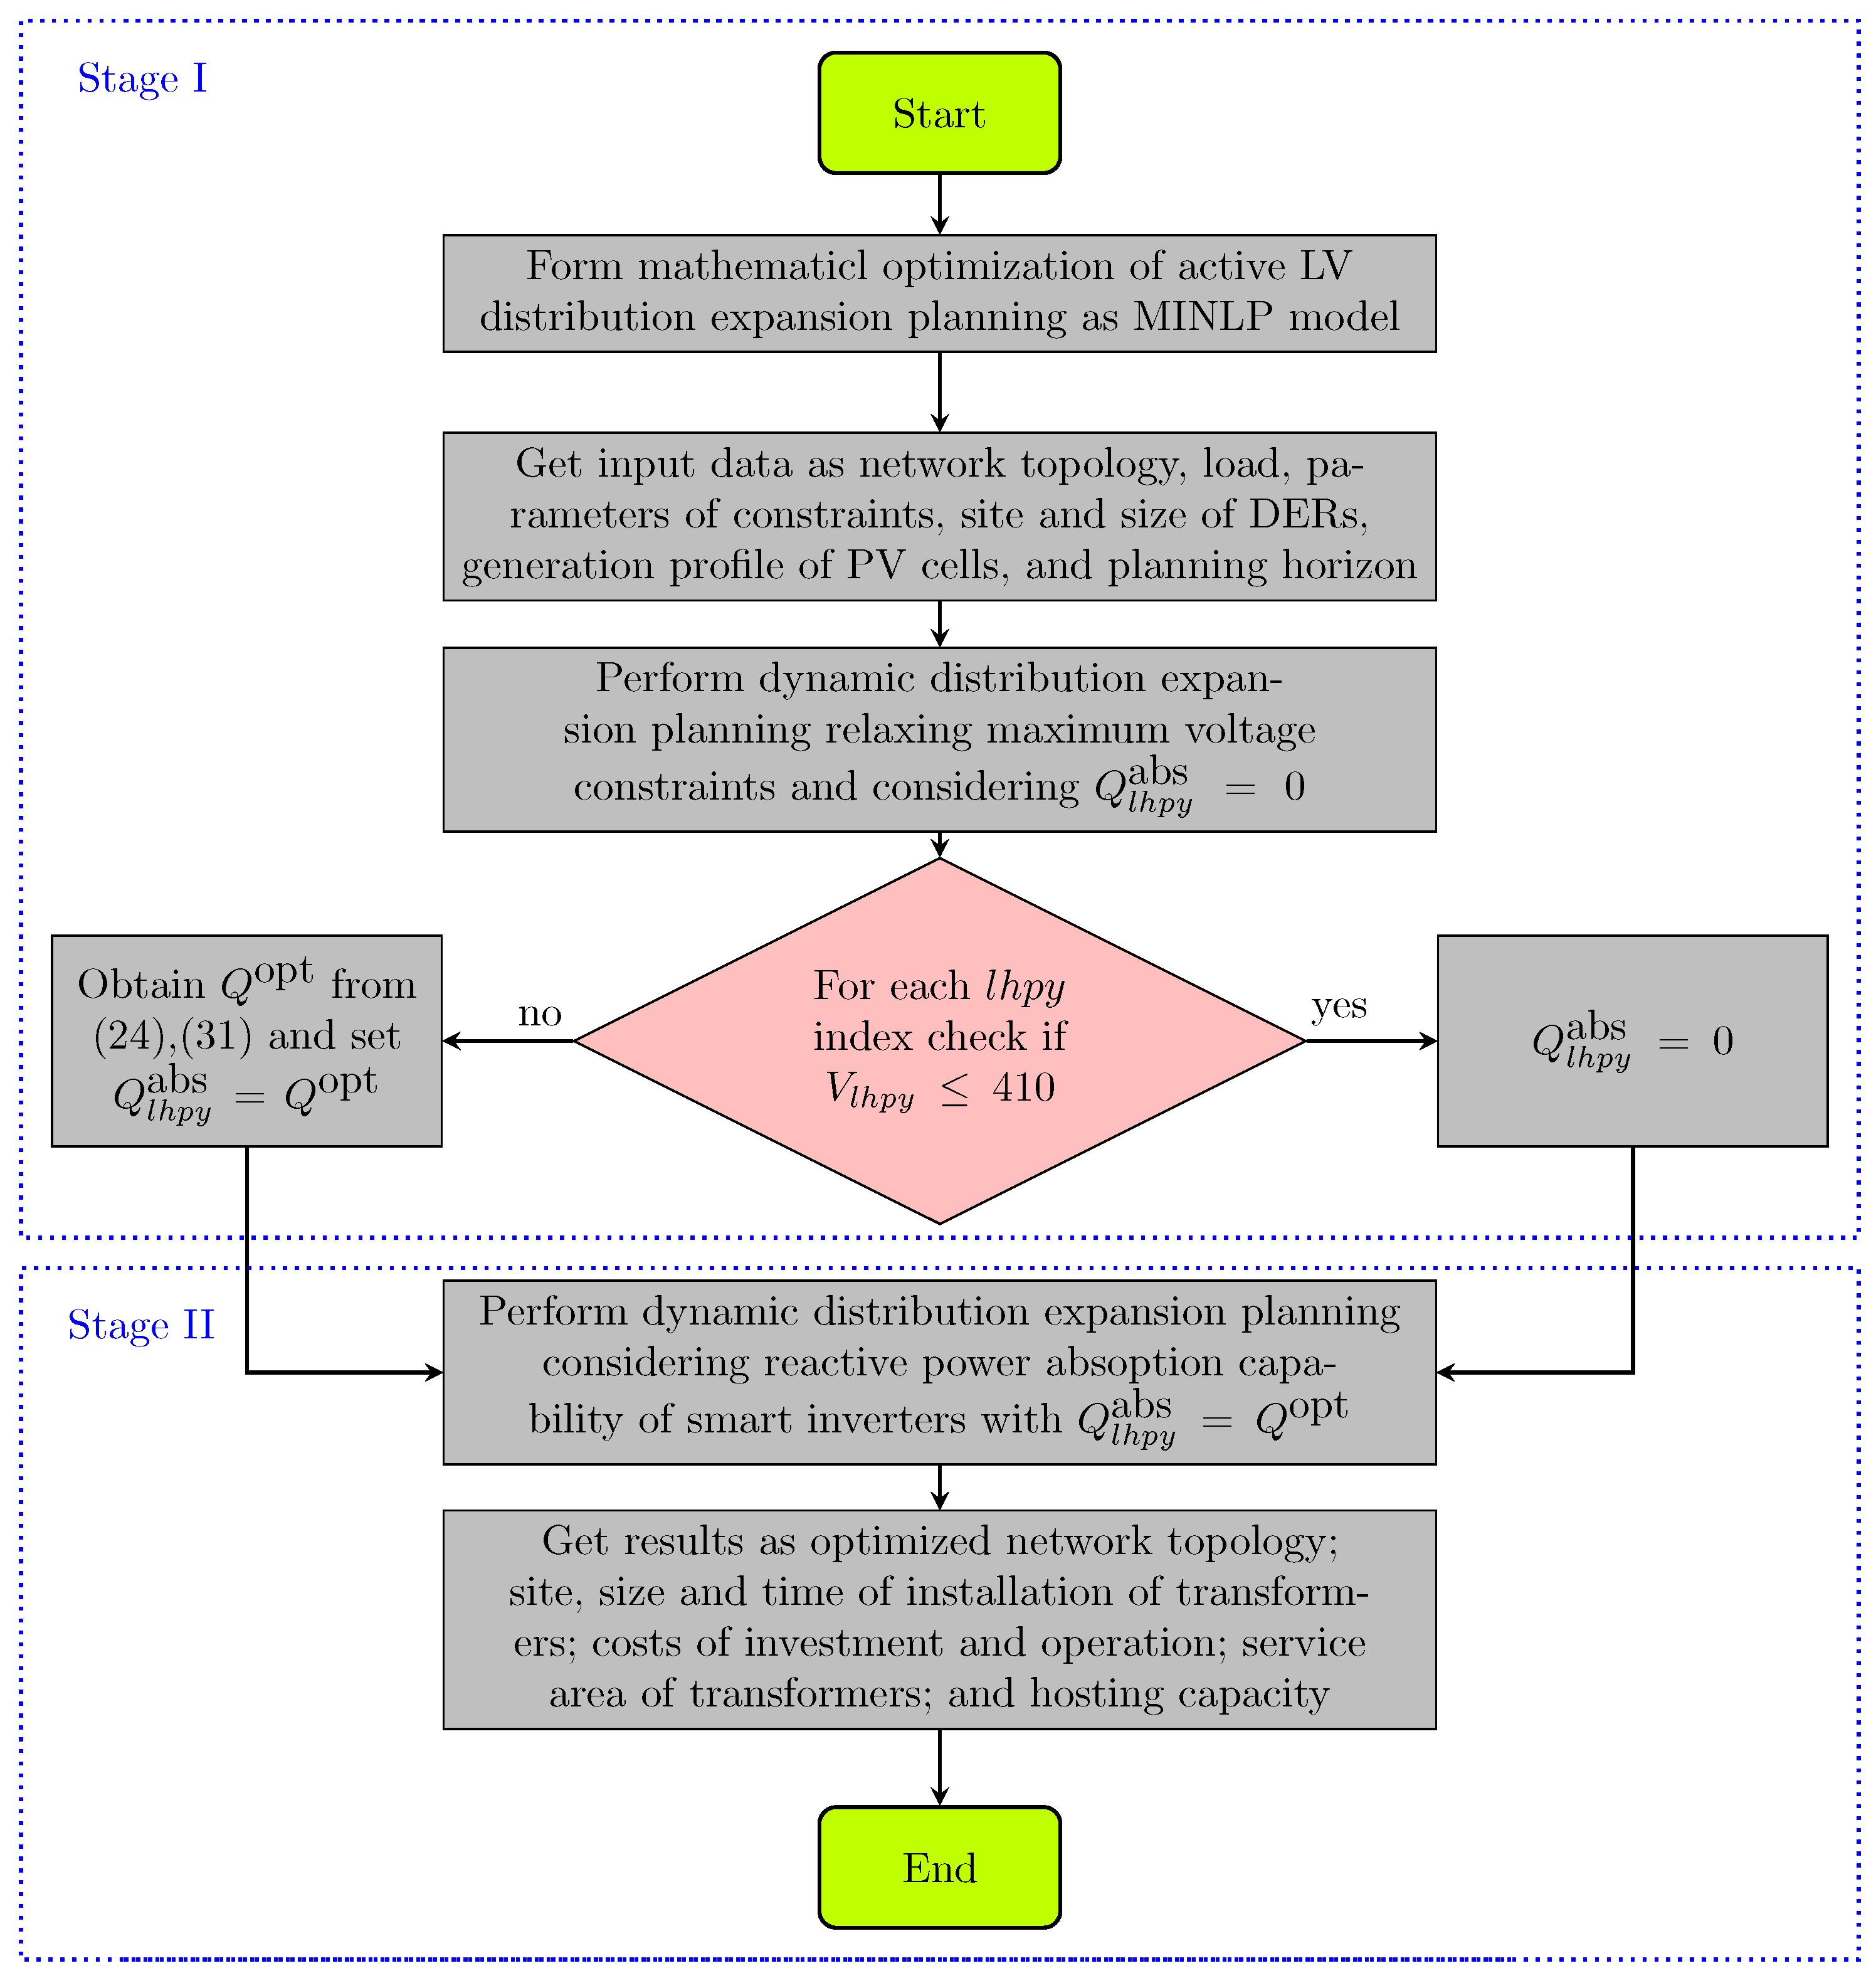
In Section 2, we presented a summary of conventional and modern approaches to mitigate technical issues regarding the integration of widespread penetration of small-scale PV resources. One of the main technical issues is the increase in the voltage of PCC points. In this paper, the concept of smart inverters capable of controlling reactive power is utilized to manage the voltage of PCC points and to increase the hosting capacity while taking care of the expansion-planning problem. As far as the voltage decreasing is directly related to the reactive power reducing of a PCC point, here, the term absorption is considered for the reactive power allocation of the smart inverters. To do this, a two-stage procedure is proposed to allocate reactive power absorption of the smart inverters over the planning horizon years, seasons, and hours, as follows. Figure 5 presents the flowchart of the proposed two-stage reactive power allocation.

3.2.1. Stage One ( Q a b s = 0 )

At this stage, the expansion-planning problem is optimized, and the voltage of the PCC points is obtained as (31). Then, the voltage values obtained for different PCC points are grouped into two categories above 410 and below 410 V. V t is considered to be 400 V.
V l h p y = t r t l y V t V t l h p y
The following assumptions are considered.
  • The minimum voltage level of the load points is considered to be 380 V, i.e., the maximum allowable voltage drop is considered to be 5% (20 V).
  • To analyze the impact of yearly penetration of PV units on the voltage level of the load points and the hosting capacity, no constraint is considered for the maximum voltage level of the load points.
  • In this stage, the smart inverter has no contribution to the control of the reactive power and the voltage level of the load points and is operated with a unity power factor.

3.2.2. Stage Two ( Q a b s = Q o p t )

At this stage, based on obtained voltage values for the PCC points, the optimal reactive power of the PCC points is calculated and applied to the smart inverters as input. Finally, by applying zero and non-zero reactive power values to the proposed model, the expansion planning is performed on the network and the optimal results are obtained. To obtain the optimal reactive power of the load points, the following assumptions are considered.
  • The maximum allowable voltage increase percentage on the PCC points is considered to be 3 % (12 V). Thus, the voltage of PCC points must not be greater than 412 V. However, due to some uncertainties in load or generation, the maximum voltage is considered to be 410 V.
  • For all the PCC points with a voltage higher than 410 V, the optimal reactive power is calculated using Equations (24) and (31), so that the voltage of these load points become less than 410 V for all hours, seasons and planning years. For the PCC points with a voltage level lower than 410 V, due to being less than the standard limits, the reactive power absorption is considered to be zero.
  • At this stage, to control the voltage level of the load points and enhance the hosting capacity, the smart inverter will absorb the reactive power (negative value) of the PCC point with a non-unity power factor. The reactive power absorption is directly related to the nominal capacity of the smart inverter and the needs of the network.

4. Simulations and Results

In this section, to study the proposed expansion-planning model, an LV distribution test system has been considered and simulations are performed using GAMS optimization software. Then, the obtained expansion-planning results are analyzed. The most challenging voltage scenarios are determined, and their corresponding results are illustrated. The proposed two-stage reactive power allocation is applied and explained in detail. Finally, the impact of uncertainty in load/generation on the voltage of the load points is studied.

4.1. Test System

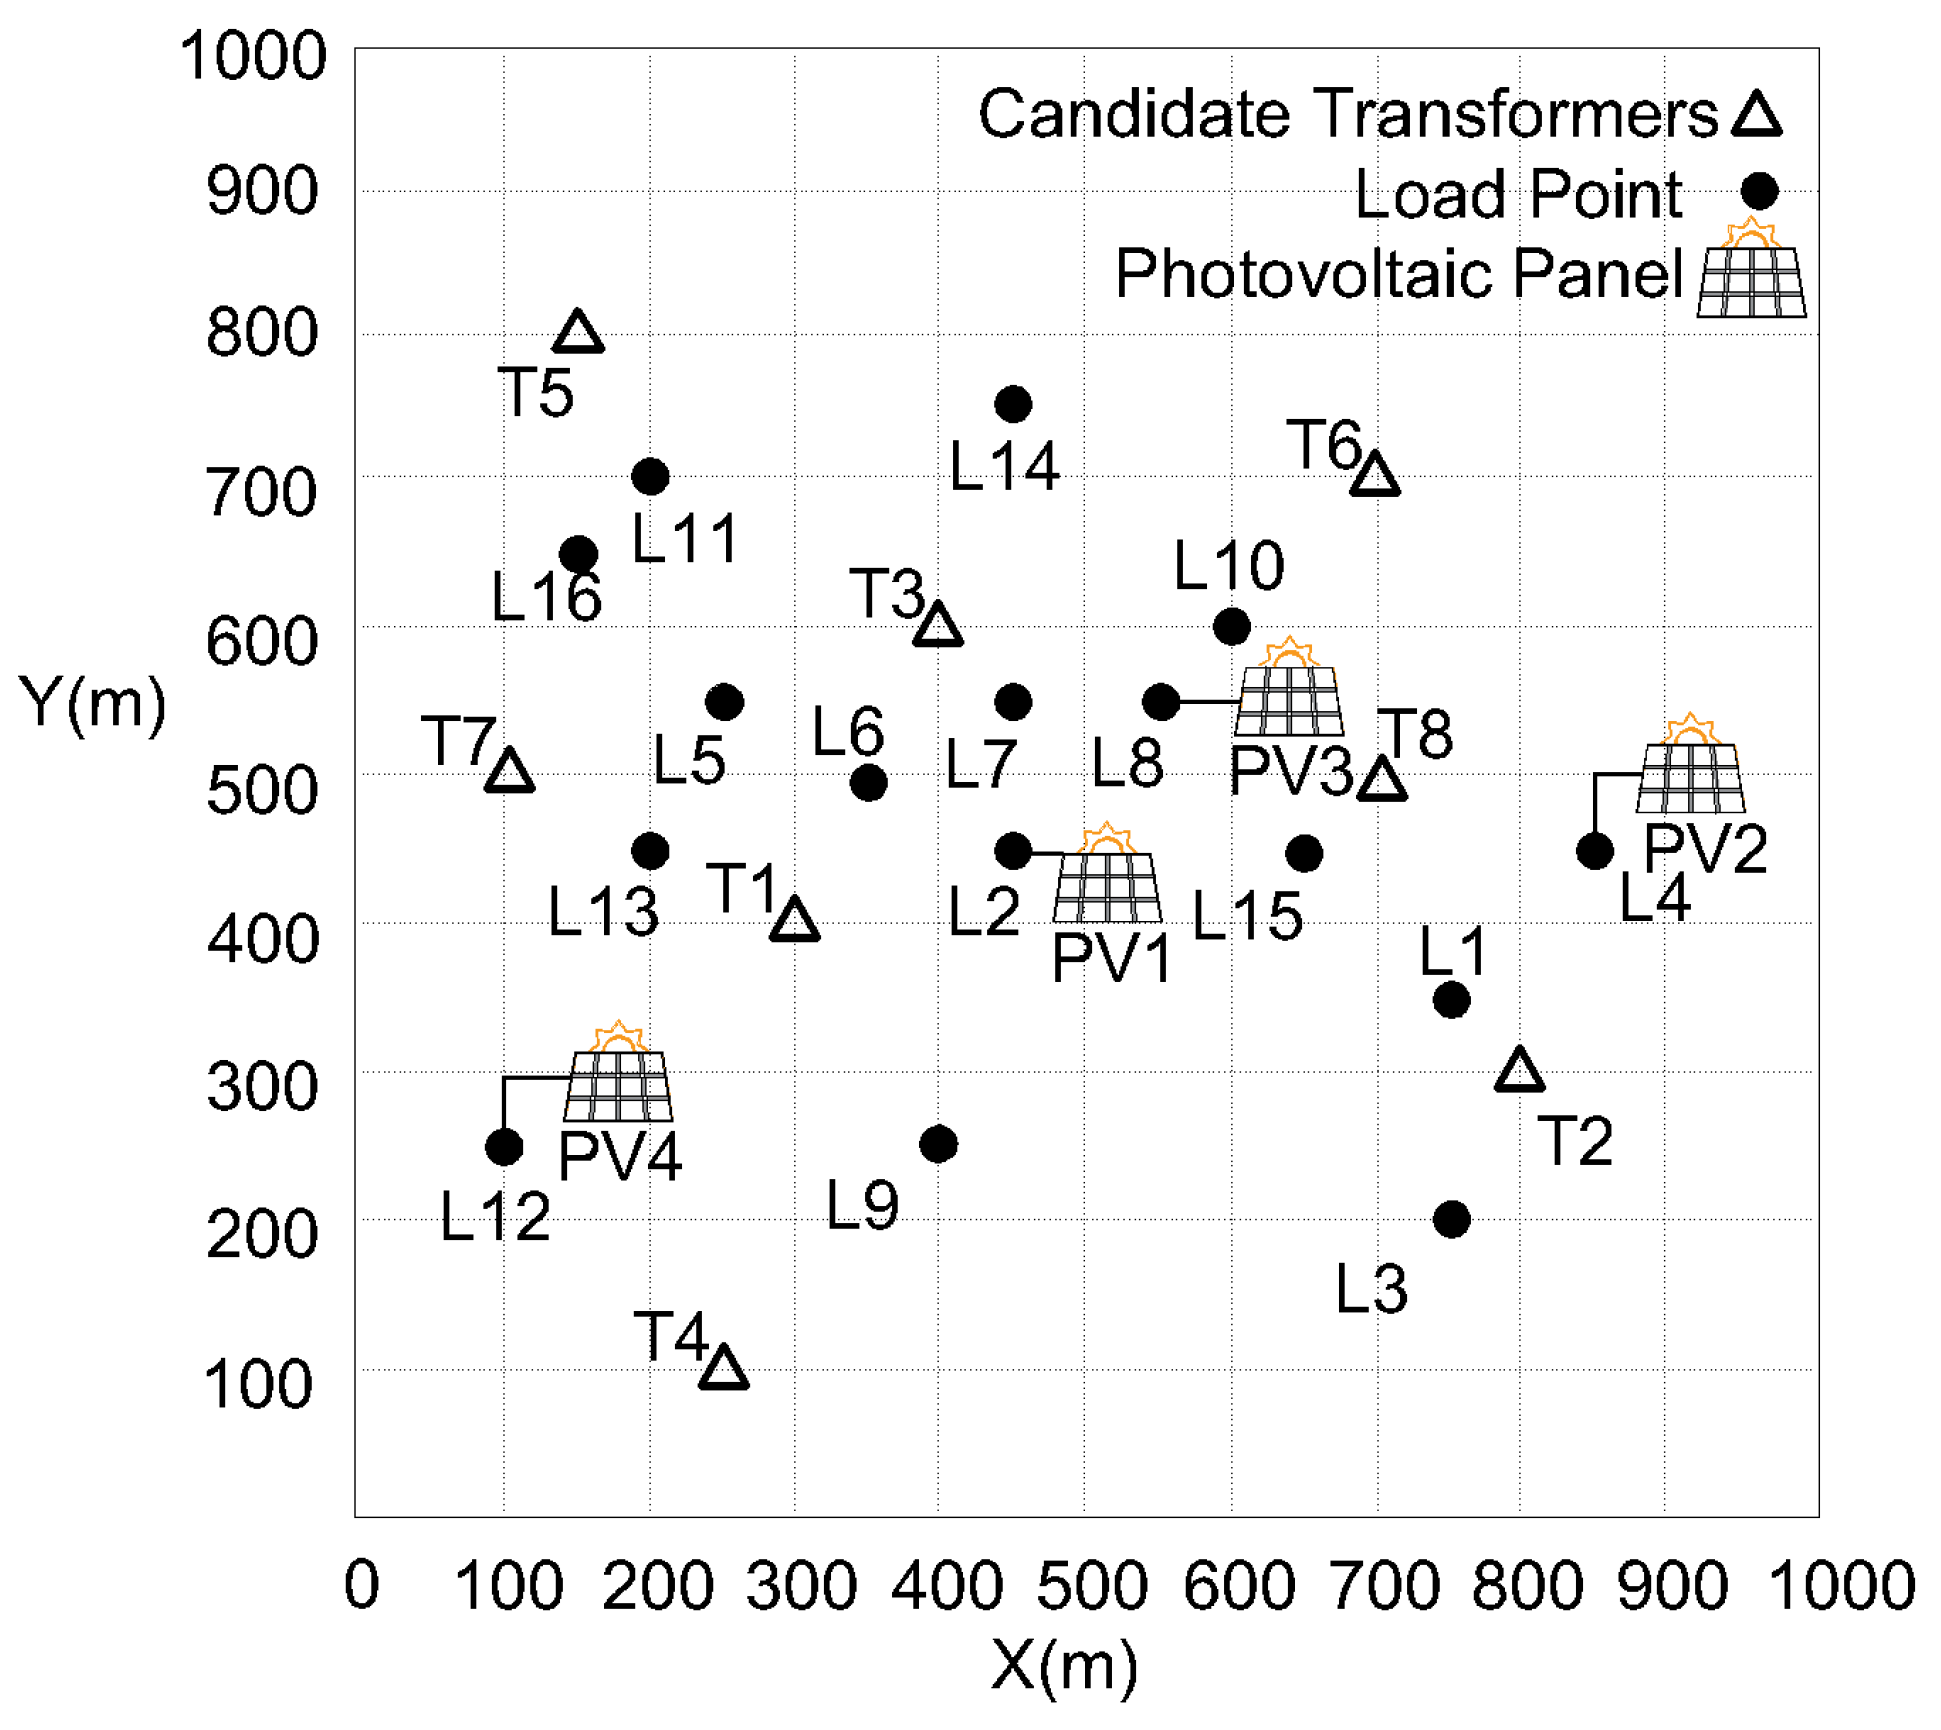
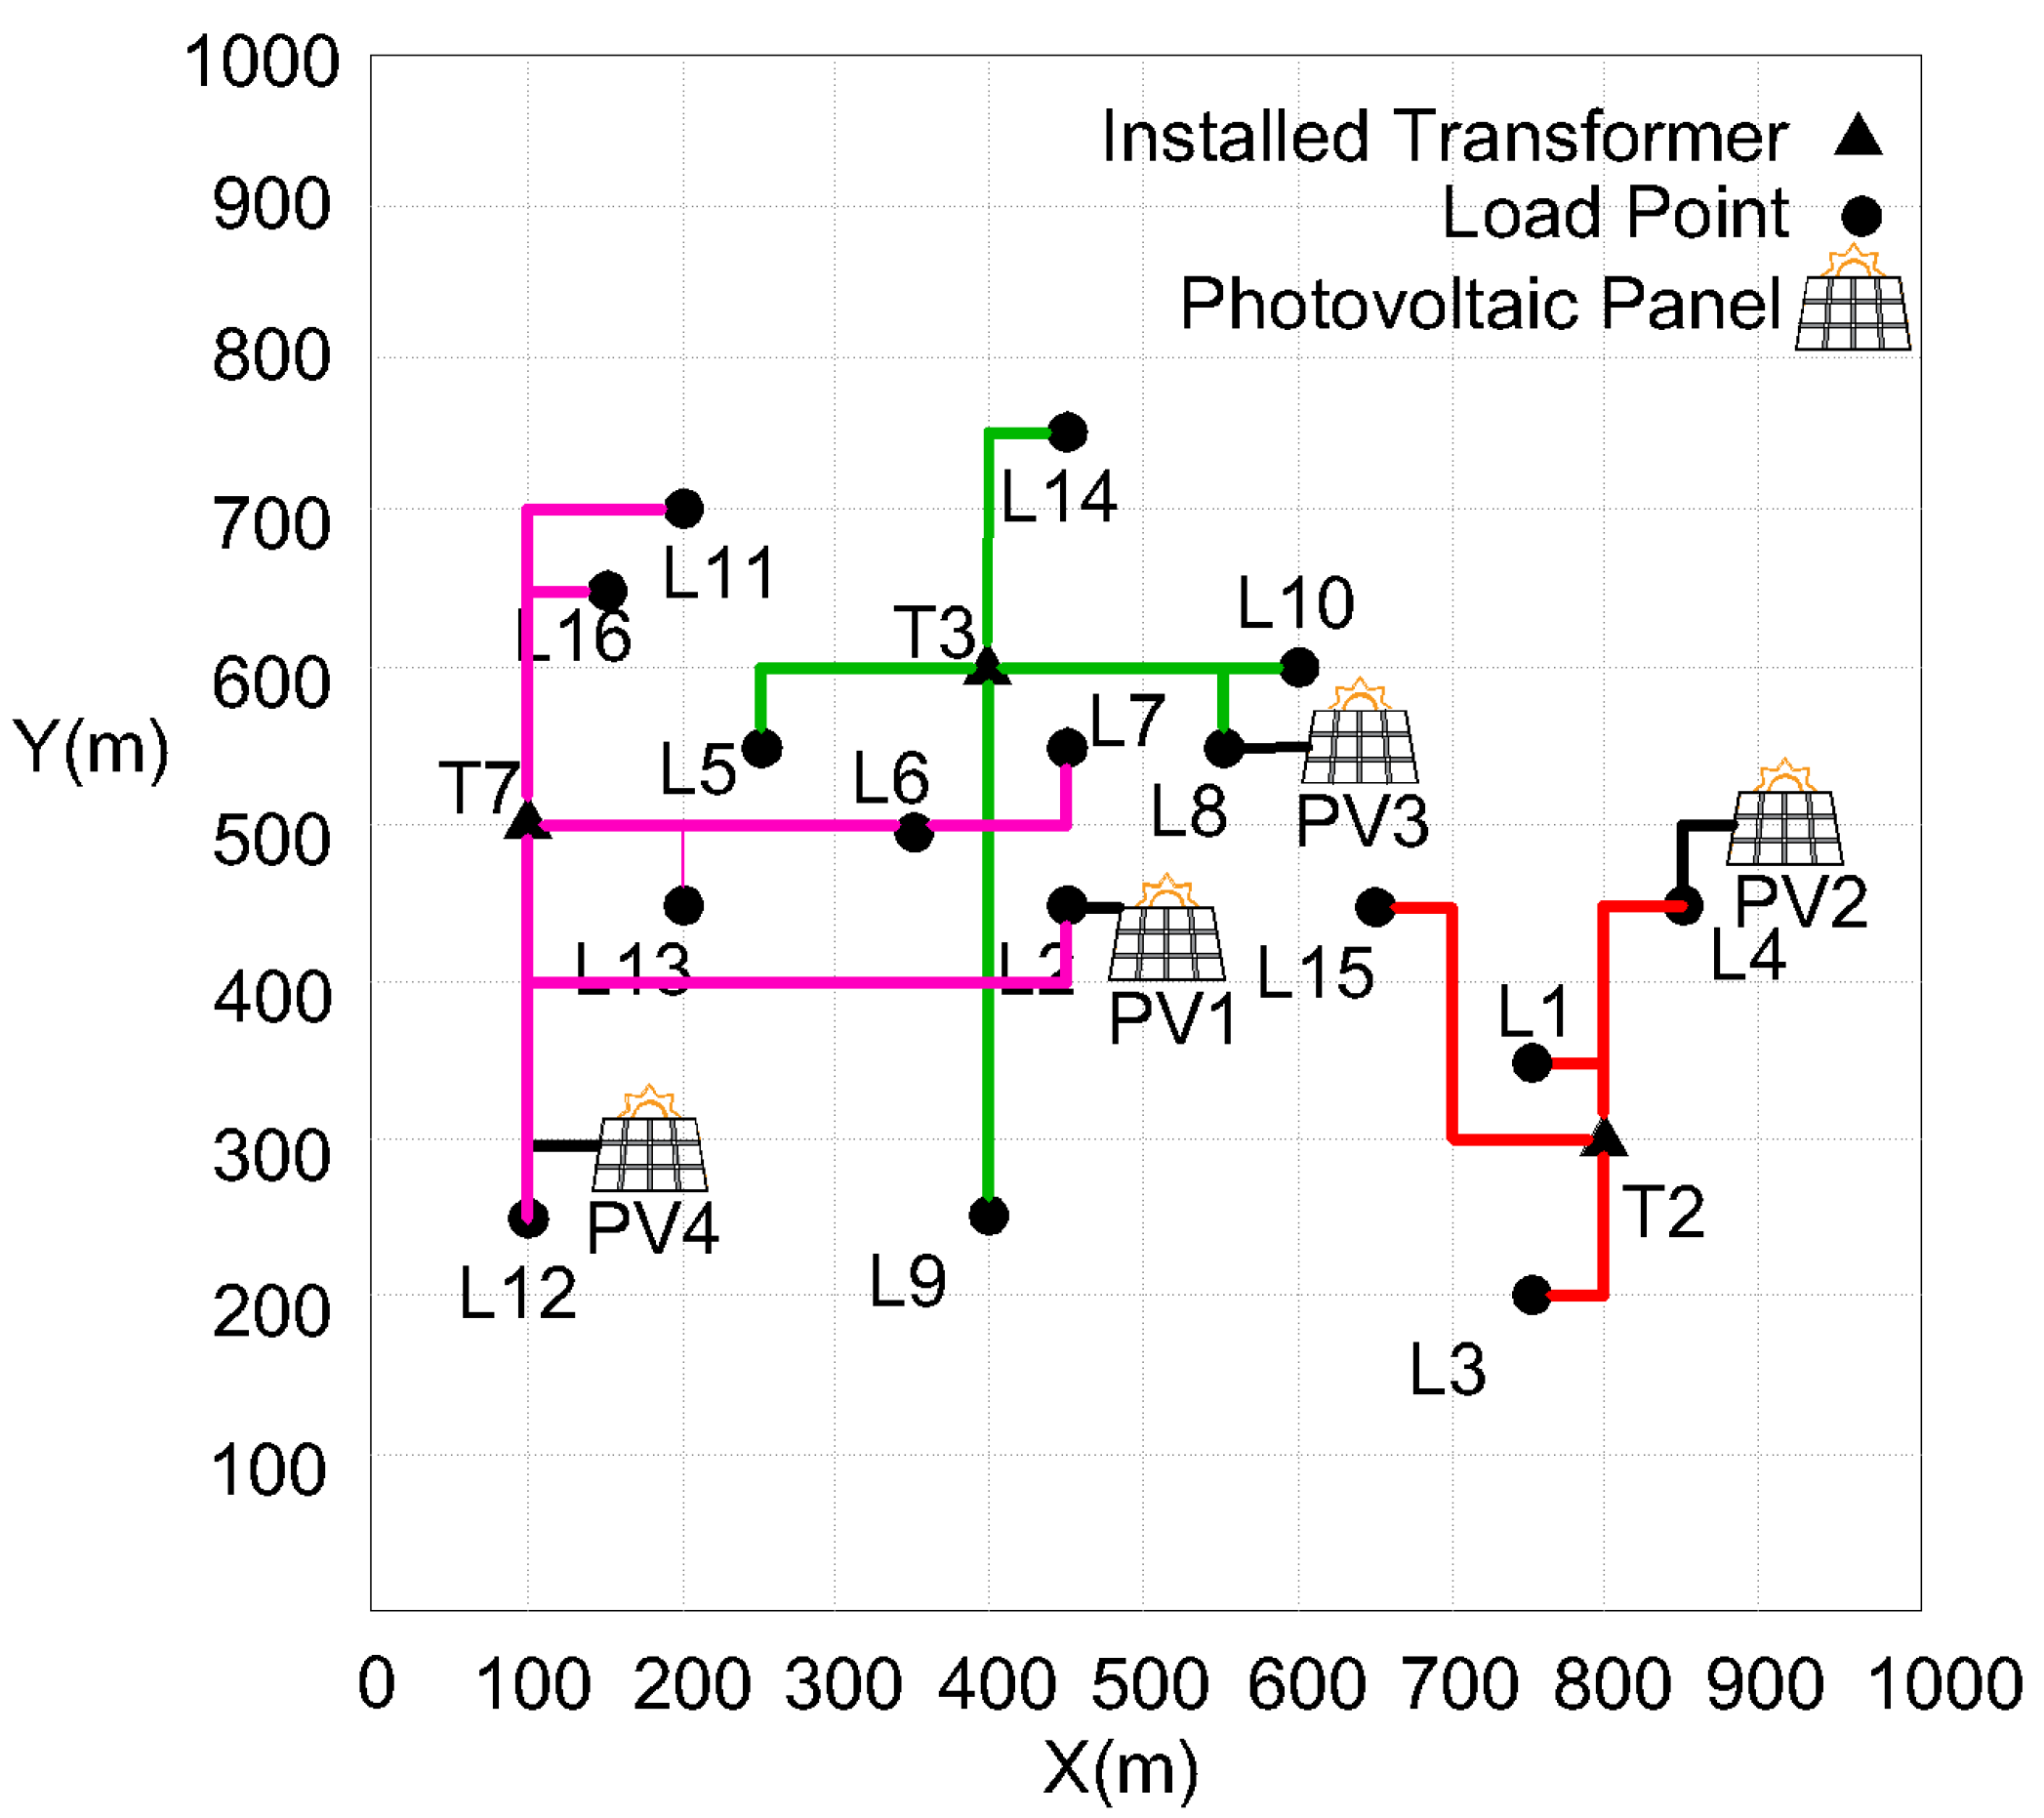
To study the proposed model, an LV distribution system with 16 load points has been considered, as illustrated in Figure 6. The planning horizon is five years. There are 16 load points assumed to be residential complexes. The load points have two peak and off-peak load levels where peak hours are from 8 p.m. to 12 a.m. as given in Table 2. The rate of yearly load growth is 2%. Eight candidate locations are considered for the distribution transformers. It is assumed that the PVs are installed by the customers. Load points 13 to 16 are new load points that are added to the network from Years 2 to 5, respectively. There are three transformer types, as shown in Table 3.
Four residential PV units have been installed on load points 2, 4, 8, and 12. Their installed capacities over the planning years are given in Table 4. Based on [35], four irradiation patterns corresponding to the four seasons are considered and their related output powers are illustrated as Figure 7. From this figure, it can be seen that the spring and summer seasons have better conditions considering the duration of irradiation and the maximum output power. Also, the maximum output power occurs in the spring at noon. These data were collected and classified for a sample PV unit of one MW installed in Tennessee, USA [35].
Other parameter values utilized in this paper, are given in Table 5.
Optimal results are obtained using GAMS 24.8.2 and ANTIGONE solver. The hardware system is a workstation with a 2.45 GHz AMD EPYC 7763 64-core processor and 16 GB of RAM under a 64-bit operating system. The simulation takes about 2 h. The characteristics of the optimization problem are given in Table 6.

4.2. Analysis on the Expansion Results

As presented in Section 3.2, in this paper, the reactive power allocation is integrated into the expansion-planning model. The results do not show much difference between the expansion results of the two stages. This is because expansion results are directly related to the peak load and the peak load occurs at night when the PVs are off. Figure 8 shows the expansion results for the second stage and Table 7 presents the yearly expansions of the transformers. Also, Table 8 gives the investment and operation costs over the planning years. Despite no changes in expansion results, the presence of PVs influences the operation costs, specifically the loss costs as presented in Table 9. Loss cost is obtained considering β as in Equation (9). β is directly proportional to the load factor, as presented in [36]. With the penetration of PVs, the load factor will be decreased and therefore the loss factor will be decreased, which will result in reduced losses specifically in the LV feeders. As presented in Table 10, by 14.7% share of PV generation, the loss cost of LV feeders is reduced by 28.3% in the last planning year. It can be noted that by reducing total energy purchase from the network and thus reducing the load of transformers, the penetration of renewable generation can also reduce losses significantly.

4.3. Analyzing the Most Challenging Voltage Scenarios

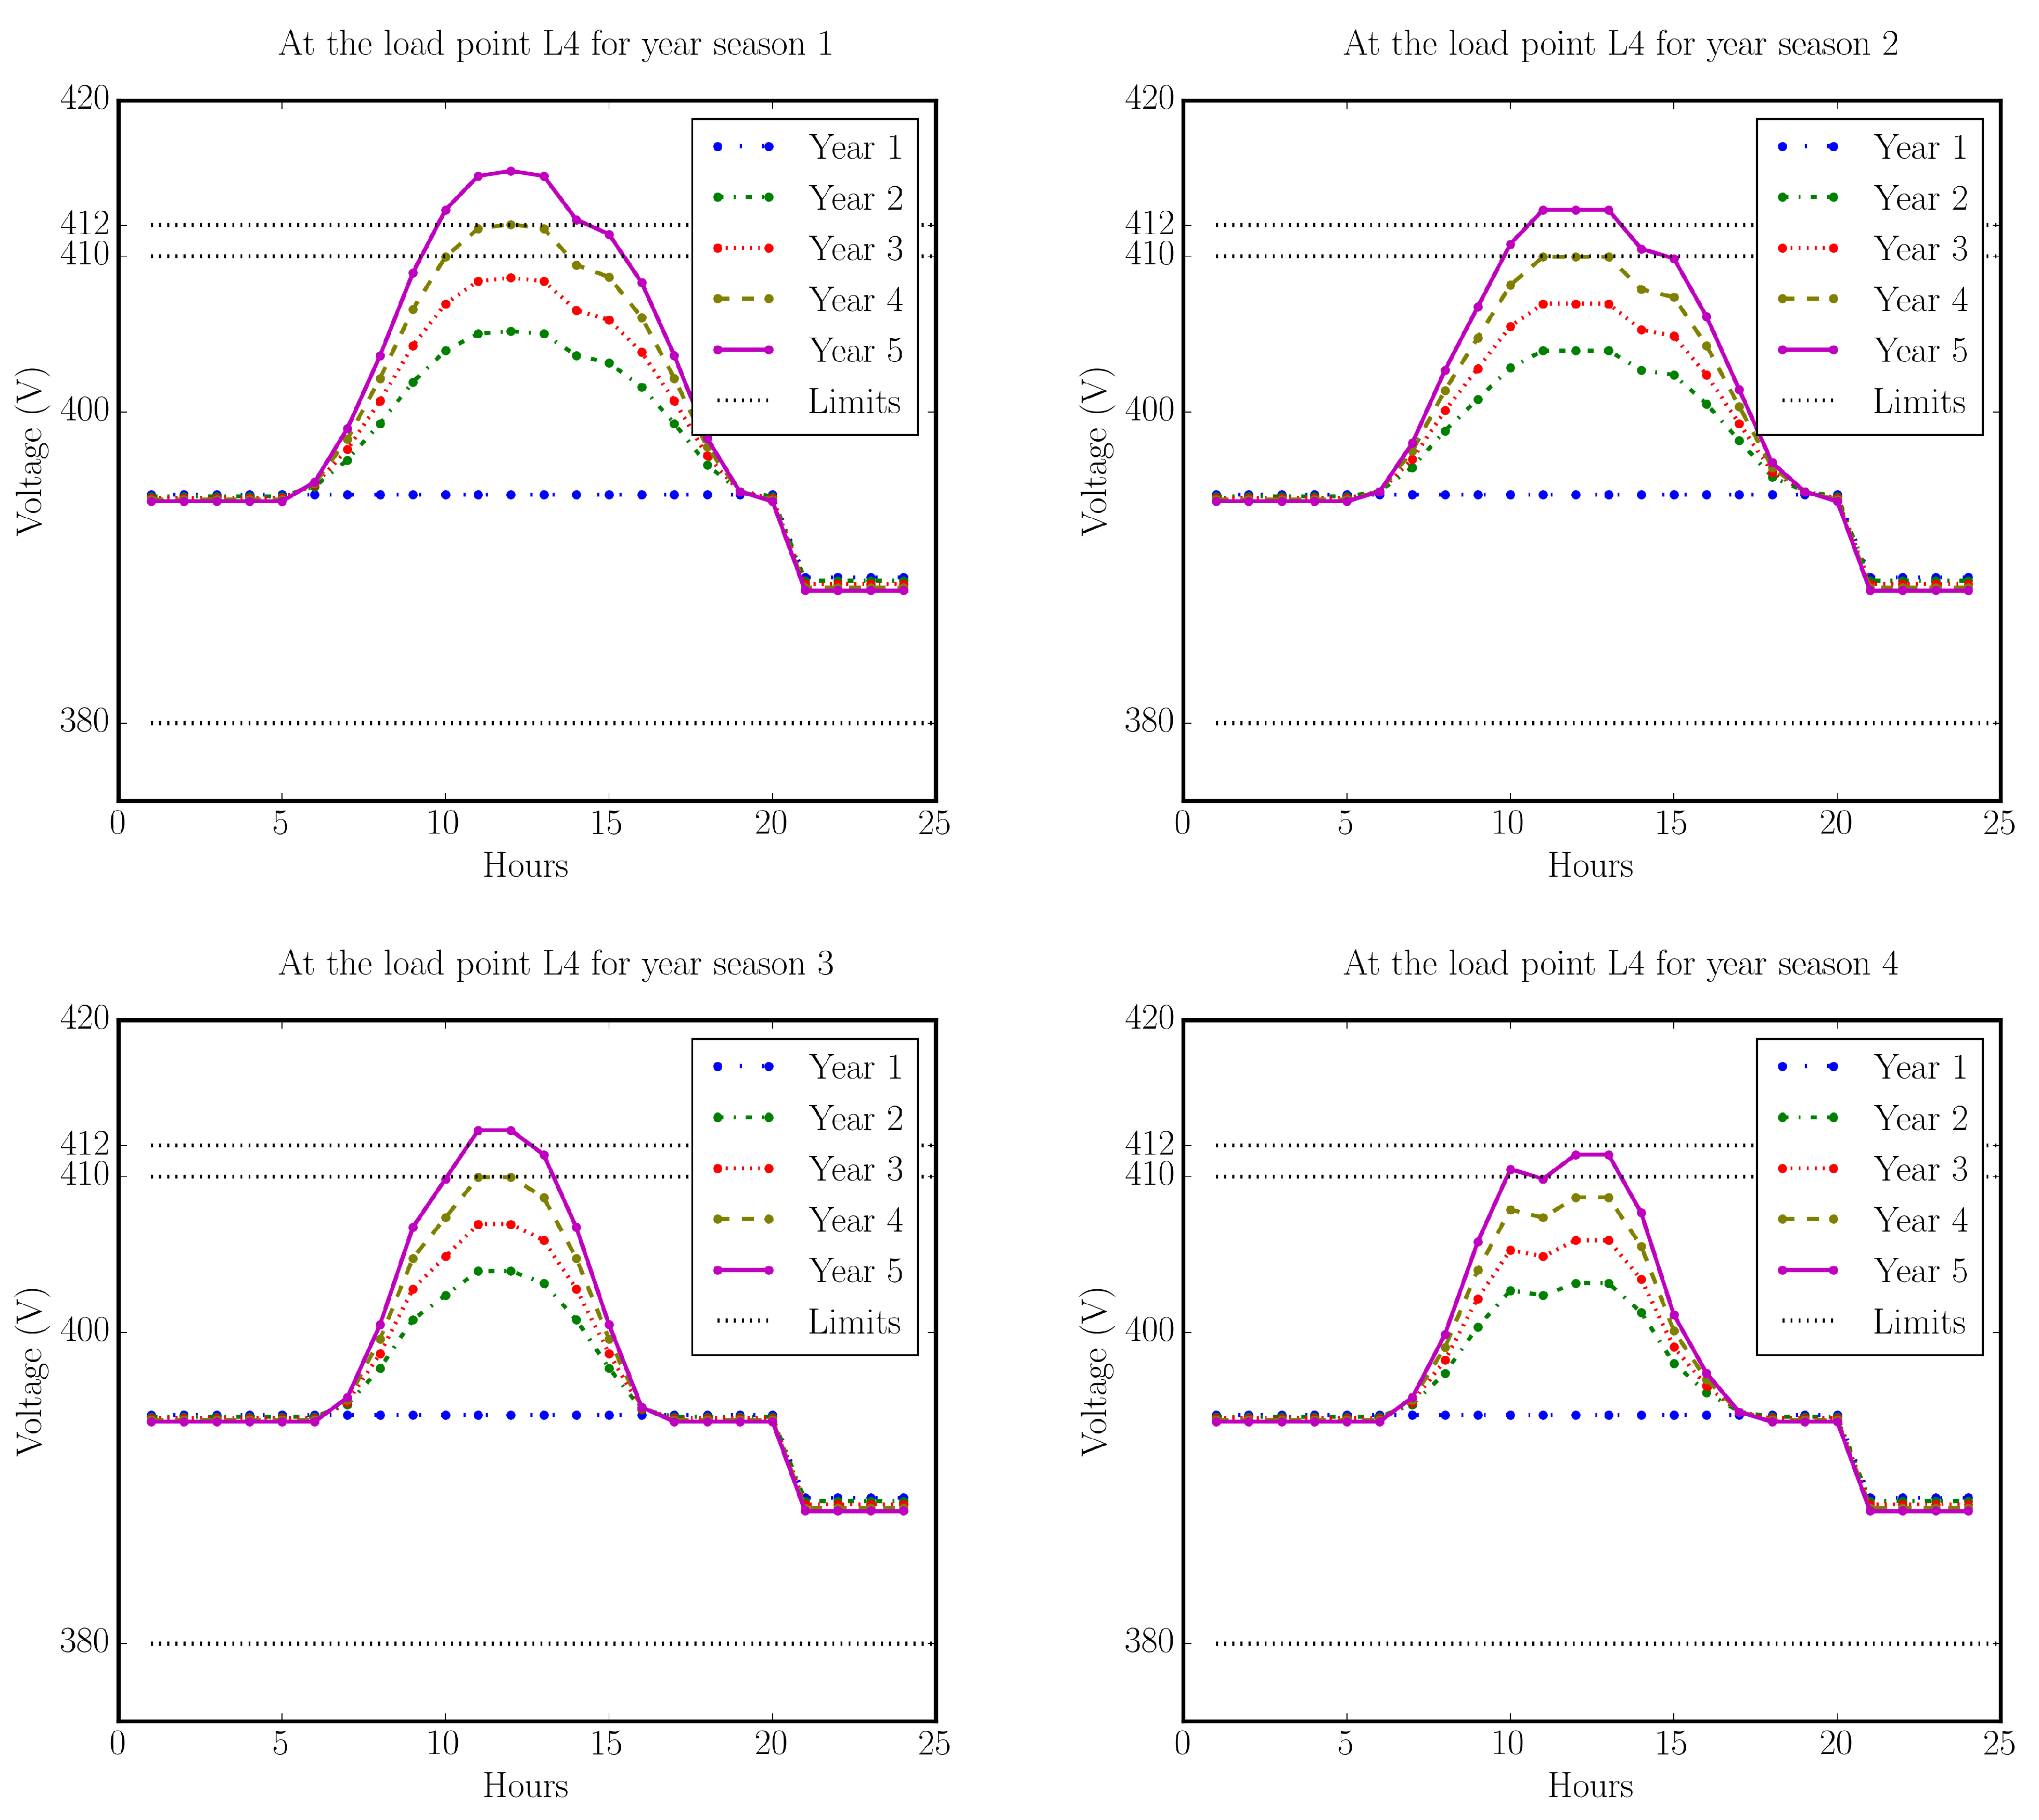
It is assumed that the load points without PV units have no technical issues related to the voltage profile and the voltage levels over the planning years, seasons and hours are between the allowed voltage levels of 380 and 410 V. Figure 9 shows voltage profiles over the planning years, seasons and hours for the load point L4, which has a PV unit and contributes to active power generation from Year 2 to Year 5. In Year 1, the voltage levels over the seasons are the same; over the off-peak hours the voltage levels remain constant at 395 V, and over the peak hours they reach 388 V. In this year, the voltage profile shows the same behavior as the load points without a PV unit and its voltage level remains between the allowable voltage levels.
Over Years 2 to 5, due to the active power generation by the PV unit (as shown in Figure 10), the voltage profiles will show different behaviors. It can be seen that at spring, the maximum allowable voltage level (410 V) is violated over Years 4 and 5. However, over the other seasons, just the voltage level of the fifth year is violated. This shows that according to Equation (24), the yearly increase in the active power generation of the PV unit results in an increase in the negative voltage variation, and this, according to Equation (31), will result in an increase in the voltage level of the load point L4, particularly over Hours 9 to 16.
Also, considering the measured solar irradiation collected in a sample location in the USA, and shown in Figure 7, it can be seen that the spring has the highest irradiation and therefore it has the most voltage violation among the seasons. Therefore, using the reactive power absorption capability of the smart inverters, and without a decrease in the active power generation, this issue related to the voltage violation can be relieved. This can result in hosting-capacity enhancement for the integration of new renewable energy resources, which will be detailed for the load point L12 in the spring season as follows.

4.4. Analysis on the Reactive Power Allocation with Smart-Inverter-Based PVs

In this subsection, the results for the procedure to allocate reactive power in the load point L12 are shown in the two stages as follows. L12 is equipped with a PV with a smart inverter.

4.4.1. Stage One ( Q a b s = 0 )

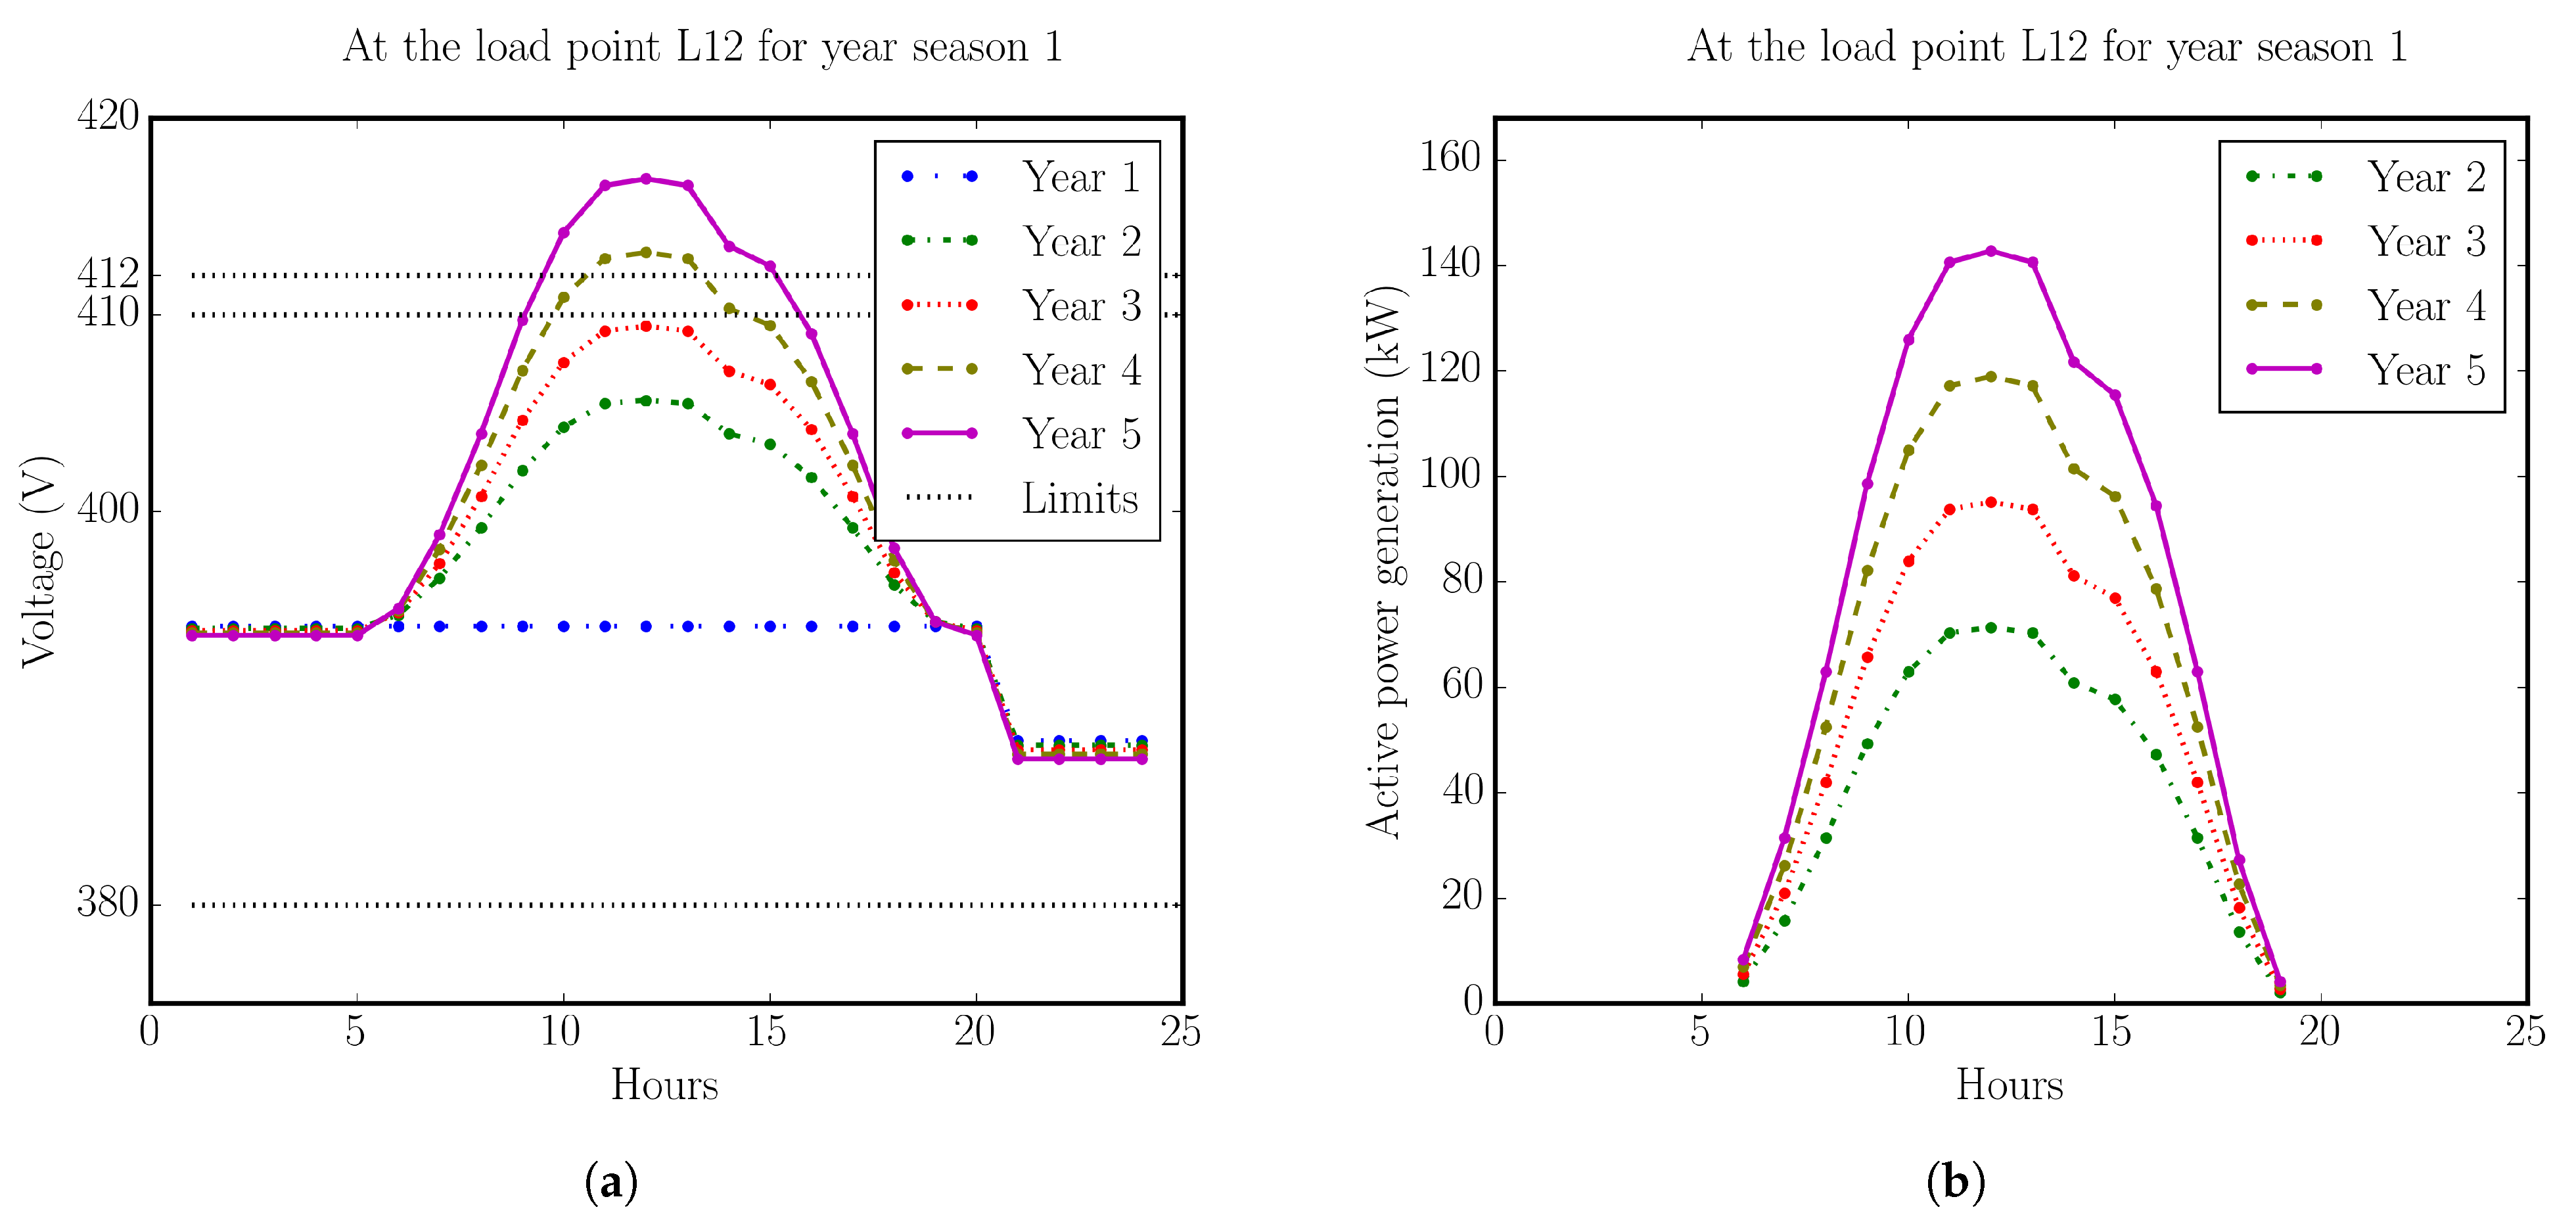
At this stage, the expansion-planning model is optimized without considering the reactive power allocation of the PV units. The decision variables of the planning problem are obtained under the conditions of applying the active power generation of the solar systems and the consumption load according to the five-year time horizon. Smart inverters will work with a unity power factor and will not have any control in absorbing the reactive power to improve the voltage. At this stage, by using Equations (24) and (31), the voltage of the load points and therefore the load points with a voltage value higher than the standard allowed range (410 V) are determined. Figure 11 shows the voltage profile and active power generation at the load point L12 for the spring season. In Year 1, the voltage level over the off-peak hours remains constant at 395 V, and over the peak hours, it reaches 388 V, which satisfies voltage limits. Over Years 2 to 5, due to the gradual increase in the active power, the voltage level across Hours 9 to 16 increases and so, as shown in the figure, the maximum allowable voltage level (410 V) is violated in Years 4 and 5. By optimally making use of the reactive power absorption capability of the smart inverter considering Equation (24), the voltage level can be brought to the allowable limit. This is shown in the following subsection.

4.4.2. Stage Two ( Q a b s = Q o p t )

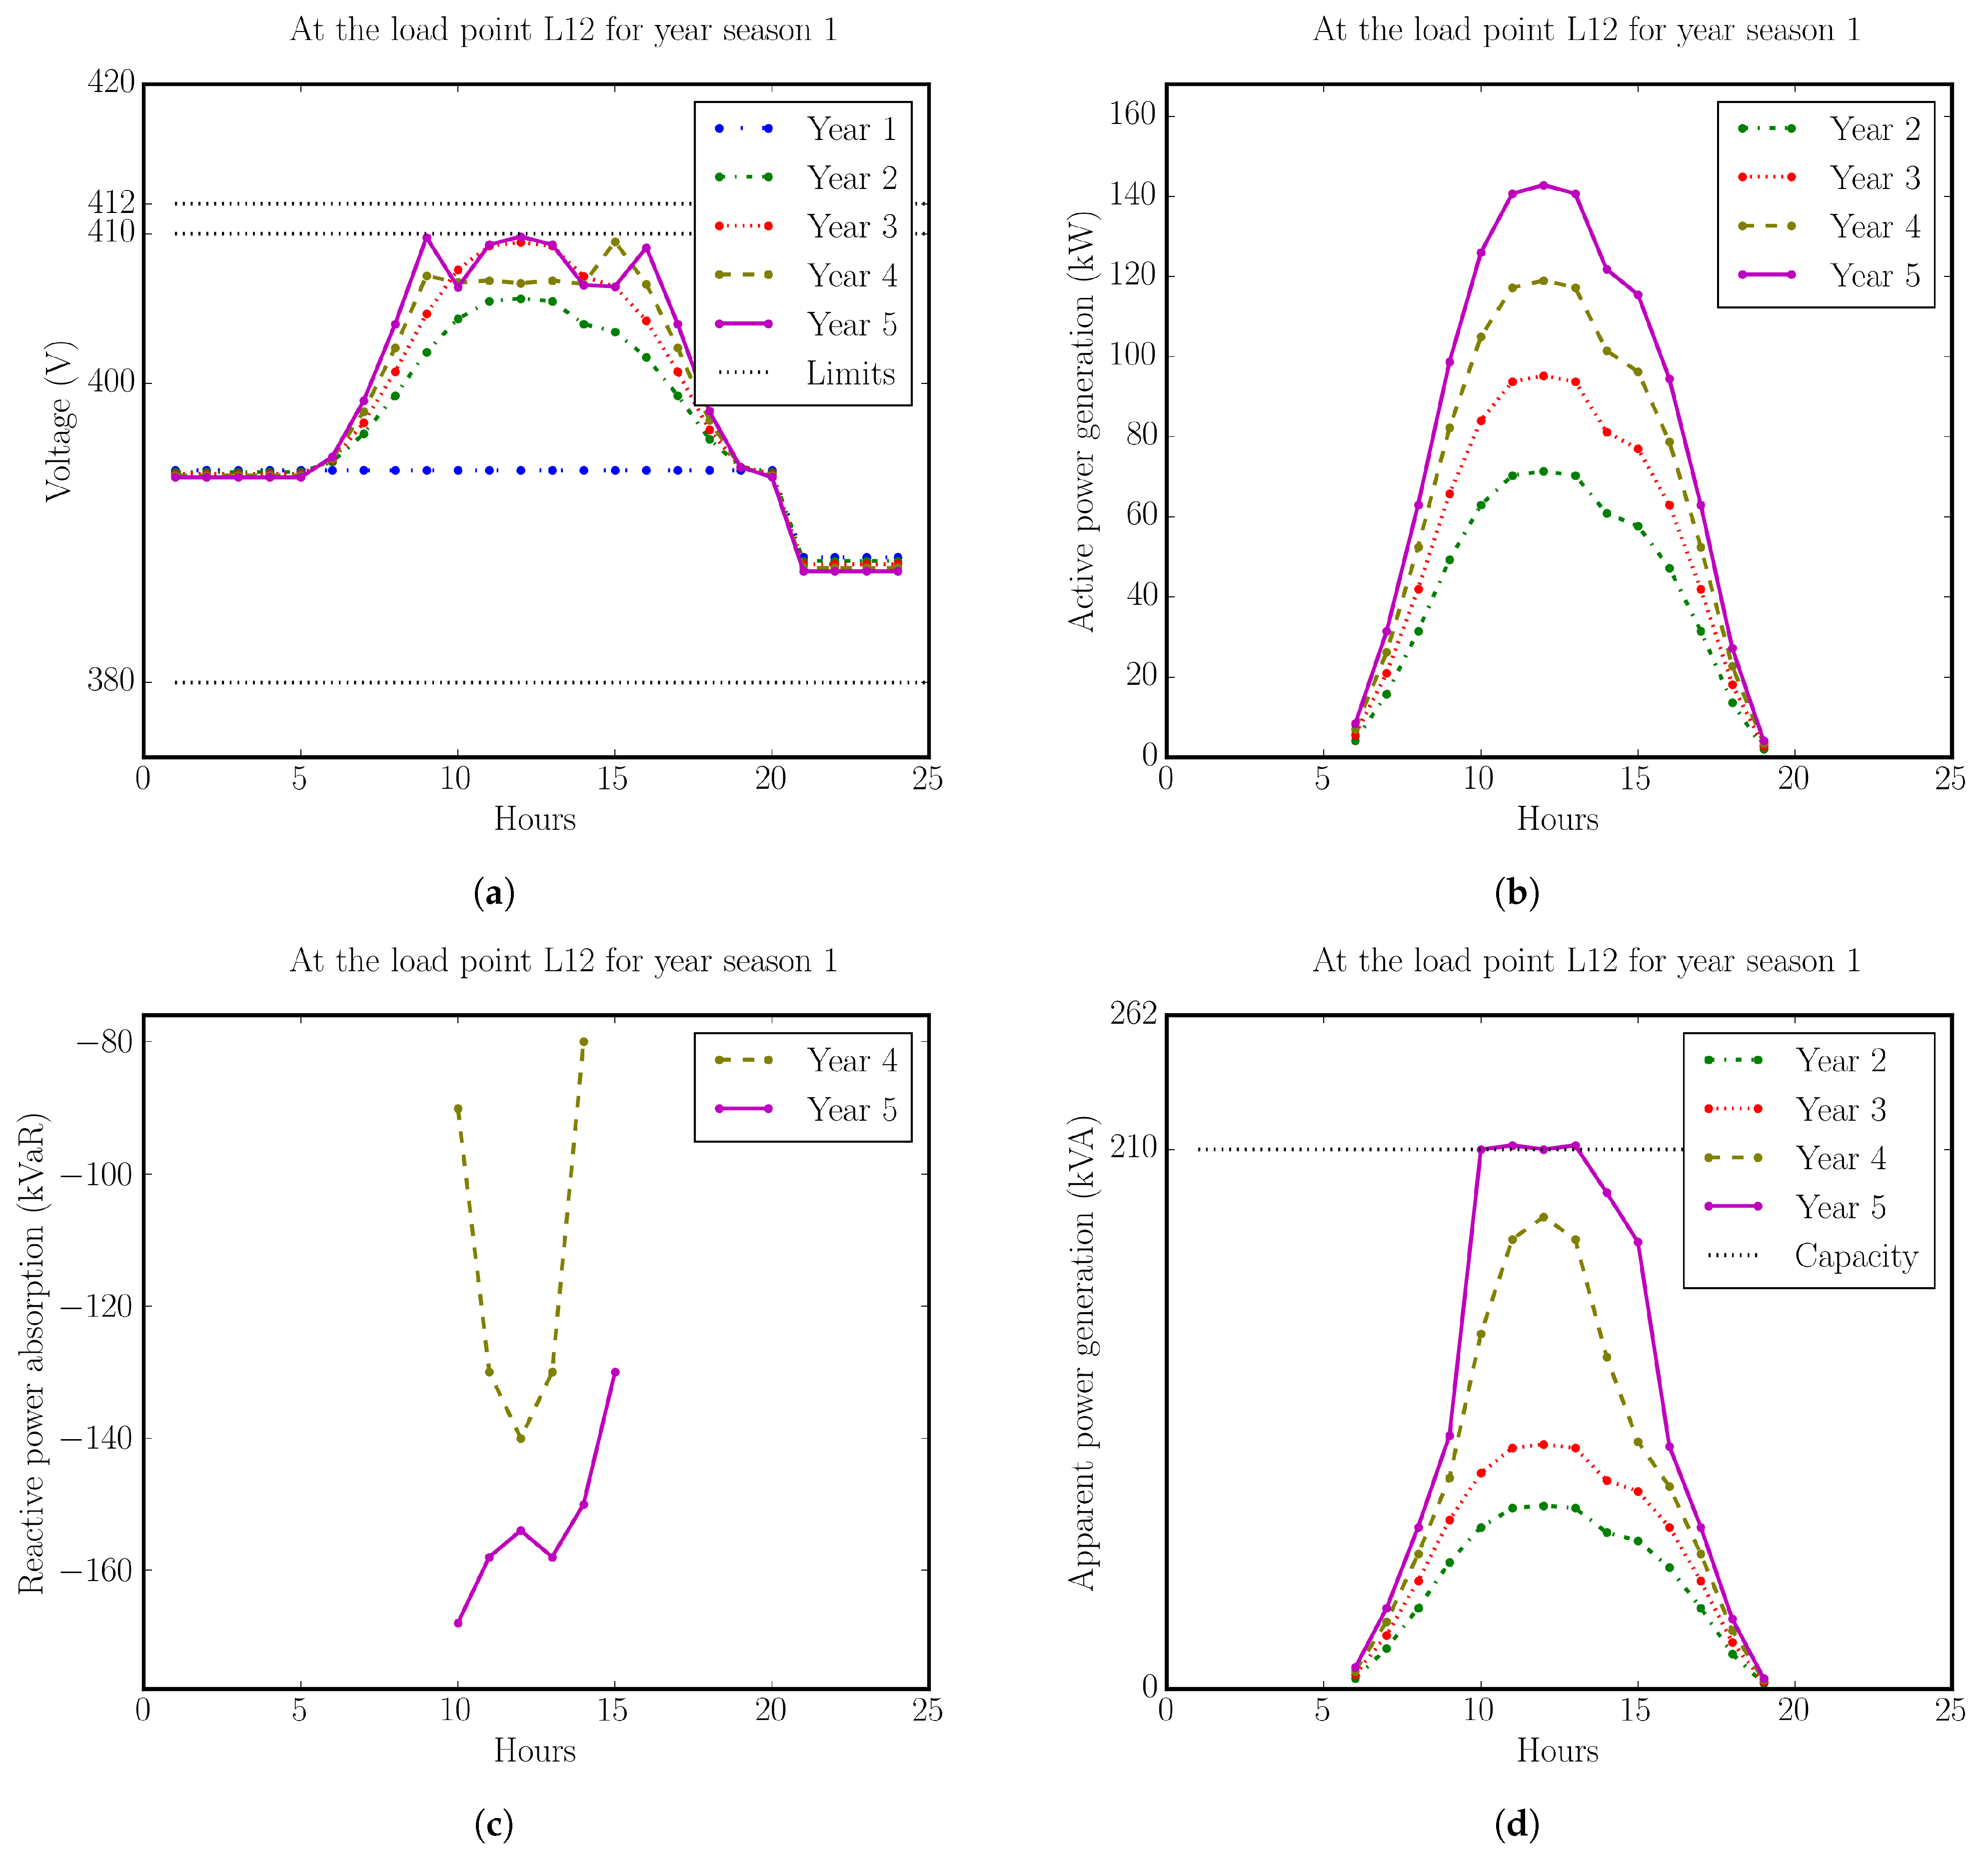
At this stage, the reactive power of the PV units, considering their voltage levels in the previous stage, is allocated. By using the results obtained from the first stage, placing Equation (24) in (31) and setting the value of 410 V (the maximum allowable standard voltage) only for the voltage value of the points out of the standard range, the optimal amount of reactive power for different hours, seasons, and years are determined. The optimal values obtained for reactive power are entered as input (similar to active power) to the planning problem and the problem is re-optimized in the second stage and the decision variables are obtained under the above conditions. In fact, with the above planning, the optimal working point of the smart inverters is determined for the voltage control and applied to the smart inverters locally or remotely. Figure 12 shows the operational measures of the load point L12 after allocating the reactive power.
In Year 1, due to the absence of active power generation, the voltage levels remain in between the allowable limits as in the voltage profile of the load point L4.
In Years 2 and 3, due to the lower active power generation, the voltage level and the inverter’s operational apparent power are in the acceptable ranges. Therefore, no voltage control is required in these years. However, in Years 4 and 5, due to the increased active power generation (Figure 12b), and violation of the voltage levels (Figure 11a), by absorbing reactive power in the critical hours (Figure 12c), the voltage levels are managed and brought to the acceptable ranges (Figure 12a).
The interesting point in Figure 12c is that the reactive power absorption patterns in Years 4 and 5 are different. This is because in Year 4, by increase in the active power generation in the positive direction and increase in the reactive power absorption in the negative direction, the operational apparent power of the inverter increases and remains below the rated apparent power of the inverter, which is 210 kVA. However, in Year 5, due to the remarkable increase in the active power generation with respect to Year 4 (Figure 12b) and the limitation in the rated apparent power of the inverter, the smart inverter has given priority to the active power generation and has decreased the reactive power absorption. From Hours 10 to 12, despite the increase in the irradiation, the active power generation, and the voltage level, the smart inverter decreases the reactive power absorption (due to the limitation in the rated apparent power of the inverter) from 168 to 154 kVaR and keeps the voltage level in the allowable ranges. Then, from Hours 12 to 13, due to the relative decrease in the irradiation, the active power generation, and the voltage level, the capacity of the inverter is relieved, and the smart inverter increases the reactive power absorption from 154 to 158 kVaR. Finally, from Hours 13 to 15, due to the decrease in the irradiation, the active power generation, and the voltage level, the need for voltage control is reduced and therefore, the reactive power absorption is decreased from 158 to 130 kVaR. It should also be noted that over the hours beyond 10 to 15, due to no need to control voltage, the smart inverter does not absorb reactive power and its value equals zero.
Finally, the analysis of the results of the reactive power allocation in the load point L12 (as presented in Figure 12) shows that we are capable of:
  • Reducing the voltage level at Hour 12 of Year 4 from 413 V (Figure 11a) at Stage 1 ( Q a b s = 0 ) to 406 V (Figure 12a) at Stage 2 ( Q a b s = Q o p t ).
  • Increasing the hosting capacity of the network at Hour 12 of Year 4 from 95 kW (Figure 11b) at the stage one ( Q a b s = 0 ) to 119 kW (Figure 12b) at Stage 2 ( Q a b s = Q o p t ).
  • Reducing the voltage level at Hour 12 of Year 5 from 417 V (Figure 11a) at Stage 1 ( Q a b s = 0 ) to 409 V (Figure 12a) at Stage 2 ( Q a b s = Q o p t ).
  • Increasing the hosting capacity of the network at Hour 12 of Year 4 from 95 kW (Figure 11b) at Stage 1 to 142 kW (Figure 12b) at Stage 2 (increased by 49.5%).
Overall, the results of this subsection imply that we can increase the hosting capacity of the network by optimal reactive power allocation of the smart inverters.

4.5. Analysis of the Impact of Load/Generation Uncertainty on the Voltage

Uncertainty in the accurate prediction of irradiation and load values can bring about technical challenges in planning studies, particularly for the development of active LV distribution networks. One of the most important cases of these challenges is the increase in the voltage of the PCC points caused by an increase in the irradiation (generation) or decrease in the load, whose mathematical relationships are expressed in (24), (25), and (31). According to [23], the maximum allowable voltage increase is considered to be 3% in the load points. In other words, 412 V is determined, but due to the uncertainty in the load or the irradiation values, planning is made based on the maximum voltage level of 410 V. In this paper, in the worst conditions, the maximum voltage according to Figure 11 is related to Bus 12, which was equal to 409.8 V in the spring of the fifth year of the planning horizon at 12 o’clock under the condition of absorbing reactive power of −154 kVaR by the smart inverter. To ensure that the voltage does not violate the standard permissible range (412 V), the voltage sensitivity of the load points to the changes in irradiation and load at the load location of L12 has been determined according to Table 11. From the table, it can be observed that despite the increase in the irradiation or decrease in the load by 10% (applying changes in two steps of 5% each), the voltage of the load points has changed very slightly. In other words, in terms of uncertainty, the standard voltage of the load points, i.e., 412, is not violated. This implies that the uncertainty in the load/generation of the network has a negligible impact on the voltage level of the load points.

5. Discussion

Some of the limitations, challenges, and prospects of this research can be summarized as follow.
  • One of the challenges facing electricity distribution companies is what incentive policies should be implemented to encourage building owners to use smart inverters to provide additional services such as voltage control because smart inverters are more expensive than regular inverters and they have a shorter life cycle and higher losses. To solve this problem, one can seek help from discount policies in the electricity tariff delivered to customers [37]. It is also necessary to change or update the network connection requirements or the grid codes that can force building owners to provide additional services and voltage control.
  • It should be noted that it is not necessary for the local electricity distribution company, as the network planner, to use smart inverters in all the load points. Case-specific studies can find the required capacity and number of smart inverters according to the penetration level of renewable energies. Overall, the optimal use of smart inverters will have more technical and economic justification.
  • As stated in IEEE 1547 [38], by integration of smart inverters in the Active Distribution Networks, some compatibility issues are solved, such as improving the immunity of DERs to grid disturbances; and some new incompatibilities are raised such as generation of harmonics. Therefore, a trade-off study is required to justify the use of smart inverters. In our opinion, the benefits of smart inverters will outweigh the costs of their integration.
  • According to [1], to manage the voltage of the load points outside the standard permissible range caused by the widespread penetration of small-scale solar resources, it is possible to use both capabilities of the smart inverter, including the reduction of active power, if there are limitations in the capacity of the inverter and the control (absorption or injection) of reactive power. The use of energy storage devices can also greatly help to control the voltage and increase the hosting capacity of the network. Also, strengthening the conductors of the distribution network can control the voltage and increase the hosting capacity of the network for the presence of more renewable resources.
  • One drawback of the proposed model is the time of the optimization, which, for this study (on an LV network with 16 nodes), is about two hours. By increasing the size of the network, the simulation time will be increased. This shows the requirements for computers with high CPU and RAM.
  • It is assumed that the smart inverters are provided by the customers and their costs are neglected in the model. A new model can be developed to incorporate the operational decision variables of the smart inverters and therefore, their costs in the optimization model.
  • The major drawback of the increased penetration of DERs is their intermittent behavior, which imposes severe threats on the power system. Some of the effects are the diversity of the output power and the variation in the power produced by DERs. It should be noted that the integration of the smart inverter in the dynamic expansion planning of the distribution network alone cannot solve the problems caused by the increased penetration of renewable resources, and to improve the stability of the network, it is necessary to use smart inverters along with storage devices. This issue can be considered to be a study for the future, which can solve issues pertaining to power quality, hosting capacity, and network stability.
  • As mentioned earlier, there are lots of smart technologies that need to be considered in the expansion-planning models of LV networks. In this study, the capability of the smart inverters, as a new technology, in the reactive power allocation is considered, which results in the change in the voltage of the load points and therefore hosting-capacity enhancement.
  • This work can be further developed considering other types of distributed energy resources and the other strategies to enhance the hosting capacity.
  • Also, other control schemes of the smart inverters for the active and reactive power-modulation capabilities can be considered in the proposed model.

6. Conclusions

In modern distribution networks, hosting capacity is limited by the emergence of technical challenges related to the integration of distributed energy resources. One of the technical issues is voltage violation. There are different strategies to mitigate voltage problems. Using the reactive power absorption capability of the smart inverters, and without decreasing the active power generation, the issue related to voltage violation can be relieved. This can result in hosting-capacity enhancement for the integration of new renewable energy resources. In this paper, we proposed an MINLP-based active distribution expansion-planning model considering PV cells equipped with smart inverters to enhance the hosting capacity of the network. To investigate the performance of the proposed model, a sample 0.4 kV test network, with 8 candidate locations for distribution transformers (DT), 3 candidates for sizes of DTs, 16 load points with two levels, and 4 small-scale solar units with smart inverters are considered. In this study, transformers were loaded optimally based on IEC 60076-7. Simulations were performed on a residential district with PV penetration and GAMS as a mathematical tool was utilized to solve the optimization problem. Results showed that with a 14.7% share of PV energy generation, the loss cost of LV feeders is reduced by 28.3% in the last planning year. It was shown that uncertainties in load or generation have a minor impact on voltage violations. Also, it was observed that by optimally making use of the reactive power absorption capability of the smart inverter, the voltage level can be brought to the allowable limit. Results showed a 50% enhancement in the hosting capacity of the network. The main findings of this study can be summarized below:
  • A mathematical optimization model is proposed for the dynamic planning of an active LV distribution while considering the reactive power allocation of the smart inverters.
  • Using the reactive power absorption capability of smart inverters, and without a decrease in active power generation, issues related to voltage violation can be relieved, which results in hosting-capacity enhancement.
  • Despite no changes in expansion results, the presence of PVs influences operation costs, specifically the reduction in loss costs.
  • The uncertainty in the load/generation of the network has a negligible impact on the voltage level of load points.
This work can be further developed considering other types of distributed energy resources and the other strategies to enhance the hosting capacity.

Author Contributions

Conceptualization, A.S., M.H. and H.S.; methodology, A.S., M.H. and H.S.; software, M.H., A.S. and A.Y.; validation, M.H. and H.S.; investigation, M.H., A.Y. and H.S.; resources, S.S., N.B. and V.-G.I.; data curation, S.S., N.B. and V.-G.I.; writing-original draft preparation, A.S., M.H. and H.S.; supervision, H.S., N.B. and V.-G.I.; Funding acquisition, N.B. and V.-G.I.; Visualization, H.S., N.B. and V.-G.I.; writing-review and editing, M.H., H.S., A.Y., N.B. and V.-G.I.; project administration, N.B. and V.-G.I.; Formal analysis, M.H., N.B., V.-G.I. and H.S. All authors have read and agreed to the published version of the manuscript.

Funding

This research received no external funding.

Institutional Review Board Statement

Not applicable.

Informed Consent Statement

Not applicable.

Data Availability Statement

Not applicable.

Conflicts of Interest

The authors declare no conflict of interest.

Abbreviations and Nomenclature

Abbreviations

The following abbreviations are mentioned throughout the manuscript:
ADNActive Distribution Network
CRUComponent placement, reinforcement, and upgrade
DERDistributed Energy Resource
DISCODistribution company
DTDistribution transformer
LVLow voltage
MGMicrogrid
MILPMixed-integer linear programming problem
MINLPMixed-integer nonlinear programming
MVMedium voltage
PCCPoints of common coupling

Nomenclature

The followings symbols are used in this manuscript:
Indices
yPlanning years
tCandidate transformer locations
nTypical transformer sizes
lLoad points
hHours
iOff-peak hours
jPeak hours
pPatterns of load profiles or solar irradiation
Superscripts
a b s Absorption
c u Copper
e l e c Electricity
i n f r Inflation rate
i n t r Interest rate
i n v Investment
i r Iron
t r a n s Transformer
l v f Low-voltage feeder
m a x Maximum
o p e r Operation
p e a k , o f f p e a k Peak and off-peak hours
p g p Pollution gas production
p o l Pollution
p r Peak reduction
p r o d Production
t o t Total
o h Off-peak hours
o p t Optimal
p h Peak hours
Parameters
α i n f r Inflation rate
α i n f r Interest rate
β Yearly loss factor
δ Net present value factor
Λ m a x Maximum allowable voltage drop/increase (%)
λ Price ($ per km, kVA, kWh, or kg)
DDistance from the distribution transformer to the load point (km)
EThe amount of pollution gas production (kg/kWh)
NNumber
N p d a y Number of days with pattern p
c o s ϕ Power factor
μ m i n Minimum loading of transformer
μ m a x Maximum loading of transformer
ABinary value indicating non-zero load
L c u Copper loss of the transformer (kW)
L i r Iron loss of the transformer (kW)
RResistance of LV line ( Ω /km)
S l o a d Apparent load of a load point
VNominal voltage of LV feeder (kV)
Γ Alternative sizes of a distribution transformer (kVA)
k p e a k , k o f f p e a k Coefficients of the transformer loading
a , b , c Constant coefficients for optimal transformer loading
Binary Variables
uDecision variable for selection of size for the transformer
rDecision variable for utilization of a line
zDecision variable for investment of a line
Continuous Variables
CCost
g t h y Apparent power dispatched from distribution transformer t duringHour h at Year y
W t y Size of transformer t at Year y (kVA)
P , Q Active and reactive power (kW, kVaR)

References

  1. Wankhede, S.K.; Paliwal, P.; Kirar, M.K. Increasing Penetration of DERs in Smart Grid Framework: A State-of-the-Art Review on Challenges, Mitigation Techniques and Role of Smart Inverters. J. Circuits, Syst. Comput. 2020, 29, 2030014. [Google Scholar] [CrossRef]
  2. Ghiani, E.; Pilo, F. Smart inverter operation in distribution networks with high penetration of photovoltaic systems. J. Mod. Power Syst. Clean Energy 2015, 3, 504–511. [Google Scholar] [CrossRef] [Green Version]
  3. Ghiani, E.; Di Gregorio, R. Intelligent Low Voltage Regulator for Solving PV Overvoltages Problems in Power Distribution Systems. In Proceedings of the 2022 20th International Conference on Harmonics & Quality of Power (ICHQP), Naples, Italy, 29 May–1 June 2022; pp. 1–6. [Google Scholar] [CrossRef]
  4. Feng, C.; Liu, W.; Wen, F.; Li, Z.; Shahidehpour, M.; Shen, X. Expansion planning for active distribution networks considering deployment of smart management technologies. IET Gener. Transm. Distrib. 2018, 12, 4605–4614. [Google Scholar] [CrossRef]
  5. Zhou, Y.; Cao, S.; Hensen, J.L.; Lund, P.D. Energy integration and interaction between buildings and vehicles: A state-of-the-art review. Renew. Sustain. Energy Rev. 2019, 114, 109337. [Google Scholar] [CrossRef]
  6. Pradeep Reddy, G.; Pavan Kumar, Y. Internet of Things Based Communication Architecture for Switchport Security and Energy Management in Interoperable Smart Microgrids. Arab. J. Sci. Eng. 2023, 48, 5809–5827. [Google Scholar] [CrossRef]
  7. Chen, B.; Wang, J.; Lu, X.; Chen, C.; Zhao, S. Networked Microgrids for Grid Resilience, Robustness, and Efficiency: A Review. IEEE Trans. Smart Grid 2021, 12, 18–32. [Google Scholar] [CrossRef]
  8. Zhou, Y.; Cao, S. Energy flexibility investigation of advanced grid-responsive energy control strategies with the static battery and electric vehicles: A case study of a high-rise office building in Hong Kong. Energy Convers. Manag. 2019, 199, 111888. [Google Scholar] [CrossRef]
  9. Zhou, Y.; Cao, S.; Hensen, J.L. An energy paradigm transition framework from negative towards positive district energy sharing networks—Battery cycling aging, advanced battery management strategies, flexible vehicles-to-buildings interactions, uncertainty and sensitivity analysis. Appl. Energy 2021, 288, 116606. [Google Scholar] [CrossRef]
  10. AlKaabi, S.S.; Khadkikar, V.; Zeineldin, H.H. Incorporating PV Inverter Control Schemes for Planning Active Distribution Networks. IEEE Trans. Sustain. Energy 2015, 6, 1224–1233. [Google Scholar] [CrossRef]
  11. Mahmoud, K.; Lehtonen, M. Three-level control strategy for minimizing voltage deviation and flicker in PV-rich distribution systems. Int. J. Electr. Power Energy Syst. 2020, 120, 105997. [Google Scholar] [CrossRef]
  12. Vijayan, V.; Mohapatra, A.; Singh, S. Demand Response with Volt/Var Optimization for unbalanced active distribution systems. Appl. Energy 2021, 300, 117361. [Google Scholar] [CrossRef]
  13. Lee, Y.D.; Lin, W.C.; Jiang, J.L.; Cai, J.H.; Huang, W.T.; Yao, K.C. Optimal Individual Phase Voltage Regulation Strategies in Active Distribution Networks with High PV Penetration Using the Sparrow Search Algorithm. Energies 2021, 14, 8370. [Google Scholar] [CrossRef]
  14. Dutta, A.; Ganguly, S.; Kumar, C. MPC-Based Coordinated Voltage Control in Active Distribution Networks Incorporating CVR and DR. IEEE Trans. Ind. Appl. 2022, 58, 4309–4318. [Google Scholar] [CrossRef]
  15. Sun, X.; Qiu, J.; Tao, Y.; Ma, Y.; Zhao, J. A Multi-Mode Data-Driven Volt/Var Control Strategy With Conservation Voltage Reduction in Active Distribution Networks. IEEE Trans. Sustain. Energy 2022, 13, 1073–1085. [Google Scholar] [CrossRef]
  16. Wang, R.; Li, P.; Yu, H.; Ji, H.; Xi, W.; Wang, C. Identification of critical uncertain factors of distribution networks with high penetration of photovoltaics and electric vehicles. Appl. Energy 2023, 329, 120260. [Google Scholar] [CrossRef]
  17. Hassan, S.J.U.; Gush, T.; Kim, C.H. Maximum Hosting Capacity Assessment of Distribution Systems with Multitype DERs Using Analytical OPF Method. IEEE Access 2022, 10, 100665–100674. [Google Scholar] [CrossRef]
  18. Rajabi, A.; Elphick, S.; David, J.; Pors, A.; Robinson, D. Innovative approaches for assessing and enhancing the hosting capacity of PV-rich distribution networks: An Australian perspective. Renew. Sustain. Energy Rev. 2022, 161, 112365. [Google Scholar] [CrossRef]
  19. Kazmi, S.A.A.; Shahzad, M.K.; Shin, D.R. Multi-Objective Planning Techniques in Distribution Networks: A Composite Review. Energies 2017, 10, 208. [Google Scholar] [CrossRef] [Green Version]
  20. Ghiani, E.; Pisano, G. Chapter 2—Impact of Renewable Energy Sources and Energy Storage Technologies on the Operation and Planning of Smart Distribution Networks. In Operation of Distributed Energy Resources in Smart Distribution Networks; Zare, K., Nojavan, S., Eds.; Academic Press: Cambridge, MA, USA, 2018; pp. 25–48. [Google Scholar] [CrossRef]
  21. Chihota, M.J.; Bekker, B. New Planning Principles for Distribution Networks with Penetration of Distributed Energy Resources. In Proceedings of the 2020 6th IEEE International Energy Conference (ENERGYCon), Gammarth, Tunisia, 28 September–1 October 2020; pp. 643–648. [Google Scholar] [CrossRef]
  22. Ali Dashtaki, A.; Mehdi Hakimi, S.; Hasankhani, A.; Derakhshani, G.; Abdi, B. Optimal management algorithm of microgrid connected to the distribution network considering renewable energy system uncertainties. Int. J. Electr. Power Energy Syst. 2023, 145, 108633. [Google Scholar] [CrossRef]
  23. Esmaeeli, M.; Kazemi, A.; Shayanfar, H.A.; Haghifam, M.R. Sizing and placement of distribution substations considering optimal loading of transformers. Int. Trans. Electr. Energy Syst. 2015, 25, 2897–2908. [Google Scholar] [CrossRef]
  24. Karagiannopoulos, S.; Aristidou, P.; Hug, G. Co-optimisation of planning and operation for active distribution grids. In Proceedings of the IEEE Manchester PowerTech, Manchester, UK, 18–22 June 2016; pp. 1–6. [Google Scholar] [CrossRef]
  25. Gholizadeh-Roshanagh, R.; Najafi-Ravadanegh, S.; Hosseinian, S.H. On Optimal Cost Planning of Low Voltage Direct Current Power Distribution Networks. Electr. Power Components Syst. 2018, 46, 1019–1028. [Google Scholar] [CrossRef]
  26. Sangob, S.; Sirisumrannukul, S. Optimal Sequential Distribution Planning for Low-Voltage Network with Electric Vehicle Loads. Front. Energy Res. 2021, 9, 1–22. [Google Scholar] [CrossRef]
  27. Wruk, J.; Cibis, K.; Resch, M.; Sæle, H.; Zdrallek, M. Optimized Strategic Planning of Future Norwegian Low-Voltage Networks with a Genetic Algorithm Applying Empirical Electric Vehicle Charging Data. Electricity 2021, 2, 91–109. [Google Scholar] [CrossRef]
  28. Valencia, A.; Hincapie, R.A.; Gallego, R.A. Optimal location, selection, and operation of battery energy storage systems and renewable distributed generation in medium–low voltage distribution networks. J. Energy Storage 2021, 34, 102158. [Google Scholar] [CrossRef]
  29. Vincent Palaguachi, D.E.; Vasquez Miranda, P.F. Optimal Distribution Transformer Placement by Exploiting Graph Theory and Clustering Techniques. IEEE Lat. Am. Trans. 2022, 20, 2096–2105. [Google Scholar] [CrossRef]
  30. Valencia D., A.; Hincapie I., R.A.; Gallego, R.R.A. Expansion planning of joint medium- and low-voltage three-phase distribution networks considering the optimal integration of distributed energy resources. Energy Rep. 2023, 9, 1183–1200. [Google Scholar] [CrossRef]
  31. Fawzy, T.; Premm, D.; Bletterie, B.; Gorsek, A. Active contribution of PV inverters to voltage control – from a smart grid vision to full-scale implementation. E I Elektrotechnik Und Informationstechnik 2011, 128, 110–115. [Google Scholar] [CrossRef]
  32. Nour, A.M.; Hatata, A.Y.; Helal, A.A.; El-Saadawi, M.M. Review on voltage-violation mitigation techniques of distribution networks with distributed rooftop PV systems. IET Gener. Transm. Distrib. 2020, 14, 349–361. [Google Scholar] [CrossRef]
  33. IEC 60076-7; Power Transformers-Part 7, Loading Guide for Oil-immersed Power Transformers (Revision of IEC 60354-1991). International Electrotechnical Commission: Geneva, Switzerland, 2005.
  34. IEEE Std C57.91-2011 (Revision of IEEE Std C57.91-1995); IEEE Guide for Loading Mineral-Oil-Immersed Transformers and Step-Voltage Regulators. IEEE: New York, NY, USA, 2012; pp. 1–123. [CrossRef]
  35. Ustun, T.S.; Aoto, Y. Analysis of Smart Inverter’s Impact on the Distribution Network Operation. IEEE Access 2019, 7, 9790–9804. [Google Scholar] [CrossRef]
  36. Pazouki, S.; Haghifam, M.R. Effect of distributed energy resources on load and loss factors of energy distribution networks. In Proceedings of the 2015 20th Conference on Electrical Power Distribution Networks Conference (EPDC), Zahedan, Iran, 28–29 April 2015; pp. 107–112. [Google Scholar] [CrossRef]
  37. Dewangan, C.L.; Chakrabarti, S.; Singh, S.N.; Sharma, M. A Fair Incentive Scheme for Participation of Smart Inverters in Voltage Control. IEEE Trans. Ind. Informatics 2022, 18, 656–665. [Google Scholar] [CrossRef]
  38. IEEE PES Industry Technical Support Leadership Committee. Impact of IEEE 1547 Standard on Smart Inverters and the Applications in Power Systems; Technical Report; IEEE: New York, NY, USA, 2020. [Google Scholar]
Figure 1. Representation of the hosting capacity with respect to the voltage level.
Sustainability 15 11183 g001
Figure 2. Representation of the voltage variation of the LV distribution line in the presence of home-based PV equipped with a smart inverter.
Sustainability 15 11183 g002
Figure 3. Voltage regulation through reactive power exchange in the smart inverter.
Sustainability 15 11183 g003
Figure 4. Representation of the partial utilization scheme of the smart inverter.
Sustainability 15 11183 g004
Figure 5. Flowchart of the proposed two-stage reactive power allocation.
Sustainability 15 11183 g005
Figure 6. The test LV distribution system comprising 16 load points and four PV units.
Sustainability 15 11183 g006
Figure 7. Per unit output power of PV units for each season [35].
Sustainability 15 11183 g007
Figure 8. The test LV distribution system with expansion-planning Results.
Sustainability 15 11183 g008
Figure 9. Voltage profile for the load point L4 over the planning years and seasons for Q a b s = 0 .
Sustainability 15 11183 g009
Figure 10. Active power generation for PV panels installed on the load point L4 over the planning years and seasons for Q a b s = 0 .
Sustainability 15 11183 g010
Figure 11. (a) Voltage profile, and (b) active power generation of PV panel for the load point L12 over the planning years and spring season for Q a b s = 0 .
Sustainability 15 11183 g011
Figure 12. (a) Voltage profile, (b) active power generation, (c) reactive power absorption, and (d) apparent power generation of the PV panel equipped by smart inverter for the load point L12 over the planning years and spring season for optimal Q a b s = Q o p t .
Sustainability 15 11183 g012
Table 1. Analysis of the LV distribution network planning models.
Ref.YearIns.O&MLossPollutionNetworkPeriodOFDDGWDGSDGSIAlgorithm
[23]2015 LVStaticSO MINLP
[24]2017 LVStaticSO MILP
[25]2018 LVStaticSO ICA
[26]2021 LVDynamicSO PSO/MCS
[27]2021 LVStaticSO GA
[28]2021 LV-MVStaticSO MINLP
[29]2022 LVStaticSO CT/GT
[30]2023 LV-MVStaticSO ILS
Proposed2023LVDynamicSO MINLP
CT: Clustering Technique; MINLP: Mixed-Integer Nonlinear Programming; DDG: Dispatchable DG; GT: Graph theory; O&M: Operation and maintenance; GA: Genetic Algorithm; OF: Objective Function; ICA: Imperialist Competitive Algorithm; PSO: Particle Swarm Optimization; ILS: Iterated Local Search; SDG: Solar DG; Ins.: Installation; SI: Smart Inverter; MCS: Monte-Carlo Simulation; SO: Single Objective; MILP: Mixed-Integer Linear Programming; WDG: Wind DG.
Table 2. Load levels of the load points.
NodeLL1 *LL2 *NodeLL1LL2
L18040L97035
L24020L107035
L38040L118040
L48040L127035
L54020L138040
L66030L146030
L76834L158040
L88040L167035
* LL1 and LL2 denote peak and off-peak load levels in kVA.
Table 3. Types of transformers with their parameters.
TypesCapacityCost ($)Iron LossCopper Loss
(kVA)(kW)(kW)
Type125032,0000.533.25
Type231540,0000.725.4
Type350064,00017.8
Table 4. Installed capacities of PV units over the planning years (kVA).
PV NamesLocationYears
12345
PV1L206080100120
PV2L40120160200240
PV3L80120160200240
PV4L120105140175210
Table 5. Some of the parameter values utilized in this paper.
ItemValue
Installation cost of LV lines ($ per km)6000
Interest and inflation rates0.18 and 0.15
Cost of energy loss ($ per kWh)0.2
Cost of power saving ($ per kW)168
Resistance and reactance of LV lines (ohm per km)0.26 + j 0.074
Voltage rating of LV distribution network (kV)0.4
Max and min transformer loading0.8, 0.1
Coefficient a of IEC curve1.2135
Coefficient b of IEC curve0.0902
Coefficient c of IEC curve0.8102
Production of gas pollution (kg per kWh)0.05
Cost of pollution ($ per kg)0.01
Cost of electricity ($ per kWh)0.2
Power factor ( c o s φ )0.9
Loss factors over the 5 years0.4, 0.3, 0.29, 0.27, 0.26
Table 6. Optimization model’s characteristics.
Variables10,163Continuous9608
Binary555
Equations10,959Linear10,149
Nonconvex nonlinear810
Nonlinear terms640Bilinear/Quadratic480
Logarithmic160
Table 7. Results of the distribution transformer’s installation over the planning years.
DT LocationYears
12345
T1-----
T2250 kVA--315 kVA-
T3315 kVA----
T4-----
T5-----
T6-----
T7315 kVA500 kVA---
T8-----
Table 8. Results of installation and operation costs of the test case over the planning years.
Costs ($)YearsTotal
12345NPV *
Transformer installation112,00024,000080000142,795.0
LV feeder installation18,00090012001800120022,765.6
Loss of LV feeder18,903.416,826.817,906.919,885.421,815.988,099.6
Iron loss of transformer3782.44320.04320.04684.84684.820,133.2
CU loss of transformer16,406.916,840.218,181.620,852.421,649.386,659.4
Pollution3180.43274.23491.03766.33915.116,280.6
Production1,272,153.61,309,683.51,396,386.91,506,520.11,566,058.16,512,224.4
total cost1,411,009.11,307,392.81,334,342.91,412,504.41,423,708.66,888,957.9
* Net Present Value.
Table 9. Loss cost of LV feeders ($), with/without PVs over the planning years.
Years
12345
Without PVs18,903.421,077.123,005.826,932.830,408.0
With PVs18,903.416,826.817,906.919,885.421,815.9
Table 10. Comparison of energy consumption and generation over the planning years.
Years
12345
Consumption (kWh)7,067,5207,276,019.47,757,704.88,369,556.38,700,322.9
Generation (kWh)0637,875850,5001,063,1251,275,750
Share of generation (%)08.81112.714.7
Table 11. Sensitivity analysis of the impact of load/generation uncertainty on the voltage of load point L12.
Growth Factor
1.001.051.10
Sensitivity to increase in the generation
Generation (kW)142.8149.9157.0
Voltage of PCC (V)409.8410.7411.7
Sensitivity to decrease in the load
Load (kW)31.530.028.3
Voltage of PCC (V)409.8409.9410.0
Disclaimer/Publisher’s Note: The statements, opinions and data contained in all publications are solely those of the individual author(s) and contributor(s) and not of MDPI and/or the editor(s). MDPI and/or the editor(s) disclaim responsibility for any injury to people or property resulting from any ideas, methods, instructions or products referred to in the content.