Article

The Numerical Simulation of the Pressure Law and Control of the Hard Roof Face in the Far Field

School of Mechanical Science and Engineering, Northeast Petroleum University, Daqing 163318, China
*
Author to whom correspondence should be addressed.
Sustainability 2023, 15(14), 11285; https://doi.org/10.3390/su151411285
Submission received: 15 May 2023 / Revised: 13 July 2023 / Accepted: 14 July 2023 / Published: 20 July 2023

Abstract

:
Controlling hard roof plate breakage and destabilization to ensure a sufficient mine pressure is difficult using conventional underground pressure relief methods, since it is located far above the coal seam. This paper investigated the ground fracturing technology used to control the mine pressure at the working face caused by hard top collapse, using the working face of Tashan 8106 as an example. Finite element software and its global embedded cohesive unit approach, the fluid–structure coupling theory, and the fracture mechanics theory were used to construct a numerical calculation model of hydraulic fracturing during coal rock excavation. The calculation results revealed an initial hard top plate pressure before the fracturing of about 52 m, while the error rate of the initial pressure step was 0.07% compared to the actual measurement results, verifying the simulation’s accuracy. At a prefabricated fracture spacing of 16 m, the initial incoming pressure step distance was reduced from 52 m to 24 m after the hard roof surface fracturing, while the peak vertical stress at the coal seam working face decreased by 40.59%. It effectively reduced the mine pressure at the working face caused by the cross fall of the roof, which was more conducive to safe mining. The research in this paper provides theoretical guidance for the control procedures of these types of roof slabs.

1. Introduction

Underground coal seam mining in China is complex and highlights the challenge presented by hard roofs, such as those in the Datong mine [1] in the Shanxi Province. When thick coal seams are located at considerable heights, the overhanging roof area increases gradually as the working face advances, causing the roof plate closer to the coal seam to collapse into the mining area. The basic top balance structure rises to a certain height as the mining height increases, constituting the old top hard layer in the far field [2]. The large overhanging roof can break instantly, causing significant pressure on the working area of the quarry via rock beam transfer. This can cause severe accidents, such as bracket crushing, roadway valley floor deformation, and personal casualties.
Hard roofs near coal seams are typically addressed by water injection fracturing and deep hole blasting techniques, as shown in Figure 1. Song Yongjin [3] was the first to apply hydraulic fracturing technology to control the challenging hard roofs in the Datong mine in China. Sun Shoushan et al. [4] introduced the use of directional hydraulic fracturing technology for hard roofs in Polish coal mines, while Wang Jin’an et al. [5] analyzed the rheological fracture mechanics of hard roofs in mining areas. Yan Shaohong et al. [6] explored hydraulic fracturing for hard roofs, while Huang Bingxiang et al. [7] established a hydraulic fracturing framework theory for addressing coal rock bodies. Chen Dianbin et al. [8] addressed the challenge of long overhanging roof distances in mining areas, forcing roof release via deep hole blasting. Due to the limitations of the required equipment and hole lengths, the hard rock seam can only be weakened within 50 m above the coal seam. Yu Bin et al. [9,10] examined the hard top plate far from the coal seam, revealing the mechanism behind the considerable mine pressure by destabilizing and breaking the rock seam in the far and near fields in large spaces. They also controlled this considerable pressure at the working face using pre-fracturing in the near-field downhole and fracturing on the far-field surface, as shown in Figure 2.
In summary, in order to reduce the far-field old top ore pressure appearance, ground hydraulic fracturing technology can be used, but the ground large-scale hydraulic fracturing and different spacing fractures after fracturing the effect of stress changes on the ore pressure law are not clear. Therefore, this paper establishes a rock fracture model of hydraulic fracturing during coal seam excavation to examine the fracture distribution and ground stress changes in the hard roof and reproduce the rock body fracturing process after coal seam excavation. The main principle of calculating crack proliferation using ABAQUS involves first defining the main and slave bonding surfaces. Then, the node set on the slave bonding surface is determined to combine these two surfaces, after which, the bonding contact properties and fracture criteria are specified. Under load or displacement loading, the node detaches from the main surface when the critical value is reached. This can only be used for two-dimensional crack propagation. The ABAQUS software uses the maximum normal stress criterion to determine the start of the damage. The initial damage point is indicated by a stress-to-critical value ratio of 1 in any direction. The coal seam stress distribution characteristics, before and after the crack prefabrication, are compared and analyzed to reduce the mine pressure and provide theoretical guidance for controlling and processing these types of roof plates.

2. Coal Rock Excavation and Hydraulic Fracturing Flow–Solid Coupling Theory

2.1. The Rock Stress Equilibrium Equation

A saturated porous medium is typically composed of a solid skeleton, the fluid between the voids, the pore stress denoting the pressure generated by the fluid on the perimeter of the pore in the normal direction, and the effective stress signifying the stress transmitted by the contact surfaces of the rock particles. The rock skeleton is deformed and damaged due to the influence of the external force and pore pressure on the porous medium, resulting in fluid-flow state changes.
Figure 3 represents the total stress of the rock at a specific point, including the pore pressure in the wet fluid, the average compressive stress of other non-wetting fluids, and the effective stress. The effective stress is expressed as:
σ ¯ = σ + ( χ p w + ( 1 χ ) p a ) I
In the formula: I—Unit Matrix, I = [ 1 , 1 , 1 , 0 , 0 , 0 ] T .
χ —Dimensionless factors, take 0.0–1.0, the value is influenced by the saturation and the surface tension at the fluid-–solid coupling interface, when the rock is fully saturated. χ = 1.0.
σ ¯ —The effective stress matrix, Pa; σ —The stress matrix, Pa; P a —The mean pressure of a non-wetting fluid; Pa. P w —The pressure of a non-wetting fluid; Pa.
Simplifying the model, when a non-wetting fluid can flow freely in the rock, assuming that the pressure of the non-wetting fluid in the model does not change with time.
On   { σ i j n j t i = 0 On   the   boundary   of   the   force   S σ   u i | = u i ¯ On   the   boundary   of   the   displacement   force   S u
  • σ i j —Stress component.
  • n j —The component of the outer normal vector, dimensionless.
  • t i —Surface force component.
  • u i | —Displacement component.
  • u i ¯ —The specified displacement component on the boundary.
  • S σ —The boundary of the force.
  • S u —The boundary of the displacement force.

2.2. Fluid Seepage Equilibrium Equation

Assuming that V represents the rock microelement volume and S denotes the surface area of the rock microelement, the rate of change in the wet liquid mass in the V of the rock microelement is expressed as:
d d t V ρ w n w d V = v 1 J d d t ( J ρ w n w ) d V
where ρ w denotes the wet liquid density kg/m3, n w signifies the factorless porosity, and J is the moment of inertia.
The wet liquid mass that passes through the V surface into the micro-element body per unit of time is expressed as:
S ρ w n w n T v w d S
where v w represents the seepage rate m / s and n T denotes the normal outer vector of the S surface.
According to the law of mass conservation, if an increase in its own mass is equal to that of the liquid entering the micro-element via the surface, then:
v 1 J d d t ( J ρ w n w ) d V = S ρ w n w n T v w d S
The boundary conditions of the fluid continuity equation during the numerical hydraulic fracturing simulation are expressed as follows:
F = { n T n w g ρ w k ( p w x ρ w g ) = q ¯ ( O n S q ) p w p w ¯ = 0 ( O n S p w )
where q ¯ denotes the fluid volume flow vector per unit area m / s , p w is the fluid pore pressure in Pa, and p ¯ w represents the fluid pore pressure boundary conditions P a .
The finite element format describing the seepage fluid flow is obtained via the fluid mass continuity equation, while the effective stress, strain, and pore pressure of the pore medium nodes can be calculated by solving the rock stress balance and fluid mass continuity equations.

3. Engineering Background

The 8106 working face of the Tashan coal mine presents a strike length of 2741.5 m, a slope length of 217.5 m, a burial depth of 417.20 m, an average coal seam dip angle of 3, and an average coal seam thickness of 14.47 m. The direct bottom of the coal seam is 3.94 m, the old bottom is 9.80 m, and the direct top is 12.52 m. The basic top is 15.11 m and consists of a strong, stable quartz and feldspar interbed, displaying a dense lithology. The main interbedded sandstone is composed of fine sandstone with quartz and feldspar. The mechanical parameters of each layer are shown in Table 1.

4. The Stress Distribution Pattern of the Hard Top Plate

4.1. Numerical Model Construction

The thick hard top plate generally denotes the basic top of a coal seam. Based on the actual geological mining conditions at the 8106 working face of the Tashan coal mine described in the literature [11], finite element simulation software was combined with the actual coal rock body physical parameters to establish a 59 m × 300 m plane strain model, with a selected stratigraphic depth of 417 m, a coal seam thickness of 15 m, an immediate roof thickness of 13 m, and a main roof thickness of 15 m, as shown in Figure 4, using secondary development methods in the top layer. In the global embedded cohesive unit, the coal seam was nearly horizontal with a maximum horizontal principal stress of 12 MPa, a minimum horizontal principal stress of 6.4 MPa, and a vertical stress of 11.44 MPa, and the structural surface had two cases of first mining and second mining.
Horizontal and vertical displacement constraints were applied to the left and right sides and lower surface, respectively, to simulate the restrictive effect of the seam on the rock body. A vertical load was applied to the upper surface to represent the pressure of the overlying rock body. The overall gravity load and horizontal and vertical ground pressures in the ground stress field were employed. The “life and death unit” contact technique was used, where the unit was disabled within a set time, and 4 m was removed in one step, followed by the remainder of the coal seam to simulate the coal excavation process.
The calculation process included the model generation, original rock stress calculation, coal seam mining, stability determination, calculation balancing of each step, and calculation result output. The calculation used the maximum positive stress criterion to determine the onset of the damage. A stress-to-critical value ratio of 1 in any direction indicated the initial damage point.
M A X { σ n N max , σ t T max ' , σ s S max } = 1
where σ n represents the tensile stress, σ t and σ s denote the shear stress in different directions, and N max , T max , and S max signify the critical, positive, and shear stress values when damage occurs, respectively.

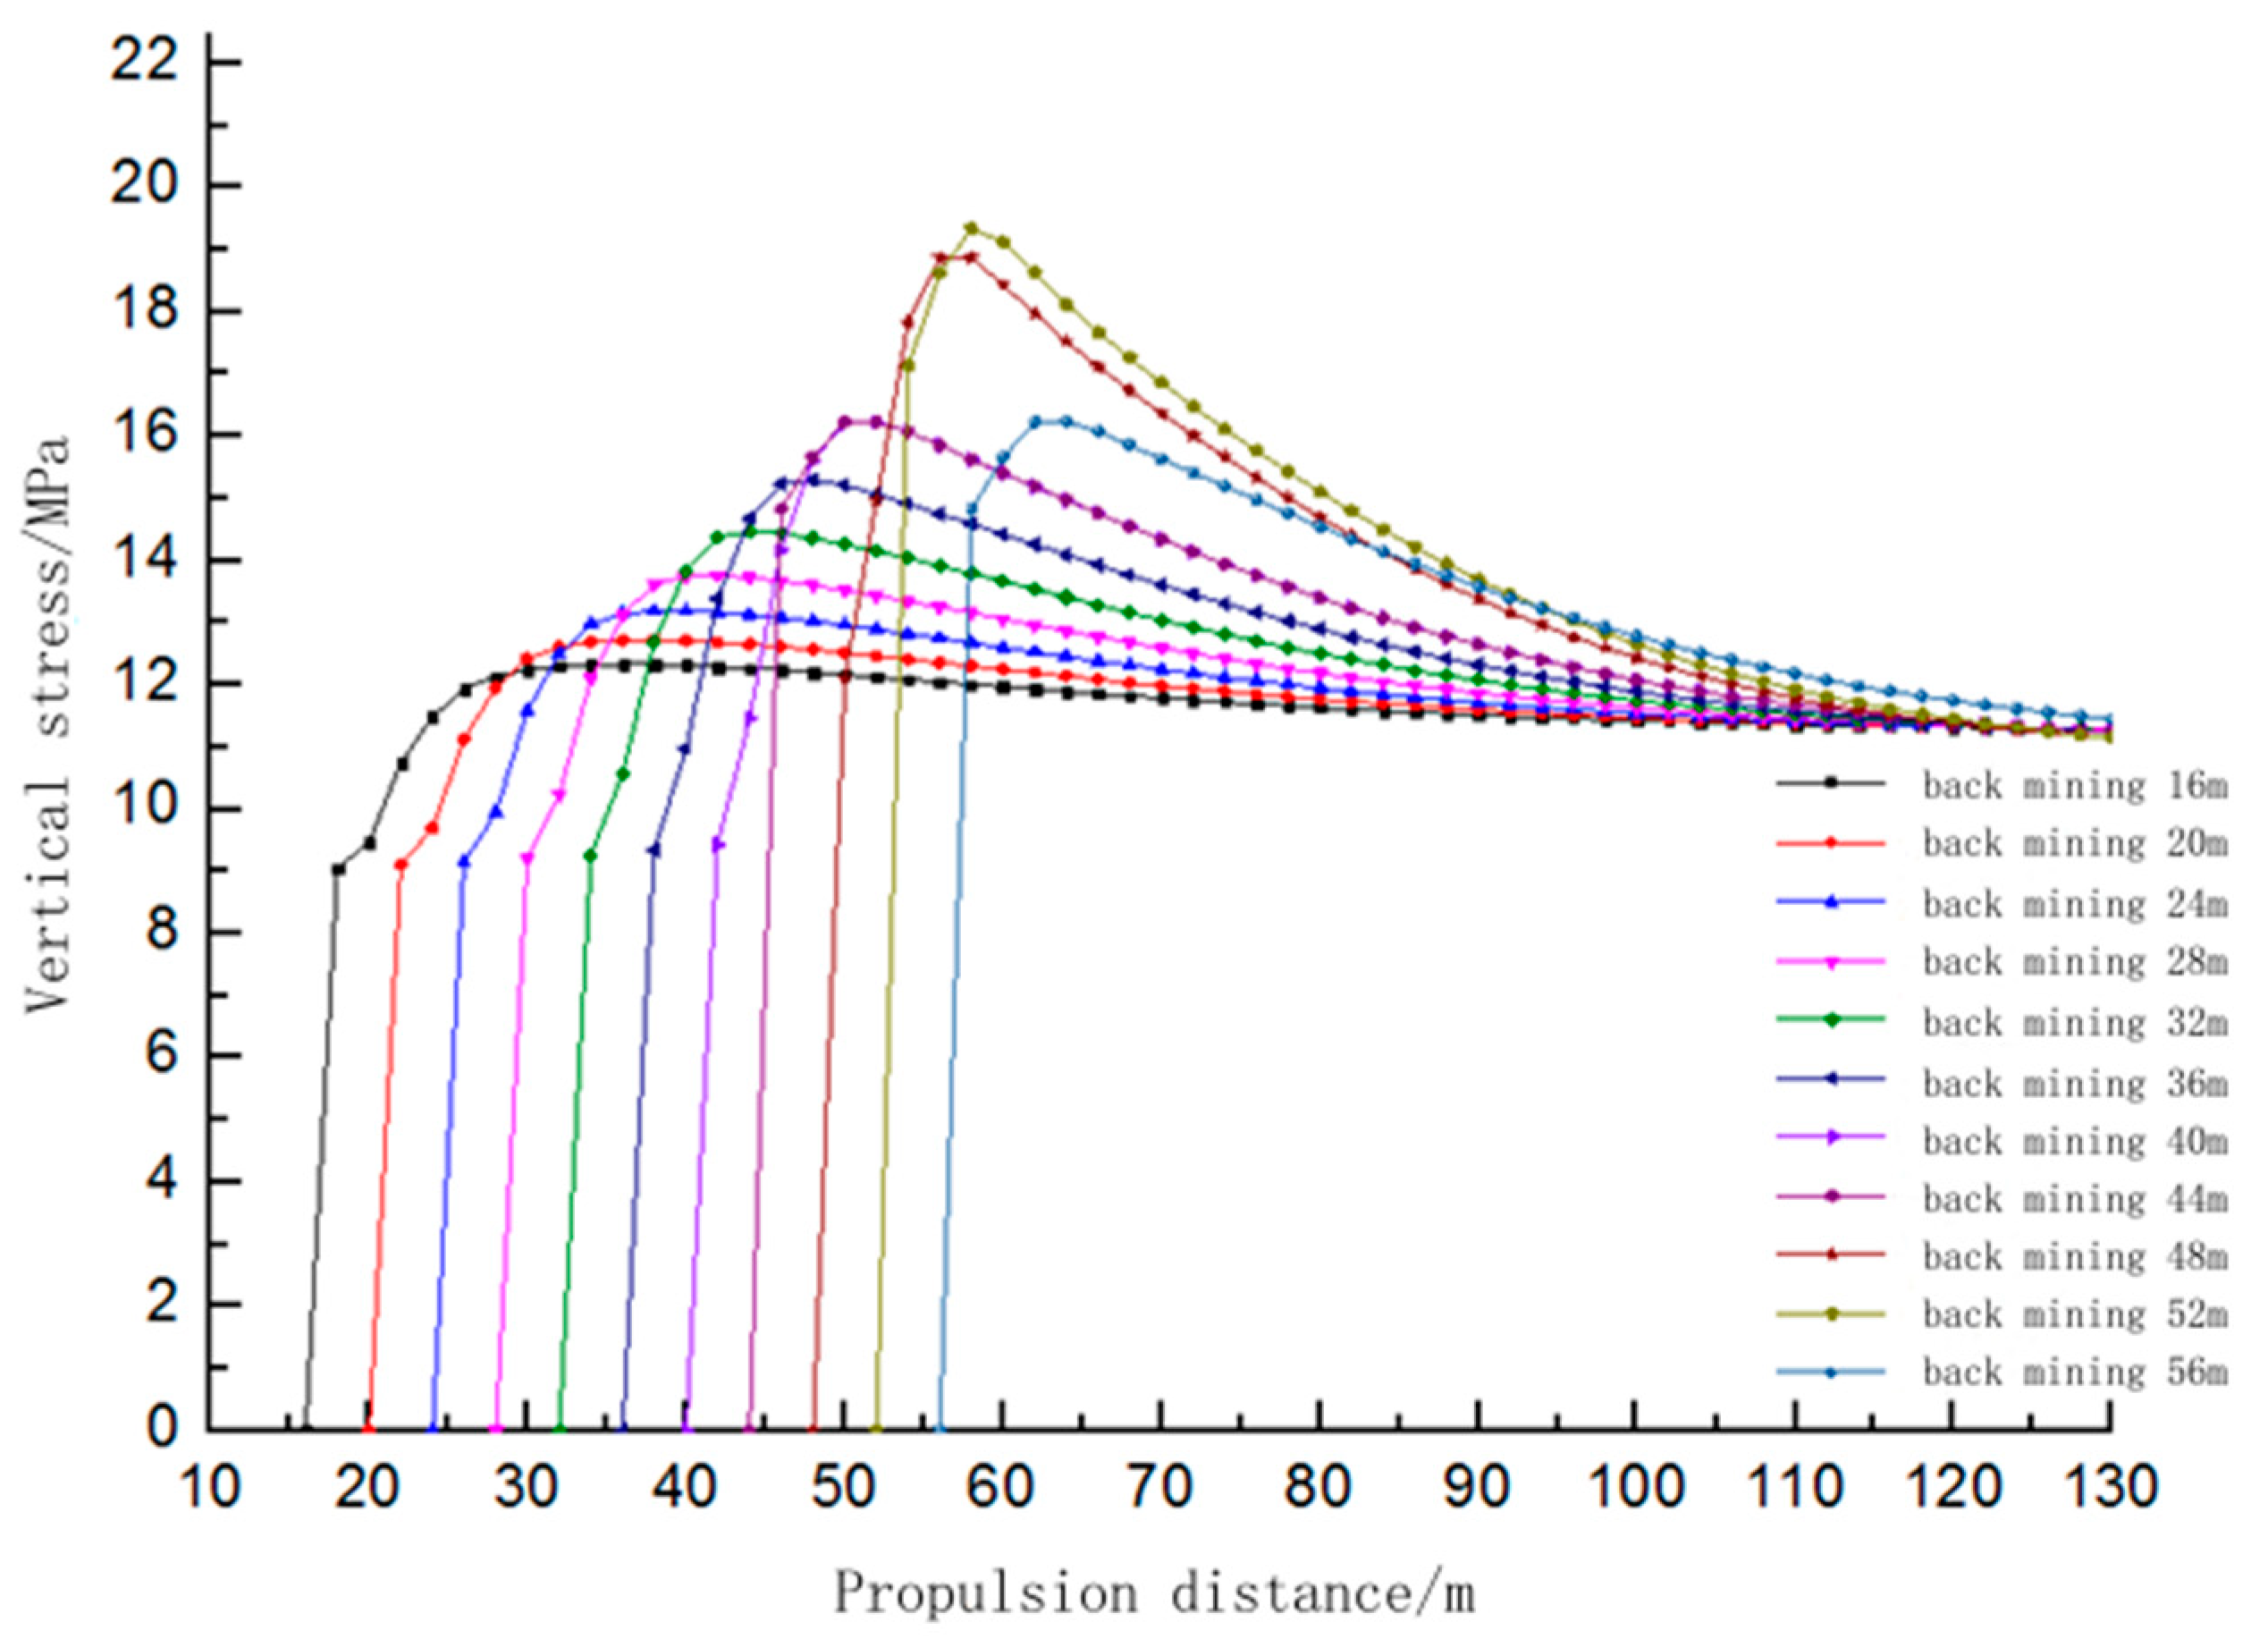
4.2. Analysis of the Numerical Calculation Results

The stress distribution of the 8 m–52 m advanced working face was calculated separately, using the numerical calculation model, as shown in Figure 5.
As shown in Figure 5, the stress redistribution in the original rock after the coal seam excavation prevented the top plate from collapsing. The pressure relief area was located above the mining area, presented as a pressure arch, while the vertical stress was symmetrically distributed. A higher external stress arch increased the stress value. When the coal seam was excavated to 40 m from the open cutting eye, cracks gradually appeared in the middle of the direct top, which collapsed first, after which, the cracks spread to the basic top. When the coal seam was excavated to 52 m from the open cutting eye, the stress cloud diagram showed that the middle cracks penetrated the basic top, also generating crack defects above the open cutting eye, indicating basic top fracturing. Therefore, the basic top was exposed to pressure first, while the peak stress was close to the working face, necessitating increased support and attention to the strong mine pressure of the roof. The vertical stress variation curves of the coal seam in the mining direction were extracted using the path method at different mining depths, as shown in Figure 6.
As shown in Figure 6, the movement of the overburdened rock above the mining area continuously changed the stress at the coal seam working face as it advanced, while the gradual extension in the exposed roof area increased the vertical stress value. Excavation to 32 m from the opening cut produced a peak vertical stress of 14.47 MPa, peaking at a distance of 12 m from the coal seam working face, while the stress concentration coefficient reached 1.34. The peak vertical stress increased, continuing to approach the working face. Excavation to 40 m from the opening cut produced a peak vertical stress of 16.24 MPa, reaching a stress concentration coefficient of 1.42 at a distance of 12 m from the coal seam working face. As shown in the cloud diagram in Figure 5, the direct roof gradually collapsed through the middle of the direct roof. Excavation to 52 m from the opening and cutting eye produced a peak vertical stress of 19.35 MPa at 6 m from the coal seam working face, representing the closest distance. Here, the peak stress was the most significant, and the stress concentration coefficient reached 1.7, corresponding to the vertical stress coal seam cloud diagram illustrated in Figure 5. At this time, it was the basic top fracture, and the initial incoming pressure of the basic top occurred at the working face and the peak stress was closer to the working face. The peak stress occurred close to the working face and displayed the strongest incoming pressure. Excavation to 52 m from the opening and cutting eye produced a peak vertical stress of 15.4 MPa at 8 m in front of the coal seam working face. The peak stress increased, followed by a decline, indicating initial pressure completion and that the initial pressure step of the basic roof was around 52 m.
As shown in Figure 7, the stress concentration coefficient gradually increased to the basic top fracture as the vertical pressure of the coal seam working face approached a stress peak, followed by a decline. The maximum peak vertical stress at the coal seam working face was 19.35 MPa when the thick hard basic top was exposed to pressure for the first time, exceeding the 16.24 MPa stress value during the direct top collapse, producing a stress concentration coefficient of 1.7. The peak stress was closest to the working face, which was the primary cause of the strong mine pressure.

4.3. Numerical Simulation Validation

The actual 8106 Tashan coal measurements were employed to observe the hydraulic bracket’s working resistance in three areas of the working face, using the KJ216 online mine-pressure-monitoring system. As shown in Table 2, the initial basic roof pressure step of the 8106 working face was about 51.6 m, with a dynamic load coefficient of approximately 1.75, an average cycle pressure step of 18.69 m, and an average cycle pressure dynamic load coefficient of approximately 1.69. The initial pressure step of the numerical simulation was about 52 m, the dynamic load factor was about 1.69, the initial pressure step of the numerical simulation was about 52 m, the dynamic load factor was about 20 m, and there was an initial pressure step error rate of 0.07%, verifying the accuracy of the numerical simulation.

5. The Reasonable Fracture-Weakening Step of the Hard Top Ground

After the thick hard roof plate was weakened via fracturing, the load transferred from the upper roof plate block acted directly on the hard, thick pre-fractured block above the lower working face, forming a “pre-fractured broken hard roof plate—coal body—bracket” support system, as shown in Figure 8. Here, p represents the support strength of the working face, l denotes the breakage length of the pre-cracked roof, l 4 signifies the width of the stress increase zone below the pre-cracked roof, l 5 refers to the width of the limit balance zone, and l 6 denotes the support length.
The strength of the support at the working face was determined via a mechanical analysis as follows:
p = ( γ i h i + q ) ( 3 l 2 l 4 ) l k 1 γ h ( l l 6 ) 2 ( 6 l 3 l 6 2 l 4 ) l 6
  • γ i —refers to the volume mass of the rock layer above the working face.
  • h i —denotes the thickness of the rock layer above.
  • i —the overlying rock layer number.
  • γ —represents the average volume mass of the overlying rock.
  • k 1 and k 2 —denote the support pressure coefficients.
To explore the relationship between the brace support strength and the pre-cracking of the hard, thick roof layer at different widths in the coal stress increase area of the working face, the association between the predicted fracturing step and the support strength was determined via a correlation analysis of the support strength equation p , using the variable control method, as shown in Figure 9.
As shown in Figure 9, when the stress increase zone width was certain and the pre-fracturing length of the thick hard roof fracture was in a smaller value range, the brace support strength of the working face fluctuated significantly as the pre-fracture roof length decreased, indicating that the roof was unstable. When the support strength of the hydraulic support was 0.79 MPa [10] (common support strength), the pre-fracture length of the roof plate ranged between 13 m and 33 m. Considering the technical and economic factors of pre-fracturing and the selection conditions of the existing support, while taking into account the principles that the fracture cycle step should not exceed the cycle fracture step and that the amount of ground fracturing work should be minimized, the fracture distance of the roof plate fracturing was selected, since the spacing ranged from 13 m to 24 m.

6. The Numerical Simulation of the Prefabricated Fractures in Hard Top Slabs Using Ground Fracturing Technology

6.1. Establishing the Numerical Simulation

The hydraulic fracture weakening of a coal seam roof involves a fluid–solid coupling process using a porous medium. The fluid–solid coupling theory was combined with finite element numerical simulation software to establish the numerical mechanics model of the hydraulic fracturing and coal seam excavation, as shown in Figure 10. Specifically spaced vertical fractures were prefabricated in the basic roof plate to weaken it, followed by coal seam excavation.
(1) The other boundaries and loads were the same as the basic top initial pressure model in Section 3. (2) The Property module of the basic top increased the flow parameters of the fracturing fluid, including the permeability, pore ratio, fracturing fluid viscosity, and permeability coefficient, while the damage criterion remained unchanged. (3) The oil analysis step was added to the Step module, and the injection duration, nonlinear geometric parameters, incremental steps, and maximum pore pressure change value of each load step were set. This step represented the fracking injection stage simulation. (4) During the pump shutdown stage, displacement constraints were applied to the flow velocity at the initial damage location to simulate the supportive effect of the proppant on the crack. (5) The coal seam excavation and removal steps were performed at a top elastic modulus of 5.25 GPa, Poisson’s ratio of 0.24, a tensile strength of 9.36 MPa, a permeability coefficient of 1 × 10⁻⁷ m/s, a fracturing fluid viscosity of 1 × 10⁻¹⁴ mPa.S, a peak displacement of 0.02 m2/s, and a pore pressure of 20 MPa.
The previous section showed a reasonable fracture spacing between 13 and 24 m. Therefore, fracture spacings of 16 m, 20 m, and 24 m were selected for the prefabricated hydraulic fractures (as shown in Figure 11), while the breaking characteristics of the thick hard top plate and the law of mineral pressure action were calculated before and after the fracturing.
The physical and mechanical parameters of each rock formation, as well as the ground stress conditions, remained unchanged during the simulation, while the horizontal section of the fractured well was arranged parallel to the mining direction. This analysis showed that vertical cracks occurred in σ H < σ ν < σ h ground stress conditions. Where σ H is the maximum horizontal geostress, σ v is the vertical geostress, and σ h is the minimum horizontal geostress. The numerical model calculation included the following steps: (1) The boundaries and loads were the same as those for the initial basic top incoming pressure model in Section 3, as shown in Figure 4. (2) The Module Property of the basic top increased the seepage parameters of the fracturing fluid, including the permeability, porosity ratio, fracturing fluid viscosity, and permeability coefficient, with no change in the damage criterion. (3) A soil analysis step was added in the Step Module, and the injection duration, nonlinear geometric parameters, number of incremental steps, and magnitude of the maximum void pressure change per load were established. This analytical step simulated the hydraulic fracturing injection stage. (4) Displacement constraints were placed on the flow rate at the initial damage location during the pump stop phase to simulate proppant fracture support. (5) This step involved coal seam excavation removal. The fracturing parameters are shown in Table 3.

6.2. Analysis of the Numerical Calculation Results

The crack spacing was set at 16 m, 20 m, and 24 m, and the cloud map of the vertical ground stress distribution was calculated after a working face advancement to 24 m, as shown in Figure 12.
Three fractures with different fracture spacings were used for the basic top and the formation of fractures in the hydraulic fracturing stage formed damage in the basic top, with the coal seam mining top transport. When the working face advanced to 24 m, the basic top fractured at the first fracture surface, decreasing the initial basic top pressure step from 52 m to 24 m (Figure 13).
The peak stress was 19.35 MPa at the coal seam overworking face during the initial incoming pressure step at 52 m from the basic roof and 6 m from the working face. After fracturing, the peak vertical stress values were 14.25 MPa, 14.29 MPa, and 13.25 MPa at the coal seam working face at the 16 m, 20 m, and 24 m fracture spacings, while the peak stress occurred at 10 m, 8 m, and 6 m from the working face. Fracturing the top slab at the 16 m, 20 m, and 24 m fracture spacings weakened its integrity, while reducing the collapse step significantly decreased the vertical stress at the coal seam working face. The vertical stress of the coal seam peaked at 8 m and 10 m from the working face, at the fracture spacings of 20 m and 16 m, respectively, which were 2 m and 4 m further than the peak stress distances before the fracturing. Therefore, the fracture spacings of 16 m, 20 m, and 24 m significantly weakened the vertical stress at the coal seam working face when the top plate broke, while the degree of reduction remained mostly the same. However, the peak vertical stress occurred the furthest from the working face at the 16 m fracture spacing, while the top plate breaking pressure was the lowest, which was more conducive to safe mining practices.

7. Conclusions

(1)
The simulation results showed an initial hard top slab pressure step of about 52 m, with an error rate of 0.07% compared to the measured results, verifying the simulation’s accuracy.
(2)
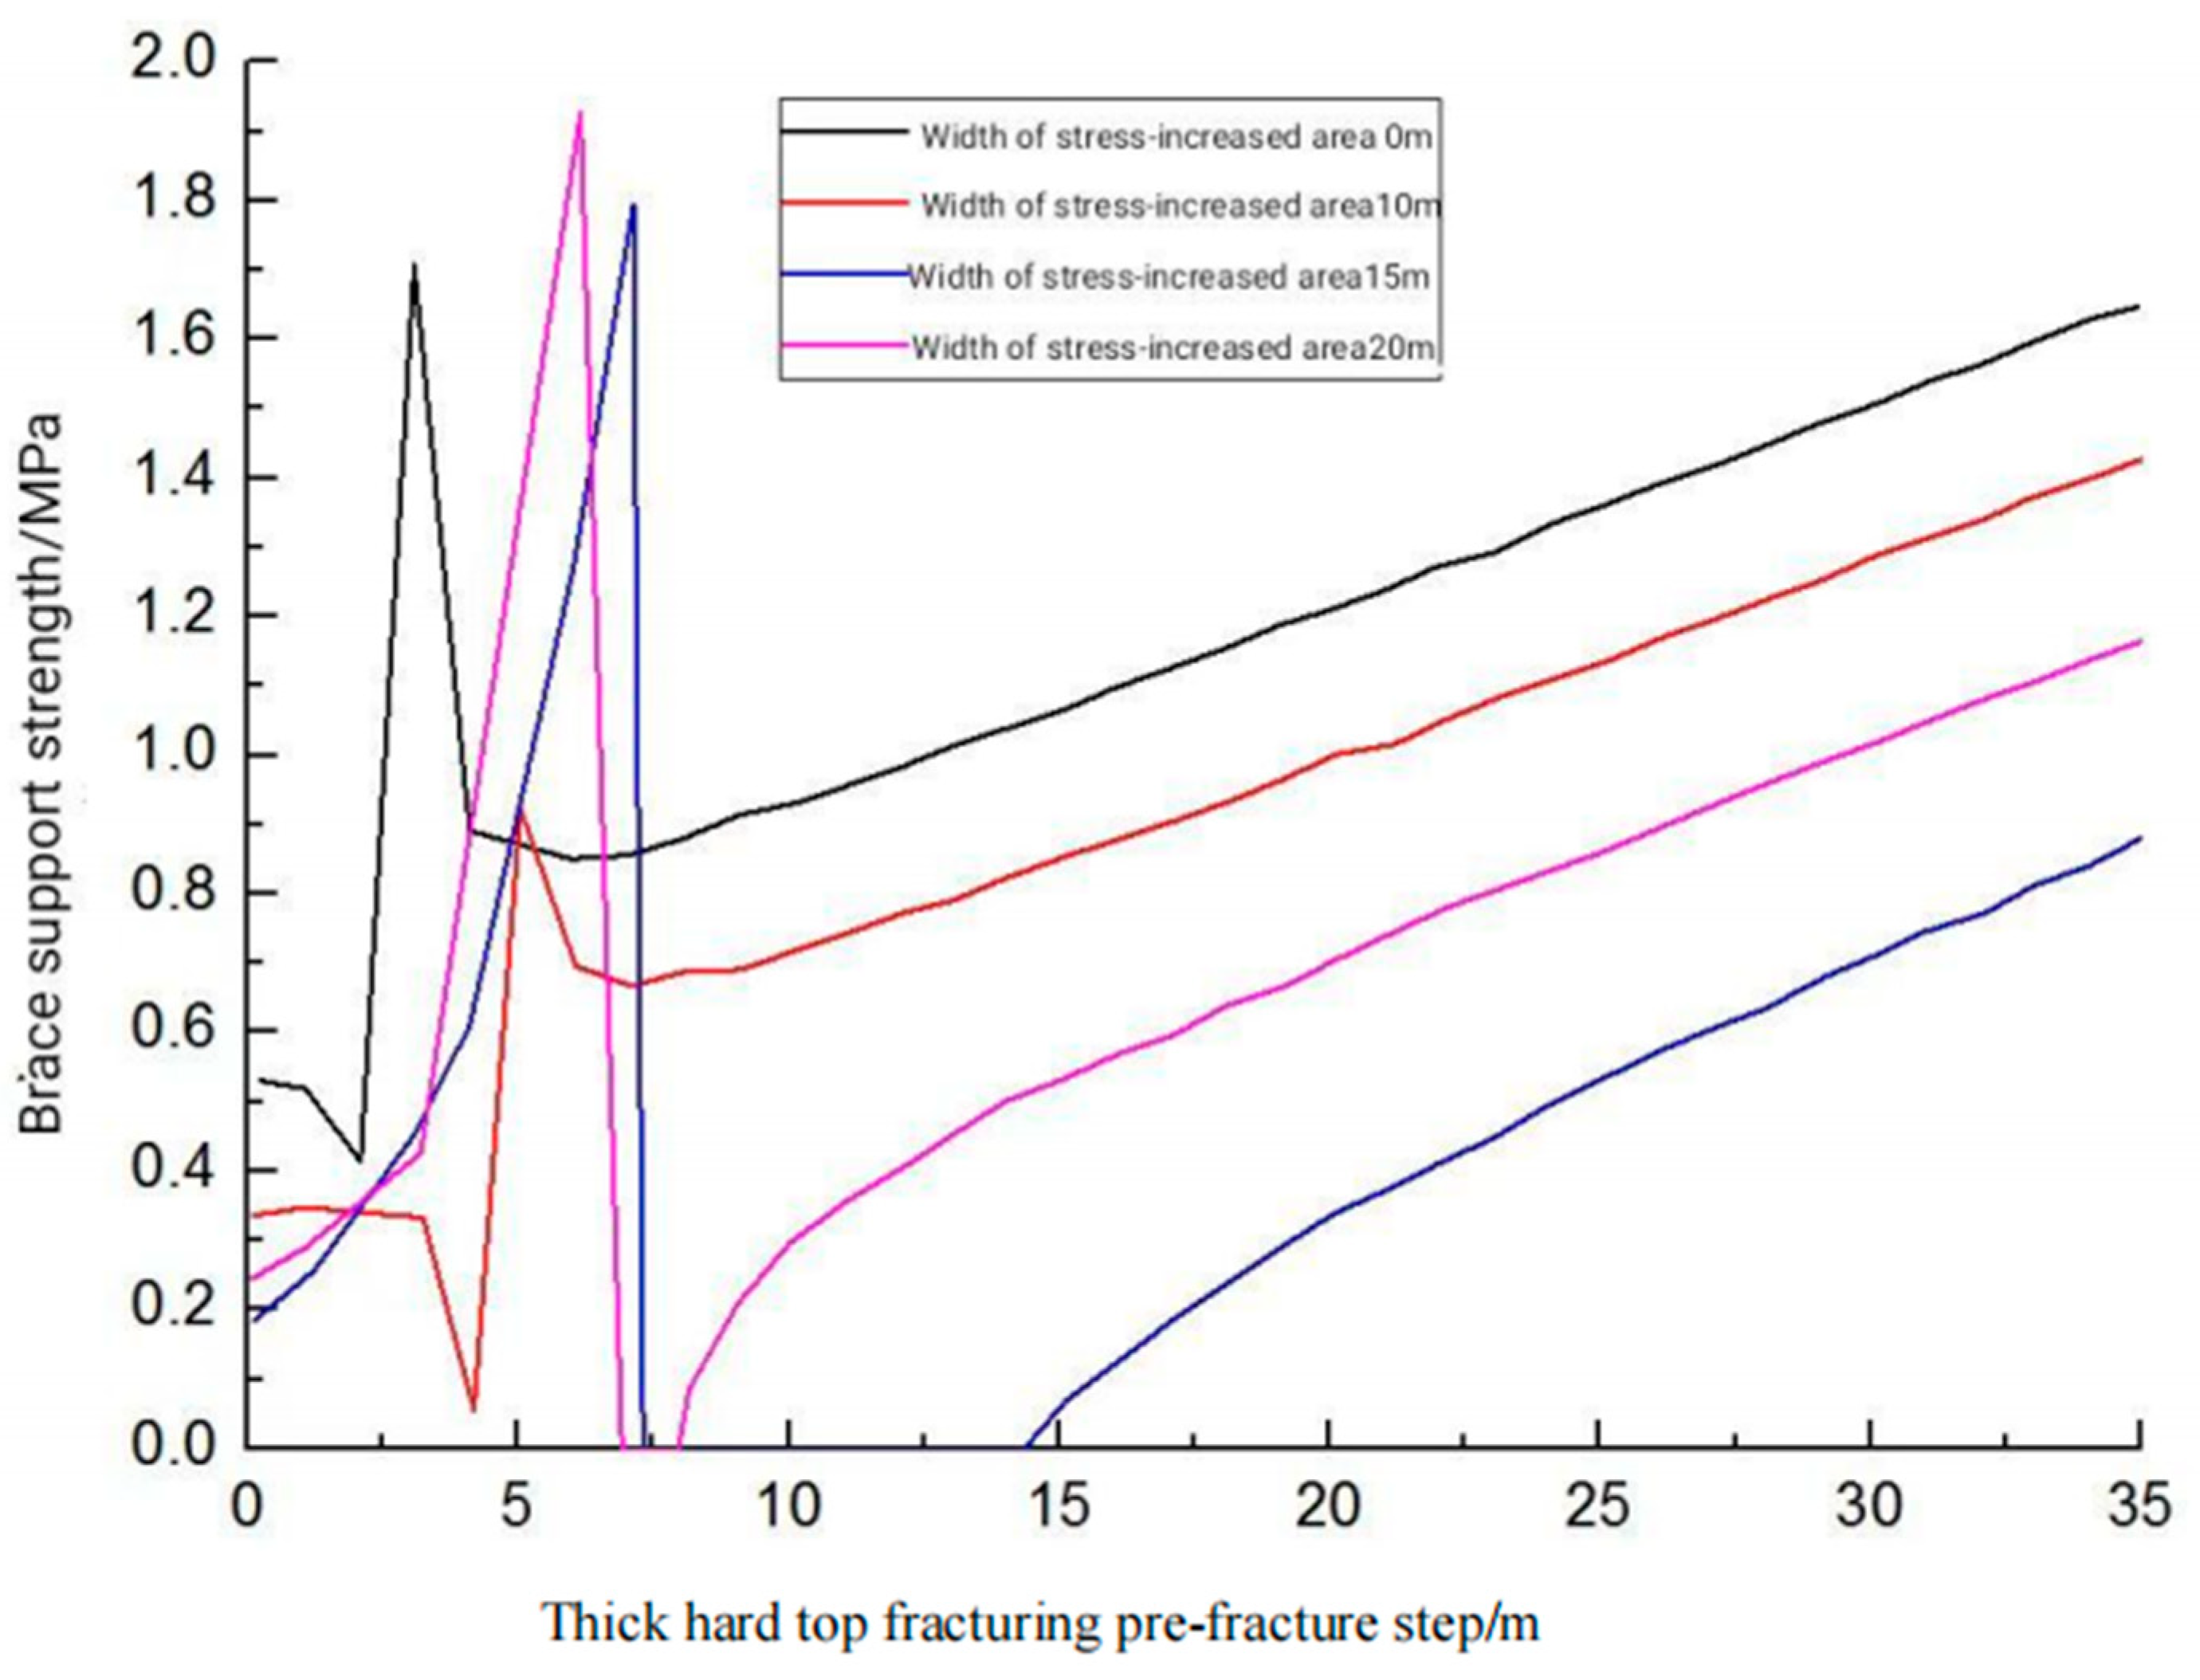
A correlation analysis of the support strength equation was conducted using the control variable method to determine the relationship between the fracture prediction step and the support strength, identifying a fracture spacing range of 13–24 m.
(3)
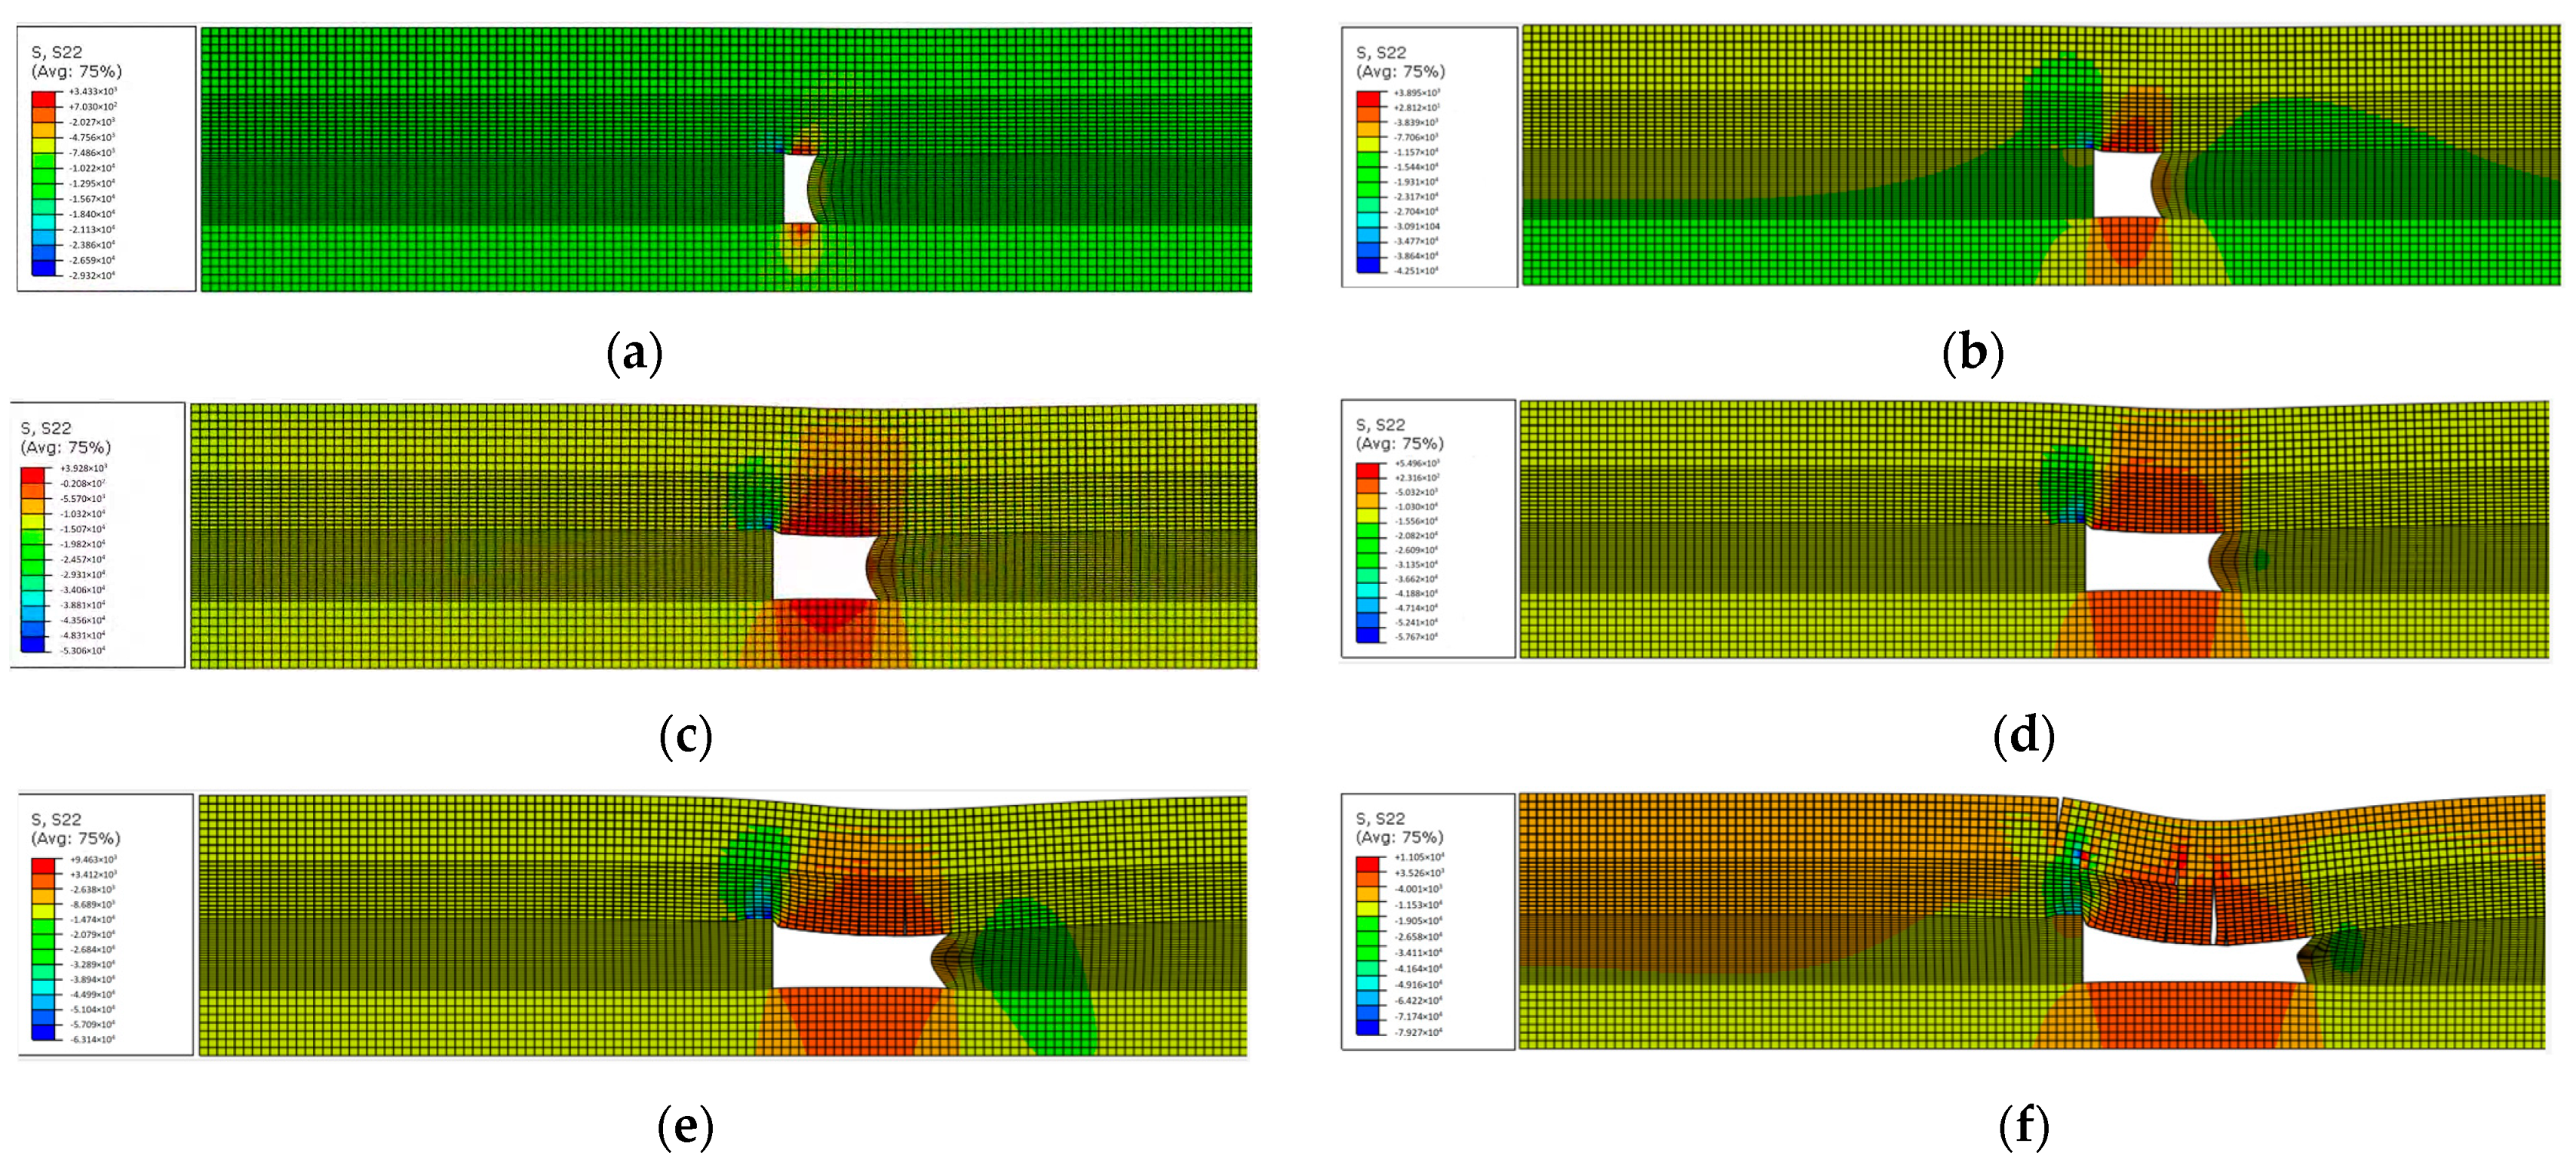
A combined coal seam excavation and hydraulic fracturing numerical model was established. Fracture spacings of 16 m, 20 m, and 24 m significantly weakened the vertical stress at the coal seam working face when the roof broke, while the degree of reduction was mostly the same. The peak vertical stress occurred the furthest from the working face at the 16 m fracture spacing. Therefore, the pressure from the broken roof had the least impact on the working face, which was more conducive to safe mining practices.

Author Contributions

Conceptualization, Y.W. and M.J.; methodology, Y.W.; software, X.Z. (Xinyu Zhao); validation, Y.W., X.Z. (Xinyu Zhao) and X.Z. (Xinrui Zhao); formal analysis, K.D.; investigation, X.Z. (Xinyu Zhao); resources, X.Z. (Xinrui Zhao); data curation, X.Z. (Xinrui Zhao); writing—original draft preparation, Y.W.; writing—review and editing, M.J.; supervision, K.D.; project administration, X.Z. (Xinyu Zhao); funding acquisition, K.D. All authors have read and agreed to the published version of the manuscript.

Funding

This research was funded by the National Key Research and Development Program of China grant number 2022YFE0206700.

Conflicts of Interest

The authors declare no conflict of interest.

References

  1. Peng, J.; Jin, Z.; Bai, X. Fully mechanized coal mining under hard roof and hard seam conditions in Datong mining area. Coal Sci. Technol. 2004, 2, 1–4. [Google Scholar]
  2. Yu, B.; Gao, R.; Meng, X.; Kuang, T. Instability of underground pressure and control technology for large and near field structures. Chin. J. Rock Mech. Eng. 2018, 37, 1–12. [Google Scholar]
  3. Song, Y. Control Method and Engineering Effect of Hard Roof in Datong Coal Mine. Coal Sci. Technol. 1991, 12, 18–22. [Google Scholar]
  4. Zhang, Y.; Zou, Y.; Zhang, Y.; Wang, L.; Liu, D.; Sun, J.; Ge, H.; Zhou, D. Experimental Study on Characteristics and Mechanisms of Matrix Pressure Transmission Near the Fracture Surface during Post-Fracturing Shut-In in Tight Oil Reservoirs. J. Pet. Sci. Eng. 2022, 219, 111133. [Google Scholar] [CrossRef]
  5. Wang, J.A.; Li, D.; Shang, X. Mechanics analysis of creep fracture of strong roof strata above mined-out area. J. Univ. Sci. Technol. Beijing 2011, 33, 142–148. [Google Scholar] [CrossRef]
  6. Yan, S.; Ning, Y.; Kang, L.; Shi, Y.; Wang, Y.; Li, Y. The mechanism of hydro breakage to control hard roof and its test study. J. China Coal Soc. 2000, 25, 32–35. [Google Scholar]
  7. Huang, B.X.; Cheng, Q.Y.; Liu, C.Y.; Wei, M.T.; Fu, J.H. Hydraulic fracturing theory of coal-rock mass and its technical framework. J. Min. Saf. Eng. 2011, 28, 167–173. [Google Scholar]
  8. Chen, D. Characteristics and control technology of dynamic pressure on hard roof under goaf. Coal Sci. Technol. 2014, 42, 125–128. [Google Scholar]
  9. Yu, B.; Zhu, W.; Gao, R.; Liu, J. Overlying strata structure and action mechanism of large space stope in fully-mechanized top coal caving in extra-thick coal seam. J. China Coal Soc. 2016, 41, 571–580. [Google Scholar]
  10. Liu, J. Study on the Movement Law and Control Technology of Hard Roof in Thick Coal Seam Mining at High Height. Master’s thesis, China University of Mining and Technology, Beijing, China, 2015. [Google Scholar]
  11. Yu, B.; Duan, H. Research on roof control technology of hydraulic fracturing in high-strength fully mechanized caving mining of extra thick coal seam. J. Rock Mech. Eng. 2014, 33, 778–785. [Google Scholar]
Figure 1. Downhole near-field topside hydraulic fracturing.
Sustainability 15 11285 g001
Figure 2. Weakening technology of the hard rock strata for ground far-field fracturing.
Sustainability 15 11285 g002
Figure 3. The effective stress schematic.
Sustainability 15 11285 g003
Figure 4. The mechanical calculation model of the old top-ground stress in the far field.
Sustainability 15 11285 g004
Figure 5. The vertical stress distribution of the coal rock body at different advancing distances. (a) The working face is advanced to 8 m; (b) The working face is advanced to16 m; (c) The working face is advanced to 24 m; (d) The working face is advanced to 32 m; (e) The working face is advanced to 40 m; and (f) The working face is advanced to 52 m.
Sustainability 15 11285 g005
Figure 6. The vertical stress folding diagram of the coal seam at different advancing distances.
Sustainability 15 11285 g006
Figure 7. The relationship between the advancing distance of the working face and the peak stress and stress concentration coefficient. (a) The relationship between the advancing distance of the working face and the peak stress; and (b) The relationship between the advancing distance of the working face and the stress concentration coefficient.
Sustainability 15 11285 g007
Figure 8. The pre-cracked, thick hard top support system.
Sustainability 15 11285 g008
Figure 9. The thick hard top pre-fracturing step.
Sustainability 15 11285 g009
Figure 10. The mechanical coal seam excavation and hydraulic fracturing model.
Sustainability 15 11285 g010
Figure 11. The 16 m crack initiation location.
Sustainability 15 11285 g011
Figure 12. The vertical stress after advancing the working surface to 24 m at different crack spacings. (a) The vertical stress after advancing the working surface to 24 m at a crack spacing of 16 m; (b) The vertical stress after advancing the working surface to 24 m at a crack spacing of 20 m; and (c) The vertical stress after advancing the working surface to 24 m at a crack spacing of 24 m.
Sustainability 15 11285 g012
Figure 13. The vertical stress in the coal seam at different fracture spacings.
Sustainability 15 11285 g013
Table 1. The physical and mechanical parameters of the coal rock body at the Tashan 8106 working face.
LithologyThickness/mModulus of Elasticity/MPaPoisson’s RatioCohesion/MPaAngle of Internal Friction/°Tensile Strength/MPa
Main roof15.1152,5000.2411.3034.229.36
Immediate roof12.5220,0000.204.50404.5
Coal seams1610,5000.221.20383.3
Baseboard13.7412,5000.163.20203.4
Table 2. The characteristics of the incoming pressure at the 8106 working face.
Working Surface LocationFirst Time to Press the Step Distance/mInitial Incoming Dynamic Load FactorAverage Period to Pressure Step/mAverage Period to Ballast Load FactorWorking Surface Location
11#51.61.5922.31.58 11#
22#51.61.8522.31.65 22#
Machine head33#51.61.8221.81.66Machine head33#
44#51.61.6822.01.59 44#
55#51.61.3620.61.36 55#
Middle66#51.61.5420.71.59Middle66#
77#51.61.7520.61.82 77#
88#51.61.8218.91.81 88#
99#51.61.9518.81.89 99#
Tail110#51.62.1818.91.95Tail110#
Average51.61.7520.691.69Average
#—stands for stratum substratum number.
Table 3. The basic top hydraulic fracturing parameters.
Fracturing ParametersBasic top Modulus of Elasticity/GPaPoisson’s RatioTensile Strength/MPaPermeability Coefficient/m/sFracturing Fluid Viscosity/mPa.sPeak Displacement m2/sPore Pressure/MPa
Numerical value5.250.249.361 × 10−71 × 10−140.0220
Disclaimer/Publisher’s Note: The statements, opinions and data contained in all publications are solely those of the individual author(s) and contributor(s) and not of MDPI and/or the editor(s). MDPI and/or the editor(s) disclaim responsibility for any injury to people or property resulting from any ideas, methods, instructions or products referred to in the content.

