Article

Sustainability Assessment of Steel Industry in the Belt and Road Area Based on DPSIR Model

1
School of Earth Sciences and Resources, China University of Geosciences (Beijing), Beijing 100083, China
2
Chinese Academy of Natural Resources Economics, Beijing 101149, China
*
Author to whom correspondence should be addressed.
Sustainability 2023, 15(14), 11320; https://doi.org/10.3390/su151411320
Submission received: 29 June 2023 / Revised: 16 July 2023 / Accepted: 19 July 2023 / Published: 20 July 2023

Abstract

:
The steel industry in the Belt and Road region holds significant potential for development, and the systematic evaluation of its sustainable development capacity serves as a crucial foundation for improving the investment environment in the steel industry. This study focuses on the driving forces, pressures, current status, impacts, and policy responses of the steel industry, constructing an evaluation model for the sustainable development of the steel industry in the Belt and Road region. Using this model, the sustainable development capacity of the steel industry (SCSI) in 65 countries along the Belt and Road is assessed. The results indicate the following: (1) The SCSI index in the Belt and Road region has significantly increased from 18.050 in 2000 to 22.873 in 2021. (2) Since 2005, the factors influencing the spatial differentiation of SCSI in the Belt and Road region have generally followed the pathway of “industrial infrastructure → innovation environment → global governance capacity → per capita GDP,” with domestic economic level and domestic demand exerting a substantial promoting effect on the steel industry. (3) The regional differences in SCSI within the Belt and Road region are the combined result of multiple factors, with significant composite influences from indicators such as per capita GDP, population size, industrial infrastructure, and innovation environment. To further enhance the sustainable development of the steel industry along the Belt and Road, it is necessary for each country to formulate appropriate development plans based on local conditions, emphasizing strengthened international cooperation, optimized international investment environment, enhanced policy support, and improved technological level in the steel industry.

1. Introduction

1.1. Research Background

Steel is the foundation of human industrialization and plays a crucial role in supporting economic construction and social development. However, the production process of steel generates a series of negative phenomena, such as water scarcity and air pollution [1], which in turn hinders the sustainable development of human society [2,3]. The sustainable development capacity of the steel industry (SCSI) is influenced by various factors, including economic level, environmental pressure, industrial status, infrastructure, and policies, which vary across different countries [4]. China accounts for 55.3% of global steel production, facing severe overcapacity issues that affect industrial structural upgrades and the profitability of enterprises. The Chinese government has attached great importance to controlling steel production capacity and has implemented a series of policies and strategic deployments to eliminate outdated capacity and improve industrial structure. Controlling steel production capacity will remain a key focus of the Chinese government’s work for a considerable period [5,6]. The Belt and Road region represents 63.3% of the global population and has significant potential for steel consumption. Promoting the transfer of China’s steel industry chain to the Belt and Road region is an effective way to address China’s overcapacity issues. Systematically evaluating the sustainable development level of the steel industry in the 65 countries along the Belt and Road, and analyzing the changes in driving factors, has important reference value for the government in formulating steel industry development decisions.
In this context, the objective of this research is to examine the sustainable development of the steel industry in the Belt and Road region, revealing regional differences and spatial characteristics. It aims to explore the primary factors influencing the sustainable development of the steel industry and their interactions. Furthermore, this study aims to propose improvement measures and policy recommendations specific to the steel industry in the Belt and Road region, with the aim of enhancing the investment environment, guiding industry transformation, and promoting sustainable development within the region.

1.2. Literature Review

The capacity for sustainable development of an industry in a specific region refers to its ability and limitations to accommodate a particular industry, considering the natural environment, mineral resources, economic foundations, and policy constraints. The study of industrial sustainable development can be traced back to the 1950s, originating from the fields of resource economics and environmental economics. Initially, researchers primarily focused on the sustainable utilization of resources and environmental capacity, exploring the balance between resource development and environmental protection [7,8]. In the 1970s, significant progress was made as the concept of industrial sustainable development was introduced into the fields of regional economic development and regional planning [9]. In the 1990s, research on industrial sustainable development gradually formed some theoretical frameworks. Researchers such as Arcos, J (1990) [10], Rees (1992) [11], and Rees, W. (1996) [12] started to pay attention to the multidimensionality and systemic nature of industrial sustainable development, proposing comprehensive assessment methods that encompass economic, social, and environmental factors. In the 21st century, research on industrial sustainable development has been extensively applied in practical applications. Researchers such as Matooane, L. (2001) [13], Wang, W. (2013) [14], Gao, T. (2014) [15], and Zhou X Y (2017) [16] have applied it to areas such as urban planning, industrial development policies, resource management, and environmental protection while attempting to develop specific evaluation indicators and methods.
In recent years, with the widespread dissemination of the concept of sustainable development, researchers such as Niu, F. (2020) [17] and Gao, Q. (2021) [18] have closely associated industrial sustainable development with the objectives of sustainable development. They emphasize the need for the coordinated development of industrial sustainable development with the economy, society, and environment and explore how industrial transformation and innovation can drive sustainable development. Current research primarily focuses on the following areas. Firstly, researchers focus on defining and establishing a theoretical framework for industrial sustainable development, aiming to explore its concepts, essence, and theoretical foundations. The objective is to provide a clear understanding of the scope and boundaries of the research while establishing a unified theoretical basis. Secondly, there is an examination of regional disparities and spatial patterns. Scholars such as Lu, W. (2021) [19], Liu, Y. (2021) [20], Paiva, T. (2022) [21], and Chai, N. (2022) [22] compare the levels and differences of industrial sustainable development among different regions or countries. They uncover the developmental disparities and patterns between different regions involving the analysis and comparison of factors such as industrial structure, economic development level, resource endowment, and policy environment. Thirdly, there is a focus on sustainable development and environmental impacts. Researchers such as Sun, J. (2022) [23], Yu, W. (2022) [24], and Luo, H. (2022) [25] examine the relationship between industrial sustainable development and overall sustainability. Their aim is to achieve a harmonious and coordinated development of society, economy, and environment throughout the process of industrial growth. The research also examines the environmental impacts of industrial activities, such as resource consumption and pollution emissions, in order to provide corresponding environmental management and policy recommendations. Fourthly, there is an emphasis on policy formulation and planning. Scholars such as Wang, R. (2017) [26], Zhao, L. (2020) [27], and Zhao, Y. (2021) [28] provide scientific evidence and recommendations to governments and decision makers in their research on industrial sustainable development. They contribute to the formulation of industrial policies and plans, primarily involving aspects such as the positioning of industrial development, optimizing industrial structure, promoting innovation and technological progress, and cultivating talents. Fifthly, there is a focus on industrial transformation and upgrading. With changes in the economic environment, researchers such as Zhang, M. (2018) [29], Yang, J. (2018) [30], and Tong, S. (2023) [31] examine the impact of industrial transformation and upgrading on industrial sustainable development. They study how to address the challenges brought by industrial structural adjustments and transformations and promote the upgrading and development of traditional industries. Finally, there is an examination of regional cooperation and competition. Scholars such as Jiming, H. (2017) [32], Chen, Y. (2021) [33], and Tan, F. (2023) [34] focus on the role of industrial sustainable development in regional cooperation and competition. They investigate industrial cooperation and coordinated development among different regions, explore cooperation mechanisms, optimize regional resource allocation, and industrial chains, with the aim of promoting the mutual enhancement of industrial sustainable development. These research efforts collectively contribute to a comprehensive understanding of industrial sustainable development and its close relationship with sustainable development. They facilitate the formulation of evidence-based policies and strategies for industrial advancement.
In summary, the research on industrial sustainable development has evolved from the perspectives of resource economics and environmental economics to the perspectives of regional development and sustainable development. Researchers have gradually recognized that industrial sustainable development involves not only issues of resource utilization and environmental capacity but also the comprehensive goals of economic growth, social equity, and environmental protection. Therefore, the study of industrial sustainable development has evolved from single indicators and single-field research to a multidimensional and comprehensive research direction. Additionally, the research on industrial sustainable development has expanded and deepened in terms of methods and applications. In terms of assessment methods, researchers have progressed from initial single-indicator assessments to comprehensive indicator systems and multidimensional evaluation methods, aiming to consider all aspects of industrial sustainable development more comprehensively. In terms of applications, researchers have integrated the study of industrial sustainable development with regional planning, policy formulation, and sustainable development management, providing important references and guidance for governments and decision makers.
Overall, previous research has made commendable progress in assessing industrial sustainable development, contributing significantly to the advancements of theory and practical applications. However, certain limitations remain in the existing literature. Firstly, the majority of studies have focused on specific provinces or countries, with limited attention given to investigating the sustainable development of industries within the Belt and Road region. Secondly, the research has predominantly centered around sectors such as agriculture, industry, and strategic emerging industries, with little emphasis on the study of the steel industry. Additionally, while some scholars have explored spatial variations in industrial sustainable development, there is a lack of research examining the influencing factors of spatial changes in sustainable development, specifically within the steel industry along the Belt and Road.

1.3. Research Innovation and Content

This study offers notable contributions and innovations in several aspects. Firstly, it establishes an evaluation indicator system for assessing the sustainable development of the steel industry, thereby enhancing both theoretical and practical understanding of industrial sustainability. Secondly, it conducts a comprehensive assessment of the SCSI across 65 countries in the Belt and Road region, providing valuable insights into the spatial patterns of regional SCSI and offering decision-making guidance for investments in the steel industry. Thirdly, leveraging geographic detectors, this study investigates the influencing factors of the Belt and Road SCSI, elucidating the interactive relationships among the driving forces and serving as a foundation for enhancing the industrial environment in the Belt and Road region.
The remaining sections of this paper are organized as follows:
Section 2 presents the methodology and data sources used in this study.
Section 3 conducts a spatial analysis of the Belt and Road region’s SCSI.
Section 4 analyzes the factors influencing the differences in SCSI within the Belt and Road region.
Section 5 provides the conclusion, recommendations, and discussion.

2. Model Construction and Research Methods

2.1. Model Construction

2.1.1. SCSI Logic Based on DPSIR Model

The steel industry, as a complex system encompassing multiple factors, such as the environment, economy, and society, requires the construction of a comprehensive, relevant, and scientific indicator system for quantitative analysis. In 1997, the European Environment Agency (EEA) proposed the DPSIR model, which aims to comprehensively analyze environmental issues and their relationship with social development. This model provides a framework for evaluating the sustainable development of the steel industry.
The DPSIR model is a conceptual framework that describes the evolution and feedback mechanisms between industrial development and influencing factors within a complex system [35,36,37]. Based on the DPSIR model, the SCSI evaluation indicator system for the steel industry describes the following causal relationships: driving forces of latent demand → pressures on the natural environment system → state of the steel industry → impacts resulting from the development of the steel industry → responses made by humans to cope with pressures and impacts. This can be expressed as follows: long-term driving forces (D) such as urbanization, population consumption demands, and economic growth promote the development of the local steel industry, while the side effects generated by the steel industry’s production processes create pressures (P) on the natural environment, leading to changes in the state of the steel industry (S). The sustained changes in the state of the steel industry (S), in turn, have impacts (I) on human society, prompting human responses (R) to the changes in the state (S), and these responses (R) interact with driving forces (D), pressures (P), and states (S).
Driving (D) includes social development, economic construction, and human demand. Pressures (P) encompass pollution emissions and resource consumption. The state (S) involves aspects such as steel production and steel imports. Impacts (I) comprise industrial development and infrastructure construction related to the steel industry. Responses (R) refer to policy or technological reactions made by decision makers to address undesirable impacts. The model framework is illustrated in Figure 1.
The evaluation of sustainable development capacity in the steel industry based on the DPSIR model offers comprehensive and well-structured advantages, providing an integrated evaluation framework and decision support. However, this model has two limitations. First, at the data level, the model requires a substantial amount of panel data to support its construction, necessitating consideration of data availability and continuity during the model-building process. Second, the subjectivity of evaluation arises from the subjective judgments involved in determining the evaluation criteria of the DPSIR model, potentially leading to subjective evaluation results. To overcome these limitations, this study establishes a scientifically sound evaluation indicator system and employs the entropy weight and coefficient of variation methods to obtain objective weights, aiming for objectivity and accuracy in the results.

2.1.2. Evaluation Index Selection

To objectively and scientifically assess the SCSI of the 65 countries along the Belt and Road, this study adopts the DRSIR model. Building upon the works of Mirchi, A. (2012) [38], Wang, Y. (2018) [39], Xing, K. (2021) [40], and others and considering the characteristics of the steel industry and data availability, a set of 20 indicators is selected to establish the SCSI evaluation index system (Table 1). In the table, the attribute “+” indicates that a higher value of the indicator is more favorable, while “−” indicates that a lower value is more favorable.
The selection of indicators in this study is based on the following principles. Firstly, relevance; the chosen indicators are closely related to the sustainable development of the steel industry. These indicators cover multiple dimensions, including economy, environment, society, and institutions, allowing for a comprehensive assessment of the sustainability of the Belt and Road region’s steel industry. Secondly, importance; the selected indicators hold significant value in evaluating the sustainable development of the steel industry. They reflect key factors, such as national economic development, resource utilization, environmental impact, industrial structure, technological innovation, and policy environment, aiding in a comprehensive understanding and evaluation of the industry’s sustainability. Thirdly, data availability; consideration was given to the accessibility of data when selecting indicators. Ensuring sufficient data availability supports accurate evaluation via the calculation and analysis of indicators. Lastly, drawing on previous research, we referenced the achievements and experiences of relevant studies [21,27,38,39,40] and, in combination with the characteristics of the steel industry, selected indicators suitable for evaluating the sustainable development of the steel industry in the Belt and Road region. This approach allows us to build upon existing research foundations, ensuring the scientific rigor and reliability of the evaluation system. The specific approach to setting and selecting indicators is described as follows.
Dimension of Drivers (D): This dimension focuses on factors related to national economic and social development. Indicator selection primarily considers factors such as economic growth, population size, urbanization level, and macro-policy environment, as these factors significantly influence steel demand and industry development.
Dimension of Pressures (P): This dimension focuses on the environmental and resource pressures of the steel industry. Indicator selection primarily considers factors such as greenhouse gas emissions, water resource pressure, air pollution, and the degree of water scarcity to assess the environmental and resource sustainability of the steel industry.
Dimension of Status (S): This dimension focuses on the current state and supply capacity of the steel industry. Indicator selection encompasses factors such as the steel production volume, level of primary steel shortage, degree of shortage of iron and steel products, and advantages in steel import volume to measure production levels and supply–demand conditions within the steel industry.
Dimension of Influences (I): This dimension focuses on factors influencing the development of the steel industry. Indicator selection includes factors such as the degree of industrial emphasis, electrification rate, industrial infrastructure, and the proportion of medium and high-tech industries to evaluate technological innovation, industrial structure, and development priorities within the steel industry.
Dimension of Responses (R): This dimension focuses on the response capacity of governments and enterprises toward the sustainable development of the steel industry. Indicator selection covers factors such as sewage treatment level, research and innovation environment, and economic freedom to assess environmental management, technological innovation, and policy environment within the steel industry.
From these considerations, we have established a set of 20 indicators as the BCSI evaluation index system for evaluating the sustainable development of the Belt and Road region’s steel industry. These indicators provide comprehensive information, enabling decision-makers and researchers to understand the current status and development trends of the steel industry in the Belt and Road region and offering a scientific basis for formulating relevant policies and measures.

2.2. Research Methods

2.2.1. Comprehensive Weighting

The entropy weight method is a multi-criteria weighting method based on information entropy theory. It is known for its objectivity, comprehensiveness, and convenience in determining the weights of multiple indicators [19,25]. The specific steps of the entropy weight method are outlined as follows.
(1) Index normalization: Let us assume the original matrix is denoted as X =   x i j m × n , where m represents the number of countries, and n represents the number of indicators. Here, x i j represents the original data for the i-th country and the j-th indicator. To account for both positive and negative indicators, separate normalization procedures are applied, resulting in a standardized matrix denoted as Y = y i j m × n after the processing. The specific formula for achieving this normalization is as follows:
X = x 11 x 1 n x m 1 x m n
y i j = x i j m i n ( x i j ) max x i j m i n ( x i j )   ( for positive indicators )
y i j = max x i j   x i j max x i j m i n ( x i j )   ( for negative indicators )
Y = y 11 y 1 n y m 1 y m n
(2) To determine the weight of each index, we employ the entropy weight method, which involves calculating the index weight based on the normalized matrix Y. Prior to applying the entropy weight method, the matrix Y is first normalized to obtain the matrix f i j . This normalization process ensures that all indicators are on a comparable scale. The calculation formula for obtaining the normalized matrix is as follows:
f i j = y i j j = 1 m y i j
Next, we proceed to calculate the information entropy, denoted as e i , which plays a crucial role in the entropy weight method. The information entropy quantifies the diversity and uncertainty within each indicator. By capturing the dispersion of the data, it allows us to effectively evaluate the importance of each indicator. The calculation formula for determining the information entropy is as follows:
e j = 1 l n m i = 1 m f i j × l n f i j
Lastly, we calculate the weight of each index, denoted as ω j , which represents the relative importance of the indicators within the entropy weight method. This weight calculation step allows us to assign appropriate weights to each indicator based on their respective contributions. The calculation formula for obtaining the index weight is as follows:
ω j = 1 e j j = 1 n ( 1 e j )
The coefficient of variation method provides valuable insights into the spatial disparities in Sustainable Composite Sustainable Development Index (SCSI) levels across countries along the Belt and Road region. This method allows us to effectively capture and quantify the variations in SCSI levels among different regions. The calculation formula for determining the weights using the coefficient of variation method is as follows:
C = 1 R 0 1 m i = 1 m ( R I R 0 ) 2
ω j = C j = 1 n C  
In the formula, C is the coefficient of variation, R 0 is the average value of the j-th index, R i is the original value of the j-th index, and ω j is the weight of the j-th index. The formula for calculating the combined weight ω j is as follows (Table 2):
ω j = ω j + ω j 2
(3) TOPSIS model
To ensure objectivity, this paper establishes a normalized analysis matrix C = ω j × x i j m × n based on the assigned index weights ω j . The positive ideal solution Z+ and the negative ideal solution Z represent the maximum and minimum values, respectively, for the i-th index. The specific formula for constructing the normalized analysis matrix is as follows:
Z + = m a x y i j
Z = m i n y i j
(4) SCSI index
In this study, the Euclidean distance is employed to measure the specific distance between the SCSI evaluation index and the positive and negative ideal solutions. D+ represents the distance between the i-th index and Z + , while D denotes the distance between the i-th index and Z . D serves as the overall index for SCSI. It is worth noting that larger values indicate a more secure position. The calculation formula for determining the Euclidean distance is as follows:
D i + = j = 1 n ( Z i + y i j ) 2
D i = j = 1 n ( Z i y i j ) 2
D = D j D j + + D j  

2.2.2. Spatial Autocorrelation Analysis

Spatial autocorrelation analysis is a statistical method used to explore spatial dependence and spatial patterns in geographic data, indicating the presence of associations between a particular region and its neighboring regions [41]. In this study, both global Moran’s I and local Moran’s I methods were employed to investigate the spatial clustering of SCSI levels among the 65 countries along the Belt and Road. The calculation formulas are as follows:
I = i = 1 n j n ω i j ( x i x ¯ ) / ( x j x ¯ ) S 2 i = 1 n j = 1 n ω j
Within the formula, the global Moran index (I) is utilized, which falls within the range of [−1, 1]. A positive value of I (>0) indicates spatial aggregation in the regional SCSI, while a negative value of I (<0) suggests spatial dispersion and spatial differences. The variables used in the formula are as follows: N represents the number of countries, i and j represent different spatial units, x represents the closeness of SCSI, x ¯ represents the average value of SCSI in each province, S2 represents the variance of SCSI, and ω i j represents the spatial weight matrix. In this study, if the spatial units are adjacent, ω i j is assigned a value of 1; otherwise, it takes a value of 0.

2.2.3. Geodetector

The geographical detector is a spatial statistical tool used to detect spatial variations of phenomena and reveal the underlying driving factors [42]. The core theory of the geographical detector states that if an explanatory variable significantly influences the spatial variation of a response variable, then there should be a significant spatial similarity between the distribution patterns of the explanatory and response variables. In this study, we utilized the geographical detector model to explore the underlying driving factors behind the spatiotemporal variations observed in the SCSI across 65 countries along the Belt and Road region. The specific formula is as follows:
q = 1 1 N σ 2 h = 1 L N h σ h 2
Within the formula, q represents the correlation index of the SCSI, with a value range of [0, 1]. A higher value of q indicates a stronger impact of the driving factor on the SCSI. Additionally, h represents the classification number of the driving factor, N denotes the number of provincial units, and σ2 represents the variance of SCSI in each country.
By incorporating the correlation index (q) in our analysis, we can assess the degree of influence that the driving factors have on the SCSI. A higher value of q implies a more significant impact, highlighting the driving factors that play a crucial role in shaping the SCSI. The inclusion of the classification number (h) allows us to categorize and differentiate the driving factors based on their characteristics. Furthermore, considering the variance of SCSI (σ2) in each country provides insights into the level of variation and dispersion within the studied context.

2.3. Data Sources

The research area selected for this study includes 65 countries in the Belt and Road region (excluding Palestine due to missing data). The data used in this study are sourced from the United Nations Commodity Trade Database, World Bank, Environmental Performance Index (EPI), Sustainable Development Goals (SDGs), World Steel Association, United Nations Commodity Trade Database, and Economic Freedom Index. For missing or unavailable data from certain years, interpolation methods were used to supplement the calculations.

3. Spatial-Temporal Changes of Inter-Provincial SCSI in the Belt and Road

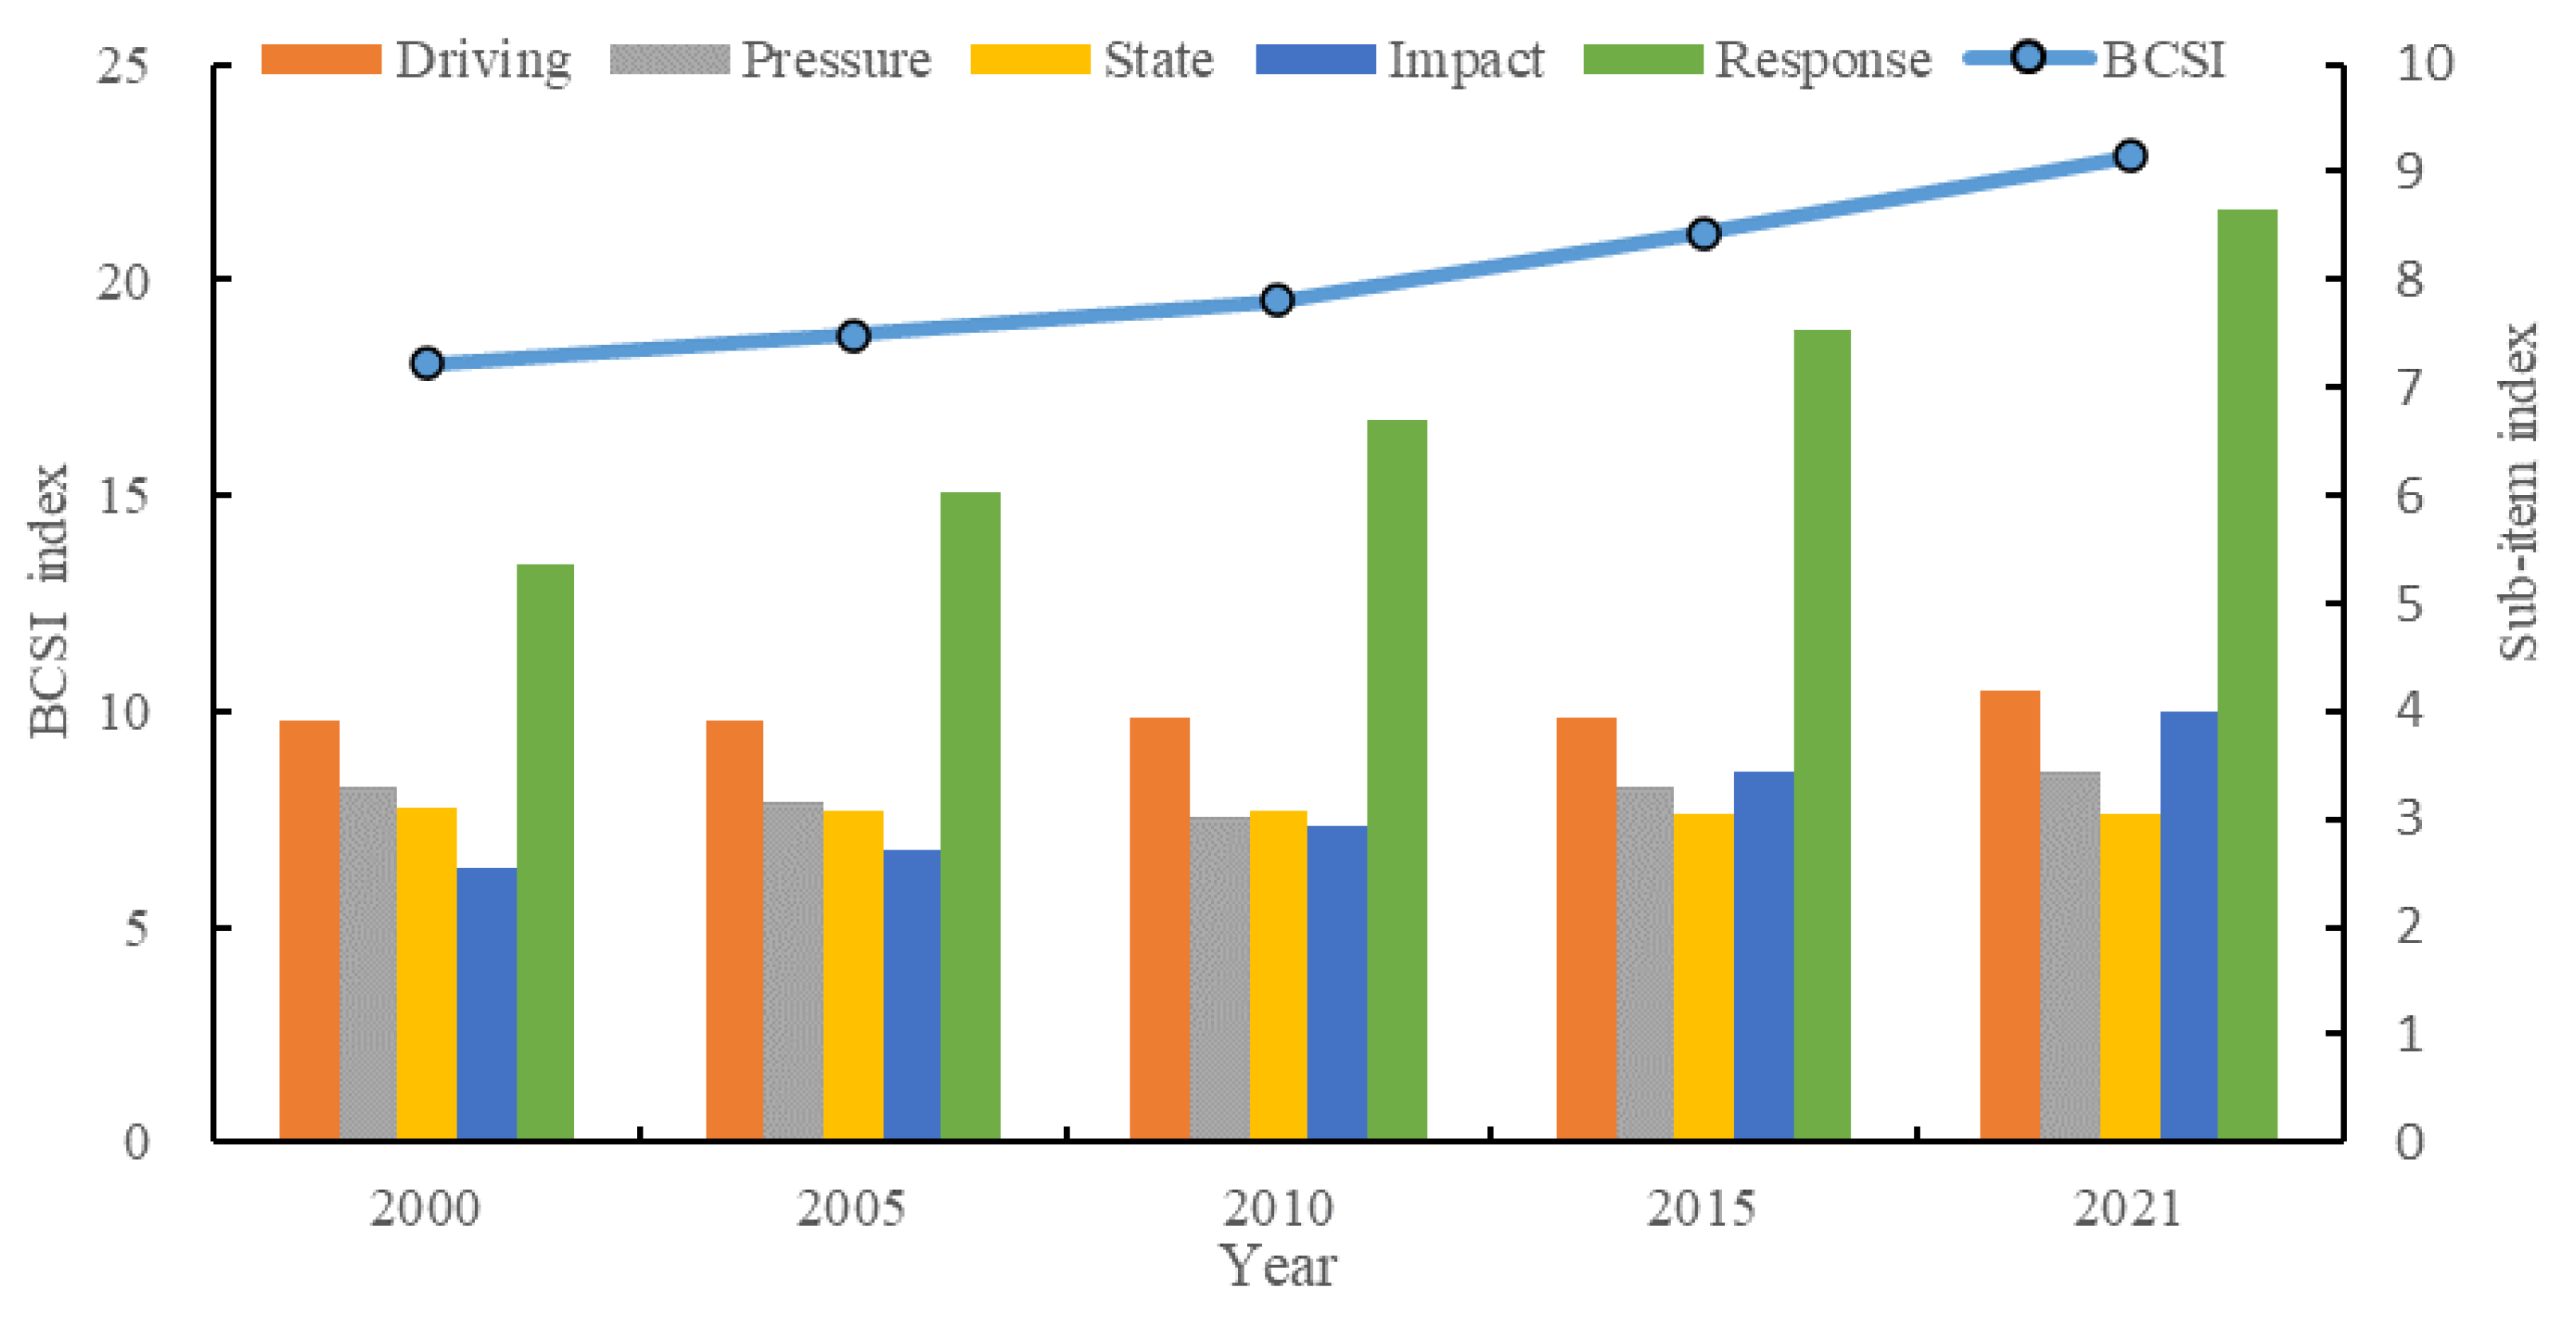
3.1. Time Change Analysis of SCSI in the Belt and Road

Measuring the Steel Industry Carrying Capacity Index (SCSI) of the 65 countries in the Belt and Road region from 2000 to 2021 using the combined weighted TOPSIS method. As shown in Figure 2, the SCSI level in the Belt and Road region has steadily increased from 2000 to 2021, reaching its highest value of 22.87 in 2021, representing a growth of 26.7% compared to 2000. Examining the five sub-indicators of the SCSI in the Belt and Road region, the Response (R) and Influence (I) indices have shown the fastest growth, increasing by 61.0% and 57.3%, respectively, since 2000. This indicates that the region has gradually improved its investment environment and increased its capacity for research and innovation, as well as implemented practical measures to improve infrastructure. It is worth noting that the Pressure (P) and State (S) indices in the Belt and Road region have increased by 4.1% and −2.1%, respectively, indicating that overall environmental improvement in the region is not significant and there has been no major change in the steel industry as a whole.
Table 3 presents the SCSI index for Belt and Road countries in the years 2000, 2005, 2010, 2015, and 2021. It can be observed that in 2021, countries such as China, India, Singapore, Estonia, Latvia, Slovenia, Poland, and the Czech Republic had higher SCSI scores compared to other countries. On the other hand, countries like Bangladesh, Syria, Iraq, Laos, and Turkmenistan had generally lower SCSI scores. Since 2000, the SCSI scores have significantly improved for the majority of the 64 Belt and Road countries, with only Tajikistan, Mongolia, Moldova, and Singapore experiencing a slight decrease in their SCSI scores. Among the 60 countries, Qatar, Montenegro, Iran, Serbia, Malaysia, Bosnia and Herzegovina, Bulgaria, and Afghanistan had SCSI score increases exceeding 50%, ranking high in terms of regional growth. Conversely, Israel, Cambodia, Kuwait, Turkmenistan, Syria, Kyrgyzstan, and Bangladesh had SCSI score increases below 10%, indicating lower growth rates.

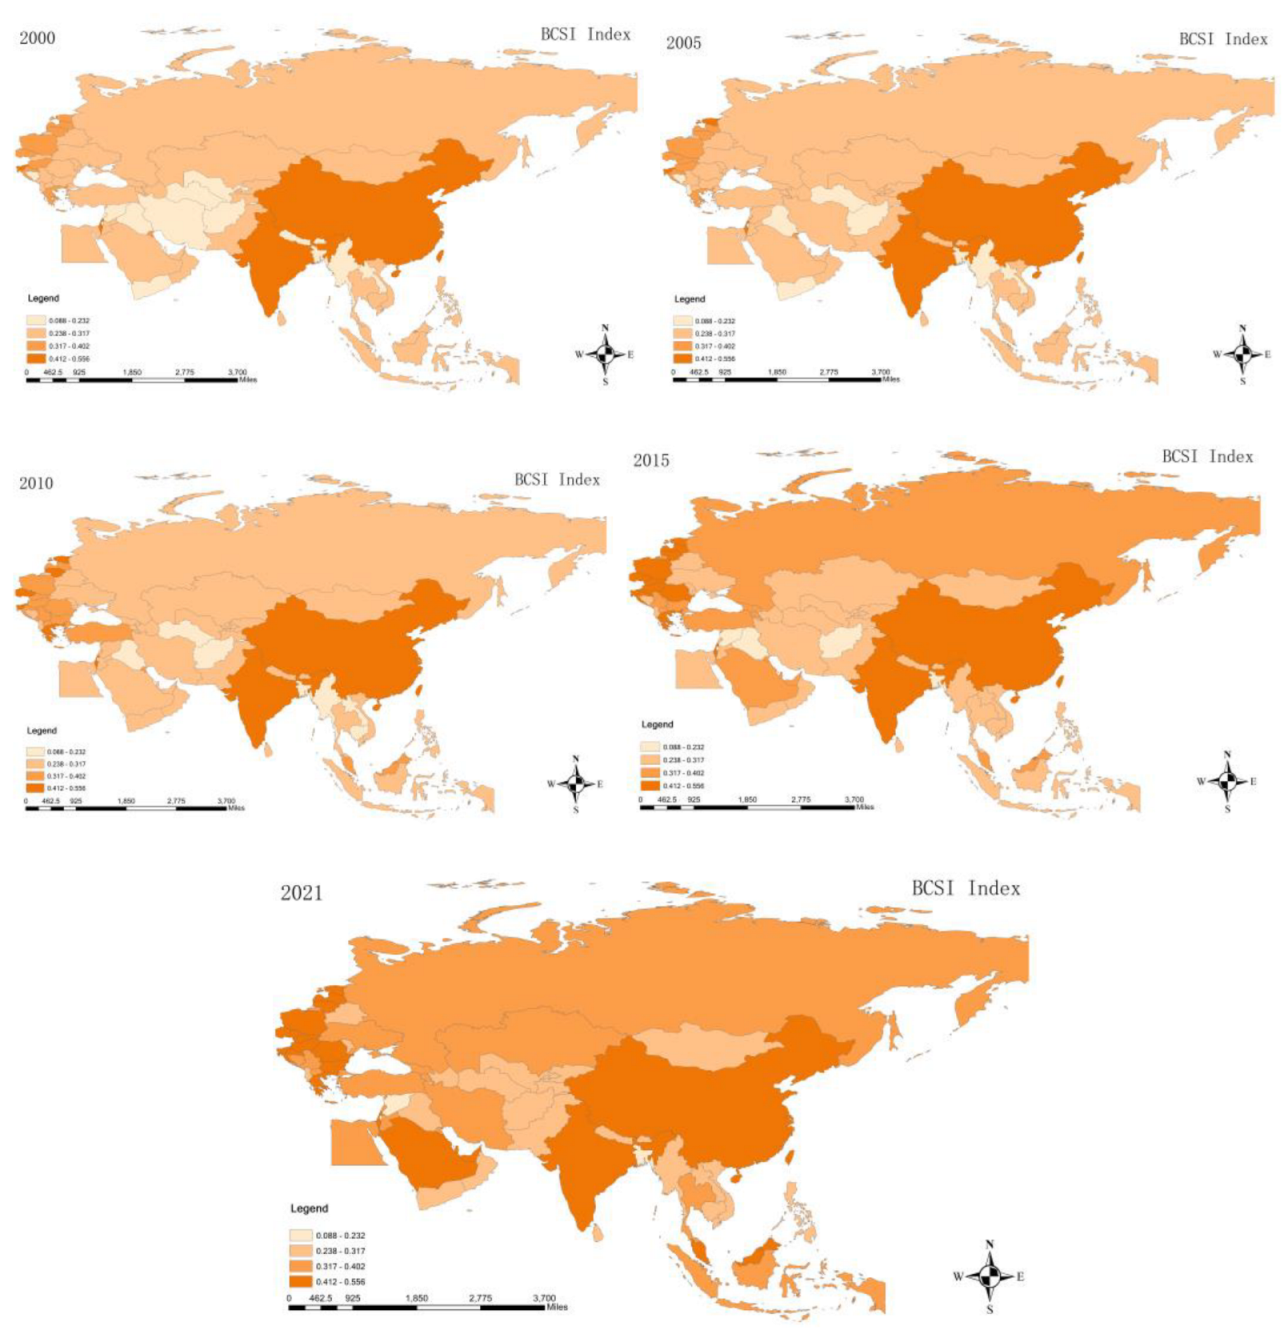
3.2. Spatial Change Analysis of SCSI in Belt and Road

To further analyze and compare the regional differences in SCSI levels within the Belt and Road region, the SCSI levels of the 64 countries from 2000 to 2021 were classified into four categories (Table 4) using the standard deviation classification method [43].
By dividing the SCSI values into different levels, we gain valuable insights into the variations and trends in the carrying capacity of the steel industry over time. The visualization provided in Figure 3 allows for a clear and intuitive understanding of the regional distribution and changes in SCSI levels. The darker colors signify regions with a higher capacity for sustainable development in the steel industry, reflecting their relative strengths in terms of industrial performance and resilience. According to Figure 3, in the year 2000, among the 64 countries in the Belt and Road region, there were 15 countries in Level I, 34 countries in Level II, 10 countries in Level III, and 5 countries in Level IV. In 2010, there were 7 countries in Level I, 35 countries in Level II, 13 countries in Level III, and 9 countries in Level IV among the 64 countries in the Belt and Road region. In 2021, there were 2 countries in Level I, 23 countries in Level II, 17 countries in Level III, and 22 countries in Level IV among the 64 countries in the Belt and Road region. It can be observed that the number of countries in Level I of the SCSI index in the Belt and Road region has significantly decreased, with only two countries, Bangladesh and Syria, currently at this level. On the other hand, the number of countries in Level IV has increased significantly, mainly due to rapid improvements in the steel industry carrying capacity in certain countries in Central Europe, Eastern Europe, the Middle East, South Asia, and Southeast Asia. Specifically, in Central and Eastern Europe, these regions have stable social environments, higher per capita GDP, a significant reduction in wastewater emissions, increased R&D investments by enterprises, and favorable conditions for international trade cooperation. With developed economic conditions, effective environmental governance, and superior natural environments, the steel industry carrying capacity in these regions has significantly improved, with Level III and Level IV dominating the SCSI index. In South Asia and Southeast Asia, with convenient transportation, immense market potential, favorable investment and innovation environments, and abundant mineral resources, the SCSI levels have significantly increased, with an increase in the number of countries in Level III and Level IV. Central Asia and Northern Asia, which are generally located in environmentally vulnerable areas of middle to high latitudes, have relatively underdeveloped economies, fragile natural environments, and low population densities, resulting in relatively smaller improvements in SCSI levels. Overall, the SCSI index in the Belt and Road region has generally improved, but there are still significant regional disparities. In the future, relevant countries within the region should seize the opportunities offered by the current international fourth industrial revolution, leverage their own advantages, and develop a rational and sustainable steel industry to achieve coordinated and sustainable development of the regional steel industry.
Figure 4 illustrates the classification of the five sub-indices of the SCSI in the Belt and Road region for the year 2021. The darker the color, the stronger the support of the corresponding sub-index for the steel industry’s carrying capacity and its favorable impact on steel industry development.
The Driving Force index represents the consumption potential of the steel industry, where countries with larger populations and better economic prospects exhibit greater demand for steel. Within the 65 countries of the Belt and Road region, South Asia and Southeast Asia have large population bases, and most countries are in the early stages of industrialization, requiring significant amounts of steel for industrial development, urbanization, and infrastructure construction. China and India consistently rank high in the Driving Force index for steel industry carrying capacity, while Bangladesh, Indonesia, Pakistan, the Philippines, Vietnam, and Egypt also have prominent positions in the index.
The Pressure index primarily reflects the natural environment’s support and carrying capacity for the steel industry. Among the Belt and Road countries, Slovenia, Singapore, Greece, the Czech Republic, and Latvia have favorable natural environments, abundant water resources, and good air quality, making them suitable for the development of the steel industry.
The Status index reflects the current degree of steel industry shortages. From the graph, it can be observed that there is a shortage of steel industry capacity in South Asia, Southeast Asia, Central Asia, and the Middle East regions. Eastern Europe also experiences relative steel industry shortages. The areas with steel shortages cover most countries in the Belt and Road region, indicating an imbalance in the regional distribution of the steel industry and a disconnect between supply and demand.
The Influence index represents the extent to which national policies and infrastructure meet the needs of the steel industry. It can be observed that except for some economically underdeveloped regions such as Central Asia, South Asia, and Mongolia, most countries in the Belt and Road region have significantly improved infrastructure and emphasize industrial development. The United Arab Emirates, Israel, Saudi Arabia, China, and Malaysia rank high in the Influence index.
The Response index reflects the efforts of different countries within the region to support industrial development and attract investment. Most countries in Central Europe, along with Saudi Arabia, Singapore, and Malaysia, prioritize industrial innovation and provide strong support for attracting international investments, contributing to the international layout of the steel industry.

3.3. Spatial Correlation Analysis of SCSI in Belt and Road

Using Stata 17.0 software, we conducted a spatial analysis by calculating the global Moran’s I index based on the spatial weight matrix for panel data from 2000 to 2021. This analysis aimed to reveal the spatial clustering patterns of the SCSI within the Belt and Road region. The results are summarized in Table 5. The findings indicate that, during the period of 2000–2016, the distribution of the SCSI index within the Belt and Road region exhibited randomness, as the global Moran’s I index did not pass the 1% significance test. In 2017, although the p-value was 0.073, indicating some level of significance, Moran’s I index failed the test as the z-value exceeded the critical value of −1.65. Consequently, spatial autocorrelation could not be confirmed. For the years 2018–2021, the global Moran’s I index was less than −0.150, and the p-values passed the 0.5% significance test, with z-values lower than the critical value of −1.96. This suggests that the SCSI index in the Belt and Road region exhibited significant negative spatial autocorrelation. From Table 4, it can be observed that the global Moran’s I index decreased from −0.150 in 2018 to −0.197 in 2020 and slightly increased to −0.184 in 2021. Overall, there was a downward trend followed by an upward trend in the clustering status throughout the study period, indicating significant and fluctuating spatial clustering. The peak value of Moran’s I index was −0.197 in 2020, indicating the most pronounced spatial dispersion. In 2021, Moran’s I index decreased to 0.257, indicating a reduction in spatial dispersion effects.
Continuing with the analysis of spatial correlation for each sub-indicator of the Belt and Road Countries Steel Industry (SCSI), the results are shown in Table 6. It can be observed that the global Moran’s I index for the Driver, Pressure, and Response indicators from 2000 to 2021 passes the significance test at the 0.1% level, with z-values greater than the critical value of 2.58. This indicates a strong spatial autocorrelation for these three sub-indicators. Specifically, both the Driver and Response indicators show an increasing trend in their Moran’s I index since 2000, and they currently stand at around 0.3. This reflects the strengthening spatial clustering characteristics of the steel industry demand potential and policy support within the Belt and Road region. Combining this with Figure 4, it can be observed that there is a prominent spatial separation between the Driver and Response indicators within the Belt and Road region. Countries with a favorable environment for industrial innovation and international exchange are mostly developed countries, in which their steel industry consumption has already reached its peak. On the other hand, the true potential for steel demand lies mostly in developing countries, and their spatial distribution does not coincide with the former group. The Moran’s I index for the Pressure indicator increased from 0.348 in 2000 to 0.601 in 2014 and then decreased to 0.330 in 2021. This indicates a relief in the spatial clustering of environmental pressures, suggesting an overall increase in regional environmental pressure.
The Impact index reflects industrial development and infrastructure improvement brought about by the steel industry. The global Moran’s I index for the Impact index was not significant from 2000 to 2017, but it became significant at the 0.5% level from 2018 to 2021. Furthermore, the global Moran’s I index for this indicator was greater than 0, indicating a significant spatial clustering of industrial development in the Belt and Road region. The Status index, on the other hand, had a significant global Moran’s I index at the 0.5% level from 2000 to 2018, but the spatial correlation was not significant in 2019. The Impact and Status indices are closely related to the distribution of the steel industry. China, as the destination for the third wave of the steel industry transfer, has experienced rapid growth in steel production since 2000, accounting for 53.6% of global steel production at its peak in 2013. China’s crude steel production accounted for 72.9% of the total steel production in the Belt and Road region. With China’s industrial structure upgrading and the ongoing fourth wave of industrial chain transfer, some of China’s steel industry has been transferred within the Belt and Road region. This shift in the steel industry leads to a weakening spatial effect in the Status index while highlighting the spatial clustering effect in the Impact index.
Based on the comprehensive analysis of the Belt and Road SCSI index and its sub-indicator spatial correlations, the following insights can be obtained. Firstly, the development of the steel industry is a complex system that is influenced by various factors such as the economy, population, environment, resources, policies, and industrial infrastructure. Secondly, at the macro level, the SCSI index of the advantaged countries within the Belt and Road region is spatially dispersed, and the supporting factors vary significantly. Lastly, there is a significant positive spatial correlation among the individual sub-indicators that influence the development of the steel industry in the Belt and Road region, indicating a clear clustering phenomenon within the region.
Specifically, South Asia and Southeast Asia have favorable population and economic prospects, with tremendous potential for steel demand. Eastern Europe, Central Europe, and countries/regions like Singapore have a strong industrial foundation and enjoy favorable investment and international trade environments. Saudi Arabia and Singapore have favorable policy environments.

4. Analysis of Influencing Factors of Spatial Differences of SCSI

Building upon the preceding analysis, it becomes apparent that notable disparities exist in the SCSI levels among the regions encompassed by the Belt and Road Initiative. These disparities can be attributed to variations in the relevant indicators. Consequently, this section aims to employ geographic detectors to quantitatively ascertain the influence of different contributing factors on the spatial differentiation of the SCSI. Firstly, four sets of data will be selected for the years 2005, 2010, 2015, and 2021. The natural breaks method in ArcGIS 10.7 software will be employed to classify the indicators in each data set. Subsequently, in conjunction with the SCSI index of different countries, the geographic detector’s factor detection module will be utilized to calculate the strength (Figure 5) of each indicator’s influence.
By utilizing geographic detectors, we can effectively identify and evaluate the relative impact of various factors on the spatial patterns observed in the SCSI. This quantitative analysis enables us to gain deeper insights into the drivers behind the spatial differentiation of the SCSI within the Belt and Road regions.

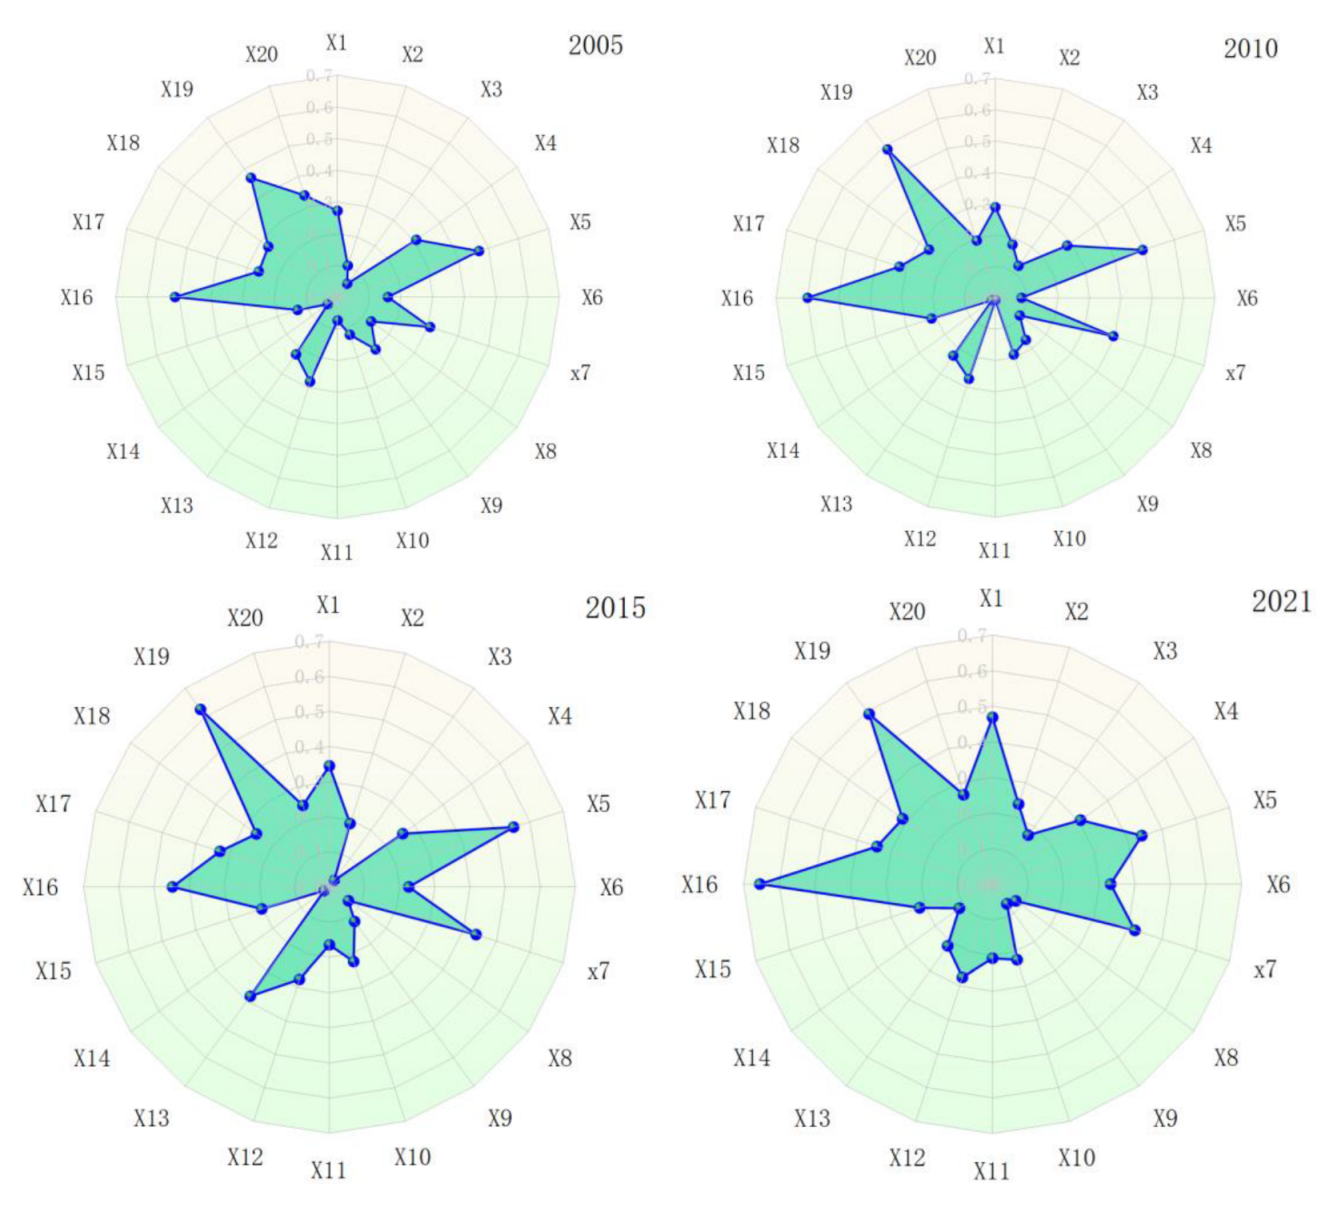
4.1. Intensity of Influencing Factors of SCSI

According to Figure 5, the strengths of the impacts of different indicators on the spatial differentiation of the SCSI index vary, but the driving effects of influencing factors are relatively similar across the years. From 2005 to 2021, the Global Governance Index, Water Stress Index, Steel Product Imports, Industrial Infrastructure, and Innovation Environment have a significant impact on the SCSI index. Among them, per capita GDP, Water Stress Index, and Industrial Infrastructure show increasing strength of influence over time, while the strength of the impact of Steel Product Imports and Innovation Environment initially increases and then slightly declines. Additionally, current greenhouse gas emissions and industrial structure have a significant influence on the SCSI.
Specifically, in 2005, the main factor causing SCSI spatial differentiation was Industrial Infrastructure, followed by the Global Governance Index, Innovation Environment, and Economic Freedom Index. In 2010, the main influencing factors were Industrial Infrastructure, followed by the Innovation Environment, Global Governance Index, and Water Stress Index. The results for 2015 were similar to 2010, but with an increase in the strength of influence from the Innovation Environment and Global Governance Index, while the strength of Industrial Infrastructure continued to decline. Furthermore, the strength of influence from the Steel Product Gap increased significantly. In 2021, the main factors causing SCSI spatial differentiation were Industrial Infrastructure, followed by the Innovation Environment, per capita GDP, and the Global Governance Index. The strength of influence from per capita GDP surpassed that of greenhouse gas emissions, the Global Governance Index, and the Innovation Environment, becoming an important factor influencing the capacity of the steel industry.
In conclusion, since 2005, the factors influencing the spatial differentiation of the steel industry’s capacity along the Belt and Road Initiative mainly include Industrial Infrastructure, Innovation Environment, Global Governance Capacity, and per capita GDP. Overall, the transmission of these factors follows the direction of “Industrial Infrastructure → Innovation Environment → Global Governance Capacity → per capita GDP.” This reflects the positive promoting effect of a sound industrial infrastructure, an active innovation environment, and an open policy environment on the development of the steel industry. Additionally, it also reflects the significantly enhanced promoting effect of domestic economic level and domestic demand on the steel industry in the context of intensified international geopolitical competition.
The reason behind this is the transformation of the international macro environment and economic development patterns. In the early years of this century, during the rapid development stage of globalization, favorable policies and infrastructure became crucial factors in attracting international investment. Subsequently, around the 2010s, low-end industries in developed countries had mostly shifted to developing countries, and innovation capacity became a significant driving force for economic development. Since the Crimea crisis in 2014, there has been a major transformation in global governance systems and patterns. Geopolitical competition has gradually emerged as a prominent factor in global industrial and resource allocation, and this trend has also been reflected in the development of the steel industry in the Belt and Road region. However, the COVID-19 pandemic, which began at the end of 2019, has accelerated the evolution of the industrial landscape. Global demand and investment have weakened, leading countries to adopt an economic development approach focused on stimulating domestic demand. This shift is evident in the rising importance of per capita GDP within the steel industry landscape of the Belt and Road region.

4.2. Analysis of Multi-Factor Interactions

Figure 6 showcases the interactive detection results of the driving factors contributing to the spatial-temporal differentiation of the Belt and Road Initiative’s SCSI in 2021. The findings reveal the formation of a total of 190 factor combinations as a result of factor interactions. Notably, 42.6% of these combinations demonstrate non-linear enhancements, indicating that the joint effect surpasses the sum of the individual effects of the two factors. Furthermore, 57.4% exhibit dual-factor enhancements, where the joint effect exceeds the maximum effect of the two individual factors. The interactive detection results depicted in Figure 6 shed light on the complex relationships and synergies among the driving factors. These findings emphasize the importance of considering the combined effects of multiple factors in understanding the spatial–temporal differentiation of the SCSI. The prevalence of non-linear enhancement and dual-factor enhancement suggests that the joint impact of certain factor combinations yields greater influence than expected based solely on the individual effects of each factor. For example, the single-factor effect strength of sulfide concentration was 0.081, but when it interacted with other driving factors, the maximum impact strength reached 0.723. Similarly, while the individual effect strengths of water scarcity and the Global Governance Index were around 0.068 and 0.441, respectively, their interaction effect strength increased to 0.549. Moreover, the interaction effect strengths between per capita GDP and indicators such as total population, sulfide concentration, per capita steel production, steel shortage, industrial infrastructure, and innovation environment all exceeded 0.720. The formation of regional disparities in the SCSI level within the Belt and Road Initiative can be attributed to the combined effects of multiple factors. Notably, the interaction effects of dual factors exhibit significant variations across countries at different stages of economic development. These findings highlight the intricate nature of the relationships among factors contributing to regional differences at the SCSI level. The interactions between dual factors play a crucial role in shaping the observed variations, with their effects being contingent upon the specific characteristics and developmental stages of individual countries.
Therefore, for investments in the steel industry in the Belt and Road region, it is necessary to consider both the individual impacts and the interactions of multiple factors. On the one hand, attention should be given to economic development level, technological progress, and openness. On the other hand, it is important to strengthen water resources and air ecological protection, accelerate the construction of a water-saving society in production and consumption, and improve the SCSI level.

5. Conclusions, Recommendations, and Discussion

5.1. Conclusions

Building upon the DPSIR model, this study establishes an evaluation index system specifically designed for the SCSI of the Belt and Road Initiative. By employing this index system, we analyze the spatiotemporal evolution characteristics and identify the driving factors that influence the SCSI across the 65 countries along the Belt and Road from 2000 to 2021. The comprehensive analysis yields several significant conclusions.
(1) The significant improvement in the sustainable development index of the Belt and Road regional steel industry from 2000 to 2021 can be attributed to the enhanced industrial policies and industrial infrastructure within the research area. Specifically, countries like Indonesia, Iran, Laos, Malaysia, Romania, and Hungary have demonstrated a strong commitment to industrial development by actively improving their infrastructure and implementing favorable policies to attract investments in the steel industry. During the study period, the number of countries in SCSI Grade IV increased from 5 to 22, while the number of countries in Grade I decreased from 15 to 2. China, India, Singapore, Estonia, and Latvia consistently ranked high in SCSI, while countries like Bangladesh, Syria, Iraq, Laos, and Turkmenistan ranked lower.
(2) Comprehensive analysis of the spatial correlations between the SCSI index and its sub-indicators in the Belt and Road region reveals the following insights. The development of the steel industry is a multifaceted process influenced by a multitude of factors, including but not limited to the economy, population, environment, resources, policies, and industrial infrastructure. The steel industry operates within a complex system that necessitates a comprehensive understanding of the interplay among these factors. These factors interact and mutually shape the trajectory and outcomes of the steel industry’s development. Secondly, at the macro level, the SCSI index within the Belt and Road region is spatially dispersed, and there are significant differences in the supporting factors for SCSI among countries with advantages. Lastly, there is a significant positive spatial correlation among the individual sub-indicators that influence the development of the steel industry within the Belt and Road region, indicating clear regional clustering.
(3) The impact of driving factors on SCSI spatial differentiation varies in different periods. Since 2005, the main factors influencing the spatial differentiation of the steel industry’s carrying capacity along the Belt and Road include industrial infrastructure, innovation environment, global governance capacity, and per capita GDP. Overall, there is a transmission path from “industrial infrastructure → innovation environment → global governance capacity → per capita GDP.” This reflects the positive promotion of the steel industry’s development through good industrial infrastructure, a vibrant innovation environment, and an open policy environment. It also reflects the significant enhancement of the promotion effect of domestic economic level and domestic demand on the steel industry given the intensified international geopolitical competition.
(4) The emergence of regional disparities in SCSI levels along the Belt and Road can be attributed to the combined influence of multiple factors. Through the analysis of two-factor interactions, compelling insights have been revealed. Among them, 42.6% of the interactions exhibit non-linear enhancement, indicating that the joint effect surpasses the sum of the individual effects of the two factors. Additionally, 57.4% of the interactions demonstrate two-factor enhancement, where the joint effect exceeds the maximum value achievable by the two individual factors. Moreover, it is important to note that significant variations exist in the two-factor interactive effects among countries at different stages of economic development. Factors such as economic development level, technological progress, industrial transformation and upgrading, and the degree of openness need to be considered when assessing the influence of these interactions.

5.2. Recommendations

Based on our research and analysis of the Belt and Road countries’ steel industry carrying capacity (SCSI), we propose the following recommendations to promote sustainable development in the steel industry.
(1) Strengthen international cooperation and communication: Belt and Road countries should enhance international cooperation and actively integrate into the global steel industry system to promote the coordinated development of the regional steel industry. By establishing international alliances, conducting technology exchanges, and engaging in collaborative research, countries can collectively address challenges and promote the industry’s sustainable development.
(2) Optimize industrial structure and technological upgrading: Belt and Road countries should strive to optimize the structure of the steel industry, promote technological upgrading and innovation, and improve resource utilization efficiency and environmental friendliness. The research and application of green steel technologies and clean production techniques should be increased to reduce environmental impacts and achieve sustainable development goals.
(3) Enhance policy support and regulation: Governments should focus on coordinating and balancing various interests when formulating and implementing policies related to the steel industry, promoting the synergy between industry development and environmental protection. At the same time, the regulation of steel companies should be strengthened to ensure compliance with laws and regulations, reduce pollutant emissions, and improve resource utilization efficiency.
(4) Promote green development and sustainable utilization: Belt and Road countries should strengthen environmental awareness and promote the application of green development principles in the steel industry. Support for energy conservation, emission reduction, and recycling should be increased, and companies should be encouraged to adopt clean production technologies and green manufacturing practices to reduce resource consumption and environmental pollution.

5.3. Discussion

The sustainable development of the steel industry in the Belt and Road region remains relatively understudied. This research aims to bridge this gap by employing the DPSIR model to establish a comprehensive evaluation index system for assessing the sustainable development of the steel industry within the region. However, there are some limitations to be addressed. Firstly, due to the limitations of the research discipline, the comprehensiveness of the selected indicators in this study is insufficient, and aspects such as international relations, industrial economics, industrial development, and international investment need to be strengthened. Secondly, further improvements can be made in the selection of indicators. Considering the limitations of data availability, this study only selects 20 specific indicators. In reality, the steel industry is an extremely complex and extensive system, and there is a need to increase the number and specialization of indicators.
To address the current limitations and further deepen the understanding of the sustainable development capacity of the steel industry in the Belt and Road region, the following suggestions are proposed.
More comprehensive and accurate data should be collected. Future research can focus on collecting more extensive and detailed data, including data in specific areas of the steel industry, more precise environmental data, and economic data. This will enhance the reliability and accuracy of research findings.
Interdisciplinary collaboration should be enhanced. Collaboration with experts from relevant fields such as environmental science, economics, and sociology can be considered to conduct a more comprehensive analysis of various aspects of the sustainable development of the steel industry. Interdisciplinary research can provide deeper insights and comprehensive analysis.
Qualitative research should be strengthened. In addition to quantitative data analysis, qualitative research methods such as in-depth interviews and case studies can be introduced to better understand the social, economic, and environmental impacts of the steel industry’s sustainable development on the Belt and Road region. This will help uncover underlying motivations and complexities.
Risk assessments should be considered. Future research can explore methods for conducting risk assessments to evaluate potential risks and uncertainties faced by the steel industry’s sustainable development. This will contribute to the development of risk management strategies and decision support.
By addressing these suggestions, future studies can overcome the current limitations and gain a more comprehensive understanding of the sustainable development capacity of the steel industry in the Belt and Road region.

Author Contributions

Conceptualization, J.X.; data curation, Q.Y.; formal analysis, X.H.; methodology, J.X. and Q.Y.; resources, Q.Y. and X.H.; validation, X.H.; visualization, J.X.; writing—original draft, J.X.; writing—review and editing, Q.Y. All authors have read and agreed to the published version of the manuscript.

Funding

This research was supported by the Third Xinjiang Scientific Expedition, Grant (No 2022xikk0804), the Key program of International Cooperation, Bureau of International Cooperation, Chinese Academy of Sciences, Grant (No. 131551KYSB20210030), and National Natural Science Foundation of China, Grant (No. 42071281).

Institutional Review Board Statement

Not applicable.

Informed Consent Statement

Not applicable.

Data Availability Statement

Not applicable.

Conflicts of Interest

The authors declare no conflict of interest.

References

  1. Tolettini, L.; Di Maria, E. Structuring and Measuring Environmental Sustainability in the Steel Sector: A Single Case Study. Sustainability 2023, 15, 6272. [Google Scholar] [CrossRef]
  2. Andreotti, M.; Brondi, C.; Micillo, D.; Zevenhoven, R.; Rieger, J.; Jo, A.; Ballarino, A. SDGs in the EU Steel Sector: A Critical Review of Sustainability Initiatives and Approaches. Sustainability 2023, 15, 7521. [Google Scholar] [CrossRef]
  3. Xu, D.; Liu, E.; Duan, W.; Yang, K. Consumption-Driven Carbon Emission Reduction Path and Simulation Research in Steel Industry: A Case Study of China. Sustainability 2022, 14, 13693. [Google Scholar] [CrossRef]
  4. Lin, Y.; Yang, H.; Ma, L.; Li, Z.; Ni, W. Low-carbon development for the iron and steel industry in China and the world: Status quo, future vision, and key actions. Sustainability 2021, 13, 12548. [Google Scholar] [CrossRef]
  5. Wu, R.; Lin, B. Environmental regulation and its influence on energy-environmental performance: Evidence on the Porter Hypothesis from China’s iron and steel industry. Resour. Conserv. Recycl. 2022, 176, 105954. [Google Scholar] [CrossRef]
  6. Xin, H.; Wang, S.; Chun, T.; Xue, X.; Long, W.; Xue, R.; Zhang, R. Effective pathways for energy conservation and emission reduction in iron and steel industry towards peaking carbon emissions in China: Case study of Henan. J. Clean. Prod. 2023, 399, 136637. [Google Scholar] [CrossRef]
  7. Fang, C.; Liu, X. Comprehensive measurement for carrying capacity of resources and environment of city clusters in central China. Chin. Geogr. Sci. 2010, 20, 281–288. [Google Scholar] [CrossRef]
  8. Tian, Y.; Sun, C. Comprehensive carrying capacity, economic growth and the sustainable development of urban areas: A case study of the Yangtze River Economic Belt. J. Clean. Prod. 2018, 195, 486–496. [Google Scholar] [CrossRef]
  9. Daily, G.C.; Ehrlich, P.R. Population, sustainability, and Earth’s carrying capacity. BioScience 1992, 42, 761–771. [Google Scholar] [CrossRef]
  10. Arcos, J.C. Population growth, economic necessity and industrial growth versus environmental impact and carrying capacity. J. Environ. Sci. Health Part C 1990, 8, 421–438. [Google Scholar] [CrossRef]
  11. Rees, W.E. Ecological footprints and appropriated carrying capacity: What urban economics leaves out. Environ. Urban. 1992, 4, 121–130. [Google Scholar] [CrossRef]
  12. Rees, W.E. Revisiting carrying capacity: Area-based indicators of sustainability. Popul. Environ. 1996, 17, 195–215. [Google Scholar] [CrossRef]
  13. Matooane, L.; Diab, R.D. Air pollution carrying capacity in the South Durban Industrial Basin: Research in action. S. Afr. J. Sci. 2001, 97, 450–453. [Google Scholar]
  14. Wang, W.; Zeng, W. Optimizing the regional industrial structure based on the environmental carrying capacity: An inexact fuzzy multi-objective programming model. Sustainability 2013, 5, 5391–5415. [Google Scholar] [CrossRef] [Green Version]
  15. Gao, T.; Liu, Q.; Wang, J. A comparative study of carbon footprint and assessment standards. Int. J. Low-Carbon Technol. 2014, 9, 237–243. [Google Scholar] [CrossRef] [Green Version]
  16. Zhou, X.Y.; Lei, K.; Meng, W.; Khu, S.T. Industrial structural upgrading and spatial optimization based on water environment carrying capacity. J. Clean. Prod. 2017, 165, 1462–1472. [Google Scholar] [CrossRef]
  17. Niu, F.; Yang, X.; Zhang, X. Application of an evaluation method of resource and environment carrying capacity in the adjustment of industrial structure in Tibet. J. Geogr. Sci. 2020, 30, 319–332. [Google Scholar] [CrossRef]
  18. Gao, Q.; Fang, C.; Liu, H.; Zhang, L. Conjugate evaluation of sustainable carrying capacity of urban agglomeration and multi-scenario policy regulation. Sci. Total Environ. 2021, 785, 147373. [Google Scholar] [CrossRef]
  19. Lu, W.; Yin, C.; Zhang, Y.; Fu, Z.; Guo, H.; Yu, L.; Liu, Y. Consistency Evaluation of Ecological Carrying Capacity and Industrial Layout Based on” Three Lines One Permit” Index System. Beijing Da Xue Xue Bao 2021, 57, 749–755. [Google Scholar]
  20. Liu, Y.; Shi, F.; He, H.; Shen, L.; Luo, W.; Sun, L. Study on the Matching Degree between Land Resources Carrying Capacity and Industrial Development in Main Cities of Xinjiang, China. Sustainability 2021, 13, 10568. [Google Scholar] [CrossRef]
  21. Paiva, T.; Ribeiro, M.P.; Coutinho, P. Capacity-Building Model to Promote Innovation and Sustainability in the Portuguese Agro-Industrial Sector. Sustainability 2022, 14, 15873. [Google Scholar] [CrossRef]
  22. Chai, N.; Zhou, W. The DPSIRM-Grey cloud clustering method for evaluating the water environment carrying capacity of Yangtze River economic Belt. Ecol. Indic. 2022, 136, 108722. [Google Scholar] [CrossRef]
  23. Sun, J.; Miao, J.; Mu, H.; Xu, J.; Zhai, N. Sustainable development in marine economy: Assessing carrying capacity of Shandong province in China. Ocean Coast. Manag. 2022, 216, 105981. [Google Scholar] [CrossRef]
  24. Yu, W.; Tao, T. Scenario Simulation for the Urban Carrying Capacity Based on System Dynamics Model in Shanghai, China. Sustainability 2022, 14, 12910. [Google Scholar] [CrossRef]
  25. Luo, H.; Lin, X. Dynamic Analysis of Industrial Carbon Footprint and Carbon-Carrying Capacity of Zhejiang Province in China. Sustainability 2022, 14, 16824. [Google Scholar] [CrossRef]
  26. Wang, R.; Cheng, J.; Zhu, Y.; Lu, P. Evaluation on the coupling coordination of resources and environment carrying capacity in Chinese mining economic zones. Resour. Policy 2017, 53, 20–25. [Google Scholar] [CrossRef]
  27. Zhao, L.; Li, J.; Shao, Q. Evaluation of urban comprehensive carrying capacity: Case study of the Beijing–Tianjin–Hebei urban agglomeration, China. Environ. Sci. Pollut. Res. 2020, 27, 19774–19782. [Google Scholar] [CrossRef]
  28. Zhao, Y.; Wang, Y.; Wang, Y. Comprehensive evaluation and influencing factors of urban agglomeration water resources carrying capacity. J. Clean. Prod. 2021, 288, 125097. [Google Scholar] [CrossRef]
  29. Zhang, M.; Liu, Y.; Wu, J.; Wang, T. Index system of urban resource and environment carrying capacity based on ecological civilization. Environ. Impact Assess. Rev. 2018, 68, 90–97. [Google Scholar] [CrossRef]
  30. Yang, J.; Ding, H. A quantitative assessment of sustainable development based on relative resource carrying capacity in Jiangsu Province of China. Int. J. Environ. Res. Public Health 2018, 15, 2786. [Google Scholar] [CrossRef] [Green Version]
  31. Tong, S.; Ji, X.; Chu, Y.; Liu, T.; Wang, F. Spatio-Temporal Analysis about Resource and Environmental Carrying Capacity (RECC) of Mining Cities in Coal-Concentrated Areas: A Case Study of Huaihai Economic Zone in China. Sustainability 2023, 15, 1367. [Google Scholar] [CrossRef]
  32. Jiming, H.; Jinnan, W.; Hongqiang, J.; Nianlei, L. Strategies for Industrial Development Layout in China within the Constraints of Environmental Carrying Capacity. Strateg. Study Chin. Acad. Eng. 2017, 19, 20–26. [Google Scholar]
  33. Chen, Y.; Tian, W.; Zhou, Q.; Shi, T. Spatiotemporal and driving forces of Ecological Carrying Capacity for high-quality development of 286 cities in China. J. Clean. Prod. 2021, 293, 126186. [Google Scholar] [CrossRef]
  34. Tan, F.; Wang, F.; Niu, Z. Multiscale disparity and spatial pattern of comprehensive carrying capacity in the Yangtze River Economic Belt, China. Ecol. Indic. 2023, 148, 110119. [Google Scholar] [CrossRef]
  35. Gari, S.R.; Newton, A.; Icely, J.D. A review of the application and evolution of the DPSIR framework with an emphasis on coastal social-ecological systems. Ocean Coast. Manag. 2015, 103, 63–77. [Google Scholar] [CrossRef] [Green Version]
  36. Elliott, M.; Burdon, D.; Atkins, J.P.; Borja, A.; Cormier, R.; De Jonge, V.N.; Turner, R.K. “And DPSIR begat DAPSI (W) R (M)!”-a unifying framework for marine environmental management. Mar. Pollut. Bull. 2017, 118, 27–40. [Google Scholar] [CrossRef] [PubMed] [Green Version]
  37. Kristiadi, Y.; Sari, R.F.; Herdiansyah, H.; Hasibuan, H.S.; Lim, T.H. Developing DPSIR Framework for Managing Climate Change in Urban Areas: A Case Study in Jakarta, Indonesia. Sustainability 2022, 14, 15773. [Google Scholar] [CrossRef]
  38. Mirchi, A.; Madani, K.; Watkins, D.; Ahmad, S. Synthesis of system dynamics tools for holistic conceptualization of water resources problems. Water Resour. Manag. 2012, 26, 2421–2442. [Google Scholar] [CrossRef]
  39. Wang, Y.; Cheng, H.; Huang, L. Water resources carrying capacity evaluation of a dense city group: A comprehensive water resources carrying capacity evaluation model of Wuhan urban agglomeration. Urban Water J. 2018, 15, 615–625. [Google Scholar] [CrossRef]
  40. Xing, K.; Zhu, Q.; Zou, X.H. Analysis on the Supply Situation of Ferrite Resources in China. Nat. Resour. Econ. China 2022, 35, 27–37. [Google Scholar]
  41. Rousset, F.; Ferdy, J.B. Testing environmental and genetic effects in the presence of spatial autocorrelation. Ecography 2014, 37, 781–790. [Google Scholar] [CrossRef]
  42. Lv, A.; Han, Y.; Zhu, W.; Zhang, S.; Zhao, W. Risk assessment of water resources carrying capacity in China. JAWRA J. Am. Water Resour. Assoc. 2021, 57, 539–551. [Google Scholar] [CrossRef]
  43. Peng, T.; Deng, H.; Lin, Y.; Jin, Z. Assessment on water resources carrying capacity in karst areas by using an innovative DPESBRM concept model and cloud model. Sci. Total Environ. 2021, 767, 144353. [Google Scholar] [CrossRef] [PubMed]
Figure 1. SCSI logic system based on DPSIR model.
Sustainability 15 11320 g001
Figure 2. Trends in Belt and Road SCSI index for the years 2000, 2005, 2010, 2015, and 2021.
Sustainability 15 11320 g002
Figure 3. Spatial pattern of SCSI index in the Belt and Road region for the years 2000, 2005, 2010, 2015, and 2021.
Sustainability 15 11320 g003
Figure 4. The spatial pattern of the SCSI (Belt and Road Countries Steel Industry Index) in 2021.
Sustainability 15 11320 g004
Figure 5. The q-values of the driving factors for the Belt and Road Initiative’s SCSI in 2005, 2010, 2015, and 2021.
Sustainability 15 11320 g005
Figure 6. Heatmap of the interactive detection results of the driving factors for the Belt and Road Initiative’s SCSI.
Sustainability 15 11320 g006
Table 1. SCSI evaluation index system for the Belt and Road Initiative.
Target LayerStandard LayerIndex LayerUnitIndicator Property
SCSI
Evaluation
Index System
Driving (D)X1: GDP per capitaDollar
X2: Urbanization rate%
X3: GDP growth rate%+
X4: Total populationpeople+
X5: Domestic macro environment-+
Pressure (P)X6: Greenhouse gas emissions-+
X7: Water source pressure-+
X8: Air pollution-+
X9: Degree of water scarcity-+
State (S)X10: Steel production per capitakg/person
X11: Level of primary steel shortageDollar+
X12: The degree of shortage of iron and steel productsDollar+
X13: Advantages of steel import volume%+
Influence (I)X14: Industrial emphasis%+
X15: Electrification rate%+
X16: Industrial infrastructure-+
X17: Proportion of medium and high-tech industries%
Response (R)X18: Sewage treatment level-+
X19: Research and innovation environment-+
X20: Economic freedom-+
Table 2. The weight of BCSI evaluation index system along the Belt and Road.
Index LayerEntropy WeightCoefficient of Variation WeightComprehensive Weight
X1: GDP per capita0.0050.0170.011
X2: Urbanization rate0.0310.0420.037
X3: GDP growth rate0.0020.0110.007
X4: Total population0.3780.2810.329
X5: Domestic macro environment0.0210.0360.028
X6: Greenhouse gas emissions0.0680.0620.065
X7: Water source pressure0.0220.0360.029
X8: Air pollution0.0500.0550.053
X9: Degree of water scarcity0.0280.0560.042
X10: Steel production per capita0.0040.0150.010
X11: Level of primary steel shortage0.0020.0090.006
X12: The degree of shortage of iron and steel products0.0010.0050.003
X13: Advantages of steel import volume0.0040.0160.010
X14: Industrial emphasis0.0190.0370.028
X15: Electrification rate0.0040.0150.009
X16: Industrial infrastructure0.0640.0650.064
X17: Proportion of medium and high-tech industries0.0090.0230.016
X18: Sewage treatment level0.1470.0990.123
X19: Research and innovation environment0.1330.0970.115
X20: Economic freedom0.0070.0210.014
Table 3. SCSI index of various Belt and Road countries for the years 2000, 2005, 2010, 2015, and 2021.
Serial NumberNationSCSI Indices of Belt and Road Countries.
20002005201020152021
1China0.5560.5550.5610.5920.648
2Mongolia0.2890.2580.2380.2480.272
3Russia0.3060.3040.3070.3380.399
4Malaysia0.2650.2700.3270.3930.436
5Singapore0.5040.5250.4820.4830.499
6Indonesia0.2800.2790.2860.3110.353
7Brunei0.3470.3440.3230.4210.450
8the Philippines0.2510.2610.2680.2710.278
9Thailand0.2730.2800.2890.3030.347
10Cambodia0.2380.2370.2300.2480.258
11Laos0.1940.2020.2160.2420.240
12Vietnam0.2420.2510.2550.2690.300
13Myanmar0.2060.2120.2140.2350.246
14Maldives0.2640.2490.2410.2670.290
15Sri Lanka0.2500.2540.2650.2680.278
16Bangladesh0.0880.0860.0890.0890.090
17Pakistan0.2510.2580.2640.2920.286
18India0.4610.5050.5160.5410.590
19Bhutan0.2230.2680.2540.2710.293
20Afghanistan0.1880.2160.2140.2200.283
21Nepal0.2230.2480.2430.2370.250
22Uzbekistan0.2260.2340.2580.2650.300
23Tajikistan0.2590.2500.2430.2480.242
24Kazakhstan0.2690.2480.2530.3020.337
25Kyrgyzstan0.2780.2650.2520.2550.287
26Turkmenistan0.2270.2240.2300.2340.242
27United Arab Emirates0.3040.2980.2990.3290.434
28Oman0.2740.2720.2900.2910.314
29Azerbaijan0.2700.2680.2900.2960.315
30Egypt0.2500.2680.2800.3080.329
31Greece0.3490.3960.4310.4250.455
32Bahrain0.2870.3130.2960.3010.346
33Georgia0.3000.2850.2830.3220.365
34Kuwait0.3280.3220.3250.3280.355
35Lebanon0.2290.2540.2780.2920.322
36Qatar0.2270.2510.2820.3790.419
37Saudi Arabia0.2930.2490.2830.3330.424
38Türkiye0.2820.2920.3200.3450.355
39Syria0.2180.2450.2360.2270.232
40Armenia0.2930.2950.2980.3220.335
41Yemen0.2110.2240.2330.2470.261
42Iraq0.1840.1830.2040.1740.235
43Iran0.2010.2340.2560.2820.336
44Israel0.4290.4270.4390.4560.471
45Jordan0.2590.2640.2800.2930.349
46Albania0.2660.2260.2780.2910.309
47Estonia0.3660.4120.4530.4690.484
48Belarus0.2710.2670.2580.2780.313
49Bulgaria0.2700.3140.3350.3650.408
50Bosnia and Herzegovina0.2040.2210.2570.2950.333
51Poland0.3490.3800.3950.4530.472
52Montenegro0.2340.2670.3100.3490.409
53Czech Republic0.3700.3990.4180.4640.471
54Croatia0.3170.3630.3720.4410.453
55Latvia0.3270.3390.3490.4140.481
56Lithuania0.3370.3880.4090.4620.468
57Romania0.2880.2860.3660.4120.411
58North Macedonia0.2560.2690.3270.3600.356
59Moldova0.2960.2910.2600.2910.285
60Serbia0.2380.2730.3220.3850.397
61Slovak Republic0.3040.3390.3930.4360.429
62Slovenia0.4120.4250.4380.4520.477
63Ukraine0.2500.2570.2590.2670.326
64Hungary0.3500.3700.3920.4270.445
Table 4. SCSI level classification criteria.
Grading StandardsLevel ILevel IILevel IIILevel IV
Division basis(0, V − B](V − B, V](V, V + B](V + B, 1]
(0, 0.231](0.203, 0.317](0.317, 0.401](0.401, 1]
Note: V: mean; B: standard deviation.
Table 5. Global Moran’s I index of SCSI in Belt and Road from 2000 to 2021.
YearMoran’s Ip ValueZ Value
20000.0060.3670.339
2001−0.0480.311−0.493
2002−0.0070.4470.133
2003−0.0630.235−0.722
2004−0.0630.235−0.722
2005−0.0550.279−0.586
2006−0.0550.279−0.586
2007−0.0550.279−0.586
2008−0.0550.279−0.586
2009−0.0550.279−0.586
2010−0.0690.215−0.788
2011−0.0490.315−0.483
2012−0.0390.365−0.345
2013−0.0350.387−0.286
2014−0.0120.4790.052
2015−0.0520.298−0.531
2016−0.0590.265−0.629
2017−0.1160.073−1.454
2018−0.1500.026−1.963
2019−0.1780.009−2.352
2020−0.1970.004−2.628
2021−0.1840.007−2.447
Table 6. The global Moran’s I indices for the sub-indicators of Belt and Road Countries Steel Industry (SCSI) from 2000 to 2021.
YearsDriving (D)Pressure (P)State (S)Influence (I)Response (R)
Moran’s IZpMoran’s IZpMoran’s IZpMoran’s IZpMoran’s IZp
20000.2895.0820.0000.3484.7770.0000.2744.1430.0000.0781.2550.1050.1622.4150.008
20010.2764.8550.0000.3785.1720.0000.2533.8810.0000.0721.1820.1190.1752.5620.005
20020.2814.9480.0000.3705.0730.0000.2253.5190.0000.0590.9990.1590.1812.6640.004
20030.2824.9600.0000.3665.0450.0000.2473.7910.0000.0681.1190.1320.1962.8560.002
20040.2684.7350.0000.3945.4200.0000.2623.9570.0000.0801.2780.1010.2143.0860.001
20050.2774.8650.0000.3494.8560.0000.2704.0210.0000.0771.2330.1090.2313.3060.000
20060.2774.8670.0000.3034.2770.0000.3044.4920.0000.0661.0800.1400.2343.3430.000
20070.2744.8140.0000.3294.5840.0000.2984.3840.0000.0631.0450.1480.2483.5160.000
20080.2724.7850.0000.3384.6890.0000.2563.7710.0000.0661.0790.1400.2613.6860.000
20090.2784.8800.0000.4426.0190.0000.2083.1030.0010.0510.8810.1890.2653.7280.000
20100.2764.8550.0000.5136.9370.0000.1782.6980.0030.0841.3170.0940.2663.7370.000
20110.2804.9080.0000.5187.0000.0000.1972.9580.0020.1061.6050.0540.2904.0460.000
20120.2834.9520.0000.5607.5590.0000.1652.5060.0060.0961.4720.0710.3054.2320.000
20130.2854.9900.0000.5727.7150.0000.1362.1040.0180.1231.8260.0340.3014.1720.000
20140.2905.0690.0000.6018.0980.0000.1422.2020.0140.1181.7610.0390.2914.0380.000
20150.2925.0950.0000.5837.8670.0000.1652.4710.0070.1021.5480.0610.2954.0870.000
20160.2945.1290.0000.5237.0680.0000.1632.4270.0080.0731.1730.1200.2924.0550.000
20170.2955.1360.0000.4446.0240.0000.1552.3180.0100.1161.7360.0410.2954.0780.000
20180.2975.1790.0000.3464.7570.0000.1382.0840.0190.1472.1510.0160.3044.2000.000
20190.3104.9600.0000.3474.7600.0000.1191.8230.0340.1392.0350.0210.3104.2750.000
20200.3104.9590.0000.3384.6560.0000.1001.5550.0600.1301.9190.0270.3094.2560.000
20210.3034.8490.0000.3304.5470.0000.0811.3090.0950.1321.9540.0250.3174.3690.000
Disclaimer/Publisher’s Note: The statements, opinions and data contained in all publications are solely those of the individual author(s) and contributor(s) and not of MDPI and/or the editor(s). MDPI and/or the editor(s) disclaim responsibility for any injury to people or property resulting from any ideas, methods, instructions or products referred to in the content.

