Exploring the Factors Influencing the Impact of the COVID-19 Pandemic on Global Shipping: A Case Study of the Baltic Dry Index


Abstract
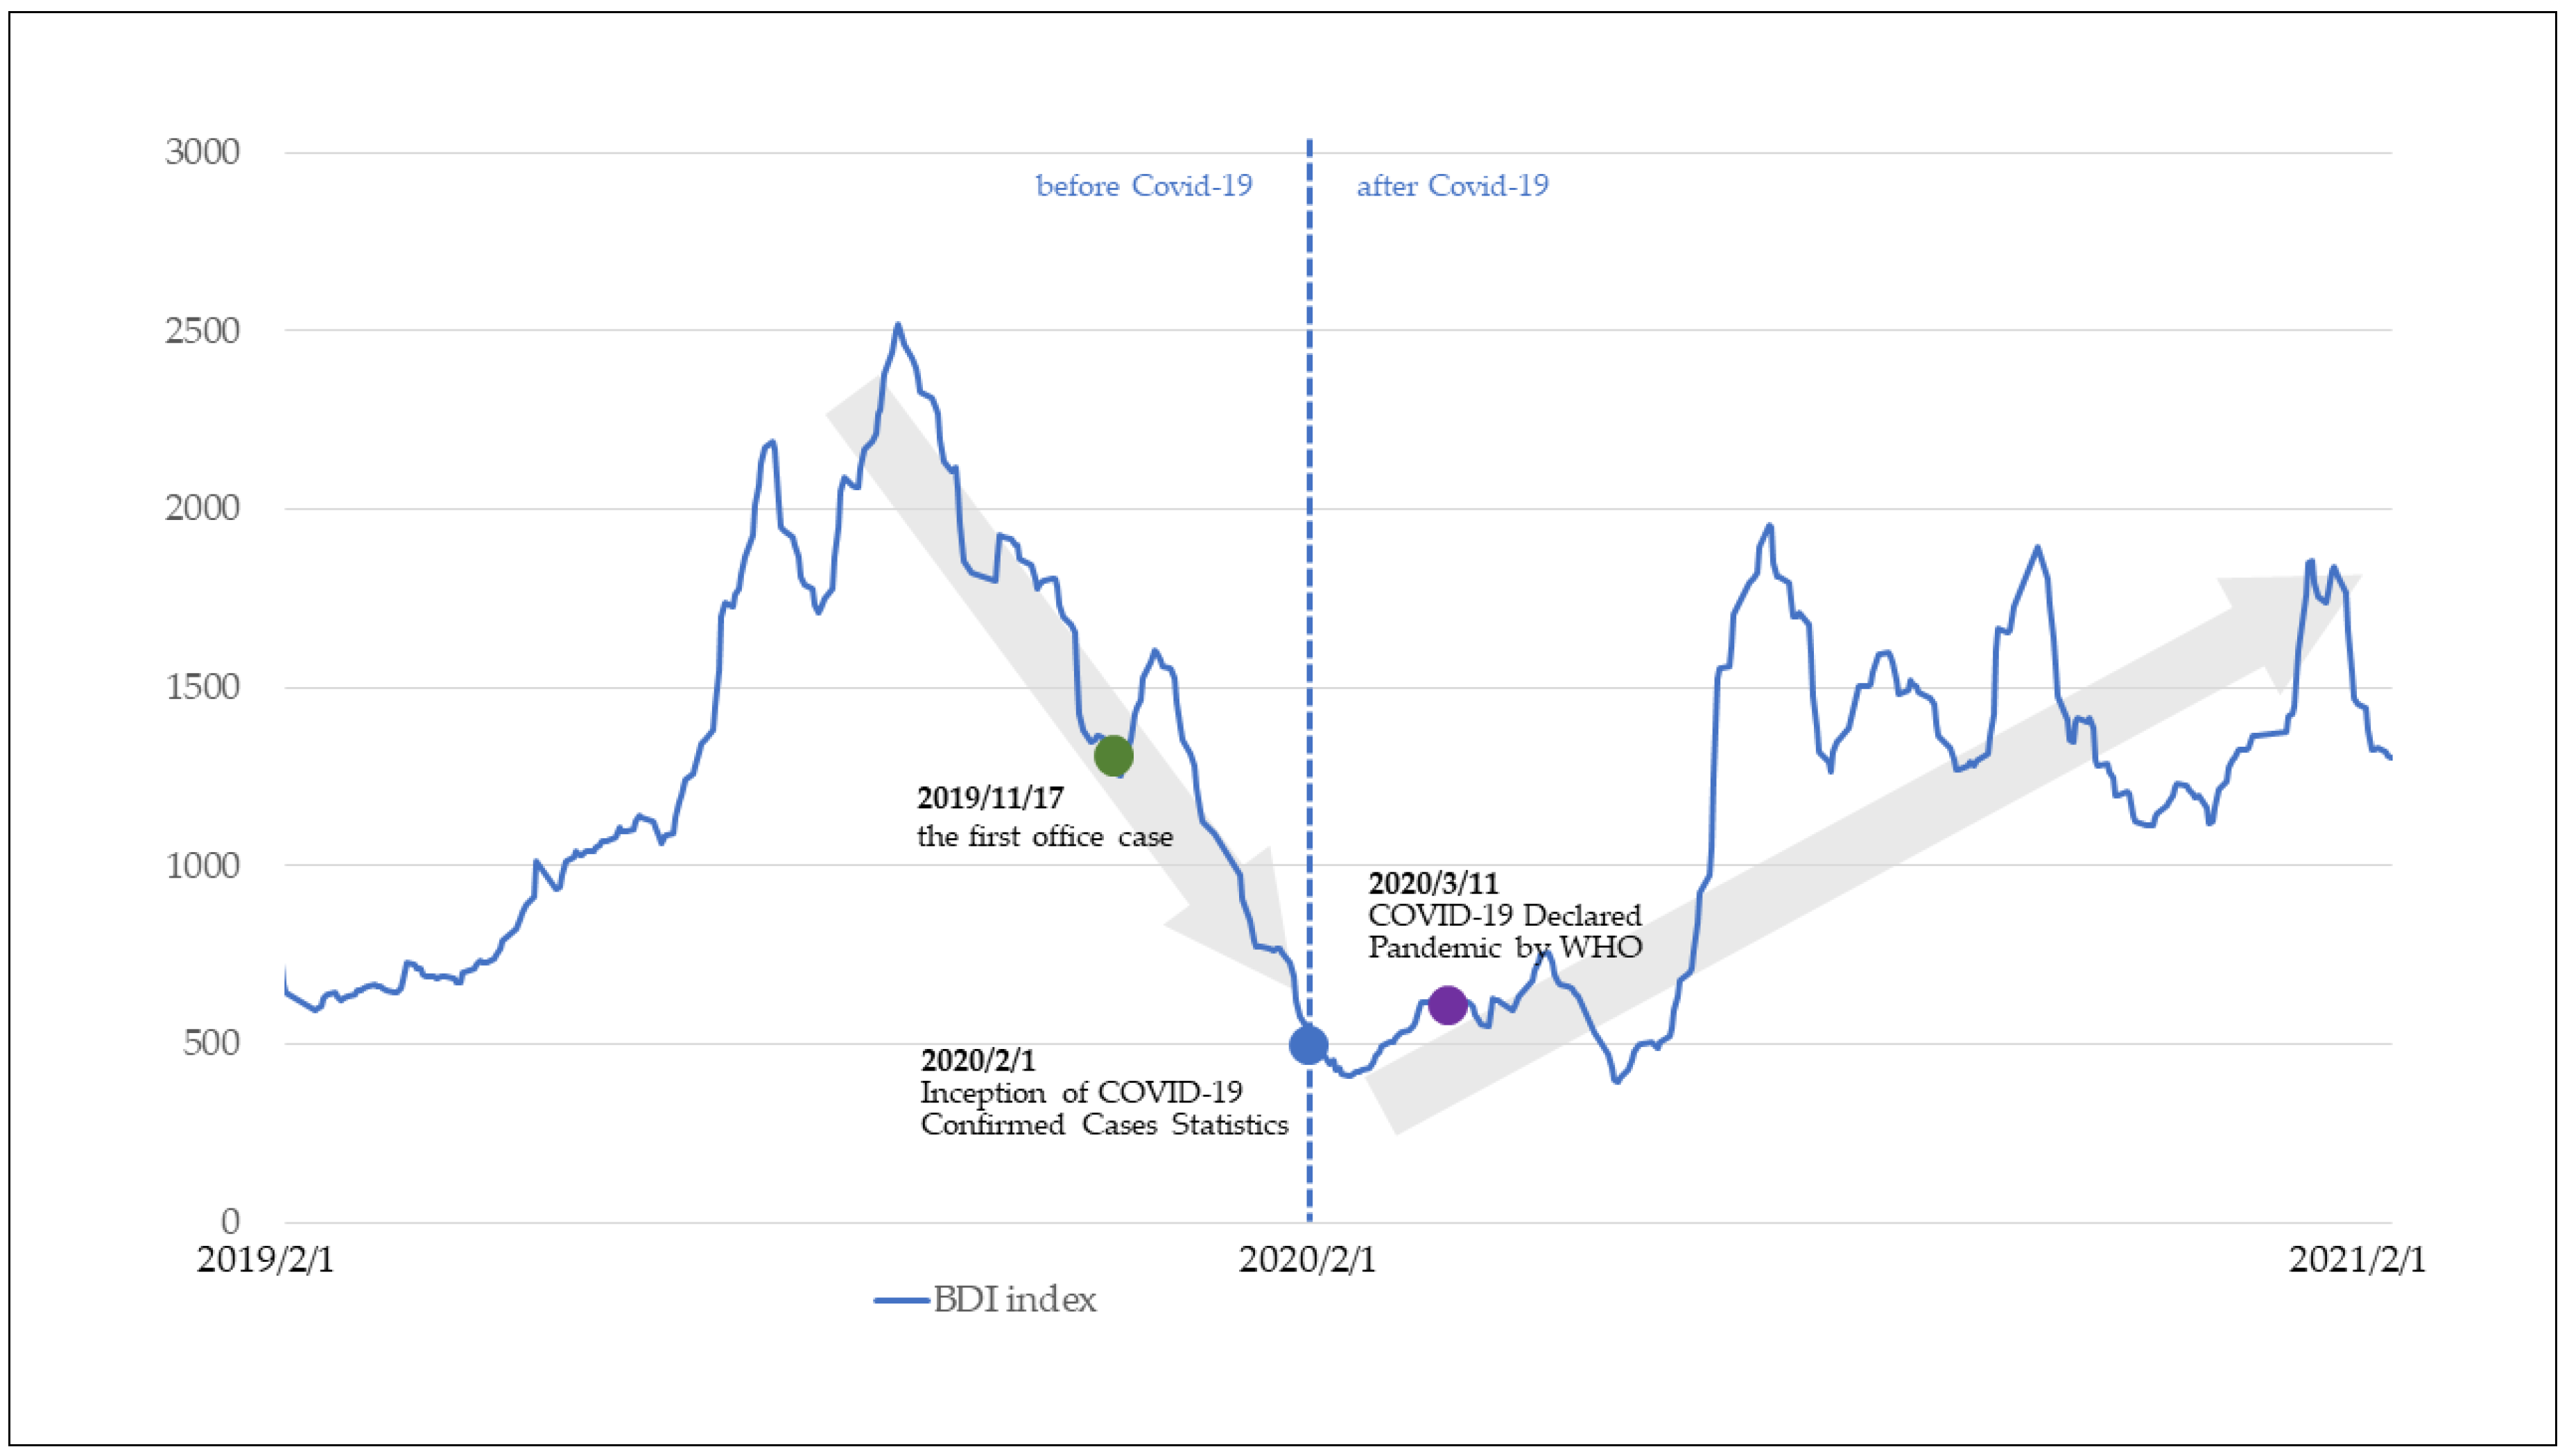
:1. Introduction
2. Literature Review
2.1. The Baltic Dry Index
2.2. COVID-19
3. Methodology
3.1. Variables
- Baltic Dry Index (BDI): The BDI, a composite of the Capesize, Panamax, and Supramax Timecharter Averages, is a shipping freight-cost index of dry bulk commodities issued daily by the London-based Baltic Exchange. It mainly transports staple raw materials and industrial raw materials such as steel, grain, coal, etc. There is an inextricable relationship between the BDI, the global economic outlook, and raw material prices, so the BDI is commonly perceived as a leading economic indicator [18,19,20].
- Brent: Brent is an international crude oil evaluation and observation system. It is considered a light, sweet crude oil (low-sulfur crude oil) and is used to measure the level of oil prices. Brent is the most used and referenced oil price figure.
- Standard and Poor’s 500 (S&P 500): The S&P 500 is one of the top 500 most traded stocks in the U.S. Compared to the Dow Jones Industrial Average (DJIA), The S&P 500 includes more companies, so it reflects a broader range of market changes and the fundamental importance of a company’s stock in the stock market [26].
- Volatility Index (VIX): The VIX is the ticker symbol for the Chicago Board Options Exchange’s CBOE Volatility Index, a popular measure of the stock market’s expectation of volatility based on S&P 500 index options [19].
- Shanghai Index: The Shanghai Index is a Capitalization-weighted Index that reflects statistical indicators of the overall trend in listed stocks on the Shanghai Stock Exchange. It is a basis for observing the China stock market and market boom.
- Bunker Index: The Bunker Index uses the average price of Bunker Index 180 CST and Bunker Index 380 CST published by Bunker Research. It is an average of bunker prices at ports worldwide, such as Singapore and other international commercial ports.
- Global Steel Price (Steel Price): Global steel transaction price is mainly provided by the Shanghai Futures Exchange (SHFE) and the London Metal Exchange (LME).
- Iron Price (Iron Price): London Metal Exchange (LME) mainly provides global iron ore transaction prices.
- Steel Scrap Price (Steel Scrap): London Metal Exchange (LME) mainly provides global steel scrap transaction prices.
- Commodity Research Bureau Index (CRB Index): The CRB Index was compiled by the U.S. Commodity Research Bureau and appeared in 1957. This particular commodity index encompasses a total of 19 commodities, with an allocation breakdown as follows: 39% is assigned to energy contracts, 41% to agriculture, 7% to precious metals, and 13% to industrial metals. The CRB Index is a critical reference indicator of international commodity price volatility.
- London Metal Exchange Index (LME Index): The LME Index is six metals from the London Metal Exchange, with the following weights: aluminum (42.8%), copper (31.2%), zinc (14.8%), lead (8.2%), nickel (2%), and tin (1%).
- U.S. Dollar Index: The U.S. Dollar Index measures the value of the U.S. dollar relative to a basket of foreign currencies, often referred to as a basket of U.S. trade partners’ currencies. It is a weighted geometric mean of the dollar’s value relative to six main currencies (Euro (EUR), Japanese yen (JPY), Pound sterling (GBP), Canadian dollar (CAD), Swedish krona (SEK), and Swiss franc (CHF)). Also, the indexes started in 1973 with a base of 100. It means that if the U.S. Dollar Index, the U.S. dollar is gaining value. As most of the significant international commodities are denominated in U.S. dollars, the rise and fall of the U.S. dollar is one of the indicators of the global economy and trade.
- Port Calls (Port Calls): The Global Port Calls is a global port index composed of 82 international ports worldwide, covering more than 60% of global port trade. It is an important indicator of global trade [11].
- COVID-19 global confirmed cases (Coronavirus): The collection of Coronavirus data in this study relies on the officially announced data provided by the World Health Organization (WHO). The WHO initiated the systematic recording of confirmed cases globally from 3rd February 2020 onward.
3.2. Stationarity Check
3.3. Variables Selection Method—Stepwise Regression
4. Results
4.1. Correlation Analysis
4.2. Results before COVID-19
4.2.1. Result of the BDI Stepwise Regression before COVID-19
4.2.2. Test for Autocorrelation
4.2.3. Heteroscedasticity Test
4.3. Results after COVID-19
4.3.1. Result of the BDI Stepwise Regression after COVID-19
4.3.2. Test for Autocorrelation
4.3.3. Heteroscedasticity Test
5. Discussion
5.1. Discussion of Findings
5.2. Academic Implications
- Understanding the Impact of COVID-19 on Global Shipping: The paper aims to investigate the impact of the COVID-19 pandemic on global shipping by analyzing the BDI as an economic indicator. This contributes to the academic understanding of how global shipping has been affected by the pandemic and provides insights into the dynamics of the shipping industry during such crises.
- Identification of Factors Influencing the BDI: The study examines various independent variables, including Brent, Standard and Poor’s 500, Volatility Index (VIX), Shanghai Index, Bunker Index, Steel Price, Iron Price, Steel Scrap Price, CRB Index, LME Index, US Dollar Index, Port Calls, and COVID-19 Cases, to understand their influences on the BDI. By employing stepwise regression analysis, the research identifies the key factors that shape the BDI in different temporal contexts. This contributes to the academic knowledge on the determinants of the BDI and its relationship with global economic factors.
- Comparative Analysis of Pre- and Post-Pandemic Influences on the BDI: The present study illuminates the alterations in the relative significance of factors influencing the BDI before and after the advent of the COVID-19 outbreak. It reveals a discernible shift in the salience of variables, such as the US Dollar Index, which transitions from a positive association with the BDI to a negative one. Furthermore, the oil price indicators (Brent and Bunker index) and the CRB index exhibit a transition in importance toward the iron price determinants (Iron Price and Steel Scrap Price). These insights provide valuable observations about the evolving dynamics within the shipping industry and the repercussions of the pandemic on these dynamic characteristics.
- Dynamic Nature of BDI Factors: The study underscores the dynamic nature of the factors influencing the BDI, especially in the context of the COVID-19 pandemic. It reveals that certain variables exhibited varying degrees of significance in different temporal contexts, indicating the adaptability and responsiveness of the shipping industry to changing circumstances.
5.3. Practical Implications
- Decision-Making for Shipping Industry Professionals: The research provides insights into the factors influencing the BDI in different temporal contexts, including pre- and post-pandemic periods. Professionals in the shipping industry, such as shipping companies, port authorities, and logistics managers, can utilize these findings to make informed decisions. They can consider the shifting significance of variables like the US Dollar Index, Port Calls, Iron Price, Brent, Port Calls, and CRB Index to adjust their strategies, optimize operations, and mitigate risks.
- Economic Analysis and Forecasting: The research establishes the BDI as an early economic indicator for global economic production, influenced by supply and demand conditions in the shipping industry. Economists, analysts, and financial institutions can utilize this knowledge to incorporate the BDI into their economic analyses and forecasting models. The BDI can serve as an additional tool for assessing the health and performance of the global economy, especially during periods of economic disruptions, such as the COVID-19 pandemic.
- Risk Management and Adaptability: The study reveals the dynamic nature of the factors influencing the BDI and the shipping industry as a whole. This understanding can assist stakeholders in risk management and adaptability planning. Shipping companies, investors, and other relevant entities can consider the identified variables and their changing significances to develop strategies that enable them to navigate uncertain times effectively and respond to evolving market conditions.
- Industry Collaboration and Resilience: The research highlights the challenges faced by the shipping industry during the COVID-19 pandemic, including disruptions in logistics operations and surging shipping prices. These insights can foster collaboration among industry stakeholders to address common issues and enhance the resilience of the global shipping ecosystem. By working together and leveraging the knowledge gained from this research, industry players can identify opportunities for innovation, optimize supply chains, and ensure the smooth flow of goods and commodities.
6. Conclusions and Limitations
6.1. Conclusions
6.2. Limitations
Author Contributions
Funding
Institutional Review Board Statement
Informed Consent Statement
Data Availability Statement
Conflicts of Interest
References
- Pallis, A.A. COVID-19 and Maritime Transport Impact and Responses; UNCTAD: Geneva, Switzerland, 2021. [Google Scholar]
- Chen, H.-C.; Yeh, C.-W. Global Financial Crisis and COVID-19: Industrial Reactions. Financ. Res. Lett. 2021, 42, 101940. [Google Scholar] [CrossRef] [PubMed]
- Di Vaio, A.; Latif, B.; Gunarathne, N.; Gupta, M.; D’Adamo, I. Digitalization and artificial knowledge for accountability in SCM: A systematic literature review. J. Enterp. Inf. Manag. 2023; ahead-of-print. [Google Scholar] [CrossRef]
- Ruan, Q.; Wang, Y.; Lu, X.; Qin, J. Cross-Correlations between Baltic Dry Index and Crude Oil Prices. Physica A 2016, 453, 278–289. [Google Scholar] [CrossRef]
- Grammenos, C.T.; Arkoulis, A.G. Macroeconomic Factors and International Shipping Stock Returns. Int. J. Marit. Econ. 2002, 4, 81–99. [Google Scholar] [CrossRef]
- Alizadeh, A.H.; Muradoglu, Y.G. Stock Market Returns and Shipping Freight Market Information: Yet Another Puzzle! 2011. Available online: https://www.researchgate.net/publication/228259570_Stock_Market_Returns_and_Shipping_Freight_Market_Information_Yet_Another_Puzzle (accessed on 9 May 2023).
- Andriosopoulos, K.; Doumpos, M.; Papapostolou, N.C.; Pouliasis, P.K. Portfolio Optimization and Index Tracking for the Shipping Stock and Freight Markets Using Evolutionary Algorithms. Transp. Res. Part E Logist. Transp. Rev. 2013, 52, 16–34. [Google Scholar] [CrossRef]
- Erdogan, O.; Tata, K.; Karahasan, B.C.; Sengoz, M.H. Dynamics of the Co-Movement between Stock and Maritime Markets. Int. Rev. Econ. Financ. 2013, 25, 282–290. [Google Scholar] [CrossRef]
- Papailias, F.; Thomakos, D.D.; Liu, J. The Baltic Dry Index: Cyclicalities, Forecasting and Hedging Strategies. Empir. Econ. 2017, 52, 255–282. [Google Scholar] [CrossRef] [Green Version]
- Lin, A.J.; Chang, H.Y.; Hsiao, J.L. Does the Baltic Dry Index Drive Volatility Spillovers in the Commodities, Currency, or Stock Markets? Transp. Transp. Res. Part E Logist. Transp. Rev. 2019, 127, 265–283. [Google Scholar] [CrossRef]
- Gong, Y.; Li, K.X.; Chen, S.-L.; Shi, W. Contagion Risk between the Shipping Freight and Stock Markets: Evidence from the Recent US-China Trade War. Transp. Res. Part E Logist. Trans. Rev. 2020, 136, 101900. [Google Scholar] [CrossRef]
- Chen, Y.; Xu, J.; Miao, J. Dynamic volatility contagion across the Baltic dry index, iron ore price and crude oil price under the COVID-19: A copula-VAR-BEKK-GARCH-X approach. Resour. Policy 2023, 81, 103296. [Google Scholar] [CrossRef]
- Yang, J.; Zhang, X.; Ge, Y.-E. Measuring Risk Spillover Effects on Dry Bulk Shipping Market: A Value-at-Risk Approach. Marit. Policy Manag. 2022, 49, 558–576. [Google Scholar] [CrossRef]
- Siddiqui, A.W.; Basu, R. An Empirical Analysis of Relationships between Cyclical Components of Oil Price and Tanker Freight Rates. Energy 2020, 200, 117494. [Google Scholar] [CrossRef]
- Angelopoulos, J.; Sahoo, S.; Visvikis, I.D. Commodity and Transportation Economic Market Interactions Revisited: New Evidence from a Dynamic Factor Model. Transp. Res. Part E Logist. Trans. Rev. 2020, 133, 101836. [Google Scholar] [CrossRef]
- Michail, N.A. World Economic Growth and Seaborne Trade Volume: Quantifying the Relationship. Transp. Res. Interdiscip. Perspect. 2020, 4, 100108. [Google Scholar] [CrossRef]
- Bildirici, M.; Onat, I.Ş.; Ersin, Ö. Examination of the predict-ability of BDI and VIX: A threshold approach. Int. J. Transp. Econ. 2019, XLVI, 9–28. [Google Scholar]
- Bildirici, M.; Şahin Onat, I.; Ersin, Ö.Ö. Forecasting BDI Sea Freight Shipment Cost, VIX Investor Sentiment and MSCI Global Stock Market Indicator Indices: LSTAR-GARCH and LSTAR-APGARCH Models. Mathematics 2023, 11, 1242. [Google Scholar] [CrossRef]
- Tsioumas, V.; Smirlis, Y.; Papadimitriou, S. Capturing the impact of economic forces on the dry bulk freight market. Marit. Transp. Res. 2021, 2, 100018. [Google Scholar] [CrossRef]
- Ashraf, B.N. Economic Impact of Government Interventions during the COVID-19 Pandemic: International Evidence from Financial Markets. J. Behav. Exp. Financ. 2020, 27, 100371. [Google Scholar] [CrossRef] [PubMed]
- Michail, N.A.; Melas, K.D. Shipping Markets in Turmoil: An Analysis of the COVID-19 Outbreak and Its Implications. Transp. Res. Interdiscip. Perspect. 2020, 7, 100178. [Google Scholar] [CrossRef] [PubMed]
- Hasan, M.B.; Mahi, M.; Sarker, T.; Amin, M.R. Spillovers of the COVID-19 Pandemic: Impact on Global Economic Activity, the Stock Market, and the Energy Sector. J. Risk Financ. Manag. 2021, 14, 200. [Google Scholar] [CrossRef]
- Shrestha, N.; Shad, M.Y.; Ulvi, O.; Khan, M.H.; Karamehic-Muratovic, A.; Nguyen, U.-S.D.T.; Baghbanzadeh, M.; Wardrup, R.; Aghamohammadi, N.; Cervantes, D.; et al. The Impact of COVID-19 on Globalization. One Health 2020, 11, 100180. [Google Scholar] [CrossRef] [PubMed]
- Kitamura, Y.; Karkour, S.; Ichisugi, Y.; Itsubo, N. Evaluation of the Economic, Environmental, and Social Impacts of the COVID-19 Pandemic on the Japanese Tourism Industry. Sustainability 2020, 12, 10302. [Google Scholar] [CrossRef]
- Xu, L.; Yang, S.; Chen, J.; Shi, J. The Effect of COVID-19 Pandemic on Port Performance: Evidence from China. Ocean Coast. Manag. 2021, 209, 105660. [Google Scholar] [CrossRef] [PubMed]
- Brealey, R.A.; Myers, S.C.; Allen, F. Principles of Corporate Finance; McGraw-Hill/Irwin: New York, NY, USA, 2014. [Google Scholar]

| Variables | Measures | Unit | Frequency | Source |
|---|---|---|---|---|
| Baltic Dry Index (BDI) | GBP | Daily | Baltic Exchange | |
| Brent | USD/TNK | Daily | ICEFE 1 | |
| Standard and Poor’s 500 | USD | Daily | NYSE 2 | |
| Volatility Index (VIX) | USD | Daily | NYSE | |
| Shanghai Index | CNY | Daily | SSE 3 | |
| Bunker Index | USD/TNE | Daily | Bunker 4 | |
| Steel Price | USD/TNE | Daily | SHFE 5, LME 6 | |
| Iron Price | USD | Daily | LME | |
| Steel Scrap Price | USD/TNE | Daily | LME | |
| CRB Index | USD | Daily | NYMEX 7 | |
| LME Index | USD | Daily | LME | |
| US Dollar Index | Based period on 1973 | Daily | NYCY 8 | |
| Port Calls | Based period on 2008 | Monthly | RWI/ISL 9 | |
| COVID-19 Cases | Daily confirmed cases | Daily | WHO 10 |
| Variables | Mean | SD | Maximum | Minimum | Skewness | Kurtosis |
|---|---|---|---|---|---|---|
| BDI | 1328.057 | 541.539 | 2518 | 576 | 0.3743474 | 1.942579 |
| Brent | 64.17816 | 3.955042 | 74.57 | 54.91 | 0.4582497 | 2.704772 |
| Standard and Poor’s 500 | 2934.177 | 169.847 | 3329.62 | 2447.89 | 0.0234382 | 3.113209 |
| Volatility Index (VIX) | 15.22576 | 2.633363 | 25.45 | 11.54 | 1.054102 | 3.853339 |
| Shanghai Index | 4134.172 | 18,843.84 | 29,7871 | 2464.36 | 15.55455 | 242.9643 |
| Bunker Index | 431.2061 | 35.674 | 497.5 | 364.5 | −0.1590372 | 1.789265 |
| Steel Price | 3780.494 | 191.129 | 4192 | 2760 | −0.3101305 | 5.389448 |
| Iron Price | 93.21204 | 11.38113 | 123.19 | 71.06 | 0.8880165 | 3.950634 |
| Steel Scrap Price | 288.5123 | 25.40274 | 330 | 235 | −0.5680389 | 2.573212 |
| CRB Index | 179.3323 | 4.673222 | 189.66 | 167.89 | −0.2639299 | 2.534157 |
| LME Index | 2852.202 | 94.02627 | 3058 | 2717.8 | 0.8535983 | 2.59956 |
| US Dollar Index | 97.14896 | 0.8823592 | 99.021 | 94.79 | −0.3253769 | 2.661322 |
| Port Calls | 115.909 | 4.534883 | 121.3 | 100.2 | −2.183438 | 8.569458 |
| Variables | Mean | SD | Maximum | Minimum | Skewness | Kurtosis |
|---|---|---|---|---|---|---|
| BDI | 1124.847 | 462.7662 | 1956 | 393 | −0.1560041 | 1.655002 |
| Brent | 42.95685 | 9.445393 | 61.47 | 19.33 | −0.3685739 | 2.786709 |
| Standard and Poor’s 500 | 3272.699 | 367.6489 | 3915.59 | 2237.4 | −0.4738171 | 2.779977 |
| Volatility Index (VIX) | 30.13737 | 11.91423 | 82.69 | 13.68 | 2.015219 | 7.590668 |
| Shanghai Index | 3172.149 | 263.7619 | 3655.09 | 2660.17 | −0.1759481 | 1.649951 |
| Bunker Index | 313.8511 | 48.5005 | 407 | 200 | −0.208855 | 2.575449 |
| Steel Price | 3736.702 | 277.8824 | 4546 | 3294 | 0.624765 | 2.564149 |
| Iron Price | 114.1662 | 25.90873 | 170.03 | 78.33 | 0.6338015 | 2.486254 |
| Steel Scrap Price | 301.9438 | 66.67363 | 483.5 | 48 | 1.111886 | 4.356229 |
| CRB Index | 148.3337 | 17.35605 | 184.22 | 106.29 | −0.0716374 | 2.427222 |
| LME Index | 2867.957 | 377.9657 | 3643 | 2231.9 | 0.2701468 | 2.028614 |
| US Dollar Index | 95.15678 | 3.618556 | 103.605 | 82.259 | 0.0314093 | 2.376818 |
| Port Calls | 114.2779 | 8.434657 | 125.7 | 94.1 | −0.888869 | 3.145588 |
| COVID-19 Cases | 290,188.6 | 260,299 | 1,497,272 | −530,881 | 0.5370899 | 4.071896 |
| Variables | Level | 1st Difference | ||
|---|---|---|---|---|
| t-Statistics | p-Value | t-Statistics | p-Value | |
| BDI | −0.609 | 0.8689 | −4.338 | 0.0004 *** |
| Brent | −3.974 | 0.0016 *** | ||
| Standard and Poor’s 500 | −1.803 | 0.3788 | −12.239 | 0.000 *** |
| Volatility Index (VIX) | −6.048 | 0.000 *** | ||
| Shanghai Index | −13.707 | 0.000 *** | ||
| Bunker Index | −1.121 | 0.7068 | −18.774 | 0.000 *** |
| Steel Price | −4.166 | 0.0008 *** | ||
| Iron Price | −1.887 | 0.3384 | −6.667 | 0.000 *** |
| Steel Scrap Price | −0.850 | 0.8041 | −7.797 | 0.000 *** |
| CRB Index | −2.824 | 0.0550 * | ||
| LME Index | −1.026 | 0.7436 | −12.245 | 0.000 *** |
| US Dollar Index | −2.635 | 0.0938 * | ||
| Port Calls | −2.569 | 0.0996 * | ||
| Variables | Level | 1st Difference | ||
|---|---|---|---|---|
| t-Statistics | p-Value | t-Statistics | p-Value | |
| BDI | −2.541 | 0.1058 | −5.599 | 0.000 *** |
| Brent | −1.047 | 0.7356 | −9.556 | 0.000 *** |
| Standard and Poor’s 500 | −1.129 | 0.7033 | −14.660 | 0.000 *** |
| Volatility Index (VIX) | −3.109 | 0.0259 ** | ||
| Shanghai Index | −1.821 | 0.3703 | −8.511 | 0.000 *** |
| Bunker Index | 0.571 | 0.9869 | −23.107 | 0.000 *** |
| Steel Price | −0.356 | 0.9172 | −13.904 | 0.000 *** |
| Iron Price | 0.967 | 0.9939 | −11.886 | 0.000 *** |
| Steel Scrap Price | −3.792 | 0.0030 *** | ||
| CRB Index | −1.546 | 0.5109 | −6.503 | 0.000 *** |
| LME Index | 1.870 | 0.9985 | −11.241 | 0.000 *** |
| US Dollar Index | −2.838 | 0.0936 * | ||
| Port Calls | −0.431 | 0.9047 | −11.744 | 0.000 *** |
| COVID-19 Cases | −4.506 | 0.0002 *** | ||
| Variables | BDI | Brent | S&P 500 | VIX | Shanghai | Buke | STLPrice | IronPrice | STLScrap | CRB | LME | USDollar | PortCalls |
|---|---|---|---|---|---|---|---|---|---|---|---|---|---|
| BDI | 1.000 | −0.627 ** | 0.172 ** | 0.262 ** | −0.265 ** | −0.289 ** | −0.135 * | 0.302 ** | −0.720 ** | −0.668 ** | −0.652 ** | 0.598 ** | 0.556 ** |
| Brent | 10.000 | −0.160 * | −0.308 ** | 0.446 ** | 0.582 ** | 0.522 ** | −0.022 | 0.552 ** | 0.807 ** | 0.627 ** | −0.369 ** | −0.180 ** | |
| S&P 500 | 10.000 | −0.507 ** | 0.165 * | −0.615 ** | −0.292 ** | 0.004 | −0.383 ** | 0.175 ** | −0.320 ** | 0.195 ** | 0.079 | ||
| VIX | 10.000 | −0.377 ** | 0.066 | −0.033 | 0.026 | −0.040 | −0.655 ** | −0.357 ** | 0.225 ** | 0.202 ** | |||
| Shanghai | 10.000 | 0.230 ** | 0.154 ** | −0.024 | 0.131 * | 0.543 ** | 0.474 ** | −0.270 ** | 0.126 | ||||
| Bunker | 10.000 | 0.583 ** | 0.271 ** | 0.428 ** | 0.315 ** | 0.569 ** | −0.288 ** | 0.011 | |||||
| STLPrice | 10.000 | 0.490 ** | 0.474 ** | 0.259 ** | 0.239 ** | −0.140 * | 0.176 ** | ||||||
| IronPrice | 10.000 | 0.119 | −0.114 | −0.283 ** | −0.181 ** | 0.492 ** | |||||||
| STLScrap | 10.000 | 0.478 ** | 0.585 ** | −0.654 ** | −0.350 ** | ||||||||
| CRB | 10.000 | 0.695 ** | −0.518 ** | −0.369 ** | |||||||||
| LME | 10.000 | −0.508 ** | −0.429 ** | ||||||||||
| USDollar | 10.000 | 0.312 ** | |||||||||||
| PortCalls | 10.000 |
| Variables | BDI | Brent | S&P 500 | VIX | Shanghai | Bunker | STLPrice | IronPrice | STLScrap | CRB | LME | USDollar | PortCalls | COVID |
|---|---|---|---|---|---|---|---|---|---|---|---|---|---|---|
| BDI | 1.000 | 0.369 ** | 0.604 ** | −0.346 ** | 0.808 ** | 0.323 ** | 0.610 ** | 0.704 ** | 0.462 ** | 0.323 ** | 0.673 ** | −0.708 ** | 0.787 ** | 0.550 ** |
| Brent | 10.000 | 0.798 ** | −0.681 ** | 0.631 ** | 0.933 ** | 0.493 ** | 0.575 ** | 0.633 ** | 0.946 ** | 0.699 ** | −0.610 ** | 0.105 | 0.428 ** | |
| S&P 500 | 10.000 | −0.782 ** | 0.870 ** | 0.717 ** | 0.778 ** | 0.832 ** | 0.752 ** | 0.758 ** | 0.928 ** | −0.877 ** | 0.515 ** | 0.744 ** | ||
| VIX | 10.000 | −0.542 ** | −0.480 ** | −0.400 ** | −0.397 ** | −0.372 ** | −0.562 ** | −0.544 ** | 0.522 ** | 0.158 * | −0.379 ** | |||
| Shanghai | 10.000 | 0.589 ** | 0.803 ** | 0.881 ** | 0.727 ** | 0.634 ** | 0.924 ** | −0.917 ** | 0.762 ** | 0.757 ** | ||||
| Bunker | 10.000 | 0.458 ** | 0.564 ** | 0.649 ** | 0.951 ** | 0.684 ** | −0.589 ** | 0.094 | 0.400 ** | |||||
| STLPrice | 10.000 | 0.859 ** | 0.831 ** | 0.493 ** | 0.877 ** | −0.831 ** | 0.636 ** | 0.839 ** | ||||||
| IronPrice | 10.000 | 0.905 ** | 0.605 ** | 0.935 ** | −0.897 ** | 0.708 ** | 0.840 ** | |||||||
| STLScrap | 10.000 | 0.678 ** | 0.858 ** | −0.760 ** | 0.448 ** | 0.770 ** | ||||||||
| CRB | 10.000 | 0.734 ** | −0.637 ** | 0.145 * | 0.459 ** | |||||||||
| LME | 10.000 | −0.935 ** | 0.667 ** | 0.857 ** | ||||||||||
| USDollar | 10.000 | −0.739 ** | −0.793 ** | |||||||||||
| PortCalls | 10.000 | 0.672 ** | ||||||||||||
| COVID | 10.000 |
| Source | SS | df | MS | Number of obs = 188 F(9, 178) = 50.25 Prob > F = 0.000 R-squared = 0.7176 Adj R-squared = 0.7033 Root MSE = 296.99 |
| Model | 39,888,983.5 | 9 | 4,432,109.28 | |
| Residual | 15,700,284.4 | 178 | 88,203.845 | |
| Total | 55,589,267.9 | 187 | 297,268.812 |
| ∆BDI | Estimation | SE | T-Value | p-Value | [95% Conf. Interval] | VIF | |
|---|---|---|---|---|---|---|---|
| CRB Index | −24.3696 | 12.89839 | −1.89 | 0.060 | −49.82303 | 1.083832 | 7.51 |
| US Dollar | 220.8933 | 35.06297 | 6.3 | 0.000 | 151.7007 | 290.0859 | 4.83 |
| Port Calls | 37.43986 | 5.449355 | 6.87 | 0.000 | 26.6862 | 48.19351 | 2.53 |
| Brent | −60.25977 | 12.36883 | −4.87 | 0.000 | −84.66818 | −35.85136 | 2.03 |
| ∆Bunker Index | 9.572698 | 3.061649 | 3.13 | 0.002 | 3.530899 | 15.6145 | 1.67 |
| ∆LME Index | 3.528453 | 1.178964 | 2.99 | 0.003 | 1.201909 | 5.854997 | 1.36 |
| Steel Price | 0.3043951 | 0.1461573 | 2.08 | 0.039 | 0.015971 | 0.5928192 | 1.32 |
| VIX | −33.36271 | 13.99597 | −2.38 | 0.018 | −60.98209 | −5.743338 | 1.31 |
| ∆SP 500 | −2.087742 | 1.204358 | −1.73 | 0.085 | −4.4644 | 0.288915 | 1.03 |
| Intercept | −16872.95 | 5051.762 | −3.34 | 0.001 | −26842 | −6903.895 | 2.62 |
| lags(p) | chi2 | df | Prob > chi2 |
|---|---|---|---|
| 1 | 2.806 | 1 | 0.0939 |
| H0: no serial correlation | |||
| Breusch–Pagan/Cook–Weisberg Test for Heteroskedasticity |
|---|
| Assumption: Normal error terms |
| Variable: Fitted values of BDI |
| chi2(1) = 1.70 |
| Prob > chi2 = 0.1924 |
| Source | SS | df | MS | Number of obs = 174 F(5, 168) = 44.12 Prob > F = 0.000 R-squared = 0.5677 Adj R-squared = 0.5548 Root MSE = 311.37 |
| Model | 21,386,889.1 | 5 | 4,277,377.82 | |
| Residual | 16,287,463.9 | 168 | 96,949.1901 | |
| Total | 37,674,353 | 173 | 217,770.827 |
| ∆BDI | Estimation | SE | T-Value | p-Value | [95% Conf. Interval] | VIF | |
|---|---|---|---|---|---|---|---|
| US Dollar | −95.4527 | 11.32449 | −8.43 | 0.000 | −117.809 | −73.0961 | 3.05 |
| ∆Iron Price | −36.935 | 16.96914 | −2.18 | 0.031 | −70.4352 | −3.43477 | 1.05 |
| ∆Port Calls | 78.76864 | 33.53117 | 2.35 | 0.020 | 12.5719 | 144.9654 | 1.03 |
| Steel Scrap Price | −1.58 | 0.629486 | −2.51 | 0.013 | −2.82272 | −0.33728 | 2.84 |
| COVID-19 | 0.000359 | 0.000164 | 2.19 | 0.030 | 3.57 × 10⁻⁵ | 0.000683 | 3.06 |
| Intercept | 10,593.28 | 1187.047 | 8.92 | 0 | 8249.826 | 12,936.73 | |
| lags(p) | chi2 | df | Prob > chi2 |
|---|---|---|---|
| 1 | 9.621 | 1 | 0.0654 |
| H0: no serial correlation | |||
| Breusch–Pagan/Cook–Weisberg Test for Heteroskedasticity |
|---|
| Assumption: Normal error terms |
| Variable: Fitted values of BDI |
| chi2(1) = 0.11 |
| Prob > chi2 = 0.7442 |
Disclaimer/Publisher’s Note: The statements, opinions and data contained in all publications are solely those of the individual author(s) and contributor(s) and not of MDPI and/or the editor(s). MDPI and/or the editor(s) disclaim responsibility for any injury to people or property resulting from any ideas, methods, instructions or products referred to in the content. |
© 2023 by the authors. Licensee MDPI, Basel, Switzerland. This article is an open access article distributed under the terms and conditions of the Creative Commons Attribution (CC BY) license (https://creativecommons.org/licenses/by/4.0/).
Share and Cite
Chang, C.-W.; Hsueh, M.-H.; Wang, C.-N.; Huang, C.-C. Exploring the Factors Influencing the Impact of the COVID-19 Pandemic on Global Shipping: A Case Study of the Baltic Dry Index. Sustainability 2023, 15, 11367. https://doi.org/10.3390/su151411367
Chang C-W, Hsueh M-H, Wang C-N, Huang C-C. Exploring the Factors Influencing the Impact of the COVID-19 Pandemic on Global Shipping: A Case Study of the Baltic Dry Index. Sustainability. 2023; 15(14):11367. https://doi.org/10.3390/su151411367
Chicago/Turabian StyleChang, Cheng-Wen, Ming-Hsien Hsueh, Chia-Nan Wang, and Cheng-Chun Huang. 2023. "Exploring the Factors Influencing the Impact of the COVID-19 Pandemic on Global Shipping: A Case Study of the Baltic Dry Index" Sustainability 15, no. 14: 11367. https://doi.org/10.3390/su151411367
APA StyleChang, C.-W., Hsueh, M.-H., Wang, C.-N., & Huang, C.-C. (2023). Exploring the Factors Influencing the Impact of the COVID-19 Pandemic on Global Shipping: A Case Study of the Baltic Dry Index. Sustainability, 15(14), 11367. https://doi.org/10.3390/su151411367