Article

Global or Local Spatial Spillovers? Industrial Diversity and Economic Resilience in the Middle Reaches of the Yangtze River Urban Agglomeration, China

1
College of Urban and Environmental Sciences, Central China Normal University, Wuhan 430079, China
2
Key Laboratory for Geographical Process Analysis and Simulation of Hubei Province, Central China Normal University, Wuhan 430079, China
*
Author to whom correspondence should be addressed.
Sustainability 2023, 15(14), 11376; https://doi.org/10.3390/su151411376
Submission received: 14 June 2023 / Revised: 12 July 2023 / Accepted: 20 July 2023 / Published: 21 July 2023
(This article belongs to the Special Issue Urban Economic Development and Planning: Sustainable Development)

Abstract

:
A growing body of literature has studied the empirical relationship between industrial diversity and economic resilience since the 2008 Great Recession. However, many existing studies are based on a nonspatial perspective, and little is known about the local or global spatial spillover effect of industrial diversity on economic resilience. This paper employs Bayesian spatial econometric methods to investigate the roles of related variety and unrelated variety on economic resilience in the middle reaches of the Yangtze River urban agglomeration, China and explores the possible local or global spatial spillover effect in the diversity–resilience relationship. The empirical results from the spatial Durbin error model estimation show that: (1) regions with high levels of related variety are economically resilient to the external shock in the postcrisis era, whereas unrelated variety has no significant direct effect on recovery resilience; (2) both related and unrelated variety have local spatial spillovers with respect to the one-year resilience of 2008–2009, but these spillovers are negligible in longer study periods. These results confirm the role of industrial relatedness and immediate neighbors in promoting regions’ short-run capabilities of recovery from external economic shocks.

1. Introduction

Economic sustainability encompasses not only economic growth but also economic resilience when regions withstand external shocks, such as an economic crisis or an epidemic, and at the same time retain their long-term ability to develop new growth paths. Since the Great Recession in 2008, many studies in the fields of regional science and economic geography have explored various aspects of economic resilience [1,2,3,4,5]. As for the determinants of economic resilience, industrial structure is generally regarded as the most important one [2,4]. In relation to agglomeration externalities, a great deal of literature has explored the role of industrial composition in affecting economic development from the perspectives of diversity and specialization [6,7]. However, the empirical evidence for these two competing perspectives is mixed. Some studies seem to support the claim that specializations or Marshall–Arrow–Romer externalities are more important for economic development because of labor market pooling, sharing intermediate inputs, and local knowledge spillovers [8,9], whereas others hold the opinion that industrial diversity is the precondition for knowledge spillovers and sustainable economic growth.
More recently, Frenken et al. [10] further distinguished industrial diversity into related variety and unrelated variety, and explored their different effects on regional economic performance, respectively. It is argued that related variety can encourage learning opportunities among industries with shared knowledge bases, produce knowledge spillovers, and therefore stimulate sustainable economic development [11]. However, some recent studies also indicate that related variety can neutralize the benefits of knowledge spillover and even undermine economic resilience. This is because economic risks can easily spread to other industries through interindustry relatedness [12]. Conversely, “do not put all your eggs in one basket” is an old English proverb that reminds us not to dedicate all your resources to one project. Along these lines, it is risky to make the economy of one region (basket) highly dependent on a small number of sectors (eggs) because it might suffer severely from external economic shocks, which has been referred to as the industry portfolio effect by many authors [13,14,15]. In other words, unrelated variety is expected to minimize the impacts of economic crises.
Although the empirical relationship between industrial diversity and economic resilience has been studied through the lens of related variety and unrelated variety [12,16], many present studies are based on a nonspatial viewpoint, and there is insufficient discussion on how industrial diversification’s geographical spillovers can affect regional economic resilience [15,17,18]. As mentioned earlier, no matter whether it is related variety as a “shock diffuser” or unrelated variety as a “shock absorber” that dominates the diversity–resilience relationship, regions do not exist in isolation and interact with each other, which is in line with Tobler’s [19] first law of geography: “everything is related to everything else, but near things are more related than distant ones”. To this end, one region’s industrial diversity might impact not only the economic performance of the region but also its neighbors. Meanwhile, from a modeling method perspective, some scholars further differentiate between global spatial spillovers and local spatial spillovers, consider the interaction between the region and its immediate or distant neighbors, and explore the spatial interaction at a more detailed level. Nevertheless, the possible differences between these two forms of spatial spillovers are novel to the existing economic resilience research and have seldom been mentioned before. For example, some studies attempt to confirm the role of spatial spillovers in contributing economic resilience, but this strand of research has not differentiated between global and local spatial spillovers. According to LeSage [20], local spatial spillovers only relate to immediate neighbors, whereas global spatial spillovers concern impacts to neighbors, neighbors of neighbors, and so on. He further suggested that the underlying mechanisms and corresponding economic development policy implications are totally different for these two forms of spatial spillovers.
Henceforth, this paper mainly concerns itself with two interconnected research questions, including (1) “what are the roles of related variety and unrelated variety in affecting economic resilience?” and (2) “what are the roles of the possible global spatial spillovers or local spatial spillovers in the diversity–resilience relationship?” As a case study, the middle reaches of the Yangtze River urban agglomeration (MRYRUA) in central China was chosen as the study region because it has diverse industrial bases and strong interregional connections among Chinese cities, which offers an ideal context to study the interconnections between industrial diversity, economic resilience, and spatial spillovers as well. From a broader perspective, this paper is expected to expand current understanding on the mechanism of how industrial diversity and its spatial spillovers can impact economic resilience on the one hand, and to provide theoretical guidance for the enhancement of economic resilience and regional integration for urban agglomerations in China on the other hand.
To answer the aforementioned research questions, the rest of this paper is organized as follows: Section 2 reviews the literature on regional resilience and industrial structure and Section 3 introduces the study region. After that, Section 4 describes the method and Section 5 discusses the empirical findings. Finally, Section 6 presents conclusions and future research directions.

2. Literature Review

2.1. The Concepts and Measurements of Economic Resilience

In different areas, the concept of resilience has distinct connotations and features. Three broad categories of resilience definitions can be identified from the existing literature [4]. First, originating from the field of physics, engineering resilience refers to the ability of a system to recover to its former state after encountering shock or disturbance, which has been widely discussed in economic stability studies [15,21]. Second, Holling [22] popularized the phrase “ecological resilience”, highlighting the ability to shift from one equilibrium to another after being disturbed. Third, the concept of resilience has absorbed recent insights from evolutionary economic geography (EEG), and evolutionary resilience has been defined as the ability of regions to continuously generate new growth routes [2]. Unlike the former two categories, EEG holds the opinion that regional sustainable economic development cannot be in a balanced and static state constantly, and evolutionary resilience is a continuous and dynamic process rather than a return to a stable equilibrium state [23].
Regardless of the diverse definitions mentioned above, the common premise is the existence of shocks or disturbances when discussing different forms of economic resilience. These disturbances can either be short-term shocks like financial crises, natural catastrophes, and pandemics [12] or long-term disturbances, such as climate change, and resource depletion [24]. More specifically, the occurrence of the global financial crisis in 2008 caused most of the world to suffer from different degrees of impacts, and regions have uneven capacities to withstand shocks and recover, which provides for a natural experiment to study economic resilience [15]. Similarly, the recent COVID-19 pandemic has also drawn scholarly interest from a variety of fields, such as regional economics, economic geography, and the like [25,26].
As for economic resilience measurement, no agreed approach has been established in current studies. Some scholars have used simple economic indicators, such as unemployment and GDP [12,27], whereas others have constructed more composite indexes. For instance, Martin [28] and Lagravinese [29] used the ratio between the drop in regional employment or output to the corresponding national drop to evaluate regional economic resilience. Furthermore, Martin and Sunley [30] argued that the resilience of regional economic systems in response to external crises is reflected in such four dimensions as resistance, recovery, reorientation, and renewal. Among these dimensions, resistance resilience reflects the vulnerability of the region to external disturbances, whereas recovery resilience represents the extent and speed of the region’s recovery after the crises. Based on these understandings, Martin et al. [4] measured the resistance and recovery resilience of the UK regions in response to economic crises since the 1980s, which has become the basis of many empirical studies [24,26,31].

2.2. Industrial Structure and Regional Economic Resilience

Although scholars have investigated different determinants of economic resilience, industrial structure is often considered one of the key factors affecting economic resilience [30]. For a long time, the relationship between industrial structure and economic performance has been explored in terms of economic specialization and diversity and there is a consensus that industrially diversified regions often display stable economic performance among regional scientists and economic geographers [7,12]. By comparison, the question of whether industrial specialization or diversity is more important for sustainable economic development remains unsolved.
More recently, with a deeper understanding of agglomeration economies and knowledge spillovers in EEG, industrial diversity has been distinguished into related variety and unrelated variety to study their different effects on regional economic development [10], which can be interpreted from the following three perspectives: First, related variety, as a manifestation of agglomeration economy, promotes knowledge spillover by providing more opportunities for interindustry learning, prevents regional lock-in caused by the homogeneous regional industrial structure, and thus helps enhance regional economic resilience [5,17,32]. To this end, related variety is expected to absorb the adverse impacts of external shocks. In comparison with Jacob’s idea of industrial diversity, related variety emphasizes the optimal cognitive distance between industries in the knowledge spillover effect [10]. The cognitive distance cannot be too far or too close. When the cognitive distance is too far, without a shared knowledge base, it is not easy for firms—such as fruit suppliers and automobile manufactures—to communicate effectively, let alone achieve collective learning. However, when the cognitive distance between two firms is extremely close, it is unlikely to generate new knowledge, since their knowledge bases overlap greatly.
Second, some recent studies have also suggested that related variety may act as a “shock diffuser” for spreading the risks of economic crisis among industrially related sectors and thus weaken regional economic resilience, which has been referred as the risk-spreading effect [12,33]. Although the knowledge spillover effect has been widely discussed in the literature [10,11], it is not until recently that the risk-spreading effect has received more attention. For example, using Chinese custom data, He et al. [12] found that cities with high levels of related variety are less likely to withstand economic shocks. They further argued that the effect of related variety depends on the balance between the knowledge spillover effect and the risk-spreading effect.
Third, based on the portfolio theory in finance [13,34], unrelated variety assumes that when an industry encounters external market changes, due to different types of industries with various demand elasticity, export orientation, labor, and capital intensity, other industries can make up for the corresponding gap and reduce the risk from external economic changes [15,21]. As such, unrelated variety can act as a “shock absorber” to disperse external disturbances into different industries or enterprises and thus can enhance regional economic resilience [27,31].
In addition to the three mechanisms of industrial diversity on economic resilience, the existing literature has also identified three general approaches for measuring industrial relatedness. The first measure of relatedness comprises standard industry classifications like the Standard Industry Code and North American Industry Classification System. Industries are defined as related if they belong to the same broad industry class. As such, three-digit industries that belong to the same two-digit industry are considered industrially related. Since most modern industry classification systems are hierarchical, this approach has widely been used [10,17]. Second, cooccurrence relatedness is defined based on how often two industries cooccur in the same region. For example, using country level export data sets, Hidalgo et al. [35] measured product relatedness based on information on cooccurrence of exported products. Similarly, according to the colocation of patents, Kogler et al. [36] measured technological relatedness in U.S. cities. Finally, the third measure of relatedness is based on the similarity of resources used between industries. Some studies have employed input–output tables to measure input similarities between sectors [37,38]. It is hypothesized that related industries have similar inputs and production technologies.

2.3. Global Versus Local Spatial Spillovers

Many early studies on the relationship between industrial diversity and economic resilience are based on a nonspatial perspective, which assumes that the influencing factors of economic resilience are difficult to move across the boundaries of regions. Nevertheless, regions in nature are not isolated. No matter whether it is the knowledge spillover effect, the industrial portfolio effect, or the risk-spreading effect that dominates the empirical diversity–resilience relationship, the interactions between regions can produce different degrees of spatial spillovers, as illustrated in later studies [14,15,21]. Given this, reliance on traditional nonspatial modeling methods might become problematic and the benefit of spatial econometric methods is that they can consider potential geographical spillovers that might be ignored in standard linear regression models [39].
One of the early works that consider these spatial spillover effects within the relationship between industrial diversity and economic development is that of Trendle [14], who used the spatial autoregressive model (SAR) and the spatial error model (SEM) to confirm the existence of spatial spillovers among local government areas in Queensland, Australia. That is to say, one region’s industrial diversity can not only impact the region itself, but also neighbors of the region in terms of economic performance. Since then, several scholars have used spatial econometric methods to interpret the magnitude and significance of spatial spillovers within the diversity–performance relationship [18]. For instance, Cainelli et al. [17] investigated the direct and indirect or spatial spillover effects of related variety on economic resilience in Italy using the spatial Durbin error model. In addition, existing EEG studies have also demonstrated that the emergence of new industries can be associated not only with one region’s industrial bases, but also with the neighboring regions’ industrial portfolio [40,41,42,43,44,45], which suggests the existence of spatial spillovers resulting from the knowledge spillover effect. In particular, Gao et al. [45] suggested that spillovers from both related industries and nearby regions are important channels of knowledge diffusion and these two channels behave as substitutes in regional economic diversification.
Recent advances in spatial econometrics further explicitly distinguish between global and local spatial spillovers [20]. The major differences between these two forms of spatial spillover can be summarized in the following way: On the one hand, local spatial spillovers involve only immediate neighbors, but global spatial spillovers imply impacts on neighboring regions, plus neighbors to the neighboring regions, neighbors to the neighbors, and so on, and these impacts can extend to the whole territory. On the other hand, the endogenous interaction and feedback effects between regions are present in global spatial spillovers, whereas those effects are not present (or absent) in local spatial spillovers. In our case, if one region’s industrial diversity has an impact on the economic resilience of the neighboring regions, which do not spillover to other regions too far away, we have local spatial spillovers. On the contrary, if these spillovers easily diffuse to other neighbors, their neighboring regions, and so on, we have global spatial spillovers. Comparative speaking, it is generally assumed that local spatial spillovers are more common in applied work. Some studies [20,46,47,48,49] have further suggested that when local effects dominate, the institutional factors, such as historical and cultural similarity, account for the transmission of effects among close neighbors; by comparison, when global effects prevail, open economies’ interactions play an important role.
Taken together, the above literature review indicates that existing studies have not fully studied the effect of industrial diversity on regional economic resilience in terms of local and global spatial spillovers. As such, following the works of LeSage [20], Lacombe et al. [39], and Cainelli et al. [17], this study presents a case study of industrial diversity and economic resilience within a spatial context and examines whether local or global spatial spillovers that determine the diversity–resilience relationship. The next section introduces the studied region.

3. Study Region

In this paper, we choose the middle reaches of Yangtze River urban agglomeration as the study region. As displayed in Figure 1, this region is located in central China and is an important part of the Yangtze River Economic Belt. According to the Development Plan of the Middle Reaches of Yangtze River Urban Agglomeration (2015–2030) by the State Council of China, the studied region has three megacities (i.e., Wuhan, Changsha, and Nanchang) and includes 31 prefecture-level administrative units in the provinces of Hubei, Hunan, and Jiangxi. Compared with traditional old industrial cities and resource-based cities [24,26,50,51], the studied region has a more diverse industrial foundation in equipment manufacturing, automobile and transportation equipment manufacturing, and aviation, which makes this urban agglomeration an ideal area for studying the relationship between industrial diversity and economic resilience in the Chinese regional context. For these reasons, we choose 31 prefecture-level cities as the spatial units to explore their economic resilience after the 2008 economic crisis and further assess the empirical relationship between industrial diversity and economic resilience at different study periods of the postcrisis era.

4. Methods

4.1. Measuring Economic Resilience

Most existing studies use economic output or employment data to assess economic resilience. However, the employment level in China remains stable and is even on the rise. Following Guan et al. [50] and Tan et al. [24], GDP growth rate was chosen as the basic indicator of regional economic resilience. Meanwhile, since this paper focuses on measuring the recovery aspect of economic resilience, the study periods for measuring economic resilience include the one-year period of 2008–2009, the two-year period of 2008–2010, and the four-year period of 2008–2012. The corresponding datasets were obtained from the statistical yearbooks of provinces and cities.
Based on the method of Martin et al. [4], the economic resilience for the Yangtze River middle reaches urban agglomerations’ 31 prefecture-level cities were measured by comparing the actual and expected regional GDP separately for different periods. The expected change in economic output in each region is calculated as follows:
( Δ r i t + k ) expect = j r i j t g n t + k
where ( Δ r i t + k ) expect is the expected change value of national output from time t to t + k in region i, and r i j t denotes the economic output of industry j in region i at starting time t. g n t + k is the GDP growth rate in (t + k) time nationwide.
Then, the measure of regional recoverability resistance can be expressed as
R e s i s t a n c e = Δ r i t + k Δ r i t + k expect Δ r i t + k expect
where Δ r i t + k represents the change in economic output in region i from time t to t + k; Δ r i t + k expect indicates the amount of change in economic output expected in region i from time t to t + k. By definition, resilience greater than 0 indicates that the recovery degree of the region after the crisis is better than the national average. Conversely, resilience less than 0 indicates that the recovery degree is less than the national average.

4.2. Measuring Industrial Variety

Similar to the measurement of economic resilience, there is no consensus on the measure of industrial variety. The Herfindahl index, national average, and entropy have been widely used [13,34]. As for this paper, the entropy method is used not only because of limited data requirements and computational ease, but also because of its decomposition nature in measuring related variety and unrelated variety [10]. Formally, the entropy formula for calculating industry variety or total variety (TV) can be written as follows:
TV = i = 1 n p i ln ( 1 / p i )
where total variety is the entropy value, which represents the degree of industrial diversity across all sectors, and n is the number of sectors; p i is the proportion of total employees in sector i in the region. A higher entropy value indicates greater diversity, and if a region has only one industry, the entropy has a value of 0.
Then, we used the standard industrial classification code to further differentiate related variety (RV) and unrelated variety (UV). More specifically, if sector i belongs to the broad category of sectors Sj (j = 1, 2, …, J), and the employment proportion of sector j is pj, unrelated variety can be expressed as the entropy index of the broad industrial categories:
UV = j = 1 J p j ln ( 1 / p j )
Finally, according to Frenken et al. [10], related variety is measured by the degree of variety of subindustries with stronger connections within broad categories of sectors, which is manifested as the product of the entropy index ( H j ) in a large category of sectors in an economic system and the share ( p j ) of the sector with the following equations:
H j     = j = 1 J p i / p j ln ( 1 p i / p j )
RV = j = 1 J p j H j
The unrelated variety and related variety variables are calculated with 2-digit and 3-digit industries. Because of the hierarchical structure, it is assumed that each 3-digit industry belongs to a unique 2-digit industry. The data were derived from the Annual Survey of Industrial Firms (ASIF) provided by the National Bureau of Statistics of China. The ASIF provides detailed information on industry enterprises (including all state-owned enterprises and nonstate-owned enterprises with revenues greater than 5 million CNY) in terms of location, total employees, gross output, standard industrial codes, and others. We extracted and compiled employment information at the city sector level for the studied region to further measure industrial diversity.

4.3. The Empirical Model

This paper mainly establishes the following empirical model to explore the impact of industrial variety on economic resilience:
R e s i l i e n c e = f DIV ,   Control
The dependent variable is economic resilience in the periods 2008–2009, 2008–2010, and 2008–2012. By comparison, the core independent variable DIV is industrial diversity, including both related variety and unrelated variety, and some socioeconomic indicators are considered as control variables. Based on relevant research [17,24] and the actual situation of the studied region [51], this paper selects economic development, labor force, government management capacity, and industrial structure as controls, which are expressed by GDP per capita, number of employed workers, proportion of fixed asset investment to GDP, and proportion of secondary industry, respectively. The descriptive statistics are shown in Table 1. Since the variance inflation factor (VIF) is less than 5, collinearity is not an issue. As for the data sources for these control variables, per capita GDP, the proportion of fixed asset investment in GDP, and the proportion of the secondary industry are from the statistical yearbooks of provinces and cities, and the number of employees comes from the Annual Survey of Industrial Firms.

4.4. The Role of Spatial Spillovers

As mentioned earlier, numerous studies have proven that regional economic resilience may have certain spatial effects [14,15,18]. That is to say, the resilience strength is not only directly influenced by factors such as the level of local industrial variety and policy factors, but also may be affected by relevant factors in surrounding areas. Compared with general linear regressions, the spatial econometric model considers the spatial effect and can quantify the direct impact and spatial spillover of the explanatory variables. The discussion of spatial econometric modeling is constantly evolving, and there are many spatial econometric models, such as the spatial lag of X model, spatial error model, spatial autoregressive model, spatial Durbin model, spatial Durbin error model, and the generalized spatial model. Different models encompass different paradigms of spatial econometric analysis. Following LeSage [20] and Cainelli et al. [17], this paper mainly considers three basic spatial models, including the spatial lag of X model (SLX), spatial Durbin model (SDM), and spatial Durbin error model (SDEM), as explained below.
The first model is the spatial lag of X model, which adds the spatial lag of the independent variable to the classical linear regression model and considers local spillover effects of the surrounding space units. The SLX can be specified as
y = X β + WX γ + ε
where y is the dependent variable; X is the matrix of independent variables; β is the parameter matrix to be estimated; W is the spatial weight matrix, which represents the spatial relationship between spatial units; WX is the exogenous interaction effect between the explanatory variables of other observation units and the explanatory variables in this observation unit; γ denotes the spatial parameter of the exogenous interaction effect and its magnitude indicates the spatial interaction strength of the explanatory variables; and ε is the disturbance term.
The second model is the SDM, which was proposed by Anselin [52]. Based on the spatial lag of X model, the spatial lag term of the explained variable is introduced. This model includes both endogenous and exogenous interaction effects and considers the global spillover effect as follows:
y = ρ Wy + X β + WX γ + ε
where ρ denotes the coefficient of the endogenous interaction effect, whose magnitude reflects the extent of spatial spillover, and the other parameters are explained in the previous section.
The third model is the spatial Durbin error model, which adds a spatial autocorrelation error term to the spatial lag of X model. The SDEM considers both local spatial spillovers to neighboring spatial units and the spatial autocorrelation of potentially spatially unobservable factors with the following form:
y = X β + WX γ + u ,     u = λ Wu + ε
where λ is the spatial error coefficient, reflecting the magnitude of the spatial correlation of the error term, and the other terms are defined in the same way as before.
Model selection among the above three spatial models is an important part of the empirical analysis and using different models leads to different estimations. Like Cainelli et al. [17] and Giannakis and Mamuneas [53], this paper uses the Bayesian method developed by LeSage [54] to compare the differences between the SLX, SDM, and SDEM across different spatial weight matrices, and the posterior model probability is returned according to the logarithmic marginal likelihood value of each model to determine the most suitable model. Following the Bayesian approach, let y denote the quantity of interest, and let {M1, …, Mj} denote the set of models considered, and the marginal likelihood of y with respect to Mi is obtained by integrating over the parameter vector θi as follows [55]:
p y | M i = p y | θ i , M i p θ i | M i d θ i
Table 2 shows the model probabilities for the SLX, SDM, and SDEM for the independent variables in different periods with respect to different spatial weight matrices. The SDEM seems to be the most appropriate specification for analyzing the relationship between industry diversity and economic resilience in both study periods. Interestingly, a three nearest neighbors spatial weight matrix is associated with the best SDEM specification for the one-year resilience, while for the longer periods (2-year and 4-year resilience) four nearest neighbors seems to be the best one for SDEM specification. These model selection results have important implications regarding the diversity–resilience relationship. On the one hand, the resilience of one region can be impacted not only by the region’s characteristics, but also by its immediate neighbors, which confirm the existence of local spatial spillovers as suggested by LeSage [20]. On the other hand, because of the disturbance term in the SDEM, a change in the disturbance of a region can produce impacts on disturbances of neighboring regions, neighbors to the neighboring regions, and so on. Since the scalar parameter is less than one, these impacts decay with the order of neighbors, and high-order neighbors received less impact. Additionally, the interpretation of the estimated direct and indirect effects in the SDEM is straightforward. The direct effects are reflected by the estimated coefficients of the non-spatially lagged terms, and the indirect effects are reflected by the estimated coefficients of the spatially lagged terms [20].
Finally, when the spatial models are specified, Equation (7) is estimated using the Bayesian Markov chain Monte Carlo (MCMC) method. LeSage and Pace [55] indicated that use of the MCMC technique produces more accurate estimation results than the traditional maximum likelihood in small samples. Based on Lacombe et al. [39], Deller and Watson [15], and Jensen et al. [56], we assume a normal–gamma conjugate prior for β and σ, and a uniform prior for ρ. The Bayesian priors are given in Equations (12)–(14).
π ( β ) ~ N ( c , N )
π ( 1 / σ 2 )   ~   Γ ( d , v )
π ( ρ )   ~   U ( 0 , 1 )
The parameter β, σ, and ρ can be estimated drawing sequentially from the conditional distributions using a Gibbs sampling process. Our analysis uses 22,500 draws with the first 2500 draws as the burn-in period. The removal of these burn-ins is useful because the initialized values might be unstable.

5. Results and Discussion

5.1. Preliminary Analysis

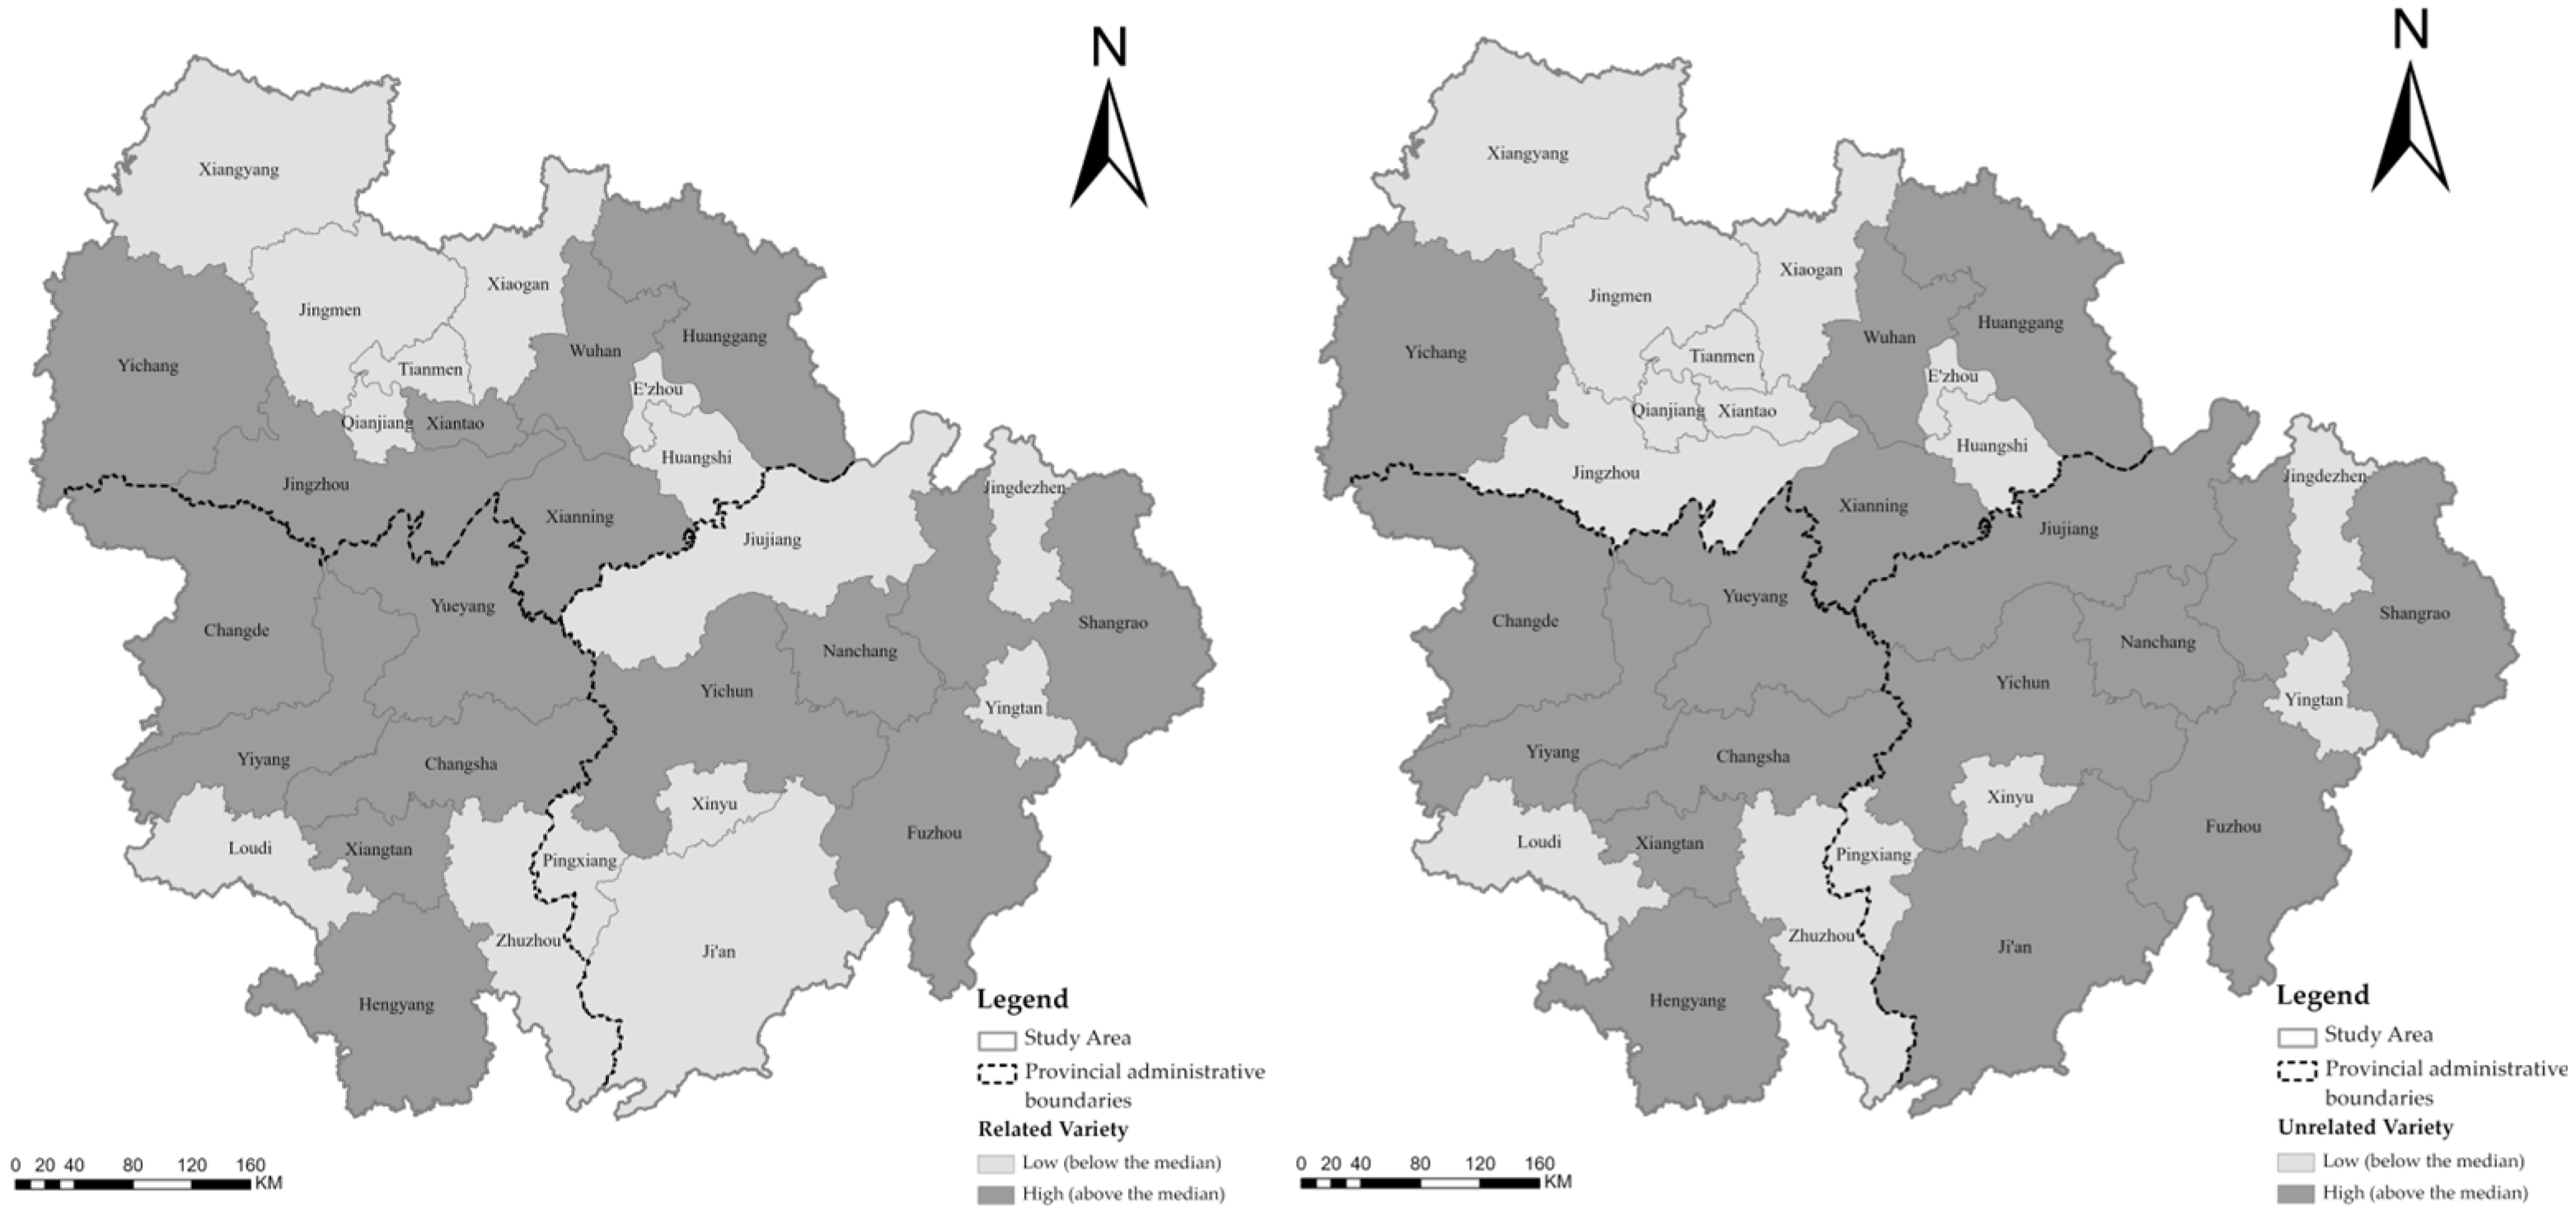
As shown in Figure 2, both related variety and unrelated variety exhibit an agglomeration pattern in the studied region in general without substantial difference between the two subfigures. More specifically, cities with greater degrees of related variety and unrelated variety, in particular, are concentrated around the three megacities. This might be related to the rapid industrialization of Chinese cities since the Reform and Opening-up. For individual cities like Wuhan, Changsha, and Nanchang, the level of related variety and unrelated variety is relatively high, and the level of industrial variety in the surrounding areas of Changsha and Nanchang shows similar characteristics. By comparison, the industrial structures around Wuhan are more specialized and have both low levels of related variety and unrelated variety.
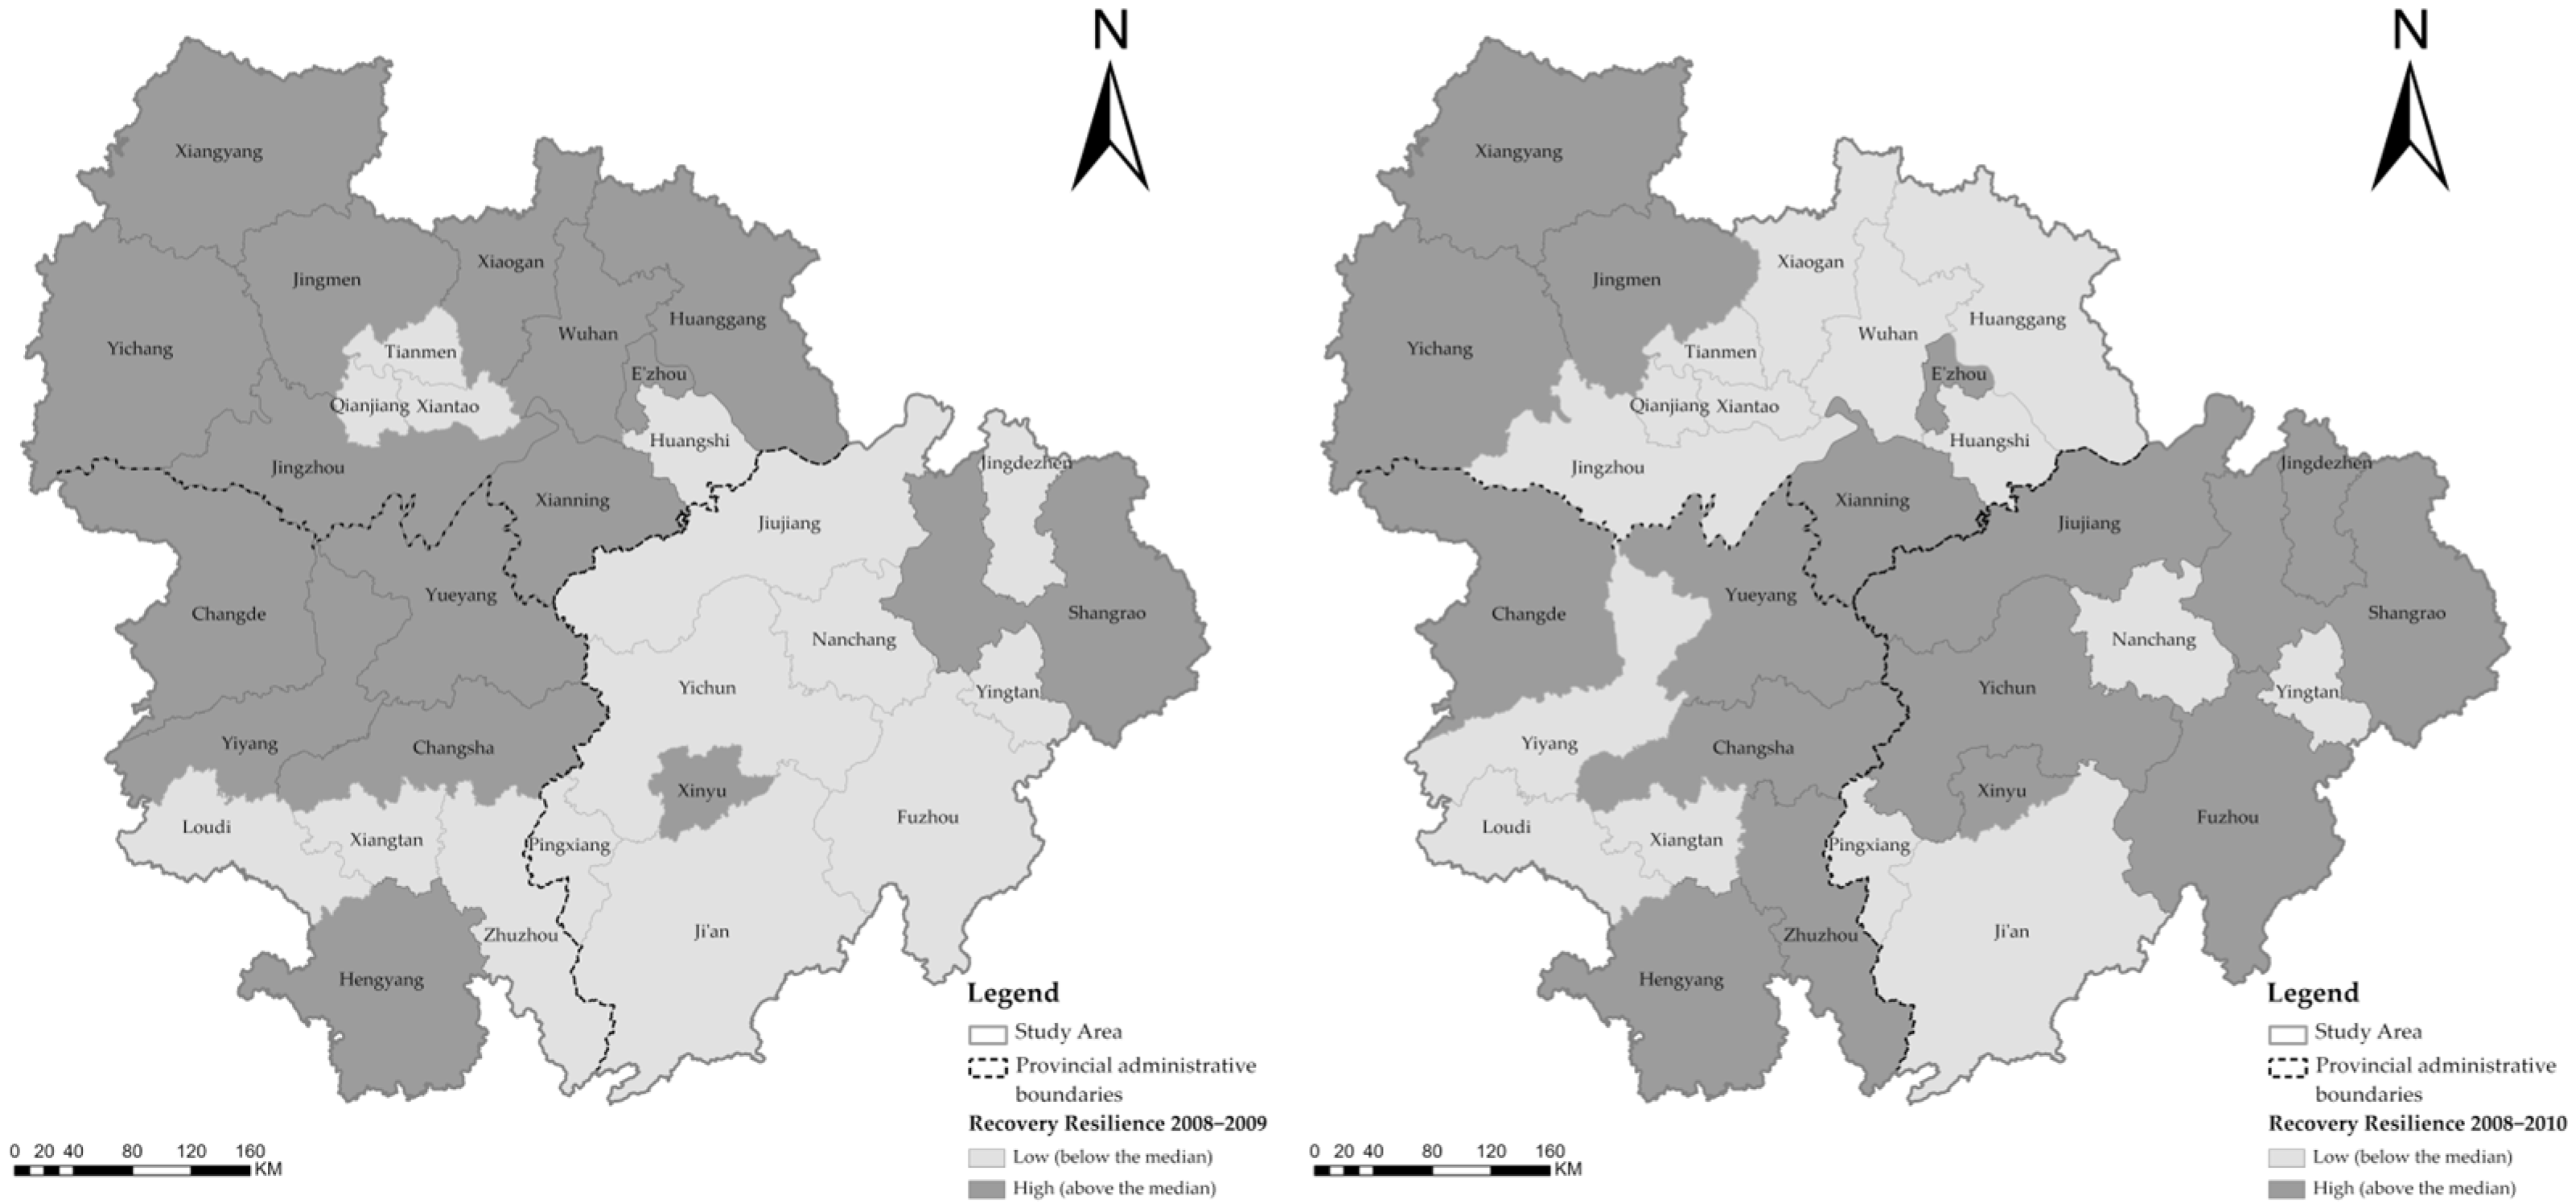
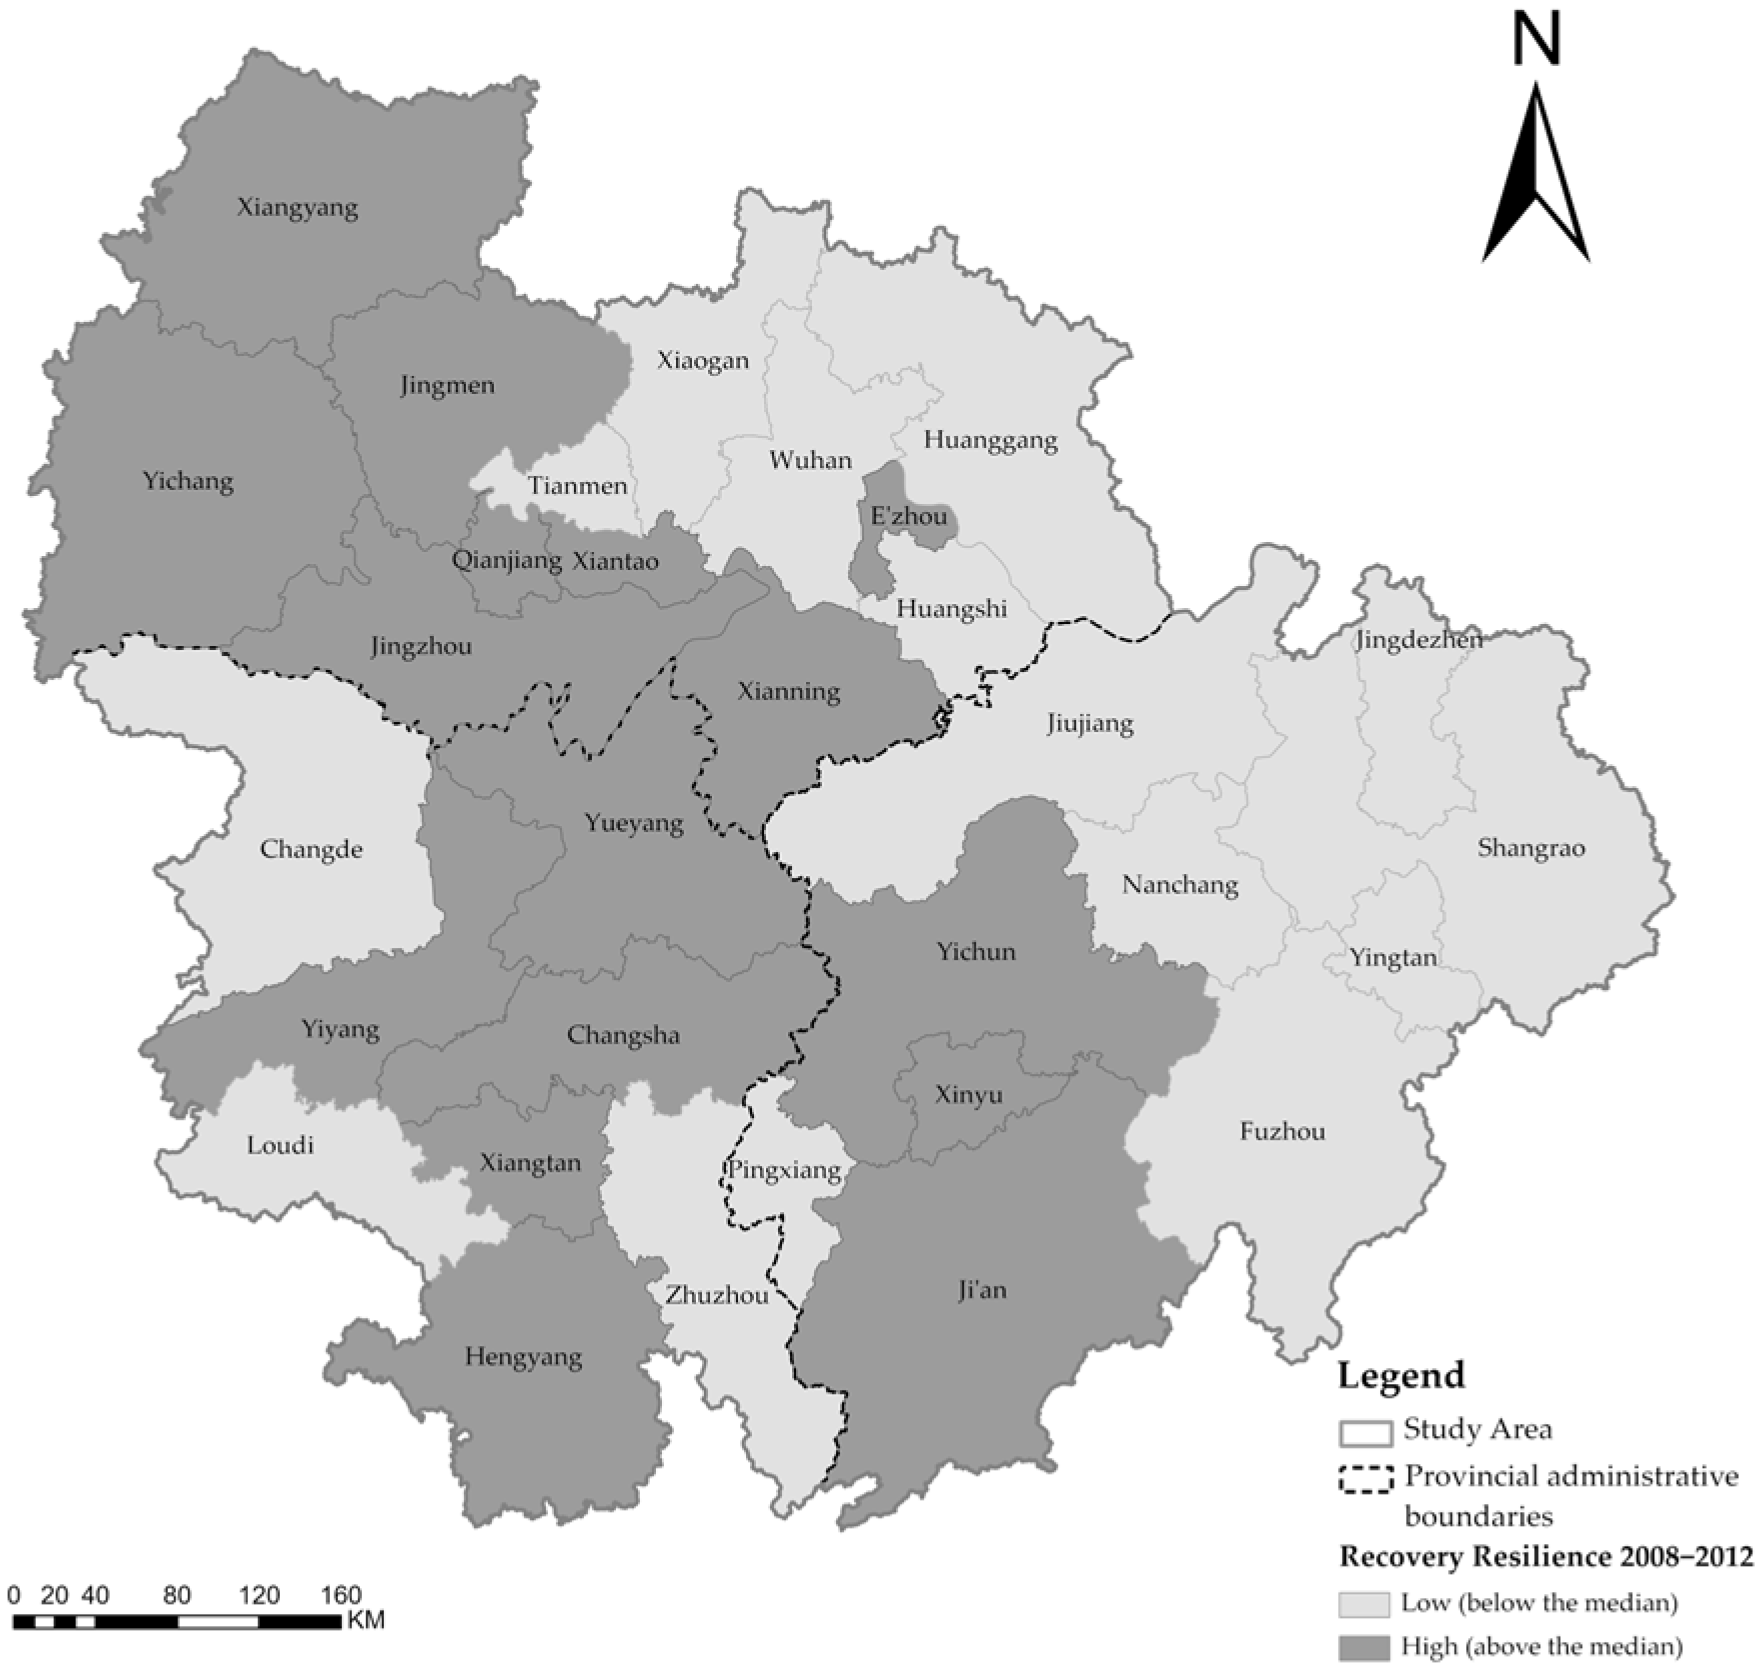
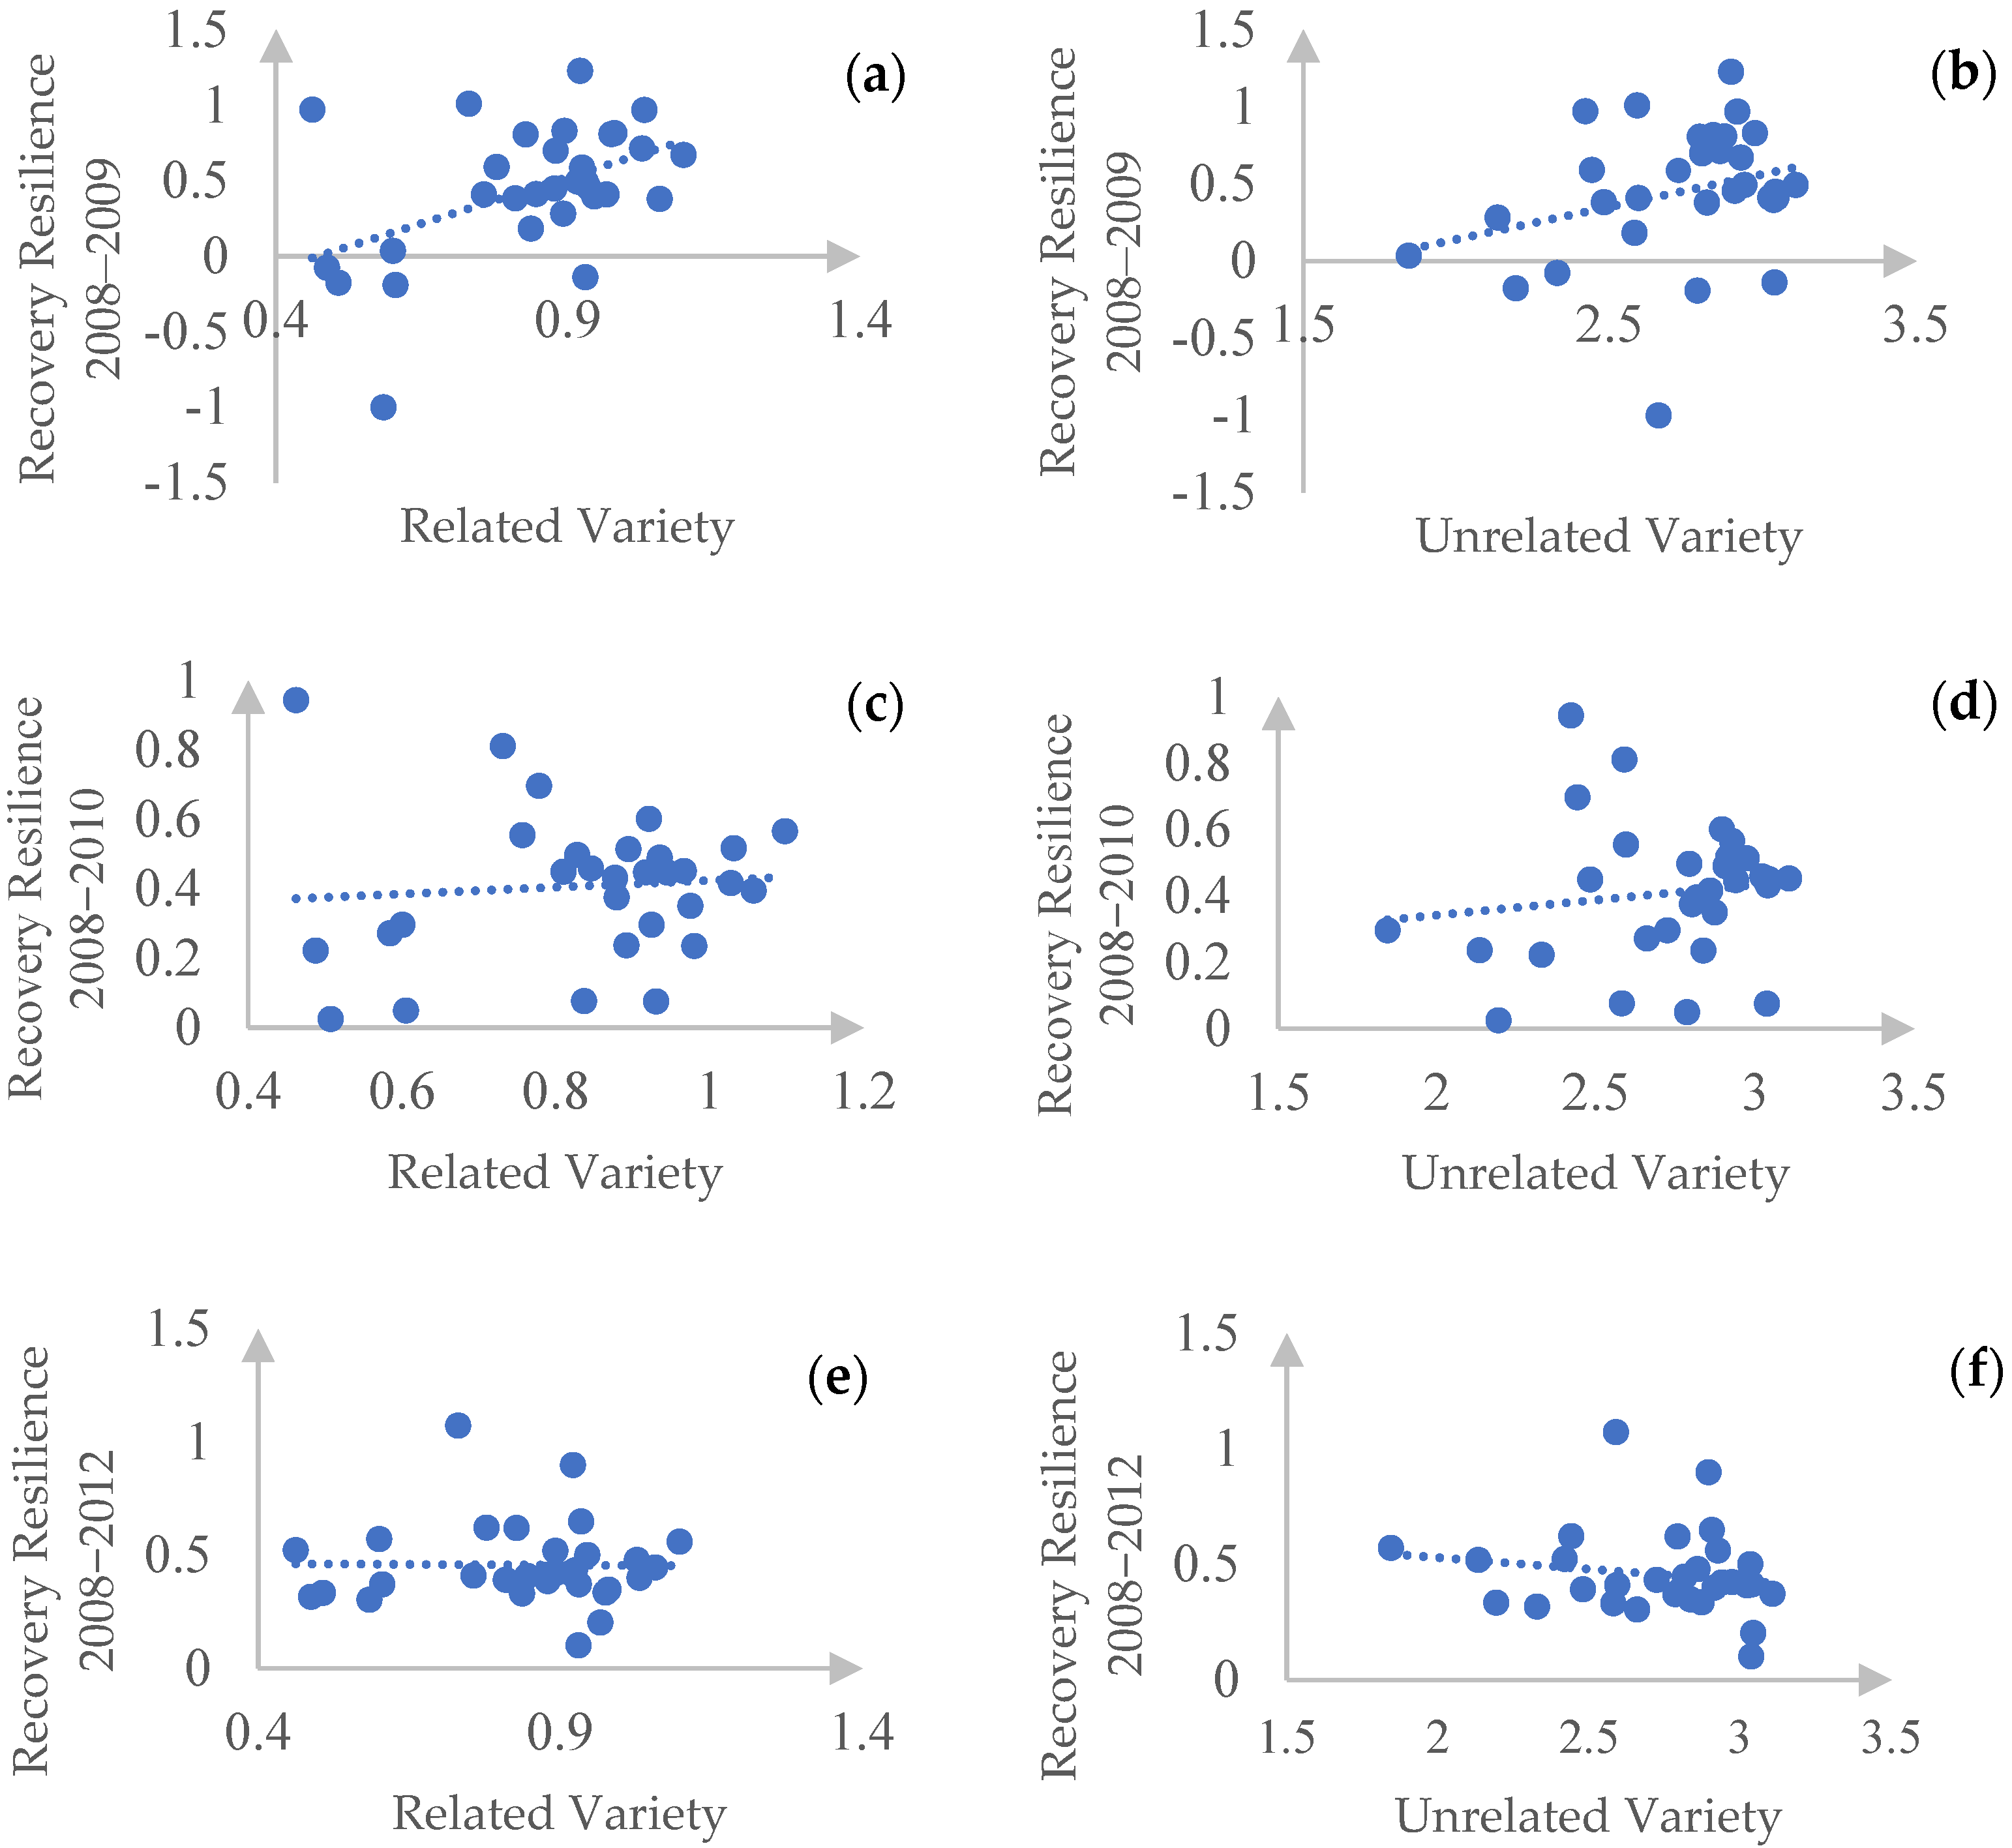
Figure 3 suggests that although there are some differences in the distribution pattern of economic resilience in different periods, in general, there is a spatial agglomeration phenomenon. More specifically, the regions with higher economic resilience in 2008–2009 are concentrated in the Hubei and Hunan provinces. By comparison, Tianmen, Qianjiang, and Xiantao, which have smaller economic sizes, are clustered with lower economic resilience. As mentioned above, this may be attributed to their specialized industrial structure. In contrast, cities in Jiangxi province have relatively low levels of resilience, even in the provincial capital city of Nanchang. Meanwhile, the scatterplots suggest that there may be positive correlation between industrial diversity and economic resilience in the one-year resilience period in Figure 4a,b, but that relationship becomes insignificant in longer periods.

5.2. Regression Analysis

Table 3 presents the estimation results of the spatial Durbin error model of the 1-year resilience in 2008–2009, 2-year resilience in 2008–2010, and 4-year resilience in 2008–2012. First of all, the estimated parameter λ shows a high level of significance, which indicates that the SDEM rather than the SDM should be used. In other words, although we have considered a rich set of control variables, the SDEM suggests that there are possible spatial error correlations in that unobserved factors influencing economic resilience vary over space [39].
Second, the estimation of diversity variables provides interesting findings for this analysis. The direct effects of related diversity show that the level of related diversity is positively associated with regional resilience over the three periods, even though this association is not statistically significant over the 4-year resilience period of 2008–2012. This suggests that cities with higher levels of related variety tend to respond better to external shocks than cities with lower levels of related variety, but only within a shorter time frame. By comparison, according to the estimation results of unrelated variety, unrelated variety has no significant direct effect on the resilience of economic recovery in all three phases. That is to say, related variety plays a more significant role than unrelated variety in promoting the economic recovery resistance of the studied region in our case.
The knowledge spillover effect resulting from related variety is more significant than the industrial portfolio effect or the risk-spreading effect in sustaining economic recovery resistance in the postcrisis era. This finding has a simple economic explanation. In a local system with a high degree of related diversity and therefore a common technology base, it is easier to redistribute skills, technologies, and workers from one industry to another, enabling local adjustment of production structure to adapt to external shocks. This is similar to the findings of Sedita et al. [57] and Cainelli et al. [17], which found that geographic regions with a highly relevant knowledge base have a higher ability to withstand economic or financial crises and reduce their intensity. Meanwhile, Diodato and Weterings [58] identified a similar mechanism: they emphasized how input–output linkages and skill relatedness improve local labor market resilience.
In response to the impact of the global financial crisis, the Chinese government adopted a series of macro-control measures from 2009 to 2012 and the economic growth rate rebounded during this period. The regression results for the period 2008–2012 indicate that the related variety does not have a significant effect on the economic recovery resistance in that period, probably because government-led investment activities, such as infrastructure construction, do not strongly depend on knowledge spillovers and technology–industry linkages. For these reasons, the related variety factor is not significant in longer study periods.
Third, focusing specifically on spatial spillovers, the spatial spillover effects of both related variety and unrelated variety are insignificant in 2-year and 4-year resilience, but those effects are significant in in 1-year resilience. On the one hand, the spatial spillovers of related variety tend to promote economic resilience and move in the same direction with the direct effect. The interpretation is that one region’s economic resilience is positively associated not only with the region’s level of related variety, but also with the neighboring industrial structure. In terms of magnitude, the indirect effect is greater than the direct effect. On the other hand, the unrelated variety of neighboring regions seems to undermine the overall economic resilience, which can be explained by the competition or backwash effect among regions [17,59].
As mentioned earlier, LeSage [20] further differentiated two forms of spatial spillover, including (1) local spatial spillovers that only affect immediate neighbors and (2) global spatial spillovers that involve not only immediate neighbors, but also the neighbors of the immediate neighbors, and so on. As suggested by the SDEM estimation results in Table 3, the spatial spillovers of both related and unrelated variety are local. These results are similar to those of Cainelli et al. [17], who also found that the spatial spillovers of related variety on economic resilience are local rather than global. In this regard, the knowledge spillover effect is localized and tends to benefit only immediate neighbors. Although LeSage [20] claimed that most spatial spillovers are local in nature, the majority of previous industrial diversity studies have either taken a nonspatial perspective or assumed the existence of spatial effects resulting from knowledge spillovers without testing for local versus global nature. To this end, by merely assuming spatial spillover effects, but not testing which form of spatial spillover actually exists, the empirical understandings and policy implications of industrial diversity on economic resilience may be wrong.
Finally, from a methodological perspective, the advantages of Bayesian spatial econometrics can be twofold. On the one hand, the use of Bayesian method can return the best model among the SDM, SLX, and SDEM across different spatial weight matrices. It avoids the two-way comparisons of SDM versus SLX, SDEM versus SLX, SDEM versus SDM specifications that are used in traditional use of maximum likelihood-based Lagrange multiplier test statistics [39]. In doing so, appropriate spatial regression models and spatial weights are specified and the estimates of global or local spatial spillovers are correctly interpreted. On the other hand, since our sample only includes 31 cities but we have an array of independent variables, Bayesian spatial econometrics outperforms the maximum likelihood method in small samples and provides more accurate estimates of the parameters of interest. LeSage and Pace [55] suggested that this is because “in small samples data may exhibit asymmetry or heavy tailed distributions that deviate from normality”.

6. Conclusions

To sum up, this paper adopted the concept of regional resilience developed by Lagravinese and used Bayesian spatial econometric methods to empirically investigate the relationship between industrial variety and regional economic resilience in the middle reaches of the Yangtze River urban agglomeration. The main conclusions are listed as follows: First, related variety has a significant positive effect on economic recovery resistance, especially during the one- and two-year recovery periods, while unrelated variety has no significant impact in longer study periods, which suggests that it is the knowledge spillover effect rather than the risk-spreading effect or the industry portfolio effect that dominates the postcrisis diversity–resilience relationship. Second, the indirect effects of related variety and unrelated variety are statistically negligible in longer periods, but these local spatial spillover effects are statistically significant in one-year resilience, indicating that these spatial effects are localized and transitory. Third, the direct and indirect effects of both related variety and unrelated variety in promoting economic resilience diminish in longer study periods.
When these points are combined, related variety and its local spatial spillovers play key roles in promoting short-term economic recovery resilience, which provides three important policy implications for sustainable economic development. First, as illustrated in our case, the knowledge spillover effect dominates the diversity–resilience relationship and related variety acts as a “shock absorber”. Hence, regional policies should be redefined to enhance the ability of individual regions to withstand external macroeconomic shocks, adapt to the changing environment, and promote economic recovery by related diversification. Second, when the risk-spreading effect rather than the knowledge spillover effect prevails, regional researchers and policymakers should be cautious about the possible negative impacts resulting from high levels of related variety as a “shock diffuser”. These negative impacts might undermine and even neutralize the benefits of unrelated variety as a “shock absorber”. Third, because our study confirms the local nature of spatial spillovers in the diversity–resilience relationship, economic capability from immediate neighboring regions is also a very important source for strengthening a region’s ability to cope with and adapt to external shocks. Measures to facilitate interregional connections and regional integration—such as constructing high-speed railways—can contribute to knowledge diffusion and benefit less resilient regions [45].
There are also several limitations in this paper, which can be potential directions for future research. First, it is interesting to measure other aspects of industrial structure that might affect regional economic resilience, such as relatedness, complexity, and coherence [32,60], and to examine their global or local spatial effects, respectively. Second, recent research has suggested that in addition to industrial structure, other forms of economic structure like occupation, product, and patent can also impact the capacity of individual regions to recover after exogenous shocks [61,62,63]. In this regard, future research can explore other forms of economic structure with their impacts on economic resilience. Third, given that existing studies have already addressed the issue of model uncertainty in terms of the choice of explanatory variables [64,65,66], future economic resilience research can employ spatial Bayesian model averaging (BMA) methods to simultaneously deal with model uncertainty resulting from the set of variables as well as the global or local nature of spatial spillovers.

Author Contributions

X.L. analyzed the data and wrote the manuscript; J.C. applied the regression models and revised this paper. All authors have read and agreed to the published version of the manuscript.

Funding

This research was funded by National Natural Science Foundation of China, grant number 42001136.

Institutional Review Board Statement

Not applicable.

Informed Consent Statement

Not applicable.

Data Availability Statement

All datasets are available and can be found the source in the Section 4.3. No new data were created or analyzed in this study.

Acknowledgments

We would like to show our gratitude for the valuable comments and suggestions from the handling editor and anonymous reviewers on the earlier draft of this paper.

Conflicts of Interest

The authors declare no conflict of interest.

References

  1. Annoni, P.; Dominicis, L.; Khabirpour, N. Location Matters: A Spatial Econometric Analysis of Regional Resilience in the European Union. Growth Change 2019, 50, 824–855. [Google Scholar] [CrossRef] [Green Version]
  2. Boschma, R. Towards an Evolutionary Perspective on Regional Resilience. Reg. Stud. 2015, 49, 733–751. [Google Scholar] [CrossRef] [Green Version]
  3. Bristow, G.; Healy, A. Innovation and Regional Economic Resilience: An Exploratory Analysis. Ann. Reg. Sci. 2018, 60, 265–284. [Google Scholar] [CrossRef] [Green Version]
  4. Martin, R.; Sunley, P.; Gardiner, B.; Tyler, P. How Regions React to Recessions: Resilience and the Role of Economic Structure. Reg. Stud. 2016, 50, 561–585. [Google Scholar] [CrossRef] [Green Version]
  5. Xiao, J.; Boschma, R.; Andersson, M. Industrial Diversification in Europe: The Differentiated Role of Relatedness. Econ. Geogr. 2018, 94, 514–549. [Google Scholar] [CrossRef] [Green Version]
  6. Glaeser, E.L.; Kallal, H.D.; Scheinkman, J.A.; Shleifer, A. Growth in Cities. J. Polit. Econ. 1992, 100, 1126–1152. [Google Scholar] [CrossRef]
  7. De Groot, H.L.F.; Poot, J.; Smit, M.J. Which agglomeration externalities matter most and why?: Importance of agglomeration externalities. J. Econ. Surv. 2016, 30, 756–782. [Google Scholar] [CrossRef]
  8. Marshall, A. Principles of Economics Macmillan, 8th ed.; Macmillan and Co.: London, UK, 1890. [Google Scholar]
  9. Duranton, G.; Puga, D. Micro-Foundations of Urban Agglomeration Economies; National Bureau of Economic Research: Cambridge, MA, USA, 2003; p. w.9931. [Google Scholar]
  10. Frenken, K.; Van Oort, F.; Verburg, T. Related Variety, Unrelated Variety and Regional Economic Growth. Reg. Stud. 2007, 41, 685–697. [Google Scholar] [CrossRef] [Green Version]
  11. Cainelli, G.; Ganau, R.; Modica, M. Industrial Relatedness and Regional Resilience in the European Union. Pap. Reg. Sci. 2019, 98, 755–778. [Google Scholar] [CrossRef]
  12. He, C.; Chen, T.; Zhu, S. Do Not Put Eggs in One Basket: Related Variety and Export Resilience in the Post-Crisis Era. Ind. Corp. Chang. 2022, 30, 1655–1676. [Google Scholar] [CrossRef]
  13. Jackson, R.W. An Evaluation of Alternative Measures of Regional Industrial Diversification. Reg. Stud. 1984, 18, 103–112. [Google Scholar] [CrossRef]
  14. Trendle, B. Regional Economic Instability: The Role of Industrial Diversification and Spatial Spillovers. Ann. Reg. Sci. 2006, 40, 767–778. [Google Scholar] [CrossRef]
  15. Deller, S.; Watson, P. Did Regional Economic Diversity Influence the Effects of the Great Recession? Diversity, Stability, and the Great Recession. Econ. Inq. 2016, 54, 1824–1838. [Google Scholar] [CrossRef]
  16. Grabner, S.M.; Modica, M. Industrial Resilience, Regional Diversification and Related Variety during Times of Crisis in the US Urban–Rural Context. Reg. Stud. 2022, 56, 1605–1617. [Google Scholar] [CrossRef]
  17. Cainelli, G.; Ganau, R.; Modica, M. Does Related Variety Affect Regional Resilience? New Evidence from Italy. Ann. Reg. Sci. 2019, 62, 657–680. [Google Scholar] [CrossRef]
  18. Chen, J. The Impact of Cluster Diversity on Economic Performance in U.S. Metropolitan Statistical Areas. Econ. Dev. Q. 2020, 34, 46–63. [Google Scholar] [CrossRef] [Green Version]
  19. Tobler, W.R. A Computer Movie Simulating Urban Growth in the Detroit Region. Econ. Geogr. 1970, 46, 234. [Google Scholar] [CrossRef]
  20. LeSage, J.P. What Regional Scientists Need to Know about Spatial Econometrics. Rev. Reg. Stud. 2014, 44, 13–32. [Google Scholar]
  21. Chen, J. Geographical Scale, Industrial Diversity, and Regional Economic Stability. Growth Change 2019, 50, 609–633. [Google Scholar] [CrossRef] [Green Version]
  22. Holling Resilience and Stability of Ecological Systems. Annu. Rev. Ecol. Syst. 1973, 4, 1–23. [CrossRef] [Green Version]
  23. Simmie, J.; Martin, R. The Economic Resilience of Regions: Towards an Evolutionary Approach. Camb. J. Reg. Econ. Soc. 2010, 3, 27–43. [Google Scholar] [CrossRef] [Green Version]
  24. Tan, J.; Hu, X.; Hassink, R.; Ni, J. Industrial Structure or Agency: What Affects Regional Economic Resilience? Evidence from Resource-Based Cities in China. Cities 2020, 106, 102906. [Google Scholar] [CrossRef]
  25. Gong, H.; Hassink, R.; Tan, J.; Huang, D. Regional Resilience in Times of a Pandemic Crisis: The Case of COVID-19 in China. Tijdschr. Voor Econ. En Soc. Geogr. 2020, 111, 497–512. [Google Scholar] [CrossRef] [PubMed]
  26. Hu, X.; Li, L.; Dong, K. What Matters for Regional Economic Resilience amid COVID-19? Evidence from Cities in Northeast China. Cities 2022, 120, 103440. [Google Scholar] [CrossRef] [PubMed]
  27. Brown, L.; Greenbaum, R.T. The Role of Industrial Diversity in Economic Resilience: An Empirical Examination across 35 Years. Urban Stud. 2017, 54, 1347–1366. [Google Scholar] [CrossRef]
  28. Martin, R. Regional Economic Resilience, Hysteresis and Recessionary Shocks. J. Econ. Geogr. 2012, 12, 1–32. [Google Scholar] [CrossRef] [Green Version]
  29. Lagravinese, R. Economic Crisis and Rising Gaps North-South: Evidence from the Italian Regions. Camb. J. Reg. Econ. Soc. 2015, 8, 331–342. [Google Scholar] [CrossRef]
  30. Martin, R.; Sunley, P. On the Notion of Regional Economic Resilience: Conceptualization and Explanation. J. Econ. Geogr. 2015, 15, 1–42. [Google Scholar] [CrossRef]
  31. Doran, J.; Fingleton, B. US Metropolitan Area Resilience: Insights from Dynamic Spatial Panel Estimation. Environ. Plan. Econ. Space 2018, 50, 111–132. [Google Scholar] [CrossRef]
  32. Rocchetta, S.; Mina, A.; Lee, C.; Kogler, D.F. Technological Knowledge Spaces and the Resilience of European Regions. J. Econ. Geogr. 2022, 22, 27–51. [Google Scholar] [CrossRef]
  33. Di Caro, P. Recessions, Recoveries and Regional Resilience: Evidence on Italy. Camb. J. Reg. Econ. Soc. 2015, 8, 273–291. [Google Scholar] [CrossRef] [Green Version]
  34. Attaran, M. Industrial Diversity and Economic Performance in U.S. Areas. Ann. Reg. Sci. 1986, 20, 44–54. [Google Scholar] [CrossRef]
  35. Hidalgo, C.A.; Klinger, B.; Barabási, A.-L.; Hausmann, R. The Product Space Conditions the Development of Nations. Science 2007, 317, 482–487. [Google Scholar] [CrossRef] [Green Version]
  36. Kogler, D.F.; Rigby, D.L.; Tucker, I. Mapping Knowledge Space and Technological Relatedness in US Cities. Eur. Plan. Stud. 2013, 21, 1374–1391. [Google Scholar] [CrossRef]
  37. Fan, J.P.H.; Lang, L.H.P. The Measurement of Relatedness: An Application to Corporate Diversification. J. Bus. 2000, 73, 629–660. [Google Scholar] [CrossRef]
  38. Guo, Q.; He, C.; Li, D. Entrepreneurship in China: The Role of Localisation and Urbanisation Economies. Urban Stud. 2016, 53, 2584–2606. [Google Scholar] [CrossRef]
  39. Lacombe, D.J.; Holloway, G.J.; Shaughnessy, T.M. Bayesian Estimation of the Spatial Durbin Error Model with an Application to Voter Turnout in the 2004 Presidential Election. Int. Reg. Sci. Rev. 2014, 37, 298–327. [Google Scholar] [CrossRef]
  40. Audretsch, D.B.; Feldman, M.P. R&D Spillovers and the Geography of Innovation and Production. Am. Econ. Rev. 1996, 86, 630–640. [Google Scholar]
  41. Anselin, L.; Varga, A.; Acs, Z. Local Geographic Spillovers between University Research and High Technology Innovations. J. Urban Econ. 1997, 42, 422–448. [Google Scholar] [CrossRef]
  42. Bahar, D.; Hausmann, R.; Hidalgo, C.A. Neighbors and the Evolution of the Comparative Advantage of Nations: Evidence of International Knowledge Diffusion? J. Int. Econ. 2014, 92, 111–123. [Google Scholar] [CrossRef] [Green Version]
  43. Boschma, R.; Martín, V.; Minondo, A. Neighbour Regions as the Source of New Industries: Neighbour Regions as the Source of New Industries. Pap. Reg. Sci. 2017, 96, 227–245. [Google Scholar] [CrossRef]
  44. Zhu, S.; He, C.; Luo, Q. Good Neighbors, Bad Neighbors: Local Knowledge Spillovers, Regional Institutions and Firm Performance in China. Small Bus. Econ. 2019, 52, 617–632. [Google Scholar] [CrossRef]
  45. Gao, J.; Jun, B.; Pentland, A.S.; Zhou, T.; Hidalgo, C.A. Spillovers across Industries and Regions in China’s Regional Economic Diversification. Reg. Stud. 2021, 55, 1311–1326. [Google Scholar] [CrossRef]
  46. Goodchild, M.F.; Anselin, L.; Appelbaum, R.P.; Harthorn, B.H. Toward spatially integrated social science. Int. Reg. Sci. Rev. 2000, 23, 139–159. [Google Scholar] [CrossRef]
  47. Läpple, D.; Holloway, G.; Lacombe, D.J.; O’Donoghue, C. Sustainable Technology Adoption: A Spatial Analysis of the Irish Dairy Sector. Eur. Rev. Agric. Econ. 2017, 44, 810–835. [Google Scholar] [CrossRef]
  48. Mannaf, M.; Wheeler, S.A.; Zuo, A. Global and Local Spatial Spill-Overs: What Matters Most for the Diffusion of Organic Agriculture in Australia? Ecol. Econ. 2023, 209, 107835. [Google Scholar] [CrossRef]
  49. Kopczewska, K.; Kudła, J.; Walczyk, K. Strategy of Spatial Panel Estimation: Spatial Spillovers Between Taxation and Economic Growth. Appl. Spat. Anal. Policy 2017, 10, 77–102. [Google Scholar] [CrossRef] [Green Version]
  50. Guan, H.; Liu, W.; Zhang, P.; Lo, K.; Li, J.; Li, L. Analyzing Industrial Structure Evolution of Old Industrial Cities Using Evolutionary Resilience Theory: A Case Study in Shenyang of China. Chin. Geogr. Sci. 2018, 28, 516–528. [Google Scholar] [CrossRef] [Green Version]
  51. Zheng, W.; Kuang, A.; Wang, X.; Chen, J. Measuring Network Configuration of the Yangtze River Middle Reaches Urban Agglomeration: Based on Modified Radiation Model. Chin. Geogr. Sci. 2020, 30, 677–694. [Google Scholar] [CrossRef]
  52. Anselin, L. Lagrange Multiplier Test Diagnostics for Spatial Dependence and Spatial Heterogeneity. Geogr. Anal. 2010, 20, 1–17. [Google Scholar] [CrossRef]
  53. Giannakis, E.; Mamuneas, T.P. Labour Productivity and Regional Labour Markets Resilience in Europe. Ann. Reg. Sci. 2022, 68, 691–712. [Google Scholar] [CrossRef]
  54. LeSage, J.P. Software for Bayesian Cross Section and Panel Spatial Model Comparison. J. Geogr. Syst. 2015, 17, 297–310. [Google Scholar] [CrossRef]
  55. LeSage, J.; Pace, R.K. Introduction to Spatial Econometrics; Chapman and Hall/CRC: Boca Raton, FL, USA, 2009. [Google Scholar]
  56. Jensen, C.D.; Lacombe, D.J.; McIntyre, S.G. A Bayesian Spatial Econometric Analysis of the 2010 UK General Election: Spatial Analysis of UK Voting. Pap. Reg. Sci. 2012, 92, 651–666. [Google Scholar] [CrossRef]
  57. Sedita, S.R.; De Noni, I.; Pilotti, L. Out of the Crisis: An Empirical Investigation of Place-Specific Determinants of Economic Resilience. Eur. Plan. Stud. 2017, 25, 155–180. [Google Scholar] [CrossRef]
  58. Diodato, D.; Weterings, A.B.R. The Resilience of Regional Labour Markets to Economic Shocks: Exploring the Role of Interactions among Firms and Workers. J. Econ. Geogr. 2015, 15, 723–742. [Google Scholar] [CrossRef]
  59. Kao, S.Y.-H.; Bera, A.K. Spatial Regression: The Curious Case of Negative Spatial Dependence; University of Illinois: Champaign, IL, USA, 2016. [Google Scholar]
  60. Balland, P.-A.; Boschma, R.; Crespo, J.; Rigby, D.L. Smart Specialization Policy in the European Union: Relatedness, Knowledge Complexity and Regional Diversification. Reg. Stud. 2019, 53, 1252–1268. [Google Scholar] [CrossRef] [Green Version]
  61. Jara-Figueroa, C.; Jun, B.; Glaeser, E.L.; Hidalgo, C.A. The Role of Industry-Specific, Occupation-Specific, and Location-Specific Knowledge in the Growth and Survival of New Firms. Proc. Natl. Acad. Sci. USA 2018, 115, 12646–12653. [Google Scholar] [CrossRef] [PubMed] [Green Version]
  62. Wixe, S.; Andersson, M. Which Types of Relatedness Matter in Regional Growth? Industry, Occupation and Education. Reg. Stud. 2017, 51, 523–536. [Google Scholar] [CrossRef] [Green Version]
  63. Moro, E.; Frank, M.R.; Pentland, A.; Rutherford, A.; Cebrian, M.; Rahwan, I. Universal Resilience Patterns in Labor Markets. Nat. Commun. 2021, 12, 1972. [Google Scholar] [CrossRef] [PubMed]
  64. Cuaresma, J.C.; Doppelhofer, G.; Feldkircher, M. The Determinants of Economic Growth in European Regions. Reg. Stud. 2014, 48, 44–67. [Google Scholar] [CrossRef]
  65. LeSage, J.P.; Parent, O. Bayesian Model Averaging for Spatial Econometric Models. Geogr. Anal. 2007, 39, 241–267. [Google Scholar] [CrossRef]
  66. Watson, P.; Deller, S. Economic Diversity, Unemployment and the Great Recession. Q. Rev. Econ. Finance 2017, 64, 1–11. [Google Scholar] [CrossRef]
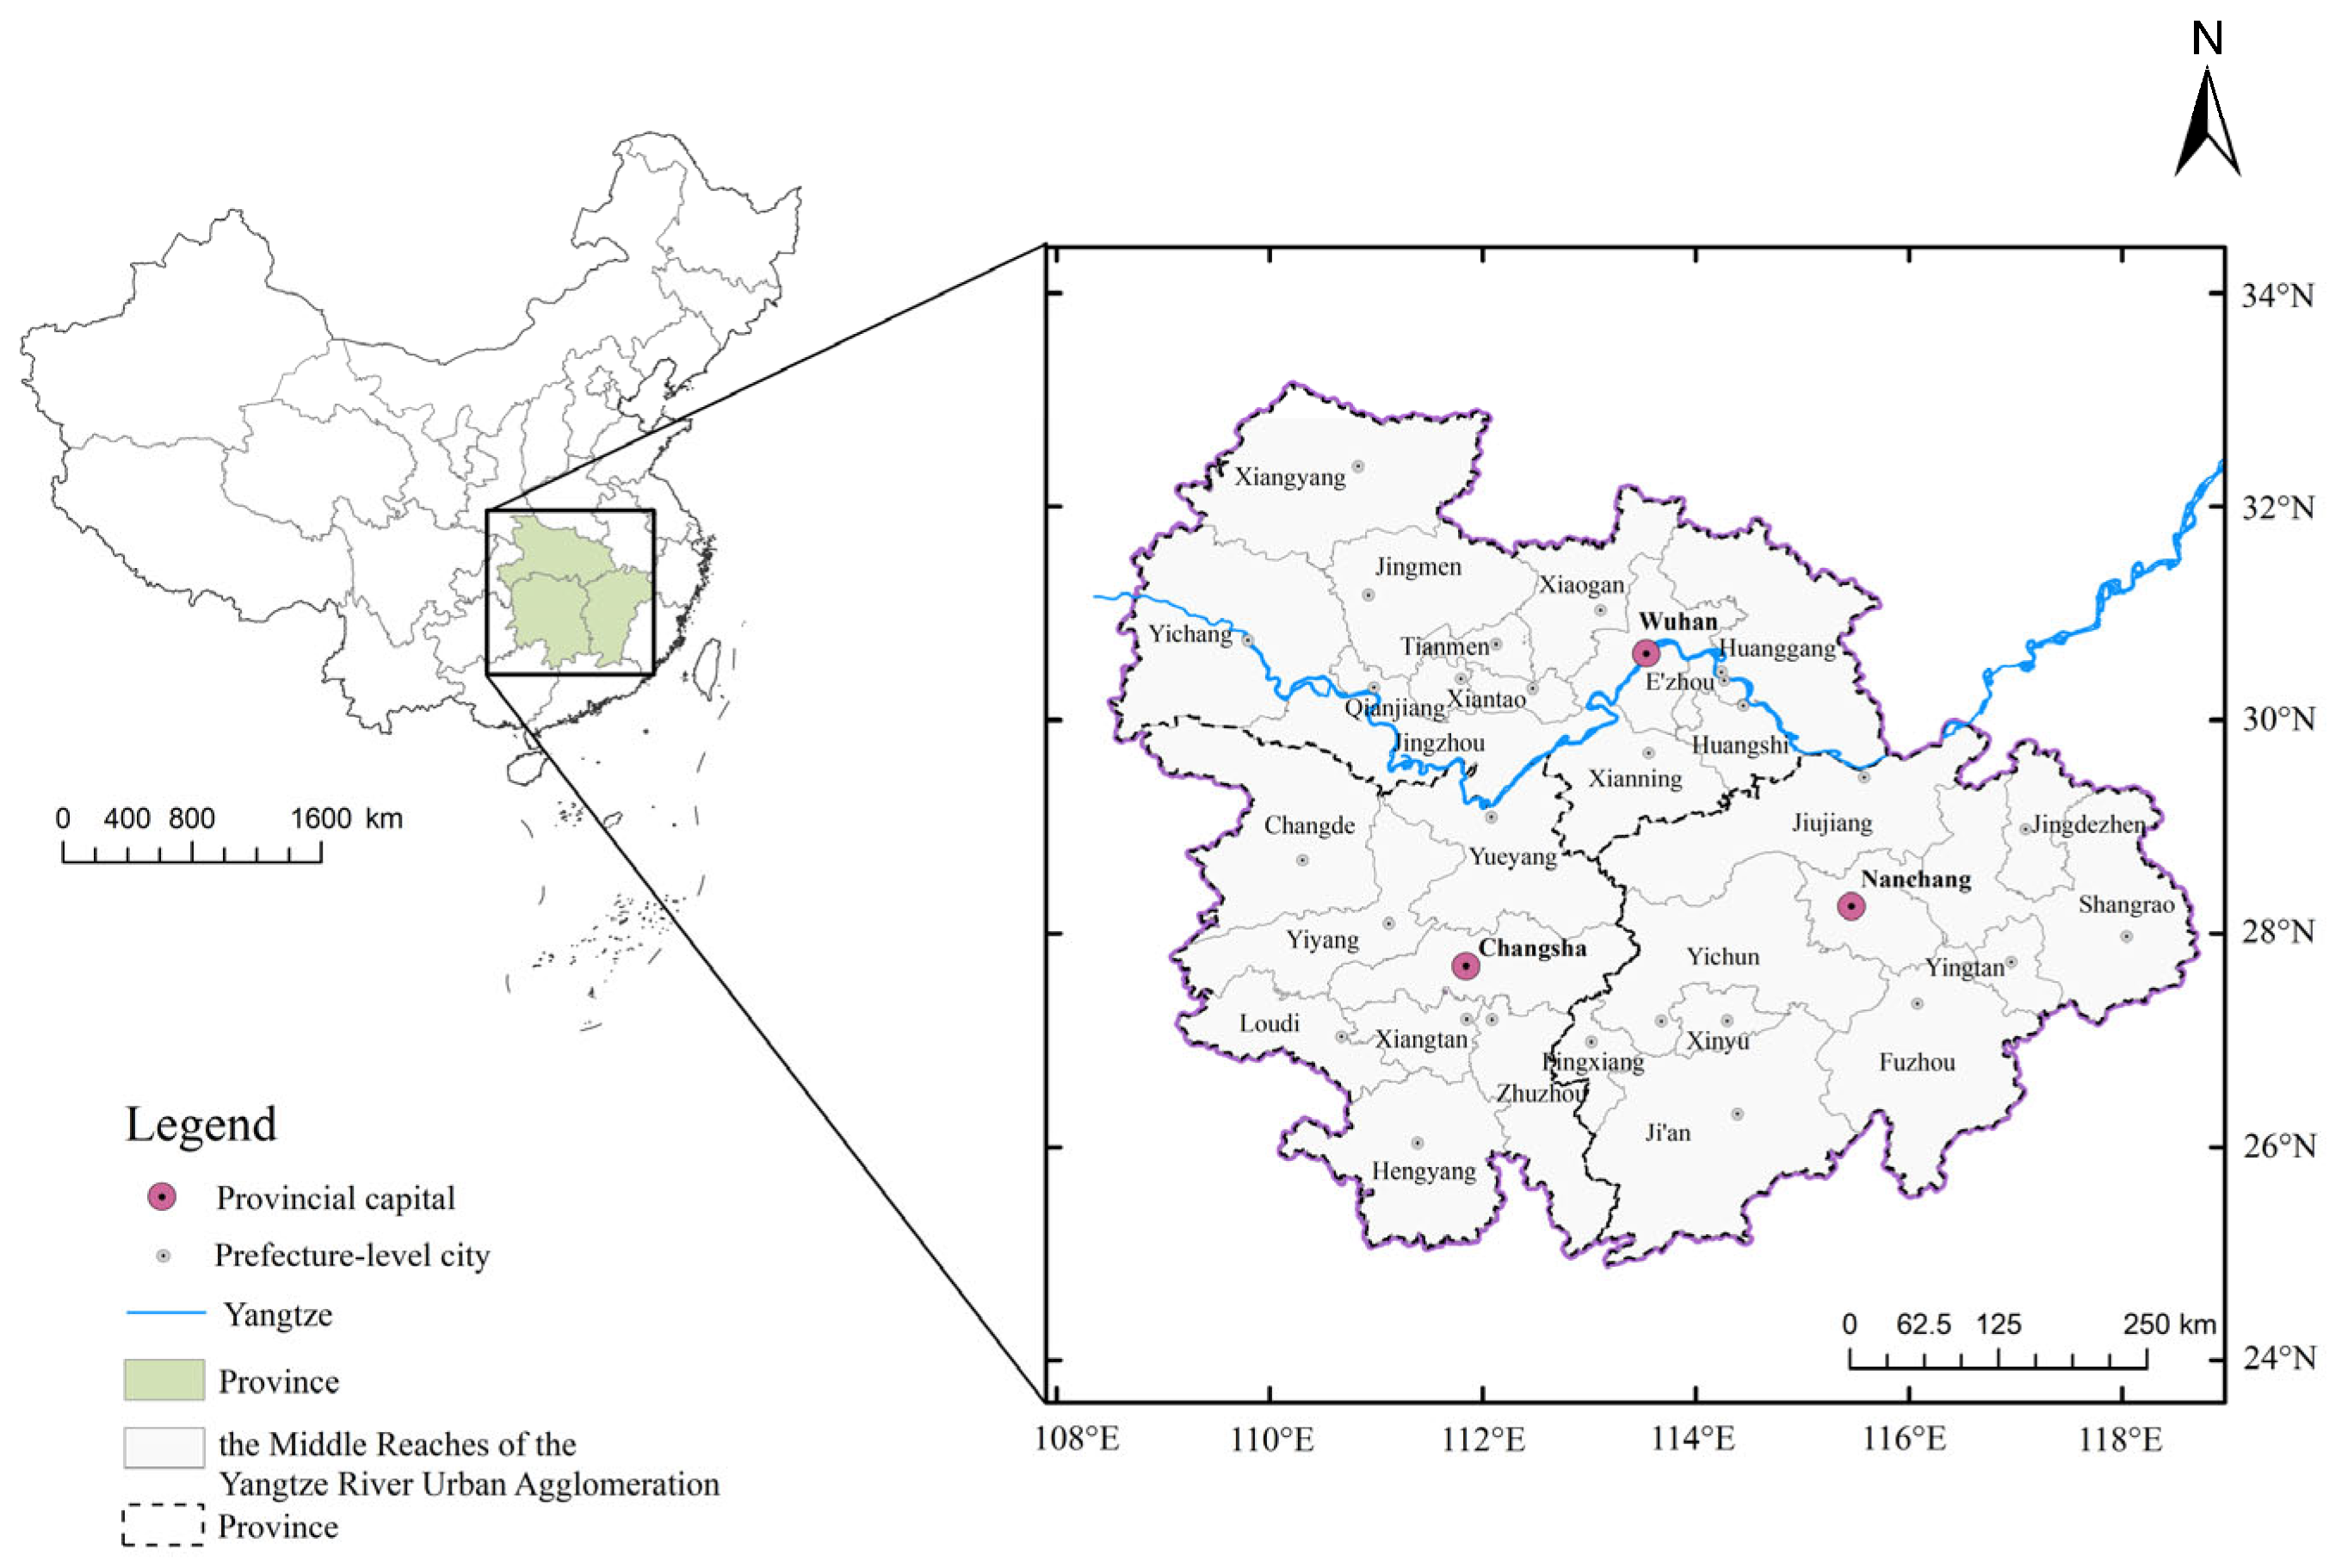
Figure 1. The studied region.
Sustainability 15 11376 g001
Figure 2. Industrial variety in the Yangtze River middle reaches urban agglomeration.
Sustainability 15 11376 g002
Figure 3. Recovery resilience in the Yangtze River middle reaches urban agglomeration.
Sustainability 15 11376 g003aSustainability 15 11376 g003b
Figure 4. Scatterplots of industrial diversity and regional economic resilience in different time periods. (a) Related variety against recovery resilience, 2008–2009; (b) unrelated variety against recovery resilience, 2008–2009; (c) related variety against recovery resilience, 2008–2010; (d) unrelated variety against recovery resilience, 2008–2010; (e) related variety against recovery resilience, 2008–2012; and (f) unrelated variety against recovery resilience, 2008–2012.
Sustainability 15 11376 g004
Table 1. Descriptive variables.
MeanS.D.MaxMin
Recovery resistance
2008–2009
−0.0850.4361.226−0.924
Recovery resistance
2008–2010
0.4090.2080.9440.025
Recovery resistance
2008–2012
0.4580.1851.0740.102
Related variety0.8390.1721.0980.462
Unrelated variety2.7280.3063.1061.844
GDP per capita201599533457659001
Employment164,507127,150680,43129,593
Fixed investment0.5330.1640.9090.227
Secondary sector0.4850.0810.6270.333
Table 2. Model comparison: model probabilities.
No. of NeighborsSLXSDMSDEM
One-year recovery20.00050.01220.0006
30.12110.25020.2579
40.07490.11120.1634
50.00020.00080.0008
60.00080.00300.0025
Two-year recovery20.00000.00000.0000
30.01000.01300.0132
40.21800.26730.4784
50.00000.00000.0000
60.00000.00000.0001
Four-year recovery20.00000.00000.0000
30.00000.00000.0002
40.15030.20970.5385
50.00020.00120.0029
60.00950.02090.0665
Notes: The table reports the model probabilities for the three spatial models using spatial weight matrices defined for two to six nearest neighbors. The analysis is based on a total sample of 31 cities.
Table 3. Estimated direct and indirect effects.
Recovery
2008–2009
Recovery
2008–2010
Recovery
2008–2012
Model SDEMSDEMSDEM
No. of neighbors344
Direct effect
Related variety1.736 **3.087 ***0.562
Unrelated variety−0.073−2.303−0.090
GDP per capita0.338−2.315 *−1.935 ***
Employment0.5771.920 **0.842 **
Fixed investment0.2110.6220.293
Secondary sector0.8924.959 **2.702 ***
Indirect effect
W × related variety4.484 *3.7231.228
W × unrelated variety−7.964 *−2.220−0.756
W × GDP per capita−0.030−5.374−3.450 *
W × employment4.710 ***10.030 ***4.042 ***
W × fixed investment−3.043 **−6.688 ***−2.264 **
W × secondary sector2.31313.423 **3.181
Regional dummiesYesYesYes
W × regional dummiesYesYesYes
No. of observations313131
Pseudo R20.5430.7110.743
λ0.591 ***0.748 ***0.678 **
Notes: Significance levels: * for 90%, ** for 95%, and *** for 99%. The optimal spatial weights are determined by the reported results in Table 2.
Disclaimer/Publisher’s Note: The statements, opinions and data contained in all publications are solely those of the individual author(s) and contributor(s) and not of MDPI and/or the editor(s). MDPI and/or the editor(s) disclaim responsibility for any injury to people or property resulting from any ideas, methods, instructions or products referred to in the content.