Abstract
The new carbon intensity indicator (CII) is an operational tool that is part of SEEMP III and came into force on 1 January 2023. It is a measure of a vessel’s efficiency in CO2 emitted per deadweight nautical mile and is aimed at supporting the decarbonization of maritime transportation. There are studies indicating that no matter which CII option is applied, the overall CO2 emissions can increase, and maybe the proposal of a new CII is required. It has been suggested that an average CII could be calculated for an entire company rather than for each individual ship. This case study analyzed the 1-year calendar routes of four vessels (one container carrier, two bulk carriers, and one tanker vessel); the CII results were evaluated, and further operational measures were applied to improve the CII rating. It was observed that CII is highly dependent on idle and laden voyages, and very good cooperation between shipowners and charterers is a must. The anchor/drifting and port times must be reduced to the minimum, and vessels’ schedules should be adjusted for just-in-time arrival to optimize the speed between ports. That requires the voyage planning to be evaluated and adjusted based on port operations.
1. Introduction
According to European studies, the past five years were the warmest in history, and the average temperature worldwide increased by 1.1 °C compared with pre-industrial times [1]. Besides the weather change, where more and more extreme phenomena have been encountered human health has been severely affected. The changeover to a climate with very low emissions is urgently required in order to protect health and the environment and to increase the quality of life.
Shipping is one of the most significant polluters, which can affect both human health and the environment and becomes a serious concern for governments and different institutional bodies because of its increasing activity. Approximately 90% of international trade is conducted via ships, and global transport work is expected to increase in the future. Concerning the short-term measures, speed optimization and speed reduction could be the most effective solutions in improving the vessels’ energy efficiency; the mid-term measures involve focusing on alternative fuels, while the long-term measures will be about the development of new technologies, fuels neutral in carbon, and fossil-free fuels.
IMO has defined energy efficiency indicators in order to impose limits on CO2 emissions from ships and, therefore, limit global warming. The studies and specialists are proposing various ways to increase the vessels’ electrification and to make the shipboard systems more energy efficient. Among new technologies such as electric vessels, alternative fuels, unconventional propulsors, and onboard renewable energy systems [2], there are also operational measures that have the capability of achieving and increasing the energy efficiency potential of a vessel. At the same time, the decarbonization of maritime transportation includes the analysis of ports’ and terminals’ energy efficiency and the required measures taken to increase the environmental sustainability and efficiency of maritime harbors (cold ironing, supply of alternative fuels, electrification of port equipment, optimization of port operations, etc.). SEEMP is one of the most important tools a shipowner/ship manager can implement in terms of onboard operational measures to increase the energy efficiency of a vessel and provides guidelines for the application of energy measures onboard commercial vessels. SEEMP is a dynamic instrument that will support the ship’s crew in executing the defined operations and will also guide shipping companies with monitoring and reporting of energy efficiency targets. It is of great importance that the vessel’s crew is actively engaged in the further development of SEEMP to achieve the desired efficiency of the vessel and meet the expected goals. The achievement of objectives is very much based on the attitude and skills of seafarers, together with the competence, knowledge, awareness, and professionalism of the crew involved.
For a shipping company, managing and operating a fleet in terms of performance efficiency can be challenging. Vessel reporting and performance monitoring systems allow companies to verify how efficient and profitable their vessels are and to take measures in advance to improve efficiency and comply with the regulations. A vessel performance monitoring and management system is a complex process of measuring the ship’s performance by analyzing a series of parameters input by the vessel’s crew. This is one of the best tools available onboard to calculate and control air emissions and the vessel’s behavior over a long period of time. Besides operational and technical measures, other areas must also be evaluated and examined. Reporting and monitoring of the vessel’s nautical and engine data can provide valuable information about the vessel’s performance, and significant measures can be taken by analyzing the reports. Goal setting, planning, and evaluation must be part of any company’s energy efficiency management plan for evaluation of the measures applied.
The carbon intensity indicator (CII) is part of SEEMP Part III and is intended to help companies achieve and improve their performance and energy efficiency. The SEEMP III is compulsory and must be implemented onboard starting 1 January 2023 [3]. CII is the operational factor that measures how efficient and performant the ship is and is expressed in grams of CO2 emitted on transport capacity (or deadweight) and nautical miles. The successful implementation of SEEMP III lies in the accuracy of vessels’ operational data, performance targets, procedures for evaluation and improvement, and corrective action strategy. A self-evaluation process is recommended to be implemented by each company to assess the effectiveness of the measures proposed.
One of the important actions taken during MEPC76 was the establishment of reduction factors for the carbon intensity indicator (CII). The CII is applicable for ships over 5000 GRT engaged in international voyages. Using the year 2019 as a baseline, CII reduction factors should increase by one percentage point (pp) per year for 2020–2022, followed by two pp per year for the years 2023–2026. The rates for the years 2027–2030 will be set as part of the review, due to be completed by 1st January 2026.
Reduction factors for CII per year are presented in Table 1:

Table 1.
Reduction factors for CII [4].
The CII will be calculated annually, and its value will indicate how efficient the ship is in relation to a reference value. By comparing a ship’s CII value over a year with reference CII values, the ship’s performance will be rated as ‘A’ (superior-major), ‘B’ (superior-minor), ‘C’ (moderate), “D” (inferior-minor), or “E” (inferior). A rating of ‘A’, ‘B’, or ‘C’ is required for compliance, and corrective action must be taken for vessels receiving ‘D’ for 3 consecutive years or ‘E’ for 1 year [5]. CII compliance ratings are graphically presented in Figure 1.
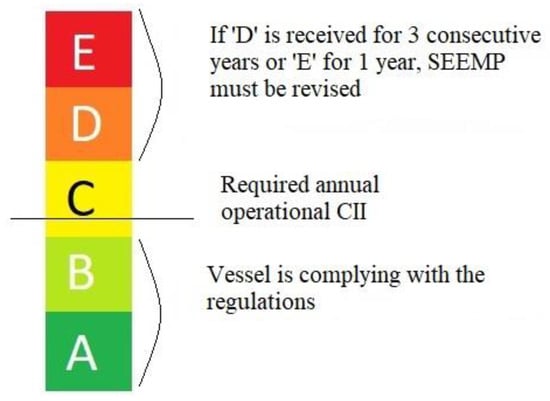
Figure 1.
CII rating system (adapted from [5]).
2. Literature Review
The carbon intensity indicator (CII) is one of the most important indicators in assessing the operational efficiency of commercial vessels. Specialized research is focusing mainly on ways to improve the vessels’ rating to become more efficient and attractive for the charterers and improve market competitiveness. One of the options could be to use one of the software developed by many weather routing services available in the market. The authors of [6] specify that the optimization of vessels’ routes can be achieved using improved ship weather routing using wind-assisted rotors. This calculation is based on different data (ship design, past sailing information, weather forecasts) to reduce fuel oil consumption. In [7], it is mentioned that CO2 emissions reduction is related to the average sea state, and ship routing has a big influence on the CII reduction in short-sea shipping. Specialists recommend proper usage of vessels’ performance monitoring software that can guide the ship’s crew in making the appropriate navigational decisions to improve voyage performance and execution [8].
Index decomposition analysis (IDA) is a tool used to analyze carbon intensity trends over the years and has been used to evaluate the influence of different factors in the development of a carbon footprint, such as energy efficiency [9]. The shore power supply is proven to reduce emissions, and calculations in [10] showed that CII can be improved by 7.8% using cold ironing.
Ref. [11], a case study on a cruise vessel, affirms that a vessel run only by MGO can no longer comply with the regulations. In addition to the use of LNG as fuel, innovative technologies such as solid oxide fuel cells (SOFC) can be successfully applied. A study conducted by [12] shows that fossil fuels with carbon capture and storage capabilities can lead to a CII reduction of 90%, and the other alternative fuels can achieve zero CII tank-to-wake.
Many studies describe the operational measures that a vessel and a shipowner can take to reduce fuel oil consumption, reduce emissions, and improve the CII rating. The most cost-effective measures include voyage planning and execution using weather routing, hull and propeller performance, and slow steaming [13]. Hull cleaning is a very simple and efficient way to improve the CII, together with hull coating. Biofouling is creating extra hydrodynamic effort, which, in turn, is burning more fuel. Ref. [14] analyzes strategies for improving the CII and the use of antifouling coatings. Fouling management is considered by [15] as a necessary tool for enhancing energy efficiency, stating that fouling can increase the vessel’s frictional resistance by up to 93%. The authors of [16] are expecting the average vessels’ speed to be reduced starting from 2023 to comply with CII requirements.
Because CII is highly dependent on idle and laden voyages, very good cooperation between shipowners and charterers is a must. CII might create financial losses for older vessels simply because the application of the required measures will cost more than the vessels can produce in their remaining lifetimes, and shipowners can consider scrapping as being a viable solution [17]. The cost of improving a D rating to a C rating for bulk carriers could result in a loss of revenue [16]. The same idea is expressed by [18], which says that new CII calculation is leading to higher rates that lower emissions, and maritime organizations should focus more on the reduction of emissions than depend on the formulas. Based on their case study, some of the most efficient ships can obtain bad CII ratings. The authors of [19] prove, in their study, that no matter which CII option is applied (supply-based, demand-based, distance-based, sailing-time-based CII), the overall CO2 emissions increase, and maybe the proposal of a new CII is required. Ref. [19] suggests that an average CII could be calculated for an entire company rather than for each individual ship.
The shipping financial markets will be affected by the CII in the future, and the charter party contract might be amended with new clauses [18,20].
Last but not least, the human factor has a very important role in decarbonization and improving the rating of the vessels. Raising the crew’s awareness and investing in the necessary training, involving people, and increasing commitment will be very successful ways of fighting global warming [20]. The effectiveness of IMO regulations and implementation of operational proposals lies in the skills and competence of the ships’ crews to understand, accept and, embrace new practices and behavior [13].
3. Materials and Methods
3.1. Research Methodology
This case study analyzed the performance of four vessels: one container carrier, two bulk carriers, and one tanker vessel, over a period of 1 calendar year. For all vessels, the CII was calculated and the rating for each vessel was determined. The calculation determined the value of total CO2 emissions in that respective year. Using the DWT or vessel’s capacity and total distance traveled, the attained CII was determined. The value of the attained CII was then compared to the required CII for the years 2023, 2024, 2025, and 2026. The required CII was calculated based on the CII reference, as defined by IMO.
The results obtained after calculations show that all vessels achieved scores below a ‘C’ rating; therefore, operational measures must be taken in order to increase the performance of the vessel and improve the rating. Operational measures should be defined in the SEEMP manual as tools for increasing vessels’ energy efficiency and lowering emissions.
Data Collection
Students at Master Program from both Naval Academy and Constanta Maritime University were asked to collect the data from the ships they were conducting the cadetship training on. All data were copied from the engine room logbooks, with master and chief engineer approval. The data collected included the number of hours sailing in a day (sometimes the clock was changed and it was either 23 or 25 h, depending on if the vessels were heading west or east), fuel oil consumption, and distance travelled. When the ships were at anchorage or drifting off-course there was no speed to record, but additionally, diesel oil consumption was recorded. The data was collected during various periods from October 2020 to December 2021. Thereafter, the data were checked for consistency by the course supervisor, and out of 30 students collecting data, 23 students were found suitable for our study. The 23 results were thereafter grouped into 4 categories: container carriers (4), bulk carriers (12), tankers (7), and LNG (2). The results related to LNG carriers were considered not representative and they were not selected for our study, while, for the other three categories, one containership, 2 bulk carriers, and 1 tanker vessel were randomly selected.
3.2. Calculation Methodology
The data were collected for a few complete voyages. The average speed, average waiting time, and average consumption were calculated and, thereafter, the averages were used for 1-year calculations, although the voyages were not completed exactly at the end of the year. The ship was considered to repeat those voyages for 1 year.
The CII required for each vessel was calculated based on the CII reference. Both formulas are shown below [21,22]:
where:
- Z is the reduction factor (as shown in Table 2);
- a and c are parameters estimated through median regression fits, taking the attained CII and the capacity of individual ships collected through IMO DCS in year 2019 as the sample.
The Attained CII was calculated in a given calendar year [23]:
where:
- j is the fuel type;
- FCj is the mass of consumed fuel j;
- CFj is the fuel mass to CO2 mass conversion factor for fuel j;
- Capacity is DWT for cargo vessels and GRT for passenger ships, ro-ro passenger and vehicle carriers;
- D is the distance in nautical miles corresponding to the cargo carried or work done.
Simplified, the formula can be [23]:
In the following situations, the vessels had been using different types of fuel oil. For the purpose of the study, the following CO2 fuel conversion factors were used:
Table 2.
Fuel CO2 conversion factor.
Table 2.
Fuel CO2 conversion factor.
| Fuel Type | CO2 Conversion Factor |
|---|---|
| HFO | 3.114 |
| VLSFO | 3.188 |
| MGO | 3.206 |
The target of all ship owners is to always maintain the vessels within A, B, and C ratings, and since our initial calculations showed that this can be a challenge, the following methodology was used to reach at least a C rating.
- What is the average fuel consumption to reach a minimum C rating?;
- Is the reduction in speed at sea sufficient to reach that level? For this option, full-speed, eco-speed, and super-eco-speed alternatives were calculated;
- If the answer is NO, with the best speed calculated as per point two, what reduction in waiting time or drifting time is required to reach the minimum C rating?
The calculation of the ship’s fuel oil consumption was realized using a software/calculation tool developed by the Technological University of Denmark (DTU) and the University of Southern Denmark. Ship-Desmo-Tool is an Excel package for predicting energy demand and exhaust gas emissions from ships using empirical and semi-empirical methods based only on ship type and bulk parameters (This is free software under the conditions of the GNU General Public License version 3, Hans Otto Kristensen and Harry B. Bingham, Mechanical Engineering, Technical University of Denmark, Copenhagen, Denmark). By entering the main particulars of the vessel, fuel type, speed, and hydro-meteorological conditions, the calculation tool returns approximate fuel consumption figures [24]. An illustrative example of the methodology is presented in Section 4, for VESSEL A. For all the other vessels and situations, the same methodology was applied.
4. Results and Discussion
Vessel A—Container carrier
Ship’s particulars
| LOA | 334 m |
| DWT | 101,906 t |
| GRT | 90,745 m3 |
| TEU | 8238 |
| Year built | 2004 |
| CII reference | 7.06 | |
| Required CII | 2023 | 6.71 |
| 2024 | 6.57 | |
| 2025 | 6.42 | |
| 2026 | 6.28 |
Case study 1
Route for 1 year
East Asia–Panama–Central America–South and East Asia
- What is the average fuel consumption to reach a minimum C rating?
To reach a ‘C’ rating, the total fuel consumption should be decreased by a minimum of 1800 t. In the following points, different options applicable to VESSEL A will be analyzed. The options offer realistic solutions for VESSEL A, taking into account actual vessel consumption, realistic duration of port/drift/anchor stay, and the minimum speed required for the type of vessel.
- 2.
- Is the reduction of speed at sea sufficient to reach that level? For this option, full-speed, eco-speed, and super-eco-speed alternatives were calculated.
As calculated in item 1 of Table 3, speed reduction alone cannot be applicable to the vessel. Therefore, a combination of reducing drifting/anchorage time and consequently, decreasing speed, under the present schedule, was analyzed.
Table 3.
Summary of results for Vessel A, case study 1.
Table 3.
Summary of results for Vessel A, case study 1.
| Avg Speed (Knots) | Hrs Sea | Hrs Idle Port/Drift/Anchor | Distance (nm) | VLSFO Consump (t) | MDO/MGO Consump (t) |
|---|---|---|---|---|---|
| 15 | 6301.1 | 2566.3 | 94,089.7 | 22,741.0 | 543.5 |
| Total CO2 emissions | 74,240.8 t | |
| Attained CII | 7.74 | |
| Rating 2023 | 1.15 | D |
| Rating 2024 | 1.18 | D |
| Rating 2025 | 1.21 | E |
| Rating 2026 | 1.23 | E |
Reducing drift/anchorage time as much as possible and as applicable for the vessel’s schedule and port rotation will allow speed to decrease following less fuel consumption, resulting in lower CO2 emissions. Table 4 shows the summary of results for vessel A.
Table 4.
Summary of results for vessel A, case study 1, after reducing drift/anchorage time.
Table 4.
Summary of results for vessel A, case study 1, after reducing drift/anchorage time.
| Avg Speed (Knots) | Hrs Sea | Hrs Idle Port/Drift/Anchor | Distance (nm) | VLSFO Consump (t) | MDO/MGO Consump (t) |
|---|---|---|---|---|---|
| 14.4 | 6517.4 | 2339.5 | 94,089.7 | 21,583.6 | 543.5 |
| Total CO2 emissions | 70,551 t | ||
| Attained CII | 7.36 | ||
| Rating 2023 | 1.1 | D | |
| Rating 2024 | 1.12 | D | |
| Rating 2025 | 1.15 | E | |
| Rating 2026 | 1.17 | E |
It was noticed that even after reducing the drifting/anchorage time by 226.8 h (the maximum time, in order to allow the vessel to sail at a minimum speed of 12 knots), the CII did not improve significantly. In this case, further operational measures should be applied. The operational measures should already be defined in SEEMP III.
- 3.
- What further reduction in waiting time or drifting time is required to reach the minimum C rating?
For the existing schedule, a reduction in drifting/anchorage time alone is not sufficient. Therefore, a reduction in port stay should be analyzed. That will allow a small decrease in speed, but one sufficient to reduce consumption and improve the rating.
Whenever possible and applicable, optimization of cargo operation and duration of port stay should be considered. For this case study, a reduction of 86.1 h was considered, the minimum hours in order to reach a ‘C’ rating for CII for 2023. The results are presented in Table 5.
Table 5.
Summary of results for vessel A, case study 1, after reducing of port stay.
Table 5.
Summary of results for vessel A, case study 1, after reducing of port stay.
| Avg Speed (Knots) | Hrs Sea | Hrs Idle Port/Drift/Anchor | Distance (nm) | VLSFO Consump (t) | MDO/MGO Consump (t) |
|---|---|---|---|---|---|
| 14.1 | 6661.2 | 2253.4 | 94,089.7 | 20,956.7 | 535.0 |
| Total CO2 emissions | 68,525.5 t | ||
| Attained CII | 7.15 | ||
| Rating 2023 | 1.07 | C | |
| Rating 2024 | 1.09 | D | |
| Rating 2025 | 1.11 | D | |
| Rating 2026 | 1.14 | D | |
For vessel A, for the given route, it is very difficult to achieve a good CII rating, even if the route planning is carried out in advance and the vessel’s speed is reduced and optimized. In this case, very good cooperation between the ship/owner and the charterer must be considered to avoid any delays in the vessel’s operation, for optimization of port stay, and for reducing to the minimum of idle times (port, anchor, or drifting). Table 6 shows the summary of results for this case.
Case study 2
Route for 1 year
Asia–Panama–U.S. East Coast–Asia–Suez–U.S. East Coast–Suez–Asia
Table 6.
Summary of results for vessel A, case study 2.
Table 6.
Summary of results for vessel A, case study 2.
| Avg Speed (Knots) | Hrs Sea | Hrs Idle Port/Drift/Anchor | Distance (nm) | VLSFO Consump (t) | MDO/MGO Consump (t) |
|---|---|---|---|---|---|
| 16.5 | 6504.6 | 2327.5 | 107,463 | 24,647.4 | 3012.4 |
| Total CO2 emissions | 88,233.5 t | ||
| Attained CII | 8.06 | ||
| Rating 2023 | 1.20 | E | |
| Rating 2024 | 1.23 | E | |
| Rating 2025 | 1.25 | E | |
| Rating 2026 | 1.28 | E | |
Measures for improving CII
Reducing drift/anchorage time as much as possible and as applicable to the vessel’s schedule and port rotation will allow a speed decrease following less fuel consumption, resulting in lower CO2 emissions, as presented in Table 7.
Table 7.
Summary of results for vessel A, case study 2, after reducing drift/anchorage times.
Table 7.
Summary of results for vessel A, case study 2, after reducing drift/anchorage times.
| Avg Speed (Knots) | Hrs Sea | Hrs Idle Port/Drift/Anchor | Distance (nm) | VLSFO Consump (t) | MDO/MGO Consump (t) |
|---|---|---|---|---|---|
| 15.7 | 6839.5 | 1992.6 | 107,463.0 | 21,775.7 | 2910.3 |
| Total CO2 emissions | 78,751.2 t | ||
| Attained CII | 7.19 | ||
| Rating 2023 | 1.07 | C | |
| Rating 2024 | 1.10 | D | |
| Rating 2025 | 1.12 | D | |
| Rating 2026 | 1.14 | D |
Vessel b–bulk carrier
Ship’s particulars
| LOA | 180 m |
| DWT | 33,755 t |
| GRT | 23,426 |
| Year built | 2011 |
| CII reference | 7.24 | |
| Required CII | 2023 | 6.88 |
| 2024 | 6.73 | |
| 2025 | 6.59 | |
| 2026 | 6.44 |
Case study
Route for 1 year
Mediterranean Sea–Brazil–Baltic Sea–Mediterranean Sea–Black Sea–Mediterranean Sea–West Africa–Brazil–Mediterranean Sea
Table 8 shows the results for the given route for vessel B.
Table 8.
Summary of results for vessel B.
Table 8.
Summary of results for vessel B.
| Avg Speed (Knots) | Hrs Sea | Hrs Port | Hrs Idle Drift/Anchor | Distance (nm) | VLSFO Consump (t) | MDO/MGO Consump (t) |
|---|---|---|---|---|---|---|
| 11.1 | 3966.3 | 1571.7 | 3148.9 | 44176.2 | 3627.5 | 370.9 |
| Total hrs in ballast condition | 4251.7 |
| Total days off hire | 100 |
| Total CO2 emissions | 12,753.4 t | |
| Attained CII | 8.55 | |
| Rating 2023 | 1.24 | E |
| Rating 2024 | 1.27 | E |
| Rating 2025 | 1.30 | E |
| Rating 2026 | 1.33 | E |
Measures for improving CII
Scenario 1
Scenario 1 was analyzed only as a voyage, and potential measures were applied to increase the CII rating.
Brasil–Bilbao–North Sea
In this case, the results are presented in Table 9.
Table 9.
Summary of results for vessel B, scenario 1.
Table 9.
Summary of results for vessel B, scenario 1.
| Hrs Sea | Hrs Port | Hrs Idle Drift/Anchor | Distance (nm) | VLSFO Consump (t) | MDO/MGO Consump (t) |
|---|---|---|---|---|---|
| 850 | 216.7 | 33.5 | 10,078.8 | 780.5 | 59.7 |
| Total CO2 emissions | 2679.5 t | |
| Attained CII | 7.88 | |
| Rating 2023 | 1.15 | D |
| Rating 2024 | 1.17 | D |
| Rating 2025 | 1.20 | E |
| Rating 2026 | 1.22 | E |
To improve the CII rating, the route was calculated using super-eco speed, 11 knots.
Brazil–Bilbao–North Sea—Super-Eco Speed on All Legs
In this situation, the results are given in Table 10.
Table 10.
Summary of results for vessel B, scenario 1, super-eco speed.
Table 10.
Summary of results for vessel B, scenario 1, super-eco speed.
| Hrs Sea | Hrs Port | Hrs Idle Drift/Anchor | Distance (nm) | VLSFO Consump (t) | MDO/MGO Consump (t) |
|---|---|---|---|---|---|
| 949 | 216.7 | 33.5 | 10,078.8 | 700.2 | 59.7 |
| Total CO2 emissions | 2423.6 t | ||
| Attained CII | 7.12 | ||
| Rating 2023 | 1.04 | C | |
| Rating 2024 | 1.06 | C | |
| Rating 2025 | 1.08 | D | |
| Rating 2026 | 1.11 | D | |
In the case of Vessel B, very good cooperation between the shipowner and charterer must be considered. This is to avoid idle times (off-hire days, anchor, and drift) and reduction of speed as much as possible.
Vessel c–bulk carrier
Ship’s particulars
| LOA | 255 m |
| DWT | 114,664 t |
| GRT | 64,100 |
| Year built | 2010 |
| CII reference | 3.38 | |
| Required CII | 2023 | 3.21 |
| 2024 | 3.14 | |
| 2025 | 3.08 | |
| 2026 | 3.01 |
Case study
Route for 1 year
North Sea–Mediterranean Sea–Black Sea–Asia
For vessel C, the summary of results for the given route is shown in Table 11.
Table 11.
Summary of results for vessel C.
Table 11.
Summary of results for vessel C.
| Avg Speed (Knots) | Hrs Sea | Hrs Port | Hrs Idle Drift/Anchor | Distance (nm) | HFO Consump (t) | VLSFO Consump (t) | MDO/MGO Consump (t) |
|---|---|---|---|---|---|---|---|
| 10.8 | 4305.4 | 794 | 3698.5 | 46,512.2 | 3516.2 | 1812.1 | 770.4 |
| Total CO2 emissions | 19,196.3 t | ||
| Attained CII | 3.60 | ||
| Rating 2023 | 1.12 | D | |
| Rating 2024 | 1.15 | D | |
| Rating 2025 | 1.17 | D | |
| Rating 2026 | 1.20 | E | |
Measures for improving CII
Reduce drift/anchorage time as much as possible. Increase the number of port calls and distance sailed. Table 12 presents the results after the measures are applied.
Table 12.
Summary of results for vessel C after measures were implemented.
Table 12.
Summary of results for vessel C after measures were implemented.
| Avg Speed (Knots) | Hrs Sea | Hrs Port | Hrs Idle Drift/Anchor | Distance (nm) | HFO Consump (t) | VLSFO Consump (t) | MDO/MGO Consump (t) |
|---|---|---|---|---|---|---|---|
| 10.8 | 5232.5 | 1050.0 | 2515.5 | 56,512.0 | 4255.0 | 1925.0 | 770.4 |
| Total CO2 emissions | 21,856.9 t | ||
| Attained CII | 3.37 | ||
| Rating 2023 | 1.05 | C | |
| Rating 2024 | 1.07 | D | |
| Rating 2025 | 1.10 | D | |
| Rating 2026 | 1.12 | D | |
For vessel c, reducing idle times is the most applicable measure, together with better planning of the voyages.
Vessel d—tanker
Ship’s particulars
| LOA | 183 m |
| DWT | 37,867 t |
| GRT | 25,269 |
| Year built | 2015 |
| CII reference | 8.46 | |
| Required CII | 2023 | 8.04 |
| 2024 | 7.87 | |
| 2025 | 7.70 | |
| 2026 | 7.53 |
Case study
Route for 1 year
Black Sea–Mediterranean Sea–North Sea–Mediterranean Sea
The results for vessel D are shown in Table 13.
Table 13.
Summary of results for vessel D.
Table 13.
Summary of results for vessel D.
| Avg Speed (Knots) | Hrs Sea | Hrs Port | Hrs Idle Drift/Anchor | Distance (nm) | HFO Consump (t) | VLSFO Consump (t) | MDO/MGO Consump (t) |
|---|---|---|---|---|---|---|---|
| 13.1 | 3625.0 | 2011.0 | 3124.0 | 47,797.5 | 4060.0 | 391.7 | 725 |
| Total CO2 emissions | 16,215.9 t | ||
| Attained CII | 8.81 | ||
| Rating 2023 | 1.10 | D | |
| Rating 2024 | 1.12 | D | |
| Rating 2025 | 1.14 | D | |
| Rating 2026 | 1.17 | D | |
Measures for improving CII
Reduce drift/anchorage time as much as possible. That will allow a speed decrease following less fuel consumption and lower CO2 emissions. New results are shown in Table 14.
Table 14.
Summary of results for vessel D after measures were implemented.
Table 14.
Summary of results for vessel D after measures were implemented.
| Avg Speed (Knots) | Hrs Sea | Hrs Port | Hrs Idle Drift/Anchor | Distance (NM) | HFO Consump (t) | VLSFO Consump (t) | MDO/MGO Consump (t) |
|---|---|---|---|---|---|---|---|
| 10.3 | 4642.3 | 1649.5 | 2468.2 | 47,797.5 | 3556.9 | 391.7 | 530.9 |
| Total CO2 emissions | 14,027 t | ||
| Attained CII | 7.62 | ||
| Rating 2023 | 0.95 | C | |
| Rating 2024 | 0.97 | C | |
| Rating 2025 | 0.99 | C | |
| Rating 2026 | 1.01 | C | |
For vessel D, the most important operational measure will be reducing drifting/anchorage times to improve the vessel’s CII rating and efficiency.
5. Conclusions
The improvements were calculated using reverse calculations, keeping in mind that the target is that the vessels should always have A, B, or C ratings. For some of the scenarios, obtaining a C rating was almost impossible from a practical point of view, as apart from environmental considerations, the owners will always tend to focus on profit maximization. For different types of ships, different types of solutions were applied. For container ships, a reduction in waiting time can translate into lower speed, and that requires better planning with agents to avoid waiting time. For bulk carriers and tankers, on the other hand, waiting time at anchorage is often dependent on vessels’ arrival, as many terminals use the first come, first served principle; therefore, the focus was on reducing speed at sea, and eco speed and super-eco speed were used as improvement scenarios.
Among the most important energy efficiency measures is the vessel’s operation management. Some operational measures are ready to be implemented at minimum costs and offer significant results. The following parts of improvement represent the main potential:
- Engine operation management: speed, power, fuel consumption, fuel characteristics;
- Optimization of the ship’s operation: route planning, weather routing, speed, ballast management, optimal use of autopilot, etc.;
- Optimization of fleet management: efficiency of fleet capacity and investment in the maintenance of equipment;
- Optimization of cargo operation: optimization of port stay, reducing idle time, better planification of the voyages, etc.
Based on the case study, none of the four vessels analyzed could comply with the regulations. For the 1-year route studied, each vessel must apply operational efficiency measures, as defined in SEEMP III, to be in compliance with the regulations and to be more attractive to the charterers. It was clearly observed that reducing idle times (anchoring, drifting, and duration of port stay) will improve the CII rating. To accomplish this, better cooperation between shipowners and charterers is essential.
Reducing idle times means that the speed between ports is reduced, resulting in less fuel consumption and fewer CO2 emissions. Just-in-time arrivals play an important role, meaning that the vessel’s speed is adjusted to avoid unnecessary waiting times for the berth. That requires the voyage planning to be analyzed and adjusted based on the port operations.
For vessels engaged in voyage charter, the situation can become complicated, and due to inconsistent voyages, vessels will have difficulty obtaining a good rating. That can have a negative impact on the charterer rates. For vessels engaged in time-charter voyages, the situation can be controlled more easily to avoid unnecessary delays and idle times, and planning can be done well in advance. This will allow early calculations of CII and advance measures to be taken to be in compliance with IMO regulations. CII will have a great impact on the daily operation of the vessels, and both owners and charterers must cooperate to obtain the highest possible rating for the vessel, which will finally be in both interests.
Author Contributions
Conceptualization, L.R.; Methodology, L.R. and G.B.; Validation, G.B.; Formal analysis, L.R.; Investigation, L.R. All authors have read and agreed to the published version of the manuscript.
Funding
This research received no external funding.
Institutional Review Board Statement
Not applicable.
Informed Consent Statement
Not applicable.
Data Availability Statement
Data has been collected by students at Master Degree programmes at both Constanta Maritime University and Naval Academy on board ships.
Conflicts of Interest
The authors declare no conflict of interest.
Abbreviations
The following abbreviations were used in this article:
| CII | carbon intensity indicator |
| CO2 | carbon dioxide |
| DWT | deadweight |
| GRT | gross registered tonnage |
| HFO | heavy fuel oil |
| IDA | index decomposition analysis |
| IMO | International Maritime Organization |
| LNG | liquefied natural gas |
| LOA | length overall |
| MDO | marine diesel oil |
| MGO | marine gas oil |
| NM | nautical mile |
| SEEMP | ship energy efficiency management plan |
| SOFC | solid oxide fuel cells |
| TEU | twenty-foot equivalent unit |
| VLSFO | very-low-sulphur fuel oil |
References
- United Nations Environment Programme (UNEP). Available online: https://www.unep.org/news-and-stories/story/how-climate-change-making-record-breaking-floods-new-normal (accessed on 15 November 2022).
- Nuchturee, C.; Li, T.; Xia, H. Energy efficiency of integrated electric propulsion for ships–A review. Renew. Sustain. Energy Rev. 2020, 134, 110145. [Google Scholar] [CrossRef]
- DNV. “SEEMP Part III”. Available online: https://www.dnv.com/maritime/insights/topics/seemp-part-iii/index.html (accessed on 10 October 2022).
- MEPC.328(76). Amendments to the Annex of the Protocol of 1997 to Amend the International Convention for the Prevention of Pollution from Ships, 1973, as Modified by the Protocol of 1978 Relating Thereto. 2021 Revisez MARPOL Annex VI. 2021. Available online: https://wwwcdn.imo.org/localresources/en/KnowledgeCentre/IndexofIMOResolutions/MEPCDocuments/MEPC.328(76).pdf (accessed on 8 December 2022).
- MEPC.354(78). Guidelines on the Operational Carbon Intensity Rating of Ships (CII Rating Guidelines, G4). 2022. Available online: https://wwwcdn.imo.org/localresources/en/OurWork/Environment/Documents/Air%20pollution/MEPC.339(76).pdf (accessed on 8 December 2022).
- Sun, W.; Tang, S.; Liu, X.; Zhou, S.; Wei, J. An Improved Ship Weather Routing Framework for CII Reduction Accounting for Wind-Assisted Rotors. J. Mar. Sci. Eng. 2022, 10, 1979. [Google Scholar] [CrossRef]
- Mannarini, G.; Carelli, L.; Viola, F.; Hoxhaj, M.; Scuro, M.; Kyal, S.; Lecci, R.; Coppini, G. The Gutta-Visir System for Operational CO2 Emission Savings from Ferries. In Proceedings of the Scaling Decarbonisation Solutions: Reducing Emissions by 2030, Rotterdam, The Netherlands, 29 November–1 December 2022. [Google Scholar]
- Poulsen, R.T.; Viktorelius, M.; Varvne, H.; Rasmussen, H.B.; von Knorring, H. Energy efficiency in ship operations-exploring voyage decisions and decision-makers. Transp. Res. Part D Transp. Environ. 2022, 102, 103120. [Google Scholar] [CrossRef]
- Sou, W.S.; Goh, T.; Lee, X.N.; Ng, S.H.; Chai, K.H. Reducing the carbon intensity of international shipping–The impact of energy efficiency measures. Energy Policy 2022, 170, 113239. [Google Scholar] [CrossRef]
- Daniel, H.; Trovão, J.P.F.; Williams, D. Shore power as a first step toward shipping decarbonization and related policy impact on a dry bulk cargo carrier. eTransportation 2022, 11, 100150. [Google Scholar] [CrossRef]
- Gianni, M.; Pietra, A.; Coraddu, A.; Taccani, R. Impact of SOFC Power Generation Plant on Carbon Intensity Index (CII) Calculation for Cruise Ships. J. Mar. Sci. Eng. 2022, 10, 1478. [Google Scholar] [CrossRef]
- Law, L.C.; Mastorakos, E.; Evans, S. Estimates of the Decarbonization Potential of Alternative Fuels for Shipping as a Function of Vessel Type, Cargo, and Voyage. Energies 2022, 15, 7468. [Google Scholar] [CrossRef]
- Dewan, M.H.; Godina, R. Effective Training of Seafarers on Energy Efficient Operations of Ships in the Maritime Industry. Procedia Comput. Sci. 2023, 217, 1688–1698. [Google Scholar] [CrossRef]
- Hoffmann, M. The Impact of ‘Fouling Idling’on Ship Performance and Carbon Intensity Indicator (CII). 2022. Available online: https://selektope.com/wp-content/uploads/2022/06/HullPIC-2022_ITech-conference-paper-.pdf (accessed on 4 January 2023).
- Liu, S.; Chen, H.; Shang, B.; Papanikolaou, A. Supporting Predictive Maintenance of a Ship by Analysis of Onboard Measurements. J. Mar. Sci. Eng. 2022, 10, 215. [Google Scholar] [CrossRef]
- Daniel, L.; Adachi, T.; Lee, S. Shipbuilding Market Developments, First Semester 2022: Monitoring Developments in Ship Supply, Demand, Prices and Costs; OECD Science, Technology and Industry Policy Papers 132; OECD Publishing: Paris, France, 2022. [Google Scholar]
- Schroer, M.; Panagakos, G.; Barfod, M.B. An evidence-based assessment of IMO’s short-term measures for decarbonizing container shipping. J. Clean. Prod. 2022, 363, 132441. [Google Scholar] [CrossRef]
- Oldendorff. CII Is Not the Answer, What Do We Do Now? 2022. Available online: https://oldendorff-website-assets.s3.amazonaws.com/assets/downloads/Oldendorff-EMISSIONS.pdf (accessed on 8 January 2023).
- Wang, S.; Psaraftis, H.N.; Qi, J. Paradox of international maritime organization’s carbon intensity indicator. Commun. Transp. Res. 2021, 1, 100005. [Google Scholar] [CrossRef]
- Omboga, H.K. Era of Decarbonization, Energy Efficiency on Existing Ships (EEXI) and Carbon Intensity Indicators (CII) Implication on Charter Parties. Master’s Thesis, World Maritime University, Malmo, Sweden, 2022. [Google Scholar]
- MEPC.338(76). Guidelines on the Operational Carbon Intensity Reduction Factors Relative to Reference Lines (CII Reduction Factors Guidelines, G3). 2021. Available online: https://www.ccs.org.cn/ccswzen/specialDetail?id=202206220276449608 (accessed on 15 December 2022).
- MEPC.353(78). Guidelines on the Reference Lines for Use with Operational Carbon Intensity Indicators (CII Reference Lines Guidelines, G2). 2022. Available online: https://www.liscr.com/2022-guidelines-reference-lines-use-operational-carbon-intensity-indicators-cii-reference-lines (accessed on 5 January 2023).
- MEPC.352(78). Guidelines on Operational Carbon Intensity Indicators and the Calculation Methods (CII Guidelines, G1). 2022. Available online: https://www.ccs.org.cn/ccswzen//articleDetail?id=202212210561846752 (accessed on 12 December 2022).
- Danish Shipping, ‘Calculation Tool for Assessment of Ships’ Energy Consumption and Fuel Gas Emissions, Including CO_2_ (EEDI)’. 2016. Available online: https://www.danishshipping.dk/en/policy/klimapolitik/beregningsvaerktoejer/ (accessed on 10 January 2023).
Disclaimer/Publisher’s Note: The statements, opinions and data contained in all publications are solely those of the individual author(s) and contributor(s) and not of MDPI and/or the editor(s). MDPI and/or the editor(s) disclaim responsibility for any injury to people or property resulting from any ideas, methods, instructions or products referred to in the content. |
© 2023 by the authors. Licensee MDPI, Basel, Switzerland. This article is an open access article distributed under the terms and conditions of the Creative Commons Attribution (CC BY) license (https://creativecommons.org/licenses/by/4.0/).