Article

Enhancing Shoppers’ Experiences and Building Mall Loyalty: The Role of Octomodal Mental Imagery (OMI) and Management Dimension-Evidence from the Yangtze River Delta Region of China

Department of Design, Tongmyong University, Busan 48520, Republic of Korea
*
Author to whom correspondence should be addressed.
Sustainability 2023, 15(14), 11412; https://doi.org/10.3390/su151411412
Submission received: 18 June 2023 / Revised: 9 July 2023 / Accepted: 21 July 2023 / Published: 23 July 2023

Abstract

:
This study investigated the impact of Octomodal Mental Imagery (OMI) and management dimensions on shoppers’ experiences and mall loyalty. The study was collected through “Questionnaire Star,” and 358 valid data points were obtained. The data were analyzed using SPSS27 and AMOS28. The results showed that sensory attributes such as visual, tactile, gustatory, and olfactory attributes positively influenced shoppers’ experiences in OMI, while the auditory attribute had no significant effect. Spatial, a structural attribute of OMI, positively influenced shoppers’ experiences, whereas autonomy and kinesthetics did not have a considerable effect. Tenant mix and entertainment positively impacted shoppers’ experiences in management, while accessibility had no significant effect. The study also found that shoppers’ experiences positively impacted mall loyalty, while hedonistic motivation had a more substantial effect than utilitarian motivation. This study is the first to examine the impact of OMI on shoppers’ experiences. It fills a gap in the literature on this relationship. It also examines the combined impact of management dimensions (accessibility, tenant mix, and entertainment) on the overall shopper’s experience, filling a gap in the Chinese shopping mall literature and extending the generalizability of the theory. The study further explores the relationship between shoppers’ experiences and mall loyalty and the moderating effect of incentive orientation. The results of this study have critical implications for mall managers. Strengthening the mental image and management dimensions of the shopping mall will enhance shoppers’ experiences and build loyalty, allowing brick-and-mortar malls to remain competitive and sustainable in today’s highly competitive and popular e-commerce environment.

1. Introduction

Over the past decade, there has been a marked increase in the closure of shopping malls, leading to discussions of the phenomenon of “dead shopping malls” or declining shopping malls [1]. The rapid increase in distressed shopping malls is becoming a global problem [2,3]. According to Retailnext, since January 2015, the average shopping mall traffic in the United States has decreased by 9.1%. Shopping mall traffic has continued to decline for 42 consecutive months, and there are now 1221 shopping malls in the United States, about one-third of which need to be closed due to over-saturation [4]. In China, the average vacancy rate of shopping malls in 20 first- and second-tier cities nationwide was 9.0% in 2021, also significantly off from 6.1% before the epidemic, according to “2022 China Shopping Mall Annual Development Report” by WINSHANG “http://news.winshang.com/html/070/2339.html (accessed on 8 July 2023)” [5]. This decline is attributed to various factors, among which the rise of online shopping [6,7,8] and increased competition from physical retail [9,10,11] are significant contributors. These result in reduced consumer traffic and increased vacancy rates [8]. However, brick-and-mortar stores are crucial in the customer journey [12]. Shopping malls, in particular, provide a unique and diverse retail environment by combining consumer, social, leisure, and entertainment activities [13,14].
Moreover, in the face of the current shopping mall dilemma, this study attempts to explain from the customer’s point of view what kind of experience shopping malls, that remain competitive, leave behind to build mall loyalty. In order to understand the concept of the “shopper’s experience” and explore its dimensions and underlying causes, this study develops constructs related to shoppers’ experiences. At the same time, we evaluate the impact of shoppers’ experiences on shopping mall loyalty and examine the moderating role of motivational orientation.
Previous research has shown that consumers’ motivations to shop have changed from simply shopping to the need to pursue different experiences [15]. It is becoming increasingly important for shopping malls to provide a holistic and satisfying shopper experience [14,16]. By providing a unique and outstanding shopper experience, shopping malls can differentiate themselves from their competitors, attract new customers, and retain existing ones [17,18,19]. In order to achieve this goal, shopping mall management must focus on improving the shopper’s experience [20]. Research has shown that when customers feel more excellent value in the shopper experience, it leads to higher satisfaction, loyalty, and positive word-of-mouth [21].
Although several antecedents of shoppers’ experiences have been explored in previous studies, this study specifically focused on the combined effects of Octomodal Mental Imagery (OMI) and managerial dimensions (accessibility, tenant mix, and entertainment) on the overall shopper experience [22]. The OMI is a vast imagery scale designed to measure aspects of imagination and outlook. By applying the OMI in different shopping environments, we aim to enhance our understanding of consumer behavior, particularly from the perspective of experiential consumption [22].
In order to gain a more comprehensive understanding of the relationship between the variables, a quantitative research approach was used in this study. To ensure the accuracy and reliability of the findings, the questionnaire method was chosen as the data collection method in this study. The questionnaire method is widely used in studying customer experience and consumer behavior and is considered a valuable tool for data research and evaluation [23]. This method helps to establish a comprehensive research framework and assess the relationship between variables through a quantitative analysis.
This study fills a research gap regarding the impact of OMI on shoppers’ experiences. Furthermore, although previous studies have examined the impact of retail market accessibility, tenant mix, and entertainment facilities on shopper behavior, their focus has been primarily on Bangladesh [20]. By validating the applicability of these results in the context of Chinese shopping malls, this study fills a gap in the literature and extends the generalizability of the theory. Furthermore, there needs to be more understanding of the relationship between shoppers’ experiences, mall loyalty, and the moderating role of motivation orientation. Therefore, this study aims to provide a significant theoretical contribution by exploring the moderating role of consumer motivational orientations (hedonic and utilitarian) on the relationship between shoppers’ experiences and mall loyalty.
Overall, this study contributes to mall management and consumer behavior literature. At the same time, it provides valuable insights and suggests appropriate measures for shopping mall managers. Next, the paper is structured as follows: first, the theoretical background is presented, followed by the hypotheses. It then describes the research methodology, discusses the findings, presents theoretical and managerial implications, and concludes with a summary of the study’s limitations and directions for future research.

2. Literature Review and Hypotheses

2.1. Octomodal Mental Imagery (OMI)

Elder & Krishna have provided a revised definition of mental imagery: “Mental imagery is a prospective, multi-modal sensory and cognitive representation formed from memory that is evoked automatically or deliberately.” Consumer psychology places significant importance on the construct of imagery [24], as it has been shown to elicit emotional and behavioral responses [25]. Mental imagery plays a crucial role in memory and motivation, as it reconstructs past perceptions through imagination and anticipates desired or feared future experiences through prospection [26]. The utilization of mental imagery as a strategy of influence has been widely adopted in the marketing industry for years, with slogans such as Apple’s “Imagine the Possibilities” and Samsung’s “Imagine”, used to evoke consumer imagination, which has had a significant impact on consumer evaluation and behavior [22].
In travel and tourism marketing research, mental imagery has been identified as a critical cognitive process in pre- and post-trip experiences [27]. The role of imagery in travel and tourism marketing has been extensively reviewed by [27]. Imagination directly impacts anticipation and savoring, where consumers can vividly imagine their prior experiences upon returning from a trip, allowing for savoring [28,29]. The tourism literature also supports the significance of imagination in tourism consumption [30].
OMI is considered the most comprehensive imagination scale in the imagination literature, and its adoption can significantly enhance our understanding of consumer behavior, particularly in experiential consumption [22]. The literature has covered hospitality consumption’s multisensory and imaginative aspects [31], making OMI an essential tool for evaluating efforts to improve the sensory and creative dimensions of hospitality and tourism experiences. Furthermore, combining OMI with experience economy models can considerably enhance co-creation measurement across the hospitality, tourism, and entertainment sectors [22].
Imagery plays a crucial role in shoppers’ online or offline experiences. When consumers are presented with a choice between alternatives, they tend to prioritize utilitarian or functional dimensions; however, if they anticipate their experience with the product, they are more likely to engage in mental imagery, with sensory or hedonic dimensions becoming more prominent in the decision-making process [32].
Based on previous correlational research and evidence, there is a solid case to suggest that mental imagery influences shoppers’ experiences and consumer behavior [22]. The OMI scale was established in 2023, and was developed and validated by conducting three rigorous studies and six data collections. The results confirmed that the OMI is a reliable and valid scale for hedonistic consumption. The OMI contains five components of sensory attributes (i.e., visual, tactile, auditory, gustatory, and olfactory) and three members of structural features (i.e., autonomy (control), spatial, and kinesthetic) [22]. Therefore, it is reasonable to assume in this study that:
Hypothesis 1 (H1). 
Visual in mental imagery positively influences shoppers’ experiences.
Hypothesis 2 (H2). 
Tactile in mental imagery positively influences shoppers’ experiences.
Hypothesis 3 (H3). 
Auditory in mental imagery positively influences shoppers’ experiences.
Hypothesis 4 (H4). 
Gustatory in mental imagery positively influences shoppers’ experiences.
Hypothesis 5 (H5). 
Olfactory mental imagery positively influences shoppers’ experiences.
Hypothesis 6 (H6). 
Autonomy in mental imagery positively influences shoppers’ experiences.
Hypothesis 7 (H7). 
Spatial in mental imagery positively influences shoppers’ experiences.
Hypothesis 8 (H8). 
Kinesthetic in mental imagery positively influences shoppers’ experiences.

2.2. Mall Management Dimensions

Mahmud grouped shopping mall management dimensions into three independent variables: accessibility, tenant mix, and entertainment [20]. The literature review of these three independent variables is detailed below.

2.2.1. Accessibility

Accessibility to shopping malls is defined as the excellent location of the shopping mall and the distance customers need to travel to shop there [33]. According to [34], accessibility can be further divided into macro-accessibility and micro-accessibility. Similarly, Anselmsson also categorized accessibility into external and internal dimensions, with external factors related to the broader shopping mall area, such as public transport and parking facilities, while internal factors concern access within the mall [35].
In previous research, Bodkin & Lord identified accessibility as one of the main reasons for prioritizing shopping malls [36], while [37] found that easy access positively influences the choice of a shopping mall. Additionally, perceptions of mall convenience, including convenient location and parking facilities, positively affect shoppers’ satisfaction levels, ultimately influencing their intention to visit and shop there [33,35]. Transportation and location-related factors were also found to significantly impact mall shoppers’ purchase decisions in a study on the determinants of consumer purchasing behavior [38]. As consumers increasingly prioritize multi-purpose visits to shopping malls [39], centers offering shoppers one-stop solutions are more likely to be favored. According to [40], convenient accessibility is crucial for a satisfying shopping experience as the store’s layout influences the time spent there and the desire to return. A study [20] found that entertainment and accessibility significantly affect shoppers’ experiences. Therefore, it can be posited that:
Hypothesis 9 (H9). 
Accessibility exerts a positive impact on shoppers’ experiences.

2.2.2. Tenant Mix

According to [1], the shopping mall is a collection of various retail tenants that offer a wide range of merchandise within their stores [41]. A strong, desirable, and stable tenant mix is crucial to the success of a shopping mall, as found by [42]. The tenant mix helps define the mall’s brand and impacts customer satisfaction [43]. A shopping mall’s appropriate mix of tenants is widely recognized as a crucial success factor. Including various stores in one location can attract shoppers with different objectives to visit the mall [41] as they can find a diverse range of desired products or services in one building. As asserted by [44], selecting stores and an optimal retail mix plays a vital role in ensuring that patronage is influenced by a compelling image.
There is now past literature that has confirmed that the tenant mix positively affects shoppers’ experiences. However, [20], a recent study shows that the effect of the tenant mix on shoppers’ experiences is not statistically significant in the context of the retail market in Bangladesh. However, in the context of shopping malls in China, this study can still hypothesize that:
Hypothesis 10 (H10). 
Tenant mix is positively related to shoppers’ experiences.

2.2.3. Entertainment

Shopping malls are typically characterized by a large enclosed area designated for a mix of retail stores, restaurants, hospitality, and entertainment facilities [45]. According to [46], malls are perceived as a destination for shopping and other activities, such as entertainment.
In examining shoppers’ mall experiences, Csaba & Askegaard found that an entertainment-driven experience increased the likelihood of store patronage [47]. Additionally, Nicholls revealed that today’s mall patrons are more leisure and entertainment-driven [48]. Entertainment is a component in attracting crowds to shopping malls as it induces fun and exciting experiences among shoppers and has been proven to positively impact mall patronage’s intention, performance, and competitive position [1,49,50]. Shopping is no longer just a functional utility but also provides hedonistic values and fulfilling experiences for consumers [51], and shopping malls serve as venues for entertainment activities [46] and social meetings when shoppers do not plan to shop [52]. Therefore, instead of fulfilling utilitarian purposes, shopping also serves as a means for shoppers to socialize [52].
The entertainment factor of hedonic shopping is considered the most important competitive tool for a shopping mall since it influences shoppers’ decisions on which mall to visit and shop at [53]. Adequate entertainment facilities enhance leisure and hedonic experiences [1]. It encourages social interaction as shoppers can meet at the mall to socialize, enjoy entertainment services, or engage in other activities such as having dinner or watching a movie [52]. A study [20] also showed that entertainment and accessibility wield significant influence on shoppers’ experiences. Therefore, it can be hypothesized that:
Hypothesis 11 (H11). 
Entertainment has a positive impact on shoppers’ experiences.

2.3. Shoppers’ Experience

According to research by [54], the in-store shopper experience for retail shoppers includes their internal responses to service stimuli (cognitive, affective, and physical) and their social interactions with other actors during the service encounter. A study [55] has concluded that a shopper’s experience is a multifaceted construct that focuses on their cognitive, emotional, behavioral, sensory, and social responses to a firm’s offerings throughout their purchase journey. Another study [56] found that when explaining a shopper’s value judgement of a retail store, the perceived shopper’s experience was considered more essential than their views on the price and quality of merchandise. Some scholars, such as [49,57], have argued that creating satisfying experiences is critical for enhancing the competitive advantage of shopping malls. One study [58] also noted that retailing had shifted its focus from transactions to creating unique shopper experiences, which [59] predicted would become a significant factor in developing marketing strategies and a modern source of creating value for firms.
Extensive research has emphasized the importance of shoppers’ experiences, and according to [60], holistically developed shoppers’ experiences to aid retail organizations in creating value for customers more effectively than meticulously defined relationships. A study [61] argues that an enjoyable shopper’s experience based on aesthetic appeal can enhance a retailer’s potential revenue by encouraging customers to spend more time in the store. At the same time, [62] suggests that meticulously crafted experiences can boost customer loyalty by improving the practical design of products and services and facilitate consistent, passionate, and passionate gazing cognitive situations. One study [63] has shown that positive shopper experience ratings significantly impact loyalty and actual consumption. Therefore, it can be concluded that:
Hypothesis 12 (H12). 
Shoppers’ experiences have a positive impact on mall loyalty.

2.4. Mall Loyalty

According to [64], mall loyalty is a deep commitment to a specific brand or retailer. Positive emotions, such as pleasure and arousal, resulting from positive shoppers’ experiences [65] can foster customer loyalty [66] and repurchase intention [67].
For executives in this competitive industry, maintaining current shoppers or attracting new ones is one of their primary goals [68,69]. In a competitive environment, loyal customers are essential for maintaining market shares [70]. As a result, the issue of shopping mall loyalty has received increasing attention from researchers and managers. They believe that by fostering loyalty among shoppers, they will visit the shopping malls more frequently and spend more money, which could lead to higher rents from shopkeepers [71]. The strategic objective of developing greater shopper loyalty is a topic of significant interest to both researchers and managers [52,72].

2.5. Motivation Orientation

The existing literature suggests that two fundamental motivational orientations underlie different customer motives: hedonic and utilitarian [73]. Consumers approach product/service search, consumption, and evaluation differently based on whether they are motivated primarily by efficiency or necessity (utilitarian) or enjoyment and fun (hedonic) [73].
While both hedonic and utilitarian factors influence satisfaction with the retailer and re-patronage, [74] suggest that hedonic aspects of shopping significantly impact these outcomes. Specifically, hedonic shopping value—representing the emotional worth of the shopper’s experience—has a more substantial influence on positive word of mouth, an indicator of loyalty [75], than utilitarian shopping value. Since pleasure and arousal are more closely associated with hedonic than utilitarian shopping value [73], Stein & Ramaseshan concluded that positive evaluations of overall shoppers’ experiences strongly affect loyalty intentions and actual consumption [63]. These effects are particularly pronounced among consumers who have a hedonistic motivational orientation.
Given this, it is reasonable to assume that positive shoppers’ experiences will have a more substantial effect on loyalty among those with a hedonic compared to utilitarian motivational orientation. As such, it can be hypothesized that:
Hypothesis 13 (H13). 
Shoppers’ experiences have a stronger effect on loyalty for hedonic than utilitarian motivational orientation.

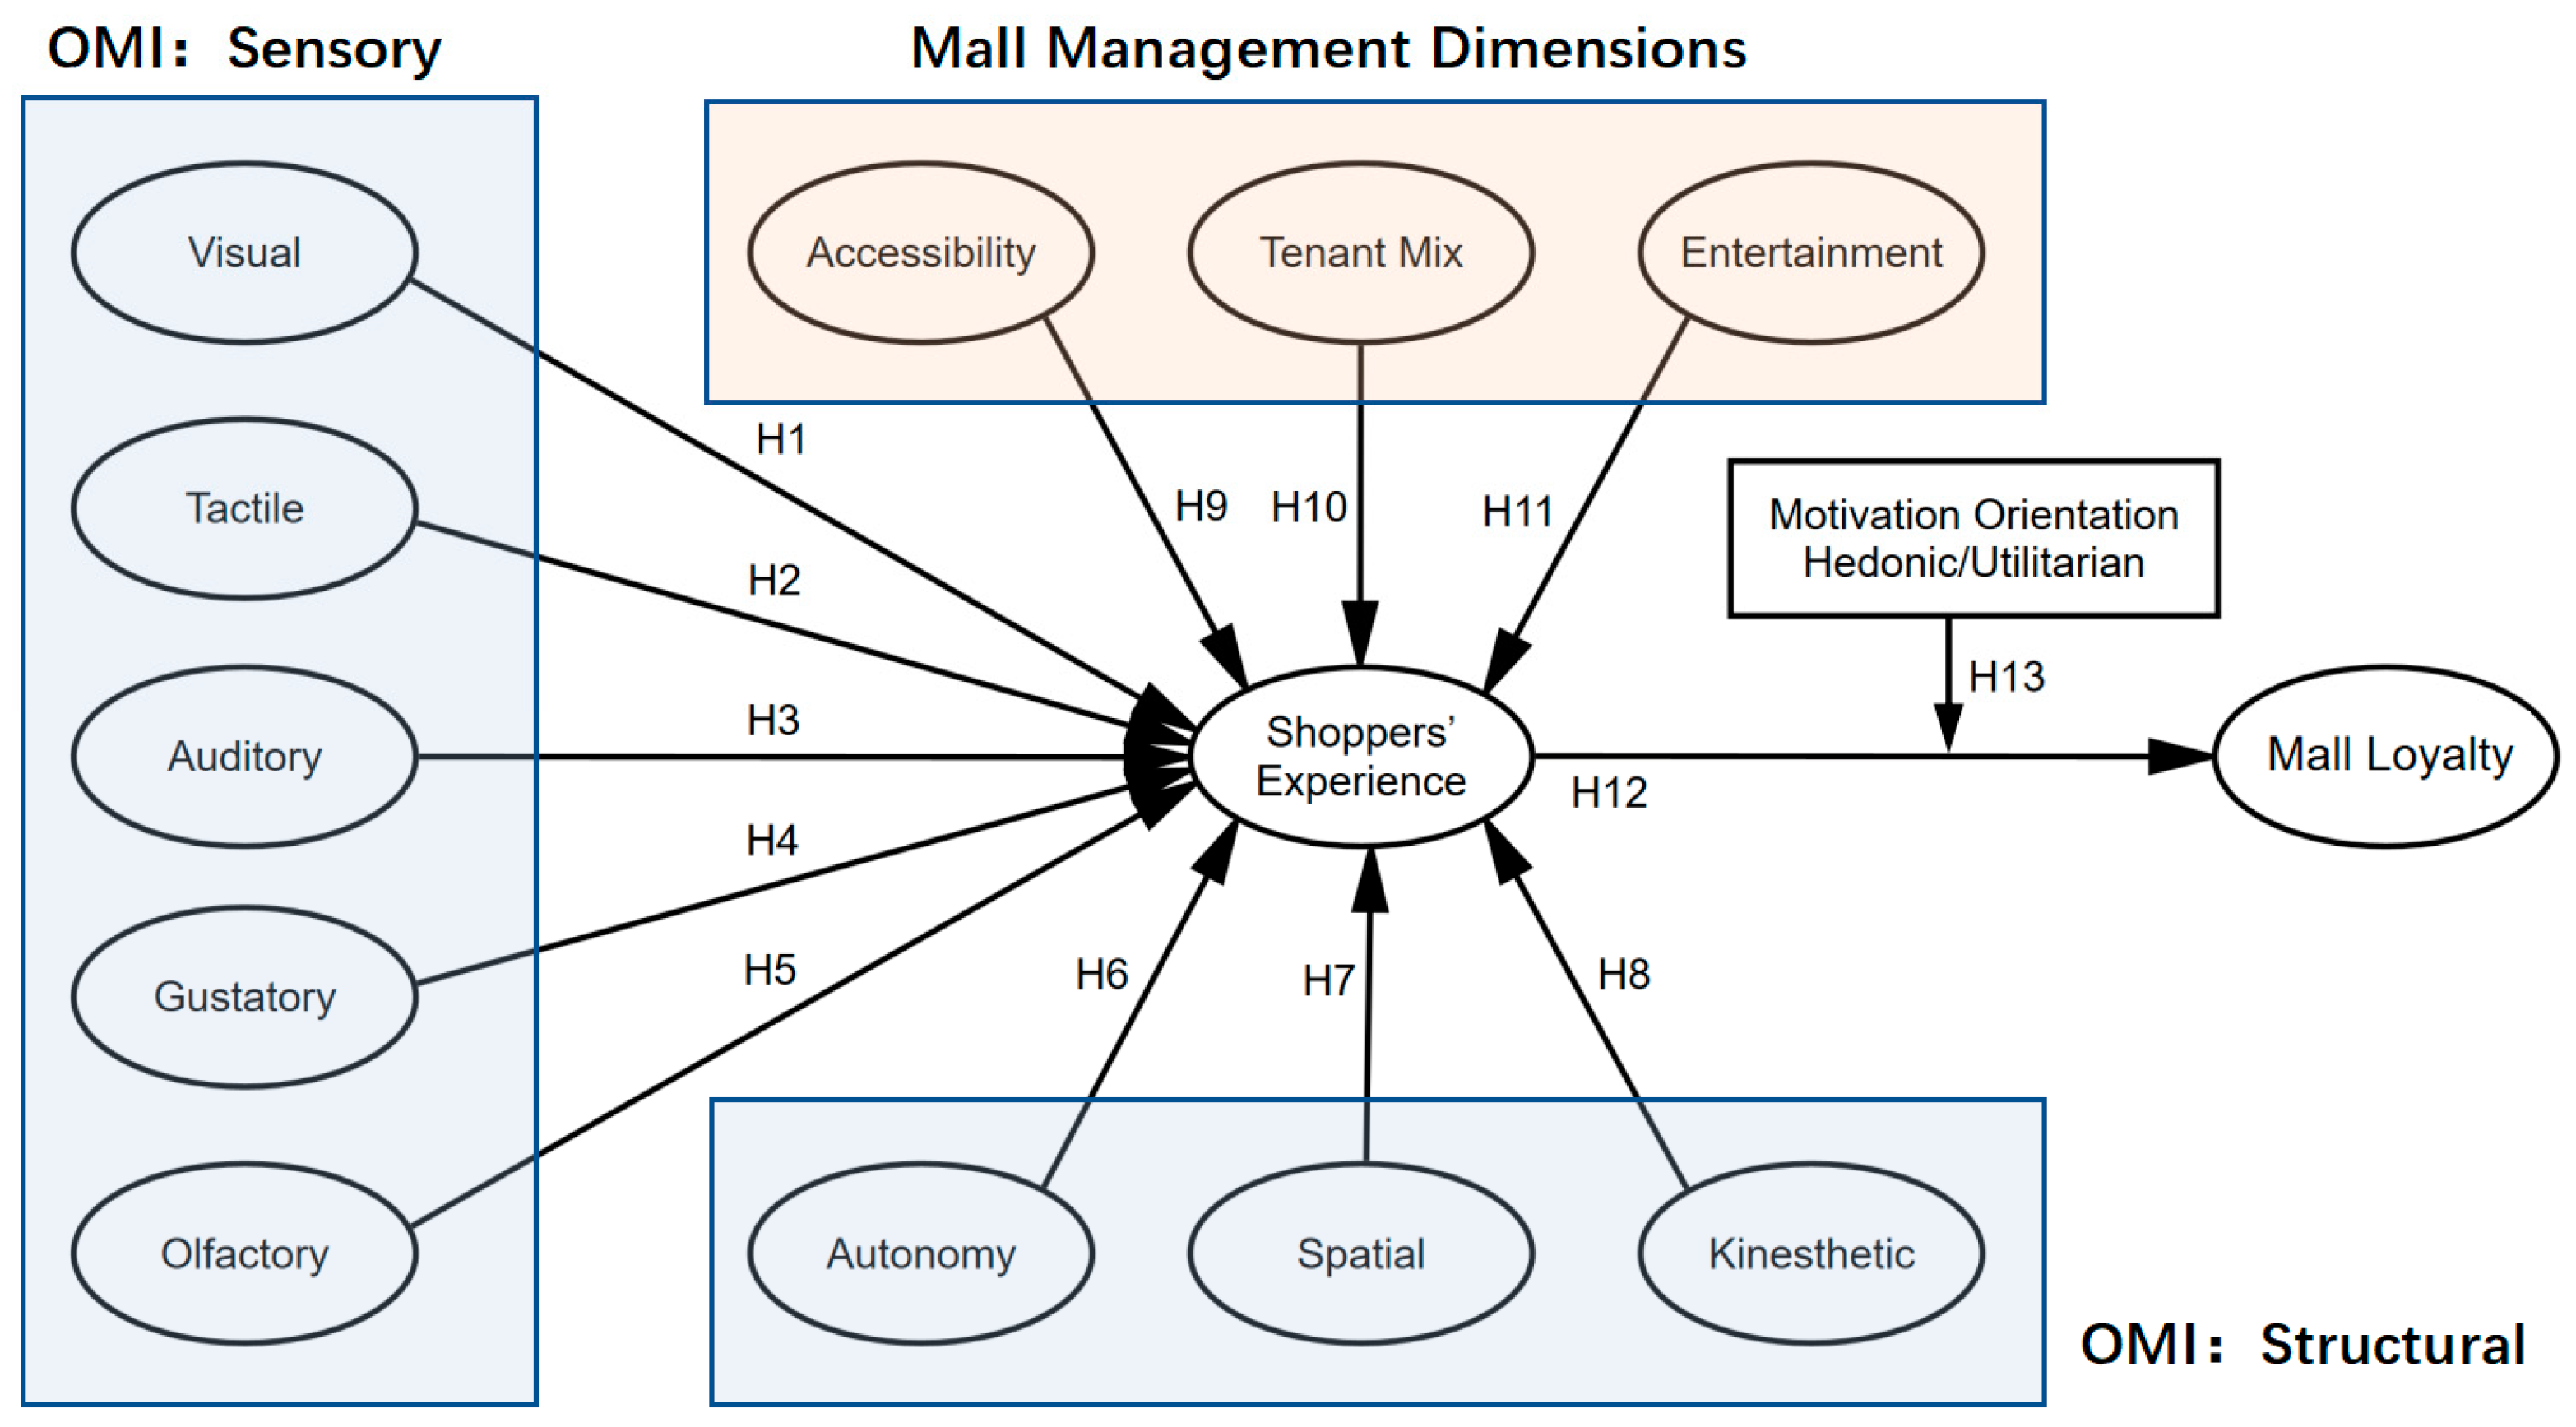
2.6. Theoretical Model

The theoretical framework of this study is illustrated in Figure 1.

3. Materials and Methods

3.1. Development of Research Instruments

This study utilized close-ended questionnaires as the primary research instrument, with items measuring independent and dependent variables adapted from previous studies. Respondents were asked to rate their level of agreement or disagreement with each statement on a seven-point Likert scale [76], where a score of 7 indicated strong agreement, and 1 indicated strong disagreement. In addition to assessing independent and dependent variables, the questionnaire included questions related to respondents’ demographic characteristics and shopping motivations.
The 44 items measured in the questionnaire were identified for this study. Among them, the five components of sensory attributes (i.e., visual, auditory, tactile, gustatory, and olfactory) and the three components of structural features (i.e., autonomy (control), spatial, and kinesthetic) of the independent variable OMI were measured by variables adapted from [22]. The three independent variables of the management dimension are accessibility, tenant mix, and entertainment. Their measurement scales were adapted from [34,77], respectively. The scale measuring shoppers’ experiences was taken from [78]. The scale for the dependent variable, shopping mall loyalty, was taken from [79].
The operationalization of all measures and items used in this study and their adapted sources are shown in Table 1.
Furthermore, ref. [63,80] measured the moderating variable-motivational orientation. In the questionnaire, consumers were asked to indicate their primary motivation for frequenting the shopping mall by selecting answers to the following questions: purchase specific items, make a transaction, search for information, seek help, browse, socialize, and shop for fun. Statements indicating a desire to purchase specific items, make a transaction, search for information, or seek help were considered to have a utilitarian motivational orientation, while those indicating browse, socialize, and shop for fun were considered hedonistic motivations.

3.2. Sampling and Data Collection

The questionnaire for this study was distributed using the Questionnaire Star..The survey was mainly distributed through social media link sharing (e.g., WeChat, QQ.). In addition, we contacted the commercial managers of the four malls. We provided links to the questionnaires on their WeChat public numbers and offered discount coupons from the malls as rewards. People interested in the survey then completed the questionnaire on the “Questionnaire Star” platform. In order to ensure the credibility of the questionnaire results, Questionnaire Star provided various verification mechanisms, such as IP address restrictions, duplicate submission restrictions, etc., to prevent malicious filling and duplicate data from affecting the results. Questionnaire Star has been widely used in many studies as a reliable online survey tool because of its flexibility in question design, efficiency in data collection, ease of data processing, and credibility verification.
Because of the psychological terminology involved in the questionnaire, a pretest was administered to assess and improve comprehensibility before the formal full distribution of the study questionnaire. Forty-eight subjects were invited to participate in the pretest, and these subjects were considered to be generally representative. After the subjects completed the questionnaire, a telephone consultation was conducted with the requested subjects to check the wording of the items and the comprehensibility of the questionnaire [81]. The predicted result was that the original questionnaire “In my mental image ......” was changed to “In my mind ....” and so on, using more general wording. Some changes were also made to the order of the questions.
The questionnaire was released on 15 March 2023, and 492 questionnaires were received by 30 May 2023. In order to increase the credibility of the data, the questionnaire was supplemented with an interference item: “Please select the first option of this question (very satisfied).” The setting of interfering items was considered a “control question.” These additional questions are not related to the survey questions and are used to check the respondents’ level of attention to the questions and the possibility of incorrect answers [82]. Based on the [82] study, it was assumed that those who did not select this item did not scrutinize the question. This section excluded 134 data. Therefore, the number of valid questionnaires was 358. The validity rate was 72.8%. The data sample size met the requirements of [83,84] for sample size.

3.3. Research Application Used

This study utilized version 27.0 of SPSS (Statistical Package for the Social Sciences) for data input and statistical analyses. Using this software, a descriptive analysis was conducted on demographic variables and a reliability analysis on factors. Furthermore, hierarchical moderated regression was performed to explore the moderating effect of motivational orientation (utilitarian/hedonic) on the relationship between shoppers’ experiences and mall loyalty.
Structural equation modeling (SEM) was employed using AMOS version 28.0 to test the hypotheses developed in this study. SEM was used to examine relationships between constructs under investigation empirically. As defined by [85], SEM evaluates the degree to which a proposed conceptual model that includes observed multiple indicators and hypothetical constructs explains or fits collected data.
A two-step approach consisting of an initial measurement model and a subsequent structural model was employed in this study. A confirmatory factor analysis (CFA) was used to validate the measurement model, with Cronbach’s alpha utilized to verify the reliability of the measurement items. Following the validation of the convergent and discriminant validity of the measurement model, the structural model was examined to test hypothesized relationships. The SEM’s structural portion allows for testing multiple equations with multiple dependent variables, provides parameter values (i.e., path coefficients) for each research hypothesis, and determines their significance.

4. Results

4.1. Descriptive Statistics

The demographic profile of the sample studied is portrayed in Table 2.
From the above table, we can see that 52.21% of the sample is “Female” in terms of Gender, and 47.49% is Male. In terms of Age, the percentage of “18–25 years old” is 37.99%. Regarding Marital status, 53.91% of the sample chose “Singleton,” and 46.09% were Married. The percentage of “Undergraduate” is 70.11%. Regarding the Average monthly income level (including bonuses, benefits, and other forms of income), 44.69% of the sample was “5000 and below”.
In shopping malls, there is a common gathering place for all, whether low-income, middle-income, or upper-class. Shopping malls provide all people (both low- and middle-income) opportunities to spend money [86]. This idea is supported by [87] Bourdieu’s (1984) book “Distinction.” Moreover, according to [88] Berg’s (2005) theory of imitative consumption regarding Thorstein Veblen, members of the lower social classes also imitate the lifestyles and practices of the upper classes. Therefore, it is reasonable to assume that the subjects of the questionnaire are a suitable population for the study.

4.2. Reliability Analysis

From Table 3, the Cronbach’s Alpha results for each dimension, the Cronbach’s Alpha values corresponding to the 13 dimensions designed in this paper were 0.831, 0.819, 0.818, 0.843, 0.846, 0.841, 0.833, 0.858, 0.882, 0.835, 0.851, 0.9, and 0.821, all greater than 0.7, indicating that the internal consistency of the questionnaire dimensions is good [89], so the data collected in this survey passed the test of reliability.

4.3. Normality Testing

According to [90], it is required that each of the individual variables be normally distributed. Skewness and kurtosis values greater than 3.0 and 10.0 would indicate the contravention of multivariate normality. Accordingly, all items were tested for normality, and as can be seen in Table 4, first of all, in terms of means, the overall level of means for each measure was moderate between 4.324 and 4.813. The relatively low standard deviation indicates that the article variables are less discrete. At the same time, the absolute pair of skewness for the vast majority of variables is less than 3, and the total value of kurtosis is less than 10, indicating that the data satisfy the normal distribution and the data can be used effectively for the subsequent analysis.

4.4. Common Method Bias Test

Common method bias can be tested using the Harman single factor test; that is, all indicators are placed under one factor for factor analysis, and if the variance explained by that factor is less than 40%, the study data are considered not to have serious common method bias. Conversely, common method bias is considered to exist.
According to Table 5, the variance explained by the first common factor in this paper was 30.717%. The Harman one-way test concluded that there was no serious common method bias if the variance explained by the first common factor was less than 40%, so there was no serious common method bias in this paper.

4.5. Confirmatory Factor Analysis

4.5.1. Convergent Validity

As can be seen from Table 6, the factor loading coefficients for all 13 factors are more significant than 0.6, all of the corresponding AVE values are greater than 0.5, and all of the CR values are higher than 0.7, implying that the data from this analysis have good convergent validity.

4.5.2. Discriminant Validity

The diagonal line in Table 7 is the AVE square root value, and the rest are the correlation coefficients. For Visual, the AVE square root value is 0.798, more significant than the maximum value of the absolute value of the correlation coefficient between the factors, 0.490, implying that it has good discriminant validity. Similarly, the discriminant validity of the other factors is good, which means that the scale of this analysis has good discriminant validity.

4.5.3. Model Fit

According to Table 8, most of the model fitness indicators, such as CMIN/DF, GFI, AGFI, RMSEA, NFI, IFI, TFI, CLI, PNFI, and PCFI, meet the criteria in the validated factor analysis models of this study, so the model fitness is good.

4.5.4. Pearson Correlation

From Table 9, the correlation analysis was first used to examine the relationships between visual, auditory, tactile, gustatory, olfactory, spatial, autonomy, kinesthetic, accessibility, Tenant Mix, entertainment, and shoppers’ experiences, respectively. Pearson correlation coefficients were used to indicate the strength of correlations between visual, auditory, tactile, gustatory, olfactory, spatial, autonomy, kinesthetic, accessibility, Tenant Mix, entertainment, and shoppers’ experiences, and the results showed that all 11 items showed significant correlations with shoppers’ experiences, with correlation coefficient values greater than 0.
Secondly, the correlation analysis was used to investigate the correlation between shoppers’ experiences and mall loyalty. The correlation coefficient value between shoppers’ experiences and mall loyalty was 0.462, which means shoppers’ experiences and mall loyalty have a positive correlation.

4.6. Structural Equation Modelling

In this study, a causal model was developed to assess its structural links, as shown in Figure 2. The data collected from the questionnaire were imported into AMOS28, and the fitted parameters of the model obtained by applying the excellent likelihood method are shown in Table 10. As can be seen from the table, the displayed values of most of the fitted parameters meet the standard requirements. However, GFI, AGFI, and NFI do not meet the judging criteria, so the model needs to be revised by increasing the two–two correlations between the independent variables, whereby the model fit is enhanced, and the revised model fit is shown in Table 11. As can be seen from the table, the displayed values of most of the fitted parameters meet the standard requirements, indicating that the model fits very well. Hence, the structural equation model has an excellent fitting effect for the sample data obtained from the questionnaire.
From the path coefficient plot in Table 12, the seven paths “Visual, Tactile, Gustatory, Olfactory, Spatial, Tenant Mix, Entertainment→shoppers’ experiences” all have positive values, and all reach the significance level (p < 0.05). They indicated that these paths had a significant positive impact. The four paths “Auditory, Autonomy, Kinesthetic, Accessibility→shoppers’ experiences” did not reach the significance level (p > 0.05), indicating that these paths did not have a significant effect. For the path “shoppers’ experiences→Mall loyalty,” the standard path coefficient was 0.549 and reached the significance level (p < 0.05), indicating that this path had a significant positive effect.

4.7. Moderating Role 0f Motivation Orientation

As can be seen from Table 13, the moderating effect is divided into three models, with Model 1 including the independent variable (Shoppers’ experiences). Model 2 adds the moderating variable (Motivational orientation) to Model 1, and Model 3 adds the interaction term (the product of the dependent and moderating variables) to Model 2.
The purpose of Model 1 is to investigate the effect of the independent variable (Shoppers’ experiences) on the dependent variable (Mall loyalty) without the interference of the moderating variable (Motivational orientation). As can be seen from the table above, the independent variable (shoppers’ experiences) shows significance (t = 9.820, p = 0.000 < 0.05), implying that the shopper’s experience has a significant effect on its relationship to mall loyalty. The interaction term between shoppers’ experiences and the interaction term of Motivational orientation showed significance (t = 6.711, p = 0.000 < 0.05), implying that shoppers’ experiences have a significant impact on mall loyalty when the moderating variable (Motivational orientation) is at different levels of the magnitude of the effect being significantly different. Figure 3 shows that the positive impact of Shoppers’ experiences on Loyalty Intention is much more substantial for consumers with a hedonistic motivational orientation.

5. Discussion

The retail industry has undergone a significant transformation in recent years. What was once a mere transactional process has now moved towards creating customer experiences. According to [91], shoppers no longer view malls as places to purchase goods but as destinations where they can have fun and fulfill their desire for positive experiences. As a result, shoppers now place more excellent value on the overall experience they receive at these locations than on the products they buy [92]. This shift in consumer behavior has prompted retailers to pay closer attention to their customers’ emotions, personalities, and motivations when studying shopping behavior and mall patronage [93]. The traditional retail model has evolved from one centered around utilitarian consumption to one that fosters a holistic perspective. While the idea of an ‘experience’ may be subjective, retailers need to develop a rational framework to address the changing needs of their customers.
Therefore, it is paramount for owners and mall management to consider the variables that contribute to the overall shopping experience by developing a more comprehensive approach to customer experiences. This will ensure that they meet the evolving needs of their customers by providing them with a holistic and enjoyable shopping experience.
The results of testing the hypotheses of this study are reported in Table 14.
The results show that, except for auditory, the sensory attributes of Octomodal Mental Imagery (OMI) all positively influence the shopper’s experience. Growing evidence shows modern consumers are involved in sensory marketing and the experience economy. Visual, auditory, olfactory, tactile, and gustatory atmospheres strongly influence shoppers’ perceptions and behaviors [94]. One study [95] argues that consumers experience brands, products, and service landscapes through sight, sound, smell, touch, and taste, highlighting the importance of sensory cues and stimuli. The influence of retail ambiance as an environmental stimulus and sensory cues on shopper behavior is evident [96].
Although previous research has demonstrated that all five senses strongly influence shopping behavior, this thesis empirically demonstrates that the auditory aspect of mental imagery is not significant for shoppers’ experiences. This is an exciting finding, which may be due to several reasons:
  • Previous studies have focused on the sensory experience of the shopping process. In contrast, the present study’s OMI emphasizes the consumer’s reliance on imagining tasting previous experiences after returning from shopping [28,29], evaluating the reconstruction of shopping experiences that occurred in the past (imagination) and expectations of future experiences [26]. This may be an important reason for the insignificance of the auditory-to-shopping experience in OMI.
  • Interference of multisensory stimuli: In the shopping environment, in addition to auditory stimuli, there are multiple sensory stimuli, such as visual, tactile, and olfactory stimuli. These stimuli may compete, leading to distraction, reduced attention to, and reduced memory of auditory stimuli. Therefore, the memory effect of auditory stimuli may need improvement.
  • Psychological adaptation effect: Shoppers may gradually adapt to the sounds in the shopping environment, seeing them as the norm and no longer making them an essential part of the shopper’s experience. This psychological adaptation effect may decrease shoppers’ perceptions of auditory influence, thus making the relationship between auditory and shoppers’ experiences insignificant.
  • The effect of information overload: Shopping malls are often filled with various sound sources, such as music, advertisements, and shouts from salespeople. This large number of sound stimuli may lead to a perceptual information overload for shoppers, making it difficult for them to associate specific sounds with the shopper experience. Thus, despite its presence in the shopping environment, auditory perception does not significantly impact shoppers’ subjective perceptions.
  • The frequent use of headphones (listening to music to make phone porridge) by young people while shopping may also contribute to the insignificance of auditory to shoppers’ experiences in OMI.
Only spatial among the three components of the structural attribute of OMI positively affected shoppers’ experiences. Additional Autonomy and Kinesthetic do not significantly impact shoppers’ experiences. The OMI is the most recently proposed scale, and there may be issues of non-applicability and validity in different domains [22]. They also mentioned in their article that “the current study cannot conclude the validity and reliability of the kinesthetic constructs. Therefore, future studies and CMB analyses should examine this construct in further detail to decide whether to include it in the scale.” Another part of the construct has a “not applicable” problem in the application domain. This indicates the absence of the item in the mental imagery [22].
Accessibility in the management dimension is not significant for shoppers’ experiences, and an appropriate tenant mix and entertainment positively influence shoppers’ experiences. Previous studies [14,20,34] have also found that entertainment experiences are essential in shaping optimistic shoppers’ experiences [97]. Apart from atmospherics and entertainment potential, proper tenant management attracts shoppers to malls. Hence, a mall needs to establish an appropriate tenant variety as it deals with the core benefit regarding the shoppers’ experiences [35], which could generate more patronage for the mall [1,43].
Although several previous studies [20,98,99] confirm that accessibility has a positive impact on the shoppers’ experiences, the study by [1] found that the convenience variable was not significant in terms of shoppers’ willingness to patronize, as today’s shopping malls are proliferating, all extremely accessible outside, all offer ample parking facilities inside, and essentially complete in terms of brands. Consumers also have many choices. This competition may have reduced the impact of accessibility on shoppers’ experiences. When consumers can easily access other shopping venues, accessibility may no longer be a significant factor in determining the shopper’s experience.
This study found that shoppers’ experiences positively influence mall loyalty, where motivational orientation moderates the relationship; it is more vital for consumers with hedonistic motivational orientation than those with utilitarian motivational orientation. A study [63] found that favorable shopper experience evaluations significantly positively influence loyalty intentions. This shows that positive consumer appraisal could result in positive consumption-related behaviors such as repurchase intentions [100]. It [63] also found that the positive impact of shoppers’ experiences on loyalty intentions is much more substantial for consumers with a hedonistic motivational orientation.

6. Conclusions & Limitation

6.1. Theoretical Contributions

The present study contributes to the existing literature in several ways:
First, this study validates for the first time the effect of the Octomodal Mental Imagery (OMI) scale on shoppers’ experiences, and the results show that all of the sensory attributes in the OMI, except for auditory, positively influence shoppers’ experiences. In particular, sensory attributes such as visual, tactile, gustatory, and olfactory play an essential role in the shopper’s experience. In contrast, structural attributes, except for spatial, affected shoppers’ experiences, while the other two (autonomy and kinesthetic) did not have significant effects. As a result of this study, we have filled the theoretical gap between the OMI scale and shoppers’ experiences and validated the application of the scale to shoppers’ experiences. We also expand the theoretical framework of shoppers’ experiences and deepen the understanding of the influence of shopper mental imagery on shoppers’ experiences. This finding provides important theoretical implications and practical value to studying shoppers’ experiences and consumer behavior. It gives us preliminary insight into the potential application of the OMI scale developed by Khalilzadeh et al. in 2023 to consumer behavior in shopping malls. This study uniquely contributes to theoretical extensions and new ways of thinking about the shopper’s experience.
Second, this experimental study makes a further corrective contribution to previous research. The findings show that tenant mix and entertainment significantly impact shoppers’ experiences, directly affecting mall loyalty. At the same time, we observed a diminishing effect of accessibility on shoppers’ experiences. Again, this study provides empirical support for previous research demonstrating that shoppers’ experiences positively impact mall loyalty and that motivational orientation plays an important moderating role in this relationship.
This study is innovative in exploring the impact of the tenant mix, entertainment, and accessibility on shoppers’ experiences. At the same time, we reveal an essential link between shoppers’ experiences and mall loyalty. We broaden our understanding of shoppers’ experiences and consumer behavior by providing new empirical evidence and results. These findings provide new directions and insights for further research on the relationship between shoppers’ experiences and consumer behavior. They also provide managers with targeted guidance to help them better understand and guide consumer behavior.
In summary, this study broadens the understanding of the relationship between shoppers’ experiences and consumer behavior by providing a new theoretical perspective and research methodology. Also, our study provides new directions and insights for future in-depth exploration of the relationship between shoppers’ experiences and consumer behavior.

6.2. Practical Significance

This study has important practical implications and provides valuable guidance and insights for shopping mall managers and marketers. First, our findings suggest that some dimensions of OMI, tenant mix, and entertainment play a crucial role in shoppers’ experiences and mall loyalty. To attract more customers and build mall loyalty, it is critical to enhance the value of the experience offered to customers [101]. Managers can use the results of this study to improve the design and operation of shopping malls to enhance the shopper experience of their customers. In particular, in terms of mental imagery, the significant impact of marketing and service performance efforts can be tracked in more detail by creating pleasant and unique sensory experiences (especially the visual, auditory, olfactory, tactile, and gustatory dimensions) and optimizing spatial experiences (well-designed shopping spaces) [22]. In addition, managers should focus on a rational tenant mix to ensure a diverse and complementary store assortment that meets the needs and preferences of different customers, and provides a diverse range of entertainment facilities (enhancing the entertainment experience). These measures will enable shopping malls to attract more customers and enhance their loyalty, improve the competitiveness of shopping malls, and maintain sustainable development.
Second, the findings also reveal the moderating effect of motivational orientation on the relationship between shoppers’ experiences and mall loyalty. This provides valuable guidance for marketers to develop personalized marketing strategies based on customers’ motivations to enhance mall loyalty. Especially for hedonistic customers, customized marketing strategies and shoppers’ experiences can better satisfy their quest for fun and pleasure, thus enhancing their loyalty. By gaining a deeper understanding of customer motivation and targeting their needs, marketers can more effectively cultivate and maintain loyal customers and improve shopping malls’ performances and competitive advantages.

6.3. Limitations and Future Research Directions

As with all research, there are still some limitations to this study.
First, this study only included data from the Yangtze River Delta region of China, so the generalization of the findings may be limited. Future studies may consider expanding the sample to cover shopping malls in different countries and regions to enhance the validity of the findings.
Second, this study used a self-report survey method, which was influenced by subjective feelings and recall bias of the subjects. Future studies could biologically validate the OMI scale. For example, functional magnetic resonance imaging (fMRI) and electroencephalography (EEG) methods could be used to measure blood oxygen levels and electrical signal recordings to improve the validity of the study in a biological sense.
Furthermore, with the rise of online shopping, the sensory experience of physical shopping has been replaced by online shopping, and how mental imagery enhances shoppers’ experiences remains a crucial question. Past research has shown that expectations of experiences are more optimistic than expectations of physical purchases [102]. Future research should determine which aspects of shoppers’ experiences rely on mental imagery.

Author Contributions

Conceptualization, Z.Z. and W.C.; methodology, Z.Z. and W.C.; software, Z.Z.; validation, Z.Z.; formal analysis, Z.Z. All authors have read and agreed to the published version of the manuscript.

Funding

This research received no external funding.

Institutional Review Board Statement

Not applicable.

Informed Consent Statement

Not applicable.

Data Availability Statement

Not applicable.

Conflicts of Interest

The authors declare no conflict of interest.

References

  1. Calvo-Porral, C.; Lévy-Mangín, J.-P. Pull Factors of the Shopping Malls: An Empirical Study. Int. J. Retail Distrib. Manag. 2018, 46, 110–124. [Google Scholar] [CrossRef]
  2. Guimarães, P.P.C. Shopping Centres in Decline: Analysis of Demalling in Lisbon. Cities 2019, 87, 21–29. [Google Scholar] [CrossRef]
  3. Mason, R.B.; Dobbelstein, T.; Corbishley, K.M. A Comparative Investigation into the Changing Use of Shopping Malls in Germany and South Africa. J. Bus. Retail Manag. Res. 2019, 13, 61–78. [Google Scholar] [CrossRef]
  4. A Brief History of the “Decline” of Shopping Centers. Available online: http://cj.sina.com.cn/article/detail/2398774943/476417 (accessed on 8 July 2023).
  5. The 140,000-Word, 222-Page “2022 China Shopping Center Annual Development Report” Is Here! Available online: http://news.winshang.com/html/070/2339.html (accessed on 8 July 2023).
  6. Rigby, D. The Future of Shopping. Harv. Bus. Rev. 2011, 89, 65–76. [Google Scholar]
  7. Yan, X. Impact of Online Shopping on Shopping Malls. Appl. Econ. Theses 2018, 29. Available online: https://digitalcommons.buffalostate.edu/economics_theses/29 (accessed on 8 July 2023).
  8. Helm, S.; Kim, S.H.; Van Riper, S. Navigating the ‘Retail Apocalypse’: A Framework of Consumer Evaluations of the New Retail Landscape. J. Retail. Consum. Serv. 2020, 54, 101683. [Google Scholar] [CrossRef]
  9. Moore, R. The Death of the American Mall and the Rebirth of Public Space. In Proceedings of the International, Seattle, WA, USA, 8–11 August 2013. [Google Scholar]
  10. Resnick, M.L. The Shopping Mall of the Customer Experience Future. In Proceedings of the Human Factors and Ergonomics Society Annual Meeting, SAGE Publications Sage CA, Los Angeles, CA, USA, 26–30 October 2015; Volume 59, pp. 1127–1131. [Google Scholar]
  11. Smith, B. The Transition of Shopping Mall Development. 2015. Available online: https://repository.tcu.edu/handle/116099117/10443 (accessed on 8 July 2023).
  12. Babin, B.J.; Feng, C.; Borges, A. As the Wheel Turns toward the Future of Retailing. J. Mark. Theory Pract. 2021, 29, 78–91. [Google Scholar] [CrossRef]
  13. Gomes, R.M.; Paula, F. Shopping Mall Image: Systematic Review of 40 Years of Research. Int. Rev. Retail Distrib. Consum. Res. 2017, 27, 1–27. [Google Scholar] [CrossRef]
  14. Elmashhara, M.G.; Soares, A.M. Entertain Me, I’ll Stay Longer! The Influence of Types of Entertainment on Mall Shoppers’ Emotions and Behavior. J. Consum. Mark. 2019, 37, 87–98. [Google Scholar] [CrossRef]
  15. Sanburn, J. The Death and Life of the Shopping Mall. Time 2017, 190, 40–45. [Google Scholar]
  16. Haytko, D.L.; Baker, J. It’s All at the Mall: Exploring Adolescent Girls’ Experiences. J. Retail. 2004, 80, 67–83. [Google Scholar] [CrossRef]
  17. González-Hernández, E.M.; Orozco-Gómez, M. A Segmentation Study of Mexican Consumers Based on Shopping Centre Attractiveness. Int. J. Retail Distrib. Manag. 2012, 40, 759–777. [Google Scholar] [CrossRef]
  18. Singh, H.; Prashar, S. Anatomy of Shopping Experience for Malls in Mumbai: A Confirmatory Factor Analysis Approach. J. Retail. Consum. Serv. 2014, 21, 220–228. [Google Scholar] [CrossRef]
  19. Singh, H.; Sahay, V. Determinants of Shopping Experience: Exploring the Mall Shoppers of National Capital Region (NCR) of India. Int. J. Retail Distrib. Manag. 2012, 40, 235–248. [Google Scholar] [CrossRef]
  20. Mahmud, I.; Ahmed, S.; Sobhani, F.A.; Islam, M.A.; Sahel, S. The Influence of Mall Management Dimensions on Perceived Experience and Patronage Intentions in an Emerging Economy. Sustainability 2023, 15, 3258. [Google Scholar] [CrossRef]
  21. Prashar, S.; Singh, H.; Parsad, C.; Vijay, T.S. Predicting Indian Shoppers’ Malls Loyalty Behaviour. Vikalpa J. Decis. Mak. 2017, 42, 234–250. [Google Scholar] [CrossRef]
  22. Khalilzadeh, J.; Pizam, A.; Fyall, A.; Tasci, A.D.A.; Hancock, P.A. Destination Imagination: Development of the Octomodal Mental Imagery (OMI) Scale. Tour. Manag. Perspect. 2023, 45, 101051. [Google Scholar] [CrossRef]
  23. Taherdoost, H. How to Design and Create an Effective Survey/Questionnaire; A Step by Step Guide. Int. J. Acad. Res. Manag. 2016, 5, 37–41. [Google Scholar]
  24. Elder, R.S.; Krishna, A. A Review of Sensory Imagery for Consumer Psychology. J. Consum. Psychol. 2022, 32, 293–315. [Google Scholar] [CrossRef]
  25. Gendler, T.S. Intuition, Imagination, and Philosophical Methodology; OUP Oxford: Oxford, UK, 2013; ISBN 0-19-100229-1. [Google Scholar]
  26. Thomas, N.J.T. Supplement to Mental Imagery. European Responses: Jaensch, Freud, and Gestalt Psychology. In The Stanford Encyclopedia of Philosophy; The Metaphysics Research Lab: Santa Clara, CA, USA, 2014. [Google Scholar]
  27. Le, D.; Scott, N.; Lohmann, G. Applying Experiential Marketing in Selling Tourism Dreams. J. Travel Tour. Mark. 2019, 36, 220–235. [Google Scholar] [CrossRef]
  28. Filep, S.; Cao, D.; Jiang, M.; DeLacy, T. Savouring Tourist Experiences after a Holiday. Leisure/Loisir 2013, 37, 191–203. [Google Scholar] [CrossRef]
  29. Huang, X.; Huang, Z.; Wyer, R.S. Slowing Down in the Good Old Days: The Effect of Nostalgia on Consumer Patience. J. Consum. Res. 2016, 43, 372–387. [Google Scholar] [CrossRef]
  30. Su, X. The Imagination of Place and Tourism Consumption: A Case Study of Lijiang Ancient Town, China. Tour. Geogr. 2010, 12, 412–434. [Google Scholar] [CrossRef]
  31. Miao, L.; Lehto, X.; Wei, W. The Hedonic Value of Hospitality Consumption: Evidence From Spring Break Experiences. J. Hosp. Mark. Manag. 2014, 23, 99–121. [Google Scholar] [CrossRef]
  32. Shiv, B.; Huber, J. The Impact of Anticipating Satisfaction on Consumer Choice. J. Consum. Res. 2000, 27, 202–216. [Google Scholar] [CrossRef]
  33. Chebat, J.-C.; Sirgy, M.J.; Grzeskowiak, S. How Can Shopping Mall Management Best Capture Mall Image? J. Bus. Res. 2010, 63, 735–740. [Google Scholar] [CrossRef]
  34. Ahmad, A.M.K. Attractiveness Factors Influencing Shoppers’ Satisfaction, Loyalty, and Word of Mouth: An Empirical Investigation of Saudi Arabia Shopping Malls. Int. J. Bus. Adm. 2012, 3, 101. [Google Scholar] [CrossRef] [Green Version]
  35. Anselmsson, J. Effects of Shopping Centre Re-Investments and Improvements on Sales and Visit Growth. J. Retail. Consum. Serv. 2016, 32, 139–150. [Google Scholar] [CrossRef]
  36. Bodkin, C.D.; Lord, J.D. Attraction of Power Shopping Centres. Int. Rev. Retail Distrib. Consum. Res. 1997, 7, 93–108. [Google Scholar] [CrossRef]
  37. Raajpoot, N.A.; Sharma, A.; Chebat, J.-C. The Role of Gender and Work Status in Shopping Center Patronage. J. Bus. Res. 2008, 61, 825–833. [Google Scholar] [CrossRef]
  38. Mok Kim Man, M.; Cai Qian Qiu, R. An Empirical Study of Factors Influencing Consumers’ Purchasing Behaviours in Shopping Malls. Int. J. Mark. Stud. 2021, 13, 14–25. [Google Scholar]
  39. Arentze, T.A.; Oppewal, H.; Timmermans, H.J.P. A Multipurpose Shopping Trip Model to Assess Retail Agglomeration Effects. J. Mark. Res. 2005, 42, 109–115. [Google Scholar] [CrossRef]
  40. Gul, E.; Lim, A.; Xu, J. Retail Store Layout Optimization for Maximum Product Visibility. J. Oper. Res. Soc. 2022, 74, 1079–1091. [Google Scholar] [CrossRef]
  41. El-Adly, M.I.; Eid, R. Measuring the Perceived Value of Malls in a Non-Western Context: The Case of the UAE. Int. J. Retail Distrib. Manag. 2015, 43, 849–869. [Google Scholar] [CrossRef]
  42. Kirkup, M.; Rafiq, M. Managing Tenant Mix in New Shopping Centres. Int. J. Retail Distrib. Manag. 1994, 22, 29–37. [Google Scholar] [CrossRef]
  43. Yiu, C.Y.; Xu, S.Y. A Tenant-mix Model for Shopping Malls. Eur. J. Mark. 2012, 46, 524–541. [Google Scholar] [CrossRef]
  44. Quelhas Brito, P. Shopping Centre Image Dynamics of a New Entrant. Int. J. Retail Distrib. Manag. 2009, 37, 580–599. [Google Scholar] [CrossRef]
  45. Gilboa, S.; Vilnai-Yavetz, I.; Mitchell, V.; Borges, A.; Frimpong, K.; Belhsen, N. Mall Experiences Are Not Universal: The Moderating Roles of National Culture and Mall Industry Age. J. Retail. Consum. Serv. 2020, 57, 102210. [Google Scholar] [CrossRef]
  46. Bloch, P.H.; Ridgway, N.M.; Dawson, S.A. The Shopping Mall as Consumer Habitat. J. Retail. 1994, 70, 23–42. [Google Scholar] [CrossRef]
  47. Csaba, F.F.; Askegaard, S. Malls and the Orchestration of the Shopping Experience in a Historical Perspective. ACR N. Am. Adv. 1999, 26, 34–40. [Google Scholar]
  48. Nicholls, J.A.F.; Li, F.; Kranendonk, C.J.; Roslow, S. The Seven Year Itch? Mall Shoppers across Time. J. Consum. Mark. 2002, 19, 149–165. [Google Scholar] [CrossRef]
  49. Wakefield, K.L.; Baker, J. Excitement at the Mall: Determinants and Effects on Shopping Response. J. Retail. 1998, 74, 515–539. [Google Scholar] [CrossRef]
  50. De Nisco, A.; Rosaria Napolitano, M. Entertainment Orientation of Italian Shopping Centres: Antecedents and Performance. Manag. Serv. Qual. Int. J. 2006, 16, 145–166. [Google Scholar] [CrossRef]
  51. Kim, H.-Y.; Kim, Y.-K. Shopping Enjoyment and Store Shopping Modes: The Moderating Influence of Chronic Time Pressure. J. Retail. Consum. Serv. 2008, 15, 410–419. [Google Scholar] [CrossRef]
  52. El Hedhli, K.; Chebat, J.-C.; Sirgy, M.J. Shopping Well-Being at the Mall: Construct, Antecedents, and Consequences. J. Bus. Res. 2013, 66, 856–863. [Google Scholar] [CrossRef]
  53. Kesari, B.; Atulkar, S. Satisfaction of Mall Shoppers: A Study on Perceived Utilitarian and Hedonic Shopping Values. J. Retail. Consum. Serv. 2016, 31, 22–31. [Google Scholar] [CrossRef]
  54. Bustamante, J.C.; Rubio, N. Measuring Customer Experience in Physical Retail Environments. J. Serv. Manag. 2017, 28, 884–913. [Google Scholar] [CrossRef]
  55. Lemon, K.N.; Verhoef, P.C. Understanding Customer Experience Throughout the Customer Journey. J. Mark. 2016, 80, 69–96. [Google Scholar] [CrossRef]
  56. Kerin, R.A.; Jain, A.; Howard, D.J. Store Shopping Experience and Consumer Price-Quality-Value Perceptions. J. Retail. 1992, 68, 376. [Google Scholar]
  57. Bäckström, K. Understanding Recreational Shopping: A New Approach. Int. Rev. Retail Distrib. Consum. Res. 2006, 16, 143–158. [Google Scholar] [CrossRef]
  58. Jain, R.; Bagdare, S. Music and Consumption Experience: A Review. Int. J. Retail Distrib. Manag. 2011, 39, 289–302. [Google Scholar] [CrossRef]
  59. Pine, B.J.; Gilmore, J.H. The Experience Economy: Work Is Theatre & Every Business a Stage; Harvard Business Press: Brighton, MA, USA, 1999; ISBN 0-87584-819-2. [Google Scholar]
  60. Palmer, A. Customer Experience Management: A Critical Review of an Emerging Idea. J. Serv. Mark. 2010, 24, 196–208. [Google Scholar] [CrossRef]
  61. Srinivasan, S.R.; Srivastava, R.K. Creating the Futuristic Retail Experience through Experiential Marketing: Is It Possible? An Exploratory Study. J. Retail Leis. Prop. 2010, 9, 193–199. [Google Scholar] [CrossRef] [Green Version]
  62. Pullman, M.E.; Gross, M.A. Ability of Experience Design Elements to Elicit Emotions and Loyalty Behaviors. Decis. Sci. 2004, 35, 551–578. [Google Scholar] [CrossRef]
  63. Stein, A.; Ramaseshan, B. The Customer Experience—Loyalty Link: Moderating Role of Motivation Orientation. J. Serv. Manag. 2020, 31, 51–78. [Google Scholar] [CrossRef]
  64. Oliver, R.L. Whence Consumer Loyalty? J. Mark. 1999, 63, 33. [Google Scholar] [CrossRef]
  65. Gentile, C.; Spiller, N.; Noci, G. How to Sustain the Customer Experience: An Overview of Experience Components that Co-create Value With the Customer. Eur. Manag. J. 2007, 25, 395–410. [Google Scholar] [CrossRef]
  66. Gahler, M.; Klein, J.F.; Paul, M. Measuring Customer Experiences: A Text-Based and Pictorial Scale. Mark. Sci. Inst. Work. Pap. Ser. Rep. 2019, 19, 1–54. [Google Scholar]
  67. Rose, S.; Clark, M.; Samouel, P.; Hair, N. Online Customer Experience in E-Retailing: An Empirical Model of Antecedents and Outcomes. J. Retail. 2012, 88, 308–322. [Google Scholar] [CrossRef]
  68. Babin, B.J.; Attaway, J.S. Atmospheric Affect as a Tool for Creating Value and Gaining Share of Customer. J. Bus. Res. 2000, 49, 91–99. [Google Scholar] [CrossRef]
  69. Rahman, O.; Wong, K.K.-K.; Yu, H. The Effects of Mall Personality and Fashion Orientation on Shopping Value and Mall Patronage Intension. J. Retail. Consum. Serv. 2016, 28, 155–164. [Google Scholar] [CrossRef]
  70. Wright, C.; Sparks, L. Loyalty Saturation in Retailing: Exploring the End of Retail Loyalty Cards? Int. J. Retail Distrib. Manag. 1999, 27, 429–440. [Google Scholar] [CrossRef]
  71. Pan, Y.; Zinkhan, G.M. Determinants of Retail Patronage: A Meta-Analytical Perspective. J. Retail. 2006, 82, 229–243. [Google Scholar] [CrossRef]
  72. El Hedhli, K.; Chebat, J.-C. Developing and Validating a Psychometric Shopper-Based Mall Equity Measure. J. Bus. Res. 2009, 62, 581–587. [Google Scholar] [CrossRef]
  73. Babin, B.J.; Darden, W.R.; Griffin, M. Work and/or Fun: Measuring Hedonic and Utilitarian Shopping Value. J. Consum. Res. 1994, 20, 644–656. [Google Scholar] [CrossRef]
  74. Jones, M.A.; Reynolds, K.E.; Arnold, M.J. Hedonic and Utilitarian Shopping Value: Investigating Differential Effects on Retail Outcomes. J. Bus. Res. 2006, 59, 974–981. [Google Scholar] [CrossRef]
  75. De Matos, C.A.; Rossi, C.A.V. Word-of-Mouth Communications in Marketing: A Meta-Analytic Review of the Antecedents and Moderators. J. Acad. Mark. Sci. 2008, 36, 578–596. [Google Scholar] [CrossRef]
  76. Sekaran, U. Research Methods for Business, 4th ed.; John Wiley & Sons: Hoboken, NJ, USA, 2009. [Google Scholar]
  77. Marona, B.; Wilk, A. Tenant Mix Structure in Shopping Centres: Some Empirical Analyses from Poland. Entrep. Bus. Econ. Rev. 2016, 4, 51–65. [Google Scholar] [CrossRef] [Green Version]
  78. Triantafillidou, A.; Siomkos, G.; Papafilippaki, E. The Effects of Retail Store Characteristics on In-Store Leisure Shopping Experience. Int. J. Retail Distrib. Manag. 2017, 45, 1034–1060. [Google Scholar] [CrossRef]
  79. Krey, N.; Picot-Coupey, K.; Cliquet, G. Shopping Mall Retailing: A Bibliometric Analysis and Systematic Assessment of Chebat’s Contributions. J. Retail. Consum. Serv. 2022, 64, 102702. [Google Scholar] [CrossRef]
  80. Kaltcheva, V.D.; Weitz, B.A. When Should a Retailer Create an Exciting Store Environment? J. Mark. 2006, 70, 107–118. [Google Scholar] [CrossRef]
  81. Heung, V.C.S.; Cheng, E. Assessing Tourists’ Satisfaction with Shopping in the Hong Kong Special Administrative Region of China. J. Travel Res. 2000, 38, 396–404. [Google Scholar] [CrossRef]
  82. Tourangeau, R.; Rips, L.J.; Rasinski, K. The Psychology of Survey Response; Cambridge University Press: Cambridge, UK, 2000. [Google Scholar]
  83. Hair, F., Jr.; Sarstedt, M.; Hopkins, L.; Kuppelwieser, V.G. Partial Least Squares Structural Equation Modeling (PLS-SEM): An Emerging Tool in Business Research. Eur. Bus. Rev. 2014, 26, 106–121. [Google Scholar] [CrossRef]
  84. Hoe, S.L. Issues and Procedures in Adopting Structural Equation Modelling Technique. J. Quant. Methods 2008, 3, 76–83. [Google Scholar]
  85. Yoon, Y.; Uysal, M. An Examination of the Effects of Motivation and Satisfaction on Destination Loyalty: A Structural Model. Tour. Manag. 2005, 26, 45–56. [Google Scholar] [CrossRef]
  86. Eduful, A.K.; Eduful, M. Malls, Modernity and Consumption: Shopping Malls as New Projectors of Modernity in Accra, Ghana. J. Consum. Cult. 2022, 22, 949–968. [Google Scholar] [CrossRef]
  87. Bourdieu, P. Distinction: A Social Critique of the Judgement of Taste; Harvard University Press: Cambridge, MA, USA, 1987; ISBN 0-674-26227-1. [Google Scholar]
  88. Berg, M. Luxury and Pleasure in Eighteenth-Century Britain; OUP Oxford: Oxford, UK, 2005; ISBN 0-19-153403-X. [Google Scholar]
  89. Nunnally, J.C.; Bernstein, I.H. Psychometric Theory; Mcgraw-Hill: New York, NY, USA, 1978; pp. 387–405. [Google Scholar]
  90. McDonald, R.P.; Ho, M.-H.R. Principles and Practice in Reporting Structural Equation Analyses. Psychol. Methods 2002, 7, 64–82. [Google Scholar] [CrossRef]
  91. Haseki, M.I. Customer Expectations In Mall Restaurants: A Case Study. Int. J. Bus. Soc. 2013, 14, 41–60. [Google Scholar]
  92. Benhamza Nsairi, Z. Managing Browsing Experience in Retail Stores through Perceived Value: Implications for Retailers. Int. J. Retail Distrib. Manag. 2012, 40, 676–698. [Google Scholar] [CrossRef]
  93. Banytė, J.; Rūtelionė, A.; Jarusevičiūtė, A. Modelling of Male Shoppers Behavior in Shopping Orientation Context. Procedia—Soc. Behav. Sci. 2015, 213, 694–701. [Google Scholar] [CrossRef] [Green Version]
  94. Spence, C.; Puccinelli, N.M.; Grewal, D.; Roggeveen, A.L. Store Atmospherics: A Multisensory Perspective. Psychol. Mark. 2014, 31, 472–488. [Google Scholar] [CrossRef]
  95. Hultén, B.M.L. Sensory Cues as Retailing Innovations: The Case of Media Markt. J. Innov. Manag. 2013, 1, 17–37. [Google Scholar] [CrossRef]
  96. Hultén, B. Sensory Cues and Shoppers’ Touching Behaviour: The Case of IKEA. Int. J. Retail Distrib. Manag. 2012, 40, 273–289. [Google Scholar] [CrossRef]
  97. Tandon, A.; Gupta, A.; Tripathi, V. Managing Shopping Experience through Mall Attractiveness Dimensions: An Experience of Indian Metro Cities. Asia Pac. J. Mark. Logist. 2016, 28, 634–649. [Google Scholar] [CrossRef]
  98. Levy, M.; Weitz, B.A.; Grewal, D.; Madore, M. Retailing Management; McGraw-Hill/Irwin: New York, NY, USA, 2012; Volume 6. [Google Scholar]
  99. Felker Kaufman, C. A New Look at One-stop Shopping: A TIMES Model Approach to Matching Store Hours and Shopper Schedules. J. Consum. Mark. 1996, 13, 4–25. [Google Scholar] [CrossRef]
  100. Folkes, V.S.; Koletsky, S.; Graham, J.L. A Field Study of Causal Inferences and Consumer Reaction: The View from the Airport. J. Consum. Res. 1987, 13, 534. [Google Scholar] [CrossRef]
  101. Hoyer, W.D.; Kroschke, M.; Schmitt, B.; Kraume, K.; Shankar, V. Transforming the Customer Experience Through New Technologies. J. Interact. Mark. 2020, 51, 57–71. [Google Scholar] [CrossRef]
  102. Kumar, A.; Killingsworth, M.A.; Gilovich, T. Waiting for Merlot: Anticipatory Consumption of Experiential and Material Purchases. Psychol. Sci. 2014, 25, 1924–1931. [Google Scholar] [CrossRef]
Figure 1. Theoretical model.
Sustainability 15 11412 g001
Figure 2. Model diagram.
Sustainability 15 11412 g002
Figure 3. Moderating effect-slope diagram.
Sustainability 15 11412 g003
Table 1. Operationalization of measures.
ConstructItemSource
OMI Test: Please close your eyes and imagine that you frequent a shopping mall and at this moment, you are relaxing and shopping in this shopping mall. Take a moment to create a detailed mental image (scene). After completing the imagery, open your eyes and select the option that best fits your mental image (from strongly disagree to agree strongly).
OMI (sensory attributes)OMI were measured by variables adapted from [22].
(Khalilzadeh et al., 2023)
Visual
  • My mental image is detailed.
  • In my mental image, I vividly see everything.
  • My mental image is a sharp image.
Auditory
  • In my mental image, I hear many different sounds.
  • In my mental image, the sounds I hear are very clear.
  • In my mental image, the sounds I hear are intense.
Tactile
  • In my mental image, I touch elements/things.
  • In my mental image, I feel the textures of elements/things.
  • In my mental image, I feel many different textures.
Gustatory
  • In my mental image, the flavors that I taste are detailed.
  • In my mental image, the flavors I taste are very intense.
Olfactory
  • In my mental image, smells are very real.
  • In my mental image, the scents I smell are very detailed.
  • In my mental image, the scents are very clear.
OMI (structural features)
Spatial
  • In my mental image, I have a precise idea of the locations of elements/things.
  • In my mental image, I have a precise idea of the directions of elements/things.
  • In my mental image, I have a precise idea of the distances of elements/things from each other.
Autonomy
  • In my mental image, I can easily change my vantage point (e.g., bird’s-eye view)
  • In my mental image, I can easily change the sizes of any entities.
  • In my mental image, I can easily change the shape of elements/things.
  • In my mental image, I can easily rotate elements/ things.
Kinesthetic
  • In my mental image, I clearly see gestures.
  • In my mental image, I clearly see postures.
Mall Management Dimensions
Accessibility
  • This shopping mall is very close to my home.
  • In this shopping mall, it is easy to find a parking place.
  • This shopping mall is a one-stop shopping place.
  • This shopping mall is close to my workplace.
  • It is easy to find the products I am looking for in this shopping mall.
  • This shopping mall has all the brands I want
Adapted from [34]
(Ahmad, 2012)
Tenant Mix
  • This shopping mall has many famous brands.
  • This shopping mall has related convenience services (such as banks, supermarkets, etc.)
  • This shopping mall has a wide variety of brands.
  • This shopping mall has many food stores.
Adapted from [77]
(Marona & Wilk, 2016)
Entertainment
  • This shopping mall has many entertainment facilities.
  • This shopping mall has entertainment for children.
  • This shopping mall has entertainment for young people.
  • This shopping mall offers a variety of entertainment programs.
Adapted from [34]
(Ahmad, 2012)
Shoppers’ experience
  • In this shopping mall, I experienced the joy.
  • In this mall, I was utterly immersed in it.
  • In this mall, I feel like I am escaping from reality like I am in another world.
  • I feel closer to my friends or family in this mall.
Taken from [78]
(Triantafillidou et al., 2017)
Mall loyalty
  • I will most likely return to this mall to spend money.
  • I would happily spend money at this mall.
  • I would recommend this mall.
Taken from [79]
(Krey et al., 2022)
Table 2. Demographic profile.
ItemsCategoriesNPercent (%)Cumulative Percent (%)
GenderMale17047.4947.49
Female18852.51100.00
Age18–25 years old13637.9937.99
26–35 years old10429.0567.04
36–45 years old9927.6594.69
Over 45 years old195.31100.00
Marital statusSingleton19353.9153.91
Married16546.09100.00
Educational levelJunior high school and below102.792.79
High school and technical secondary school71.964.75
Junior college236.4211.17
Undergraduate25170.1181.28
Master degree or above6718.72100.00
Average monthly income level (including bonuses, benefits and other forms of income)5000 and below16044.6944.69
5000–10,0008724.3068.99
10,001–20,0006518.1687.15
20,001–30,000328.9496.09
30,001–50,00051.4097.49
50,001 and above92.51100.00
Total358100.0100.0
Table 3. Reliability Statistics.
ThemesConstructsNo. of ItemsCronbach α
OMI
(sensory attributes)
Visual30.831
Auditory30.819
Tactile30.818
Gustatory20.843
Olfactory30.846
OMI
(structural features)
Spatial30.841
Autonomy40.833
Kinesthetic20.858
Mall Management DimensionsAccessibility60.882
Tenant Mix40.835
Entertainment40.851
Shoppers’ experience Shoppers’ experience40.900
Mall loyaltyMall loyalty30.821
Table 4. Normality Test.
ThemesConstructsItemsMeanStd.SkewnessKurtosis
OMI
(sensory attributes)
VisualOMI14.5811.909−0.430−0.943
OMI24.4391.490−0.059−0.487
OMI34.4411.630−0.098−0.756
AuditoryOMI44.6901.826−0.567−0.653
OMI54.5751.460−0.348−0.337
OMI64.5281.557−0.276−0.473
TactileOMI74.7011.906−0.506−0.877
OMI84.3911.550−0.158−0.618
OMI94.3721.504−0.099−0.534
GustatoryOMI104.8131.724−0.556−0.574
OMI114.6961.493−0.372−0.540
OlfactoryOMI124.7631.780−0.585−0.622
OMI134.5421.542−0.245−0.571
OMI144.5061.564−0.253−0.583
OMI
(structural features)
SpatialOMI154.5141.886−0.440−0.888
OMI164.3971.595−0.138−0.681
OMI174.3241.630−0.083−0.687
AutonomyOMI184.7771.770−0.563−0.617
OMI194.4191.494−0.129−0.509
OMI204.4221.508−0.165−0.504
OMI214.5701.428−0.153−0.400
KinestheticOMI224.6841.830−0.478−0.872
OMI234.5421.564−0.436−0.643
Mall Management DimensionsAccessibilityG14.8021.872−0.599−0.732
G24.3411.540−0.145−0.649
G34.4971.533−0.180−0.751
G44.3911.515−0.192−0.407
G54.4831.504−0.154−0.430
G64.3741.532−0.191−0.418
Tenant MixG74.7911.810−0.554−0.729
G84.6121.535−0.254−0.646
G94.5561.417−0.197−0.417
G104.5281.509−0.226−0.384
EntertainmentG114.5871.866−0.446−0.916
G124.3301.582−0.114−0.615
G134.4081.578−0.116−0.772
G144.3881.644−0.189−0.723
Shoppers’ experiencesS14.7431.676−0.462−0.670
S24.5781.472−0.316−0.944
S34.6121.511−0.375−0.796
S44.5341.504−0.410−0.855
Mall loyaltyL14.6121.887−0.488−0.84
L24.4111.501−0.079−0.526
L34.3441.604−0.085−0.771
Table 5. Table of variance explanation rate.
Total Variance Explained
FactorEigen Values% of Variance (Initial)% of Variance (Rotated)
Eigen% of VarianceCum. % of VarianceEigen% of VarianceCum. % of VarianceEigen% of VarianceCum. % of Variance
113.51630.71730.71713.51630.71730.7174.0939.3029.302
22.7846.32737.0442.7846.32737.0443.0977.03816.340
32.0334.62141.6662.0334.62141.6662.8506.47622.816
41.9284.38246.0481.9284.38246.0482.8206.41029.226
51.8454.19350.2411.8454.19350.2412.6796.08835.314
61.8014.09354.3341.8014.09354.3342.4195.49740.811
71.5223.46057.7931.5223.46057.7932.4095.47546.286
81.4513.29761.0901.4513.29761.0902.4025.46051.746
91.2982.95164.0411.2982.95164.0412.3855.42057.166
101.2612.86666.9071.2612.86666.9072.3525.34662.512
111.2382.81369.7201.2382.81369.7202.3435.32467.836
121.0752.44472.1641.0752.44472.1641.9044.32772.163
Table 6. Convergent Validity Statistics.
PathEstimateAVECR
OMI3VisualOMI
(sensory attributes)
0.7720.6370.840
OMI20.743
OMI10.874
OMI9Tactile0.7750.6130.826
OMI80.744
OMI70.828
OMI6Auditory0.7540.6110.824
OMI50.762
OMI40.826
OMI11Gustatory0.8890.7380.849
OMI100.828
OMI14Olfactory0.8230.6490.847
OMI130.792
OMI120.802
OMI21AutonomyOMI
(structural features)
0.7200.5650.838
OMI200.706
OMI190.748
OMI180.826
OMI17Spatial0.7670.6440.844
OMI160.817
OMI150.822
OMI23Kinesthetic0.8940.7610.864
OMI220.850
G1AccessibilityMall Management Dimensions0.8500.5610.884
G20.714
G30.741
G40.743
G50.716
G60.720
G7Tenant Mix0.8300.5680.840
G80.719
G90.710
G100.750
G11Entertainment0.8630.5990.856
G120.732
G130.730
G140.764
S1Shoppers’ Experiences0.8590.6920.900
S20.809
S30.842
S40.817
L1Mall loyalty0.8300.6140.826
L20.747
L30.771
Note: “←“ The arrows indicate the corresponding survey items for each variable.
Table 7. Discriminant validity: Pearson correlation with AVE square root value.
Vis-Aud-Tac-Gus-Olf-Spa-Aut-Kin-Acc-Ten-Ent-Sho-Mal-
OMI
(sensory attributes)
Visual0.798
Auditory0.2680.783
Tactile0.3290.2920.781
Gustatory0.3470.2670.3910.859
Olfactory0.3150.2510.3560.3810.806
OMI
(structural features)
Spatial0.3830.3260.3820.3890.4390.751
Autonomy0.3250.2800.3480.3330.3140.4170.802
Kinesthetic0.2890.3530.3030.2160.2500.3160.2290.872
Mall Management DimensionsAccessibility0.3530.2350.2520.2630.2400.3170.3350.2070.749
Tenant Mix0.3450.2980.2850.4240.3240.4040.3850.3360.3380.754
Entertainment0.2940.3460.4090.3220.3780.3980.3830.3050.3940.3670.774
Shoppers’ Experiences0.4900.4230.5190.5390.5100.5720.4890.4180.4420.5370.5550.832
Mall loyalty0.3760.3170.2870.2390.2560.3710.3900.2950.2990.3300.3150.4620.783
Note: The bold diagonal number is the AVE square root value.
Table 8. Model Fit.
Table 8. Model Fit.
IndexExpected ValueActual ValueFitting Results
Absolute fit index
CMIN/DF<31.357Acceptable
GFI>0.80.881Acceptable
AGFI>0.80.857Acceptable
RMSEA<0.080.032Acceptable
Comparative fitting indicators
NFI>0.80.879Acceptable
IFI>0.80.965Acceptable
TLI>0.80.959Acceptable
CFI>0.80.965Acceptable
Parsimonious fitting index
PNFI>0.50.766Acceptable
PCFI>0.50.84Acceptable
Table 9. Pearson Correlation.
Vis-Aud-Tac-Gus-Olf-Spa-Aut-Kin-Acc-Ten-Ent-Sho-Mal-
OMI
(sensory attributes)
Visual1
Auditory0.268 **1
Tactile0.329 **0.292 **1
Gustatory0.347 **0.267 **0.391 **1
Olfactory0.315 **0.251 **0.356 **0.381 **1
OMI
(structural features)
Spatial0.383 **0.326 **0.382 **0.389 **0.439 **1
Autonomy0.325 **0.280 **0.348 **0.333 **0.314 **0.417 **1
Kinesthetic0.289 **0.353 **0.303 **0.216 **0.250 **0.316 **0.229 **1
Mall Management DimensionsAccessibility0.353 **0.235 **0.252 **0.263 **0.240 **0.317 **0.335 **0.207 **1
Tenant Mix0.345 **0.298 **0.285 **0.424 **0.324 **0.404 **0.385 **0.336 **0.338 **1
Entertainment0.294 **0.346 **0.409 **0.322 **0.378 **0.398 **0.383 **0.305 **0.394 **0.367 **1
Shoppers’ Experiences0.490 **0.423 **0.519 **0.539 **0.510 **0.572 **0.489 **0.418 **0.442 **0.537 **0.555 **1
Mall loyalty0.376 **0.317 **0.287 **0.239 **0.256 **0.371 **0.390 **0.295 **0.299 **0.330 **0.315 **0.462 **1
** p < 0.01.
Table 10. Model Fit.
IndexExpected ValueActual ValueFitting Results
Absolute fit index
CMIN/DF<32.315Acceptable
GFI>0.80.696Reject
AGFI>0.80.662Reject
RMSEA<0.080.061Acceptable
Comparative fitting indicators
NFI>0.80.777Reject
IFI>0.80.86Acceptable
TLI>0.80.85Acceptable
CFI>0.80.859Acceptable
Parsimonious fitting index
PNFI>0.50.731Acceptable
PCFI>0.50.808Acceptable
Table 11. Modified model fit (independent variables two-by-two pull correlation).
IndexExpected ValueActual ValueFitting Results
Absolute fit index
CMIN/DF<31.373Acceptable
GFI>0.80.878Acceptable
AGFI>0.80.855Acceptable
RMSEA<0.080.032Acceptable
Comparative fitting indicators
NFI>0.80.876Acceptable
IFI>0.80.963Acceptable
TLI>0.80.957Acceptable
CFI>0.80.962Acceptable
Parsimonious fitting index
PNFI>0.50.773Acceptable
PCFI>0.50.849Acceptable
Table 12. Path factor table.
PathStandard EstimateEstimateS.E.C.R.p
OMI(sensory attributes)
→Shoppers’ Experiences
Visual→Shoppers’ Experiences0.1240.1430.0522.7290.006
Tactile→Shoppers’ Experiences0.1300.1610.0612.6290.009
Auditory→Shoppers’ Experiences0.0730.0890.0551.6210.105
Gustatory→Shoppers’ Experiences0.1600.1740.0543.2170.001
Olfactory→Shoppers’ Experiences0.1230.1380.0542.5480.011
OMI(structural features)
→Shoppers’ Experiences
Autonomy→Shoppers’ Experiences0.0820.1150.0661.7440.081
Spatial→Shoppers’ Experiences0.1540.1780.0622.8700.004
Kinesthetic→Shoppers’ Experiences0.0840.0860.0451.9100.056
Mall Management Dimensions
→Shoppers’ Experiences
Accessibility→Shoppers’ Experiences0.0780.0700.0391.8190.069
Tenant Mix→Shoppers’ Experiences0.1350.1290.0482.6970.007
Entertainment→Shoppers’ Experiences0.1470.1320.0443.0130.003
Shoppers’ Experiences→Mall loyalty0.5490.5970.0649.363***
***: p < 0.001 is a very high significance level.
Table 13. Hierarchical moderated regression-effect of shoppers’ experiences on loyalty intentions.
Model 1Model 2Model 3
Constant4.455 **
(66.146)
4.455 **
(66.260)
4.423 **
(69.550)
Shoppers’ Experiences0.662 **
(9.820)
0.655 **
(9.696)
0.675 **
(10.586)
Motivational orientation 0.101
(1.492)
0.112
(1.751)
Shoppers’ Experiences × Motivational orientation 0.425 **
(6.711)
n358358358
R20.2130.2180.306
Adj. R20.2110.2140.300
FF = 96.432, p = 0.000F = 49.494, p = 0.000F = 52.103, p = 0.000
△R20.2130.0050.088
△FF = 96.432, p = 0.000F = 2.225, p = 0.137F = 45.040, p = 0.000
Dependent Variable: Mall loyalty. ** p < 0.01 t statistics in parentheses.
Table 14. Summary of hypotheses testing.
Hypothesis StatementResult
OMI (sensory attributes)
→Shoppers’ Experience
H1: Visual in mental imagery positively influences shoppers’ experiences.Accepted
H2: Tactile in mental imagery positively influences shoppers’ experiences.Accepted
H3: Auditory in mental imagery positively influences shoppers’ experiences.Rejected
H4: Gustatory in mental imagery positively influences shoppers’ experiences.Accepted
H5: Olfactory in mental imagery positively influences shoppers’ experiences.Accepted
OMI (structural features)
→Shoppers’ Experience
H6: Autonomy in mental imagery positively influences shoppers’ experiences.Rejected
H7: Spatial in mental imagery positively influences shoppers’ experiences.Accepted
H8: Kinesthetic in mental imagery positively influences shoppers’ experiences.Rejected
Mall Management Dimensions
→Shoppers’ Experience
H9: Accessibility exerts a positive impact on shoppers’ experiences. Rejected
H10: Tenant mix is positively related to shoppers’ experiences.Accepted
H11: Entertainment has a positive impact on shoppers’ experiences..Accepted
Shoppers’Experience
→Mall loyalty
H12: Shoppers’ experiences have a positive impact on mall loyalty.Accepted
Moderating Role 0f Motivation OrientationH13: Shoppers’ experiences have a stronger effect on loyalty for hedonic than utilitarian motivational orientation.Accepted
Disclaimer/Publisher’s Note: The statements, opinions and data contained in all publications are solely those of the individual author(s) and contributor(s) and not of MDPI and/or the editor(s). MDPI and/or the editor(s) disclaim responsibility for any injury to people or property resulting from any ideas, methods, instructions or products referred to in the content.

