
Improvement of Agricultural Supply Quality in China: Evidence from Jiangsu Province

 ,
,
Abstract
:1. Introduction
- (1)
- This article uses KS and T tests to observe the influence degree of different agricultural input and output indexes on agricultural production efficiency values. It selects the input-output indexes on this basis. The Malmquist productivity index of different regions is calculated with the tested variables as the input-output index. The output index increases rural residents’ per capita disposable income (POY) so that the input-output index is more objective and can truly reflect the influencing factors of agricultural TFP, filling the gap in the existing relevant research methods.
- (2)
- The structure of the DEA three-stage model. The paper uses the Stochastic Frontier Approach (SFA) in the second stage. It is a method of efficiency estimation using the stochastic frontier production function. The method is proposed independently by Aigner, Lovell & Schmidt (1977) and Meeusen & van den Broeck (1977), which is a parametric method [9]. Estimating the effect of external environmental variables on the efficiency values of each decision unit, the differential analysis was performed on the input variables and separated the external environmental influence and random error. This paper combines the advantages of the random envelope analysis (DEA-Malmquist) method and the stochastic frontier analysis (SFA) method to construct a three-stage DEA model. It empirically analyses the changing track of provincial, regional, and municipal ATFP in Jiangsu Province from 2000 to 2021. It makes up for the deficiencies in existing research on the empirical analysis of agricultural total factor productivity.
2. Literature Review
2.1. Connotation of Improving the Quality of Agricultural Supply
2.2. Problems and Improving Factors on Agricultural Supply Quality
2.3. Research on the Method of TFP
2.3.1. Parameteranalys-Production Function Method
2.3.2. Stochastic Frontier Approach (SFA)
2.3.3. Data Envelopment Analysis (DEA)
2.3.4. The SBM Directionality Distance Function
2.4. Limitations of Existing Studies
2.4.1. External Environmental Impact and Uncertainty
2.4.2. Study of the Measurement Methods of Agricultural Total Factor Productivity Growth
2.4.3. Major Research Contributions in This Paper
2.5. Hypotheses
3. Materials and Methods
3.1. Research Variables and Data Sources
3.1.1. Input and Output Variables
3.1.2. Environmental Factors
- (1)
- The level of urbanization. It is expressed as a proportion of the urban population to the total population. The increased level of urbanization implies an increase in the opportunity cost of labor, a tight supply of factor resources, and the need for agricultural production to move towards intensification, which is conducive to an increase in agricultural production efficiency.
- (2)
- Financial expenditure. This is a calculation of the amount of expenditure (in billion yuan) on agriculture, forestry, and water affairs in the budget expenditure of each region. Financial support for agriculture can increase farmers’ motivation to cultivate land and reduce fallow and abandoned land.
- (3)
- Import and export trade. It represents the total amount of goods entering and leaving the country in each region (unit: billion yuan). Import and export trade has broadened the distribution channels for agricultural products, with broader sales markets, enhancing the market value of agricultural products and enabling higher utilization of agricultural production factors.
- (4)
- Transportation convenience. The development of transport infrastructure facilitates the movement of talent and reduces the “time distance” between businesses, which helps to generate positive externalities and improve the output of production factors. The density of the road network (total miles of graded roads/total area of the region) is chosen to measure accessibility (unit: km/km2).
3.2. Selection of Research Variables
3.3. Uncertainty in the DEA-Malmquist Model
3.4. Stage I: Traditional DEA model (BCC Model)
3.4.1. Technology Efficiency Change Index (EC)
3.4.2. Index of Change in Technology Progress (TC) and the Scale Efficiency Index (SE)
3.5. Stage II: Construction of the SFA Model
3.6. Stage III: Adjusted DEA Model
4. Results and Discussion
4.1. Descriptive Statistics
4.2. Unit Root Test Results
4.3. Results of the Variable Selection
4.4. Results of the DEA-Malmquist, i.e., Stage I
4.4.1. Analysis of the Empirical Results of the Agricultural Malmquist Index (ATFP) in Jiangsu Province
4.4.2. Horizontal Analysis of the Change in Agricultural Total Factor Productivity in Jiangsu Province
4.4.3. Longitudinal Analysis of Agricultural Total Factor Productivity Change in Jiangsu Province
4.4.4. AEC Is Negative Growth
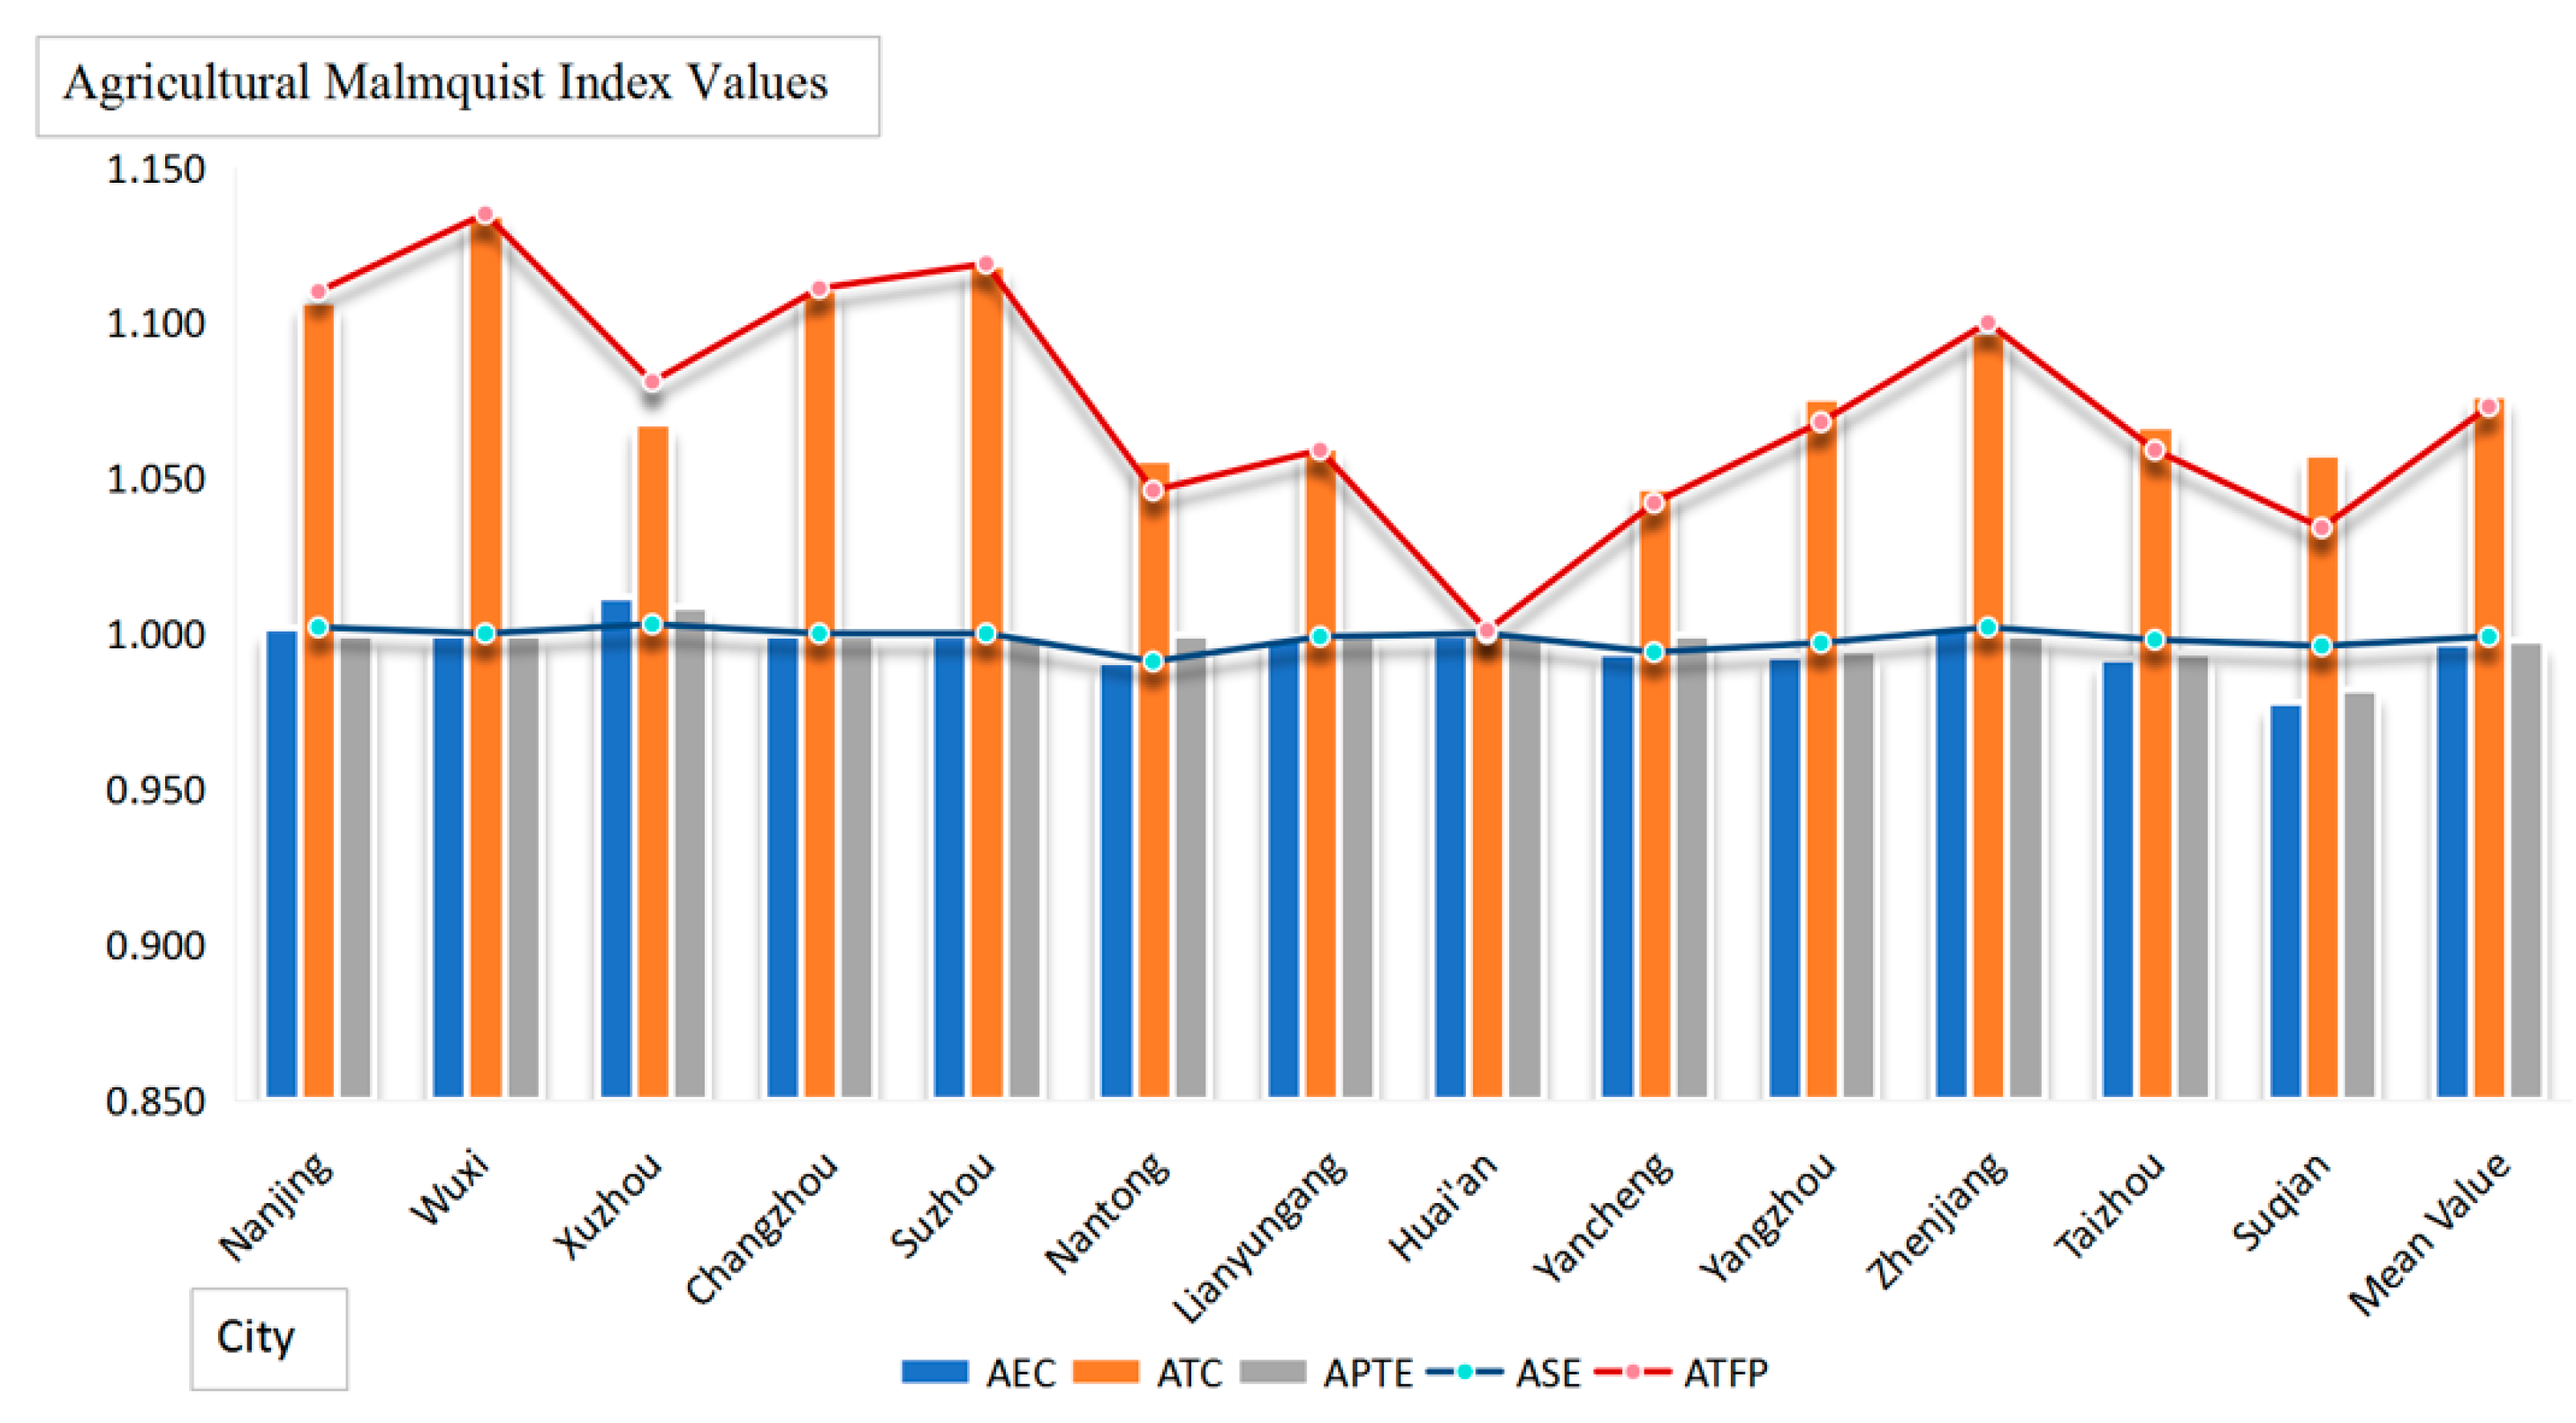
4.5. Analysis of ATFP in Each City of Jiangsu Province
4.5.1. The Changes in ATFP
4.5.2. Changes in the Change Index of Agricultural Technology Progress
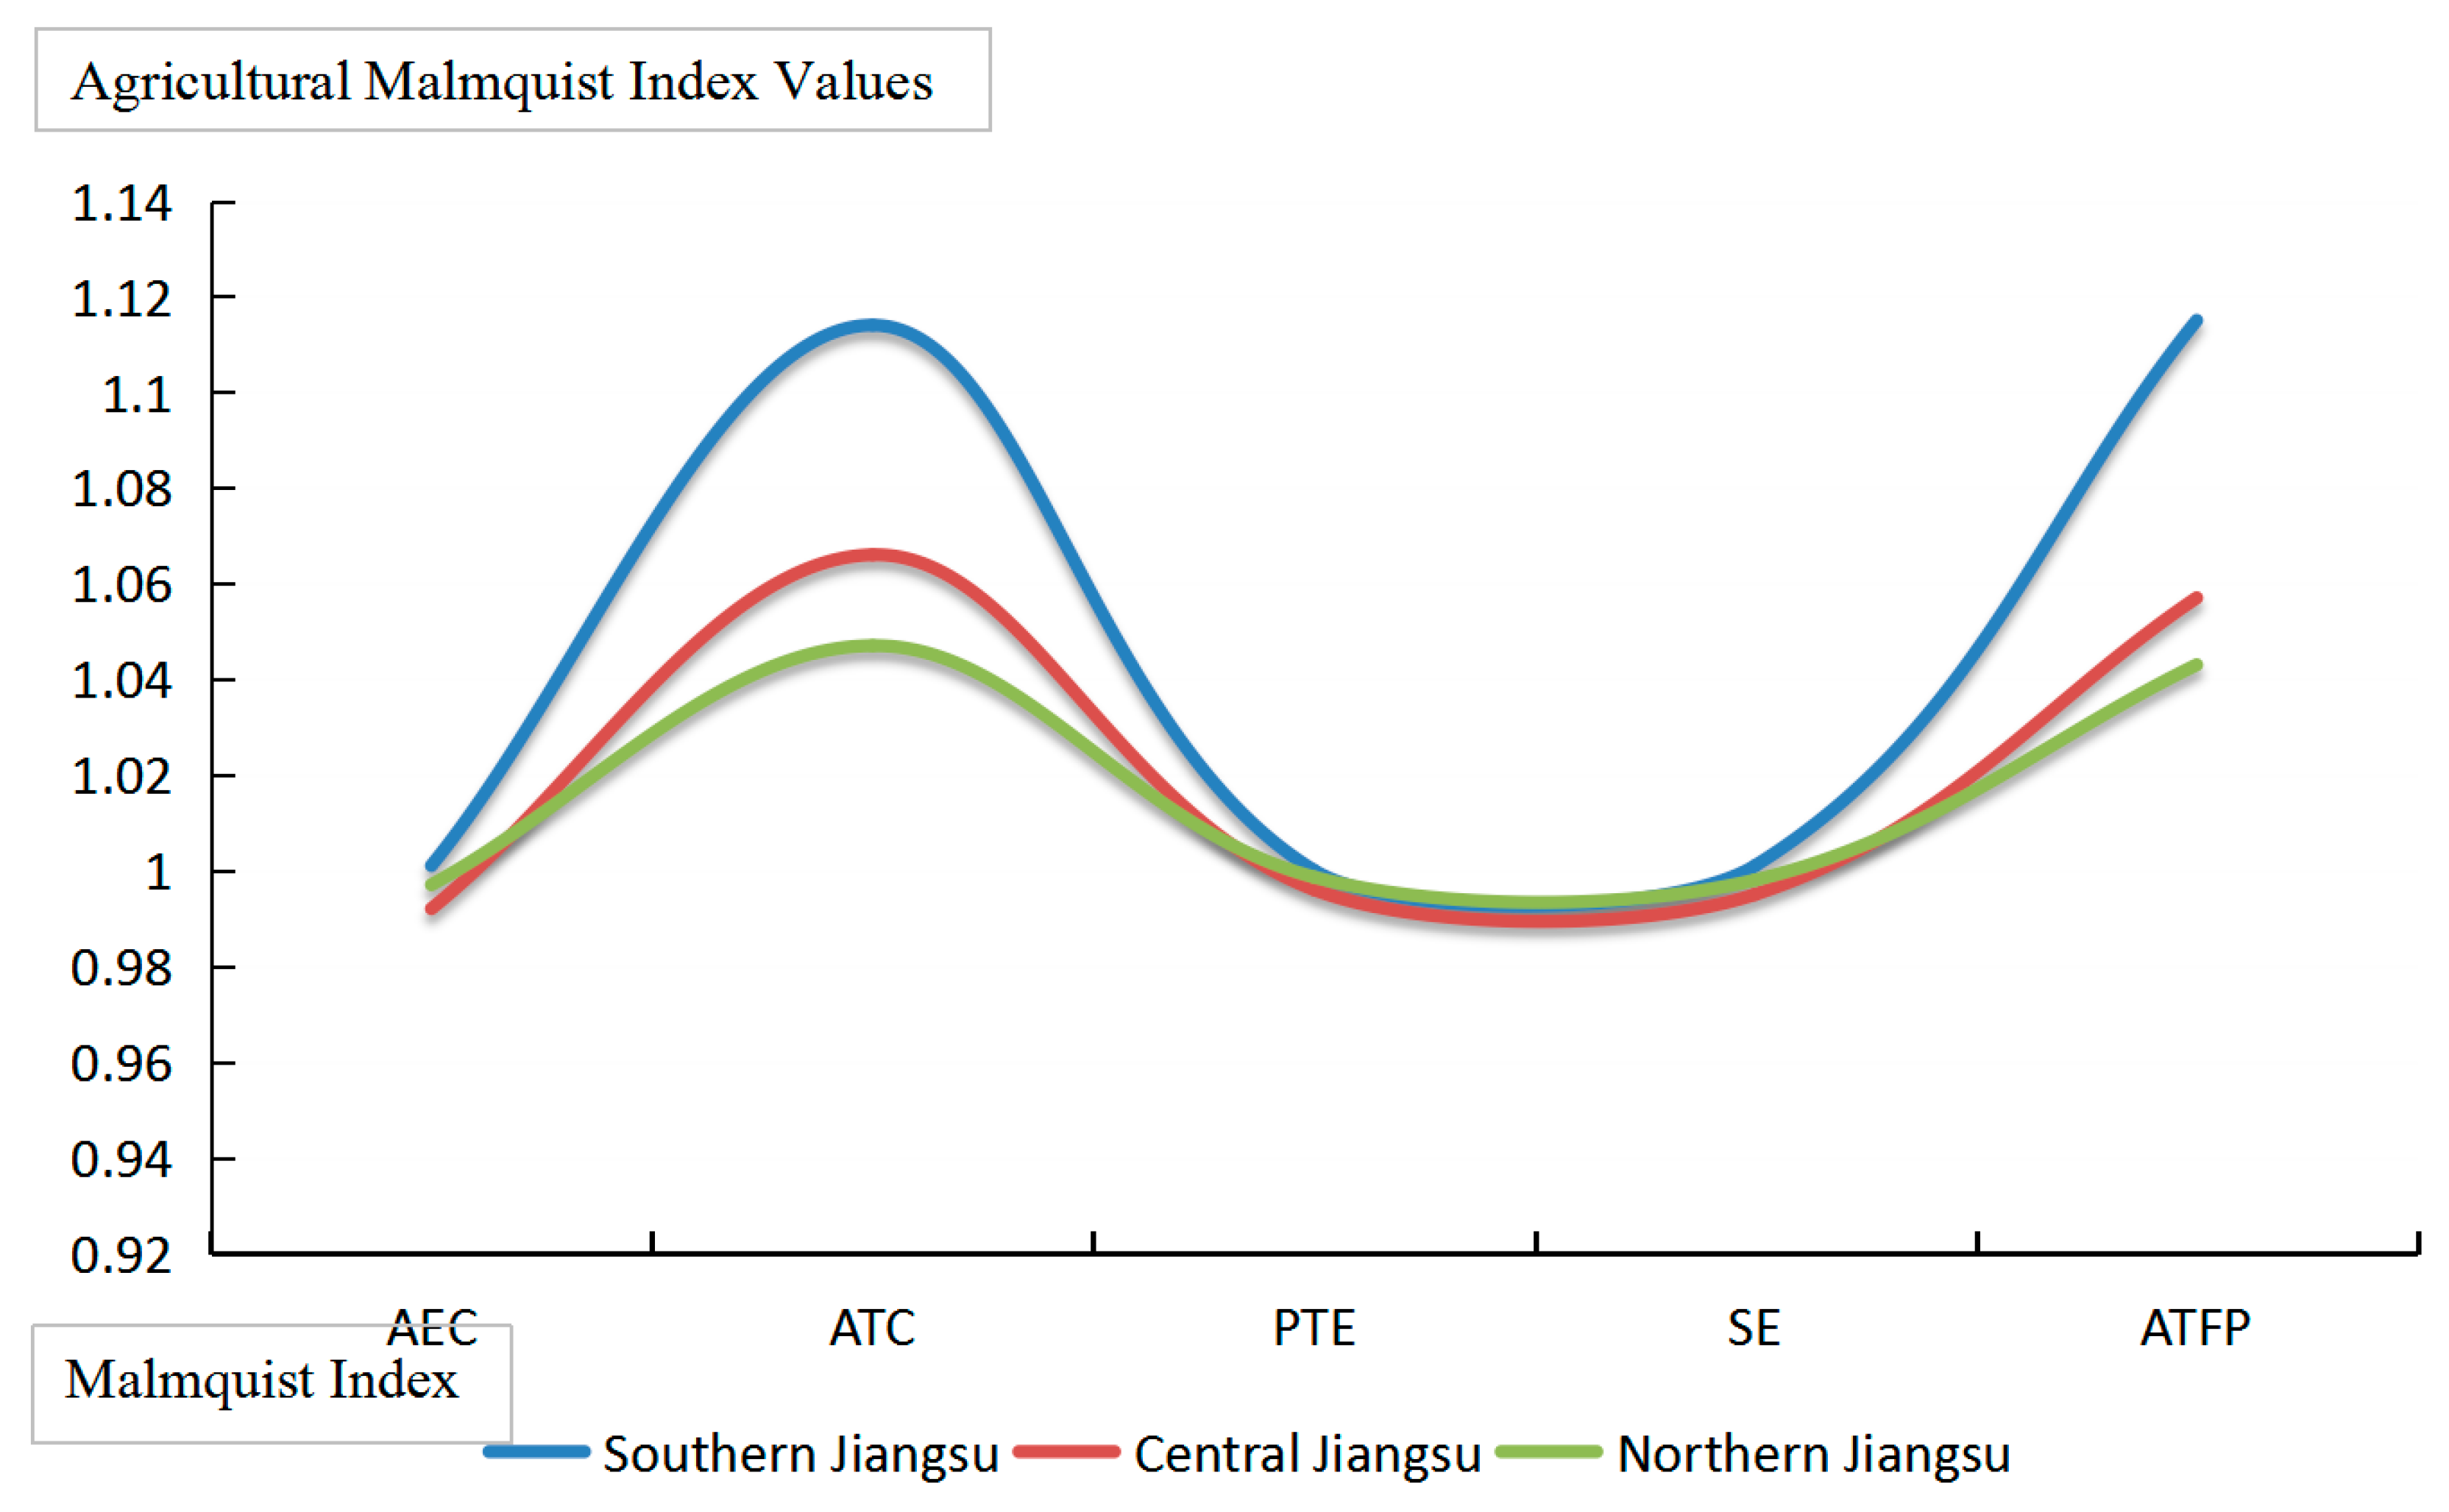
4.6. Change Analysis of Regional ATFP in Jiangsu Province
4.7. The Stage II: SFA Regression Analysis
4.8. Stage III: DEA Empirical Results When Adjusted for Input Variables
5. Conclusions and Implications
5.1. Summary of Results
5.2. Policy Implications
5.2.1. Adhere to the Principle of Supply Matching Consumption and Achieve a High Level and Balanced Upgrading in the Supply of Agricultural Products
5.2.2. Enhance the Efficiency of Supply and Allocation of Production Factors by Relying on Scientific and Technological Acceleration
5.2.3. Build a Green and Clean Production System for Improving the Safety and Quality of Agricultural Products
5.2.4. Accelerate the Comprehensive Rural Reform and Implement the Rural Revitalization Strategy
5.3. Future Research Direction and Focus
Author Contributions
Funding
Institutional Review Board Statement
Informed Consent Statement
Data Availability Statement
Conflicts of Interest
References
- Ghose, B. Food Security and Food Self-Sufficiency in China: From Past to 2050. Food Energy Secur. 2014, 3, 86–95. [Google Scholar] [CrossRef]
- Wang, J.; Wei, J. Study on the reform of Agricultural Supply Side Based on Food Security. Asian Agric. Res. 2017, 9, 8–10. [Google Scholar]
- Ministry of Agriculture and Rural Affairs (MARA). Statistical Annual Report of China’s Rural Management; China Agriculture Press: Beijing, China, 2021. [Google Scholar]
- Li, F.; Feng, S.; Lu, H.; Qu, F. D’Haese, M. How do non-farm employment and agricultural mechanization impact large-scale farming? A spatial panel data analysis from Jiangsu Province, China. Land Use Policy 2021, 107, 105517. [Google Scholar] [CrossRef]
- Jiangsu Story. Jiangsu Continues to Promote Agricultural Modernization. 2022. Available online: http://www.ourjiangsu.com/a/20220825/1661396465261.shtml (accessed on 18 June 2023).
- Su, M.; Heerink, N.; Oosterveer, P.; Feng, S. Upscaling farming operations, agricultural mechanization and chemical pesticide usage: A macro-analysis of Jiangsu Province, China. J. Clean. Prod. 2022, 380, 135120. [Google Scholar] [CrossRef]
- Ke, N.; Zhang, X.; Lu, X. Regional Disparities and Influencing Factors of Eco-Efficiency of Arable Land Utilization in China. Land 2022, 11, 257. [Google Scholar] [CrossRef]
- Ding, J.; Ren, Z.A. Dynamic Empirical Analysis of Agricultural Total Factor Productivity in Jiangsu Province -Based on the Malmquist-index method. J. Pingdingshan Coll. 2016, 88–91. [Google Scholar]
- Lv, Q., Y.; Meng, X., H. Study on Agricultural Production Efficiency in Jiangsu Province Based on the Three-Stage DEA model. Northeast. Agric. Sci. 2021, 46, 94–99. [Google Scholar] [CrossRef]
- Long, H.; Xinquan, G.; Yanping, L. China’s agricultural supply-side structural reform: Opportunities, challenges and countermeasures. Rural. Econ. 2016, 7, 29–33. (In Chinese) [Google Scholar]
- Ni, H.X. China’s Agricultural Supply-side Structural Reform from a Opening-up Perspective. Agric. Econ. Issues 2019, 2, 9–15. [Google Scholar] [CrossRef]
- Liu, Y. Analysis of the Current Situation and Problems of Agricultural Supply-Side Structural Reform in Jiangsu Province. Contemp. Econ. 2018, 24–26. (In Chinese) [Google Scholar]
- Kumar, V.; Kumar, R.; Singh, J.; Kumar, P. Contaminants in Agriculture and Environment: Health Risks and Remediation; Agriculture and Environmental Science: Haridwar, India, 2019. [Google Scholar] [CrossRef]
- Shi, Y.; Osewe, M.; Anastacia, C.; Liu, A.; Wang, S.; Latif, A. Agricultural Supply-Side Structural Reform and Path Optimization: Evidence from China. Environ. Res. Public Health 2023, 20, 113. [Google Scholar] [CrossRef] [PubMed]
- Correa, D.F.; Beyer, H.L.; Possingham, H.P.; Thomas-Hall, S.R.; Schenk, P.M. Biodiversity impacts of bioenergy production: Microalgae vs. first generation biofuels. Renew. Sustain. Energy Rev. 2017, 74, 1131–1146. [Google Scholar] [CrossRef] [Green Version]
- Li, Y.; Kong, X. Analysis of the Causes of Structural Imbalance of Agricultural Supply Side and Thinking on Reform. J. Agric. For. Econ. Manag. 2018, 6–14. (In Chinese) [Google Scholar] [CrossRef]
- Christiansen, F. Food security, urbanization, and social stability in China. J. Agrar. Chang. 2009, 9, 548–575. [Google Scholar] [CrossRef]
- Bjorkhaug, H.; Knickel, K. Rethinking the Links Between Farm Modernisation, Rural Development and Resilience. J. Rural Stud. 2018, 59, 194–196. [Google Scholar] [CrossRef]
- Ma, H.; Shi, H. Study on the Structural Reform of Agricultural Supply Side in Jilin Province under the Strategy of Rural Revitalization. Int. J. Front. Sociol. 2021, 3, 15–18. [Google Scholar] [CrossRef]
- Wen, G.J. Total Factor Productivity Change in China’s Farming Sector: 1952–1989. Econ. Dev. Cult. Chang. 1993, 12–18. [Google Scholar] [CrossRef]
- Ji, X.Y.; Zhou, S.D. Total factor productivity and its impact on agricultural economic growth— an Empirical study in Jiangsu Province. Res. Sci. Technol. Manag. 2016, 36, 104–109. [Google Scholar]
- Kuosmanen, T.; Matin, R.K. Theory of integer-valued data Envelopment Analysis. Eur. J. Oper. Res. 2009, 136, 658–667. Available online: www.elsevier.com/locate/ejor (accessed on 18 June 2023). [CrossRef]
- Wang, B.; Yang, H.; Zhu, N. Agricultural Efficiency and Total Factor Productivity Growth in Various Provinces of China: Empirical Analysis Based on the SBM Directional Distance Function. South. Econ. 2011, 12–26. (In Chinese) [Google Scholar] [CrossRef]
- Du, J. China’s Agricultural Total Factor Productivity Growth and its Spatial and Temporal Differentiation of Scientific Research Management. Sci. Res. Manag. 2015, 36, 87–97. [Google Scholar]
- Lozano, S.; Villa, G. Data Envelopment Analysis of Integer-Valued Inputs and Outputs. Comput. Oper. Res. 2006, 33, 3004–3014. [Google Scholar] [CrossRef]
- Shabanpour, H.; Yousefi, S.; Farzipoor Saen, R. Future planning for benchmarking and ranking sustainable suppliers using goal programming and robust double frontiers DEA. Transp. Res. Part D Transp. Environ. 2017, 50, 129–143. [Google Scholar] [CrossRef]
- Jauhar, S.K.; Pant, M. Integrating DEA with DE and MODE for sustainable supplier selection. J. Comput. Sci. 2017, 21, 299–306. [Google Scholar] [CrossRef]
- Li, N.; Jiang, Y.; Yu, Z.; Shang, L. Analysis of Agriculture Total-Factor Energy Efficiency in China Based on DEA and Malmquist indices. Energy Procedia 2017, 142, 2397–2402. [Google Scholar] [CrossRef]
- Tavassoli, M.; Saen, R.F. Predicting group membership of sustainable suppliers via data envelopment analysis and discriminant analysis. Sustain. Prod. Consum. 2019, 18, 41–52. [Google Scholar] [CrossRef]
- Tavassoli, M.; Saen, R.F.; Zanjirani, D.M. Assessing sustainability of suppliers: A novel stochastic-fuzzy DEA model. Sustain. Prod. Consum. 2020, 21, 78–91. [Google Scholar] [CrossRef]
- Cao, L.; Zhou, Z.; Wu, Y.; Huang, Y.; Cao, G. Is metabolism in all regions of China performing well?—Evidence from a new DEA-Malmquist productivity approach. Ecol. Indic. 2019, 106, 105487. [Google Scholar] [CrossRef]
- Zheng, Z. Energy efficiency evaluation model based on DEA-SBM-Malmquist index. Energy Rep. 2021, 7, 397–409. [Google Scholar] [CrossRef]
- Molinos-Senante, M.; Maziotis, A. Benchmarking the efficiency of water and sewerage companies: Application of the stochastic non-parametric envelopment of data (stoned) method. Expert Syst. Appl. 2021, 186, 115711. [Google Scholar] [CrossRef]
- Ding, L.L.; Lei, L.; Wang, L.; Zhang, L.F. Assessing industrial circular economy performance and its dynamic evolution: An extended Malmquist index based on cooperative game network DEA. Sci. Total Environ. 2020, 731, 139001. [Google Scholar] [CrossRef]
- Chen, Y.; Miao, J.; Zhu, Z. Measuring green total factor productivity of China’s agricultural sector: A three-stage SBM-DEA model with non-point source pollution and CO2 emissions. J. Clean. Prod. 2021, 318, 128543. [Google Scholar] [CrossRef]
- Pokharel, K.P.; Featherstone, A.M. Examining the productivity growth of agricultural cooperatives: The biennial malmquist index approach. J. Co-Oper. Organ. Manag. 2021, 9, 100148. [Google Scholar] [CrossRef]
- Khoshroo, A.; Izadikhah, M.; Emrouznejad, A. Total factor energy productivity considering undesirable pollutant outputs: A new double frontier based malmquist productivity index. Energy 2022, 258, 124819. [Google Scholar] [CrossRef]
- Wanke, P.; Rojas, F.; Tan, Y.; Moreira, J. Temporal dependence and bank efficiency drivers in OECD: A stochastic DEA-ratio approach based on generalized auto-regressive moving averages. Expert Syst. Appl. 2023, 214, 119120. [Google Scholar] [CrossRef]
- Pourmahmoud, J.; Bagheri, N. Uncertain Malmquist productivity index: An application to evaluate healthcare systems during COVID-19 pandemic. Socioecon. Plan. Sci. 2023, 87, 101522. [Google Scholar] [CrossRef]
- Ollinger, M.; Moore, D.L. The Economic Forces Driving Food Safety Quality in Meat and Poultry. Rev. Agric. Econ. 2008, 30, 289–310. [Google Scholar] [CrossRef]
- Huang, H.P.; Zhou, F.M. Agricultural supply-side structural reform literature review. Rural. Econ. Sci. Technol. 2018, 29, 3–4. [Google Scholar]
- Lele, U.; Goswami, S. Agricultural Policy Reforms: Roles of Markets and States in China and India. Glob. Food Secur. 2020, 26, 100371. [Google Scholar] [CrossRef] [PubMed]
- Official website of the National Bureau of Statistics. Available online: http://www.shujuku.org (accessed on 18 June 2023).
- Food and Agriculture Organization of the United Nations (FAO). Available online: http://faostat.fao.org/ (accessed on 18 June 2023).
- Charnes, A.; Cooper, W.; Rhodes, E. Measuring the Efficiency of Decision-Making Units. Eur. J. Oper. Res. 1978, 2, 429–444. [Google Scholar] [CrossRef]
- Coelli, T.J.; Rao, D.P. Total factor productivity growth in agriculture: A Malmquist Index Analysis of 93 Countries, 1980–2000. Agric. Econ. 2005, 32, 115–134. [Google Scholar] [CrossRef] [Green Version]
- Banker, R.D. Hypothesis Tests Using Data Envelopment Analysis. J. Product. Anal. 1996, 7, 139–159. [Google Scholar] [CrossRef]
- Jesus, F. Total Factor Productivity Growth in East Asia: A Critical Survey. J. Dev. Stud. 1999, 35, 1–41. [Google Scholar] [CrossRef]
- Hua, J.; Li, Z.; Wu, C.J. Research on the Growth of China’s Agricultural Total Factor Productivity based on the three stage DEA-Malmquist Model. J. Agric. Jiangxi 2015, 37, 134–141. [Google Scholar] [CrossRef]
- Kalirajan, K.P.; Obwona, M.B.; Zhao, S. A Decomposition of Total Factor Productivity Growth: The Case of Chinese Agricultural Growth Before and After Reforms. Am. J. Agric. Econ. 1996, 78, 331–338. [Google Scholar] [CrossRef]
- Tan, R.; Liu, H. Characteristic Evolution and Influencing Factors of the Spatial Correlation Network of Agricultural green Total Factor Productivity in China. Chin. J. Eco-Agric. 2022, 30, 2011–2022. [Google Scholar] [CrossRef]
- Fried, H.O.; Lovell, C.K.; Schmidt, S.S.; Yaisawarng, S. Accounting for Environmental Effects and Statistical Noise in Data Envelopment Analysis. J. Product. Aalysis 2002, 17, 157–174. [Google Scholar] [CrossRef]
- Cao, M.X.; Gao, S. Research on Total Factor Productivity of Agriculture in China—Based on the analysis of agricultural panel data in Jiangsu Province. Price Theory Pract. 2018, 151–154. [Google Scholar] [CrossRef]
- Fang, F. Factors: Based on the Malmquist Index Approach from 1991 to 2008. Econ. Theory Econ. Manag. (Beijing) 2010, 5–12. [Google Scholar]
- Wang, L.Y.; Liu, H.L. Development Strategy of Modern Agriculture in Jiangsu Province under the Supply-side Structural Reform. Mod. Agric. Sci. Technol. 2017, 262–264. (In Chinese) [Google Scholar]
- Jin, S.; Huang, J.; Hu, R.; Rozelle, S. The Creation and Spread of Technology and Total Factor Productivity in China’s Agriculture. Am. J. Agric. Econ. 2002, 84, 916–930. [Google Scholar] [CrossRef]
- Brown, G.P. Arable Land Loss in Rural China: Policy and Implementation in Jiangsu Province. Asian Surv. 1995, 35, 922–940. [Google Scholar] [CrossRef]
- Van Beveren, I. Total Factor Productivity Estimation: A Practical Review. J. Econ. Surv. 2012, 26, 98–128. [Google Scholar] [CrossRef] [Green Version]
- Zheng, F.; Shao, H.; Shi, X.; Zheng, H. Strategic Thinking on the Development of Fujian’s Characteristic Modern Agriculture Under the Agricultural Supply-side Structural Reform. Taiwan Agric. Res. 2017. [Google Scholar] [CrossRef]
- Xie, N.; Feng, X.; Zhao, H.D. The Effect Optimization of Agricultural Supply-Side Factors Acteristic. Modern. Agriculture -A Case Study Chu Orange Manor. Asian Agric. Res. 2018, 10, 23–28. [Google Scholar]
- Sun, T. The Study on Supply-Side Structural Reform of Hainan’s Agricultural Products. Int. Conf. Hum. Sci. Manag. Educ. Technol. 2017, 2, 374–380. [Google Scholar] [CrossRef] [Green Version]
- Waithaka, M. Communication for Rural Innovation: Rethinking Agricultural Extension. Agric. Syst. 2005, 84, 359–361. [Google Scholar] [CrossRef]
- Kong, X. Basic Connotation and Policy Recommendations of Agricultural Supply-Side Structural Reform. Reform 2016, 104–115. (In Chinese) [Google Scholar]
- Easterly, W.; Levine, R. It’s Not Factor Accumulation: Stylized Facts and Growth Models; Central Banking, Analysis, and Economic Policies Book Series; Central Bank of Chile: Santiago, Chile, 2022; Volume 6, pp. 61–114. [Google Scholar] [CrossRef] [Green Version]
- Huang, H. The Challenges and Policies of Economic Growth in China. Mod. Econ. 2021, 12, 1718–1725. [Google Scholar] [CrossRef]
- Wedajo, D.Y.; Jilito, M.F. Innovating social connectedness for agricultural innovations in eastern Ethiopia. Cogent Food Agric. 2020, 6, 1809943. [Google Scholar] [CrossRef]
- Zhang, Z.; Li, J. Big Data Mining for Climate Change; Elsevier: Amsterdam, The Netherlands, 2020. [Google Scholar] [CrossRef]
- Wang, F.; Xu, Y. Evolutionary Game Analysis of the Quality of Agricultural Products in Supply Chain. Agriculture 2022, 12, 1575. [Google Scholar] [CrossRef]
- The State Council Information Office of the People’s Republic of China. China’s Green Development in the New Era: Building the Earth into a Beautiful Home. January 2023. Available online: http://english.scio.gov.cn/m/index.htm (accessed on 18 June 2023).

| Authors | Objective | Data and Method Used |
|---|---|---|
| Wen [20] | Factor Productivity Change in China’s Farming Sector | DEA-Malmquist index Data: Related to agricultural economic development in 1952–1989 |
| Ji et al. [21] | Agricultural total factor productivity growth | DEA-Malmquist index Data: Related to agricultural economic development in 2000–2014 |
| Wang et al. [23] | Agricultural Efficiency and Total Factor Productivity Growth in Various | SBM, Luenberger productivity index Data China’s agricultural economic data from 1978 to 2011 |
| Shabanpour et al. [26] | Future planning for benchmarking and ranking sustainable suppliers | Deterministic, robust double frontiers DEA |
| Jauhar and Pant [27] | Evaluating sustainable suppliers | Deterministic, DEA with DE and MODE |
| Li et al. [28] | Agriculture Total-Factor Energy Efficiency | DEA-Malmquist index Data: Related to energy development in 1993–2014 |
| Tavassoli and Farzipoor [29] | Proposed new stochastic super-efficiency | Stochastic and deterministic |
| Mohammad Tavassoli [30] | Evaluating and ranking sustainable suppliers in unified formwork | Deterministic, stochastic, and fuzzy-DEA |
| Li et al. [31] | Performance of Metabolism in China | Deterministic, DEA-Malmquist Data: the emergy evaluation indicators system with 23 indicators in 2009–2015 |
| Zheng [32] | Energy efficiency evaluation | Deterministic, DEA-SBM-Malmquist index Data: emergy development in 2000–2019 |
| Molinos-Senante and Maziotis [33] | Benchmarking the efficiency of water and sewerage companies | DEA-StochasticData: water resource use in 2000–2019 |
| Ding et al. [34] | Assessing industrial circular economy performance and its dynamic evolution | Deterministic, An extended DEA-Malmquist index Data: China’s Yangtze River Delta region over 2012–2017 |
| Chen et al. [35] | A three-stage SBM-DEA model with non-point source pollution and CO2 emissions | DEA combined with the Slack-Based Measure (SBM) Data: influences of environmental factors and random errors and explore the real AGTFP of 30 provinces in China from 2000 to 2017. |
| Pokharel and Featherstone [36] | Examining the productivity growth of agricultural Cooperatives | Biennial Malmquist Index (BMI) |
| Khoshroo et al. [37] | A new double frontier-based Malmquist productivity index | Deterministic, DEA-Malmquist index |
| Wanke et at. [38] | an approach based on generalized auto-regressive moving averages | Stochastic DEA-ratio |
| Pourmahmoud and Bagheri [39] | Evaluating healthcare systems during the COVID-19 Pandemic | BCC-Malmquist-DEA |
| This paper | Proposed BCC-DEA-Malmquist Index in Agricultural supply quality | Stage III: DEA.: Data: Related to agricultural economic development in 2000–2021 |
| Variable Name | Description | Variable Type |
|---|---|---|
| Gross agricultural production (AGDP) | The output of agriculture, forestry, animal husbandry, and fishery products and their by-products within one year is multiplied by the price of their respective unit products. | Output Indicators |
| Grain output (AF) | The planting area of rice, wheat, corn, soybean, and sorghum is multiplied by yield per unit area. | Output Indicators |
| Annual disposable income of rural residents (POY) | In one year, the sum of the wage income, net operating income, net property income, and net transfer income of individual rural residents. | Output Indicators |
| Total sown area (ACUL) | The total area of food crops, such as grains, legumes, and potatoes sown throughout the year. | Input Indicators |
| Agricultural effective irrigation area (IRR) | For the sum of irrigated land areas in paddy fields and dry land that can be irrigated normally. | Input Indicators |
| Number of total agricultural employees (LAB) | The labor force that the whole society, directly participates in the production activities of agriculture, forestry, animal husbandry, and fishery. | Input Indicators |
| The total power of agricultural machinery (MACH) | Including tillage machinery, drainage and irrigation machinery, harvesting machinery, agricultural transportation machinery, plant protection machinery, animal husbandry machinery, forestry machinery, fishery machinery, and other agricultural machinery, internal combustion engine by engine horsepower into tile (special) calculation, motor by power into watt calculation. | Input Indicators |
| The amount of agricultural chemical fertilizer input (FER) | The total amount of nitrogen, phosphorus, potassium fertilizer, and compound fertilizer used per year; the application amount should be calculated according to the discounted purity amount. | Input Indicators |
| Rural electricity consumption (ELEC) | The annual total electricity consumption of rural production and living in the current year after deducting the electricity consumption of state-owned industry, transportation, and infrastructure units in rural areas. | Input Indicators |
| Variables | N | Mean | Maximum | Minimum | Std. Dev. |
|---|---|---|---|---|---|
| LAB | 286 | 70.92885 | 233.14 | 15.03 | 0.4722 |
| ACUL | 286 | 587.4057 | 1472.02 | 129.8 | 3.54.04 |
| MCH | 286 | 310.2785 | 778.75 | 41.44 | 1.8127 |
| FER | 286 | 24.8415 | 70.3405 | 4.48 | 0.1790 |
| ELEC | 286 | 104.1644 | 656.31 | 1.9691 | 1.39 |
| AGDP | 286 | 371.1113 | 1311.61 | 39.32 | 2.6764 |
| POY | 286 | 12885.6 | 41487 | 2597 | 86.0807 |
| Variable | LLC |
|---|---|
| LAB | −11.3005 (0.0000) |
| ACUL | 1.8518 (0.0000) |
| MACH | −1.6608 (0.0000) |
| FER | −1.8441 (0.0000) |
| ELEC | 1.6247 (0.0000) |
| AGDP | −1.5997 (0.0000) |
| POY | −1.5139 (0.0000) |
| Removed indicator | Change of Mean Value | KS test | T-test | Conclusion |
|---|---|---|---|---|
| VRS | 0.003 | 0.454 | 0.665 | Remove Indicator |
| AGDP | 0.021 | 1.732 ** | 3.856 *** | Reserve Indicator |
| AF | 0.017 | 0.360 | 0.481 | Remove Indicator |
| POY | 0.008 | 1.617 ** | 3.006 *** | Reserve Indicator |
| ACUL | 0.013 | 0.557 | 0.519 | Remove Indicator |
| ACUL + AFCUL | 0.026 | 0.618 | 1.562 * | Remove Indicator |
| ACUL + IRR | 0.089 | 1.316 ** | 2.507 *** | Reserve Indicator |
| ACUL + IRR + LAB | 0.058 | 2.162 *** | 3.511 *** | Reserve Indicator |
| ACUL + IRR + MACH | 0.003 | 1.925 *** | 3.374 *** | Reserve Indicator |
| ACUL + IRR + FER | 0.075 | 0.673 | 1.021 * | Remove Indicator |
| ACUL + IRR + ELEC | 0.039 | 1.774 *** | 3.382 *** | Reserve Indicator |
| Years | Agricultural Technology Efficiency Change Index (AEC) | Agricultural Technology Progress Indexb (ATC) | Agricultural Pure Technology EFFICIENCY Change Index (APTE) | Agricultural Scale Efficiency Change Index (ASE) | Malmquist (ATFP) |
|---|---|---|---|---|---|
| 2000–2001 | 1.008 | 0.991 | 0.998 | 1.01 | 0.998 |
| 2001–2002 | 1.013 | 1.051 | 1.01 | 1.003 | 1.065 |
| 2002–2003 | 0.984 | 1.008 | 0.984 | 1 | 0.992 |
| 2003–2004 | 0.995 | 1.111 | 1.003 | 0.992 | 1.106 |
| 2004–2005 | 0.989 | 1.059 | 0.997 | 0.992 | 1.048 |
| 2005–2006 | 1 | 1.059 | 0.989 | 1.011 | 1.058 |
| 2006–2007 | 0.997 | 1.091 | 0.995 | 1.002 | 1.088 |
| 2007–2008 | 1.005 | 1.127 | 1.004 | 1.001 | 1.133 |
| 2008–2009 | 1.005 | 1.106 | 1.003 | 1.001 | 1.111 |
| 2009–2010 | 1.009 | 1.087 | 1.009 | 1.001 | 1.098 |
| 2010–2011 | 0.991 | 1.161 | 0.999 | 0.992 | 1.15 |
| 2011–2012 | 0.995 | 1.09 | 0.997 | 0.998 | 1.085 |
| 2012–2013 | 1.006 | 1.086 | 1.005 | 1.001 | 1.093 |
| 2013–2014 | 0.99 | 1.051 | 0.993 | 0.997 | 1.042 |
| 2014–2015 | 0.985 | 1.082 | 0.992 | 0.993 | 1.065 |
| 2015–2016 | 0.982 | 1.077 | 0.996 | 0.987 | 1.058 |
| 2017–2018 | 1.002 | 1.021 | 0.997 | 0.997 | 1.071 |
| 2018–2019 | 1.005 | 1.055 | 1 | 1.002 | 1.068 |
| 2019–2020 | 0.994 | 1.093 | 1.002 | 0.999 | 1.053 |
| 2020–2021 | 0.989 | 1.13 | 0.996 | 1.001 | 1.085 |
| Mean Value | 0.997 | 1.077 | 0.998 | 0.999 | 1.074 |
| Cities | AEC | ATC | APTE | ASE | ATFP | Rank |
|---|---|---|---|---|---|---|
| Nanjing | 1.002 | 1.107 | 1 | 1.002 | 1.11 | 4 |
| Wuxi | 1 | 1.135 | 1 | 1 | 1.135 | 1 |
| Xuzhou | 1.012 | 1.068 | 1.009 | 1.003 | 1.081 | 6 |
| Changzhou | 1 | 1.111 | 1 | 1 | 1.111 | 3 |
| Suzhou | 1 | 1.119 | 1 | 1 | 1.119 | 2 |
| Nantong | 0.991 | 1.056 | 1 | 0.991 | 1.046 | 10 |
| Lianyungang | 0.999 | 1.06 | 1 | 0.999 | 1.059 | 8 |
| Huai’an | 1 | 1.001 | 1 | 1 | 1.001 | 13 |
| Yancheng | 0.994 | 1.047 | 1 | 0.994 | 1.042 | 11 |
| Yangzhou | 0.993 | 1.076 | 0.995 | 0.997 | 1.068 | 7 |
| Zhenjiang | 1.002 | 1.097 | 1 | 1.002 | 1.1 | 5 |
| Taizhou | 0.992 | 1.067 | 0.994 | 0.998 | 1.059 | 8 |
| Suqian | 0.978 | 1.058 | 0.982 | 0.996 | 1.034 | 12 |
| Mean Value | 0.997 | 1.077 | 0.998 | 0.999 | 1.073 |
| Regions | AEC | ATC | APTE | ASE | ATFP |
|---|---|---|---|---|---|
| Southern Jiangsu | 1.001 | 1.114 | 1 | 1.001 | 1.115 |
| Central Jiangsu | 0.992 | 1.066 | 0.996 | 0.995 | 1.057 |
| Northern Jiangsu | 0.997 | 1.047 | 0.9986 | 0.998 | 1.043 |
| Variable | Southern Jiangsu | Central Jiangsu | Northern Jiangsu | |||
|---|---|---|---|---|---|---|
| Fixed Effect | Stochastic Effect | Fixed Effect | Stochastic Effect | Fixed Effect | Stochastic Effect | |
| lnLAB | −1.2902 *** | −1.8158 *** | −0.2185 ** | −0.4458 *** | −0.6141 ** | −1.0135 *** |
| (0.1492) | (0.2158) | (0.0830) | (0.1251) | (0.1933) | (0.1429) | |
| LnMACH | 0.3229 ** | 1.1360 *** | 2.0362 *** | 1.8062 *** | 0.6477 *** | 0.6607 *** |
| (0.1266) | (0.2295) | (0.2080) | (0.3435) | (0.1298) | (0.1165) | |
| LnFER | −0.9215 *** | 0.1692 | −0.3961 *** | −0.2765 | −0.0231 | 0.4869 ** |
| (0.1425) | (0.2360) | (0.1228) | (0.2096) | (0.3003) | (0.1966) | |
| lnACUL | 2.4983 *** | 0.7888 *** | 2.0502 *** | 0.4982 | 3.2209 *** | 0.9273 *** |
| (0.2656) | (0.2473) | (0.3280) | (0.4033) | (0.5833) | (0.1073) | |
| EC | 0.2063 * | 0.8545 * | 0.3923 ** | 0.8248 * | 0.3689 * | 0.4169 |
| (0.2845) | (0.5996) | (0.3340) | (0.5732) | (0.2293) | ((0.3049) | |
| TE | −0.3458 | −0.5830 | 0.2687 * | 0.2842 * | 0.2434 ** | −0.2058 *** |
| (0.2488) | (0.5419) | (0.2377) | (0.4107) | (0.2980) | (0.4017) | |
| _cons | −3.7998 *** | 0.6213 | −17.3033 *** | −5.9361 *** | −16.8266 *** | −1.5479 |
| (1.1892) | (1.1806) | (2.0260) | (1.0710) | (4.3504) | (1.0585) | |
| Hausman | ||||||
| Prob > chi2 | 0.0000 | 0.1101 | 0.0000 | |||
| Prob > chi2 | 0.0000 | 0.0000 | 0.0000 | 0.0000 | 0.0000 | 0.0000 |
| Labour Input Slack Variable | Land Input Slack Variable | Agricultural Machinery Power Input Slack Variable | Fertilizer Input Slack Variable | Power Consumption Input Slack Variable | |
|---|---|---|---|---|---|
| constant term | 128.215 *** | 938.798 *** | 736.431 *** | 60.888 *** | 543.348 *** |
| (125.906) | (3.594) | (4.376) | (61.583) | (6.348) | |
| urbanization level | −121.139 *** | −650.607 ** | −579.015 *** | −61.388 *** | −398.195 *** |
| (−119.382) | (−1.680) | (−2.729) | (−62.968) | (−9.768) | |
| Financial support for agriculture | 0.00004 *** | −0.0003 ** | 0.00004 | 0.00003 *** | 0.00004 ** |
| (2.740) | (−1.617) | (−0.326) | (14.534) | (−0.394) | |
| Import and export trade | −9.855 *** | 29.705 | −28.436 | −7.537 *** | −12.339 * |
| (−9.630) | (0.318) | (−0.423) | (−5.981) | (−2.031) | |
| Convenient transportation | −16.130 *** | −161.731 ** | −135.878 | −15.778 *** | −35.490 *** |
| (−14.718) | (−1.985) | (−1.498) | (−18.246) | (−9.226) | |
| 640.568 *** | 11,556.479 *** | 13,318.702 *** | 121.315 *** | 3555.4907 *** | |
| (641.034) | (223.359) | (12,689.504) | (121.548) | (2456.893) | |
| γ | 1.000 *** | 0.580 * | 0.973 *** | 1.000 *** | 0.732 * |
| (49,307.593) | (1.749) | (10.893) | (157,684.132) | (4988.599) | |
| Log-likelihood | −53.798 | −76.186 | −72.533 | −43.388 | −61.047 |
| LR test of the one-sided error | 3.679 | 0.146 | 1.628 | 7.325 | 4.582 |
| Cities | Agricultural Technology Progress | Agricultural Pure Technology Efficiency | Agricultural Scale Efficiency | ||||||
|---|---|---|---|---|---|---|---|---|---|
| AEC1 | AEC3 | Direction | APTE1 | APTE3 | Direction | ASE1 | ASE3 | Direction | |
| Nanjing | 1.002 | 0.965 | ↓ | 1.000 | 0.989 | ↓ | 1.002 | 0.975 | ↓ |
| Wuxi | 1.000 | 0.965 | ↓ | 1.000 | 1.000 | — | 1.000 | 0.965 | ↓ |
| Xuzhou | 1.012 | 1.018 | ↑ | 1.009 | 1.009 | — | 1.003 | 1.009 | ↑ |
| Changzhou | 1.000 | 0.994 | ↓ | 1.000 | 1.001 | ↑ | 1.000 | 0.893 | ↓ |
| Suzhou | 1.000 | 0.976 | ↓ | 1.000 | 1.000 | — | 1.000 | 0.976 | ↓ |
| Nantong | 0.991 | 0.998 | ↑ | 1.000 | 1.000 | — | 0.991 | 0.998 | ↑ |
| Lianyungang | 0.999 | 1.009 | ↑ | 1.000 | 1.006 | ↑ | 0.999 | 1.003 | ↑ |
| Huaian | 1.000 | 1.010 | ↑ | 1.000 | 1.008 | ↑ | 1.000 | 1.002 | ↑ |
| Yancheng | 0.994 | 1.003 | ↑ | 1.000 | 1.000 | — | 0.994 | 1.003 | ↑ |
| Yangzhou | 0.993 | 0.995 | ↑ | 0.995 | 0.996 | ↑ | 0.997 | 0.999 | ↑ |
| Zhenjiang | 1.002 | 1.001 | ↓ | 1.000 | 1.000 | — | 1.002 | 1.001 | ↓ |
| Taizhou | 0.992 | 0.999 | ↑ | 0.994 | 0.999 | ↑ | 0.998 | 1.000 | ↑ |
| Suqian | 0.978 | 0.999 | ↑ | 0.982 | 1.000 | ↑ | 0.996 | 0.999 | ↑ |
| Mean value | 0.997 | 0.999 | ↑ | 0.998 | 0.9998 | ↑ | 0.999 | 0.987 | ↓ |
Disclaimer/Publisher’s Note: The statements, opinions and data contained in all publications are solely those of the individual author(s) and contributor(s) and not of MDPI and/or the editor(s). MDPI and/or the editor(s) disclaim responsibility for any injury to people or property resulting from any ideas, methods, instructions or products referred to in the content. |
© 2023 by the authors. Licensee MDPI, Basel, Switzerland. This article is an open access article distributed under the terms and conditions of the Creative Commons Attribution (CC BY) license (https://creativecommons.org/licenses/by/4.0/).
Share and Cite
Zhou, R.; Liu, H.; Zhang, Q.; Wang, W.; Mao, J.; Wang, X.; Tang, D. Improvement of Agricultural Supply Quality in China: Evidence from Jiangsu Province. Sustainability 2023, 15, 11418. https://doi.org/10.3390/su151411418
Zhou R, Liu H, Zhang Q, Wang W, Mao J, Wang X, Tang D. Improvement of Agricultural Supply Quality in China: Evidence from Jiangsu Province. Sustainability. 2023; 15(14):11418. https://doi.org/10.3390/su151411418
Chicago/Turabian StyleZhou, Rongrong, Hanzhou Liu, Qian Zhang, Wei Wang, Jian Mao, Xuerong Wang, and Decai Tang. 2023. "Improvement of Agricultural Supply Quality in China: Evidence from Jiangsu Province" Sustainability 15, no. 14: 11418. https://doi.org/10.3390/su151411418
APA StyleZhou, R., Liu, H., Zhang, Q., Wang, W., Mao, J., Wang, X., & Tang, D. (2023). Improvement of Agricultural Supply Quality in China: Evidence from Jiangsu Province. Sustainability, 15(14), 11418. https://doi.org/10.3390/su151411418