
The Harmonious Relationship between Energy Utilization Efficiency and Industrial Structure Development under Carbon Emission Constraints: Measurement, Quantification, and Identification

Abstract
:1. Introduction
1.1. Background and Motivation
1.2. Literature Review
1.3. Objective and Contributions
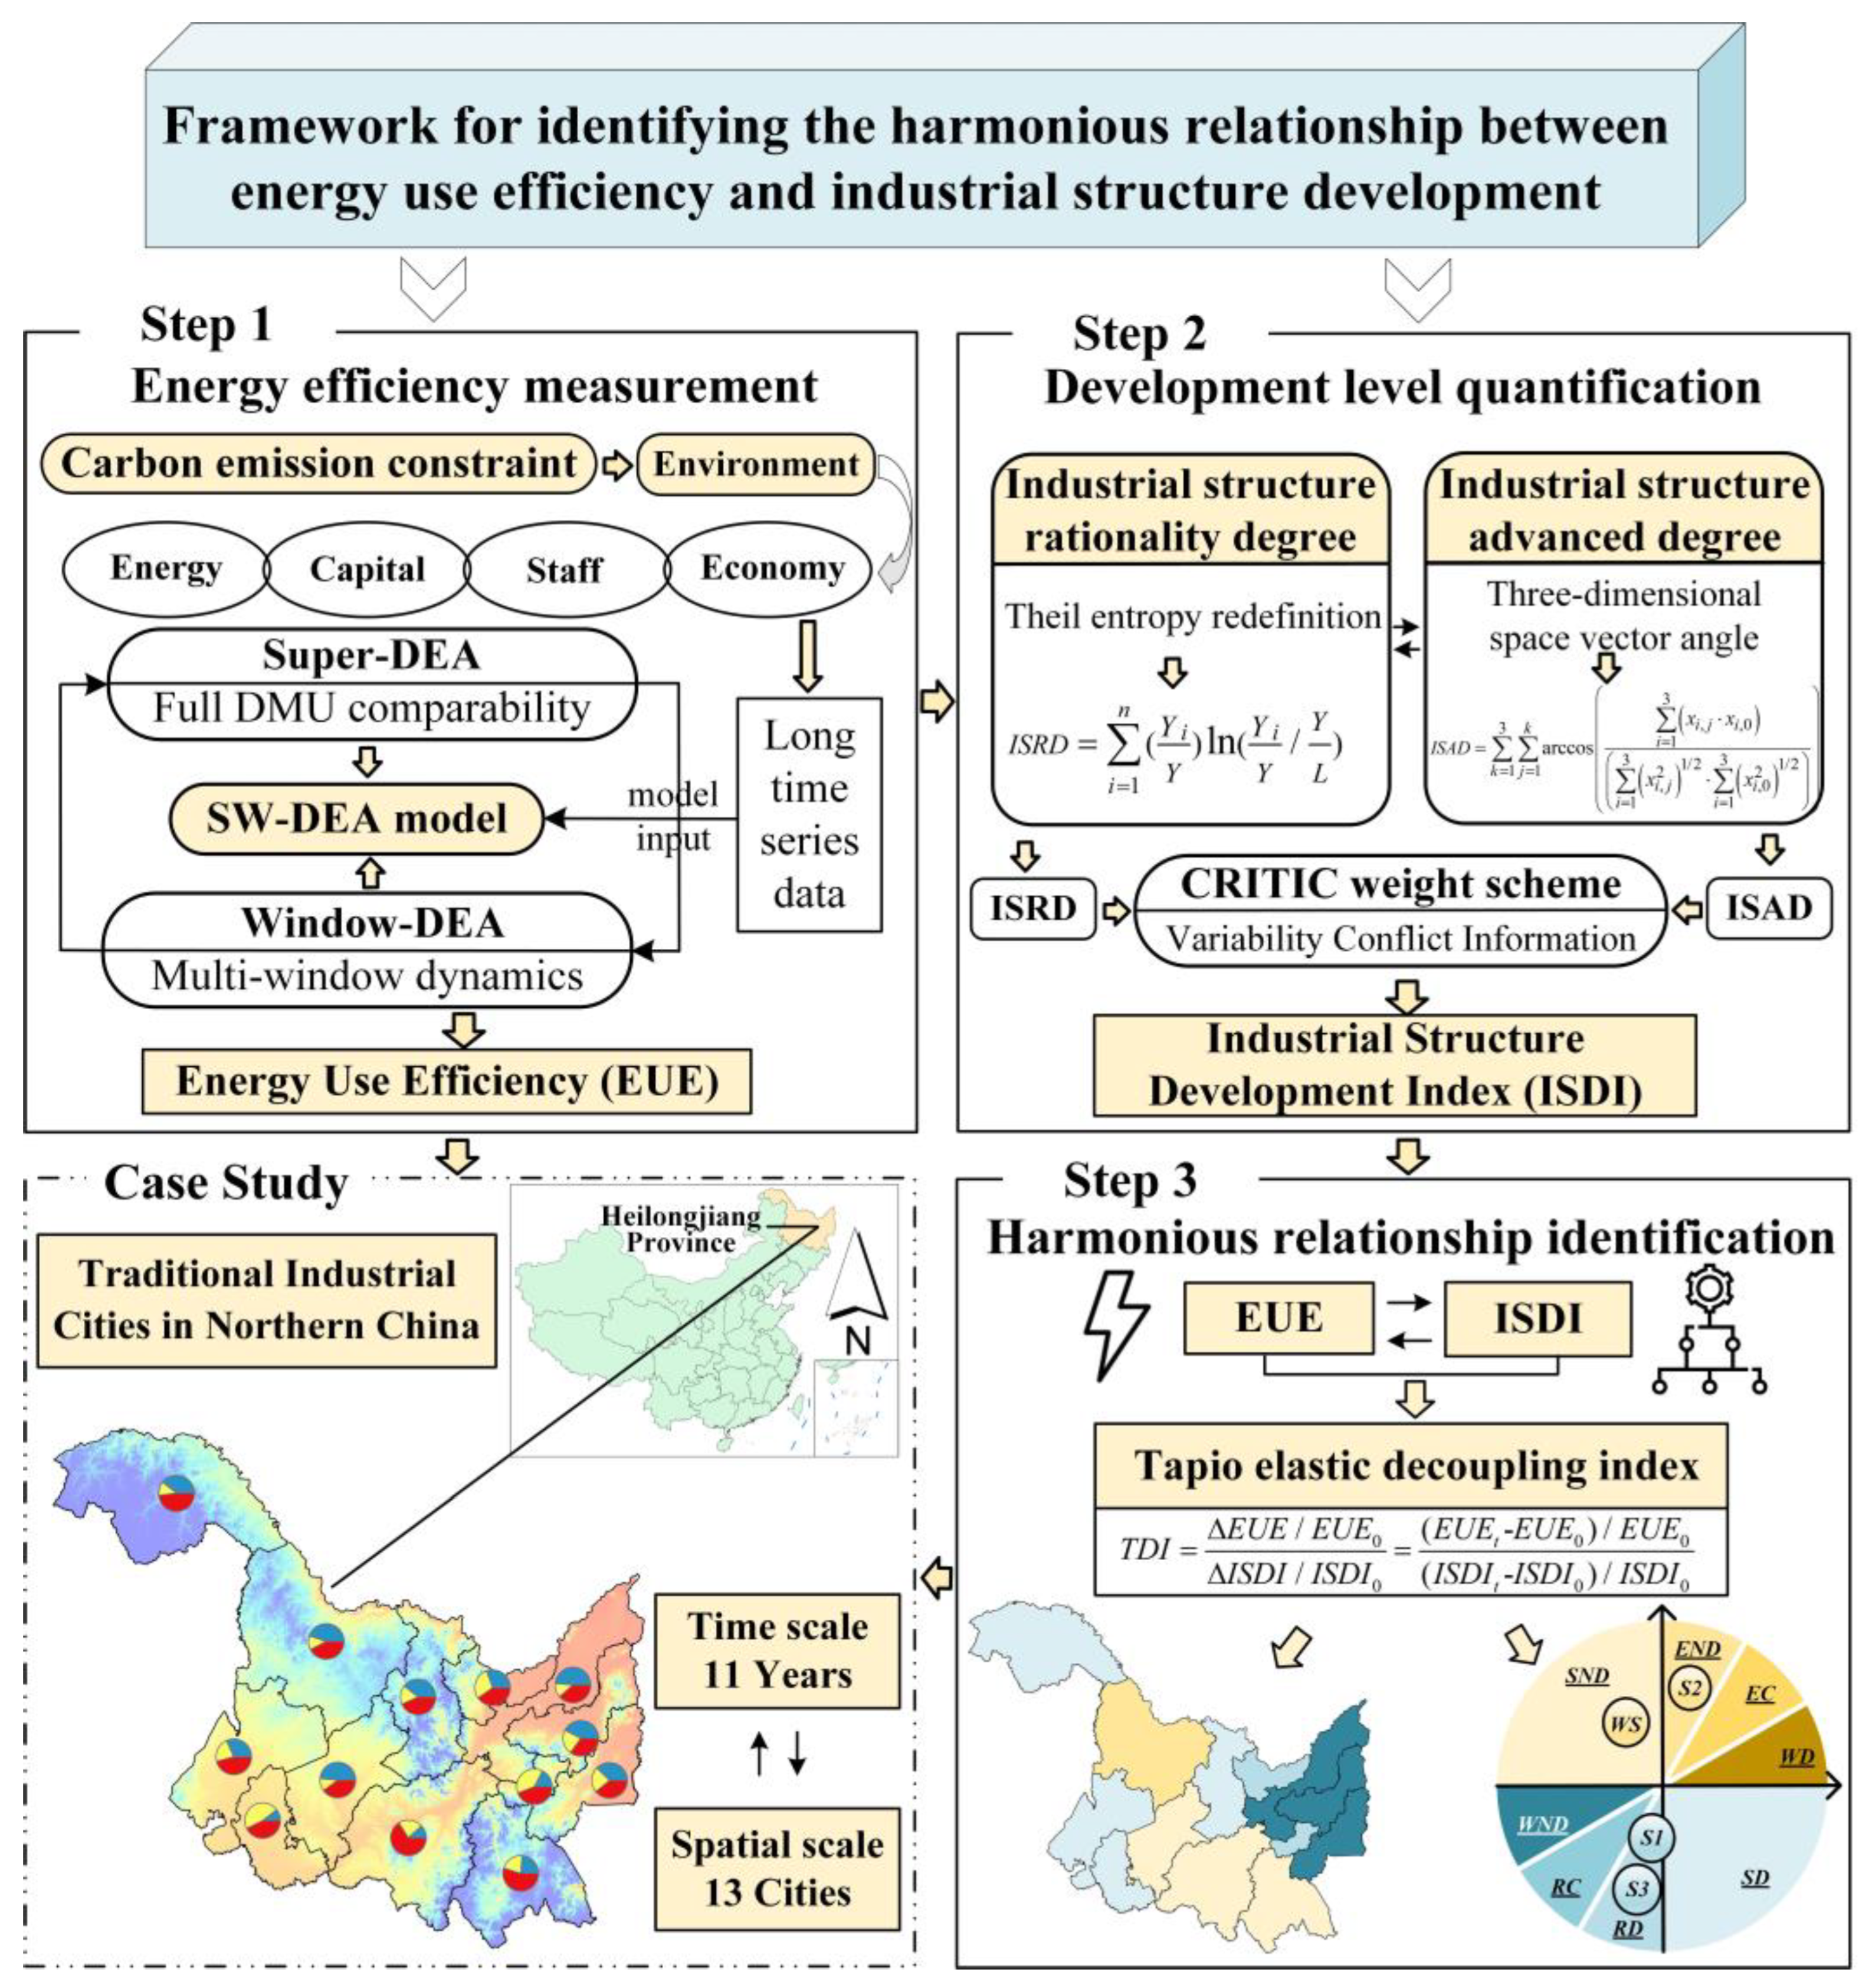
2. Methodology
2.1. SW-DEA Model
2.2. Industrial Structure Development Index
2.3. Tapio Decoupling Model
3. Implementation
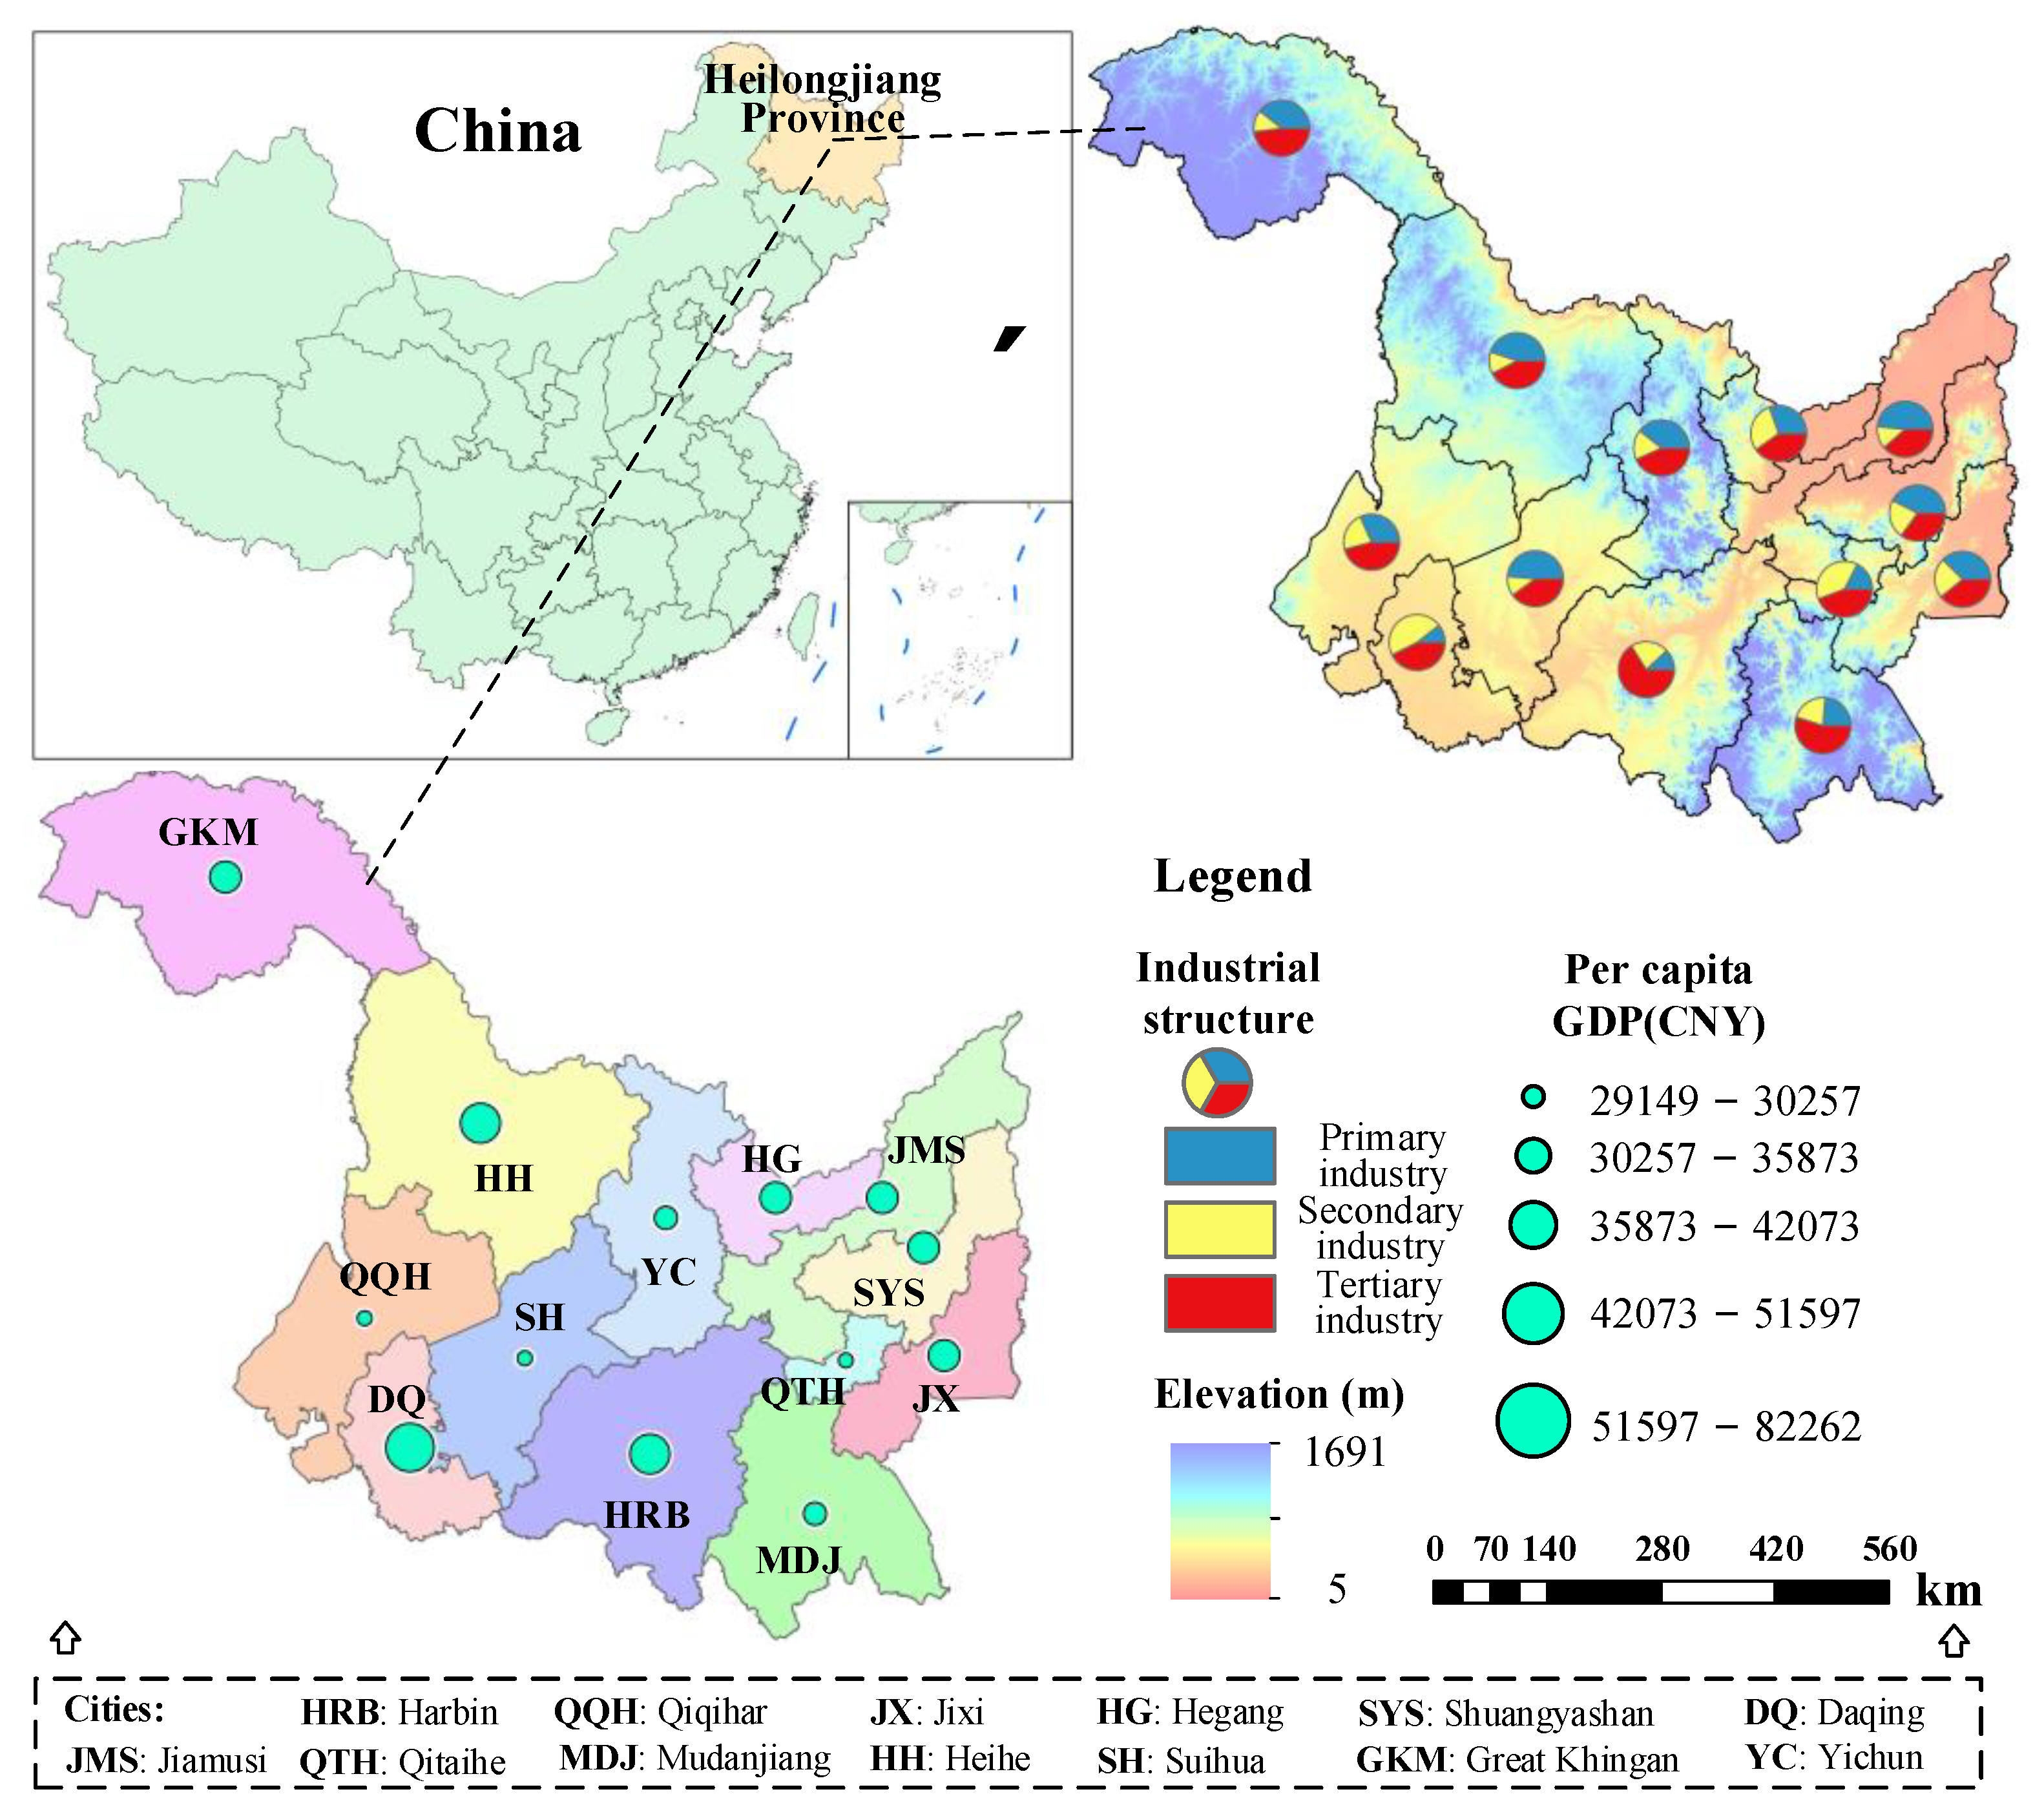
3.1. The Study Area
3.2. Data and Implementation
4. Results and Discussion
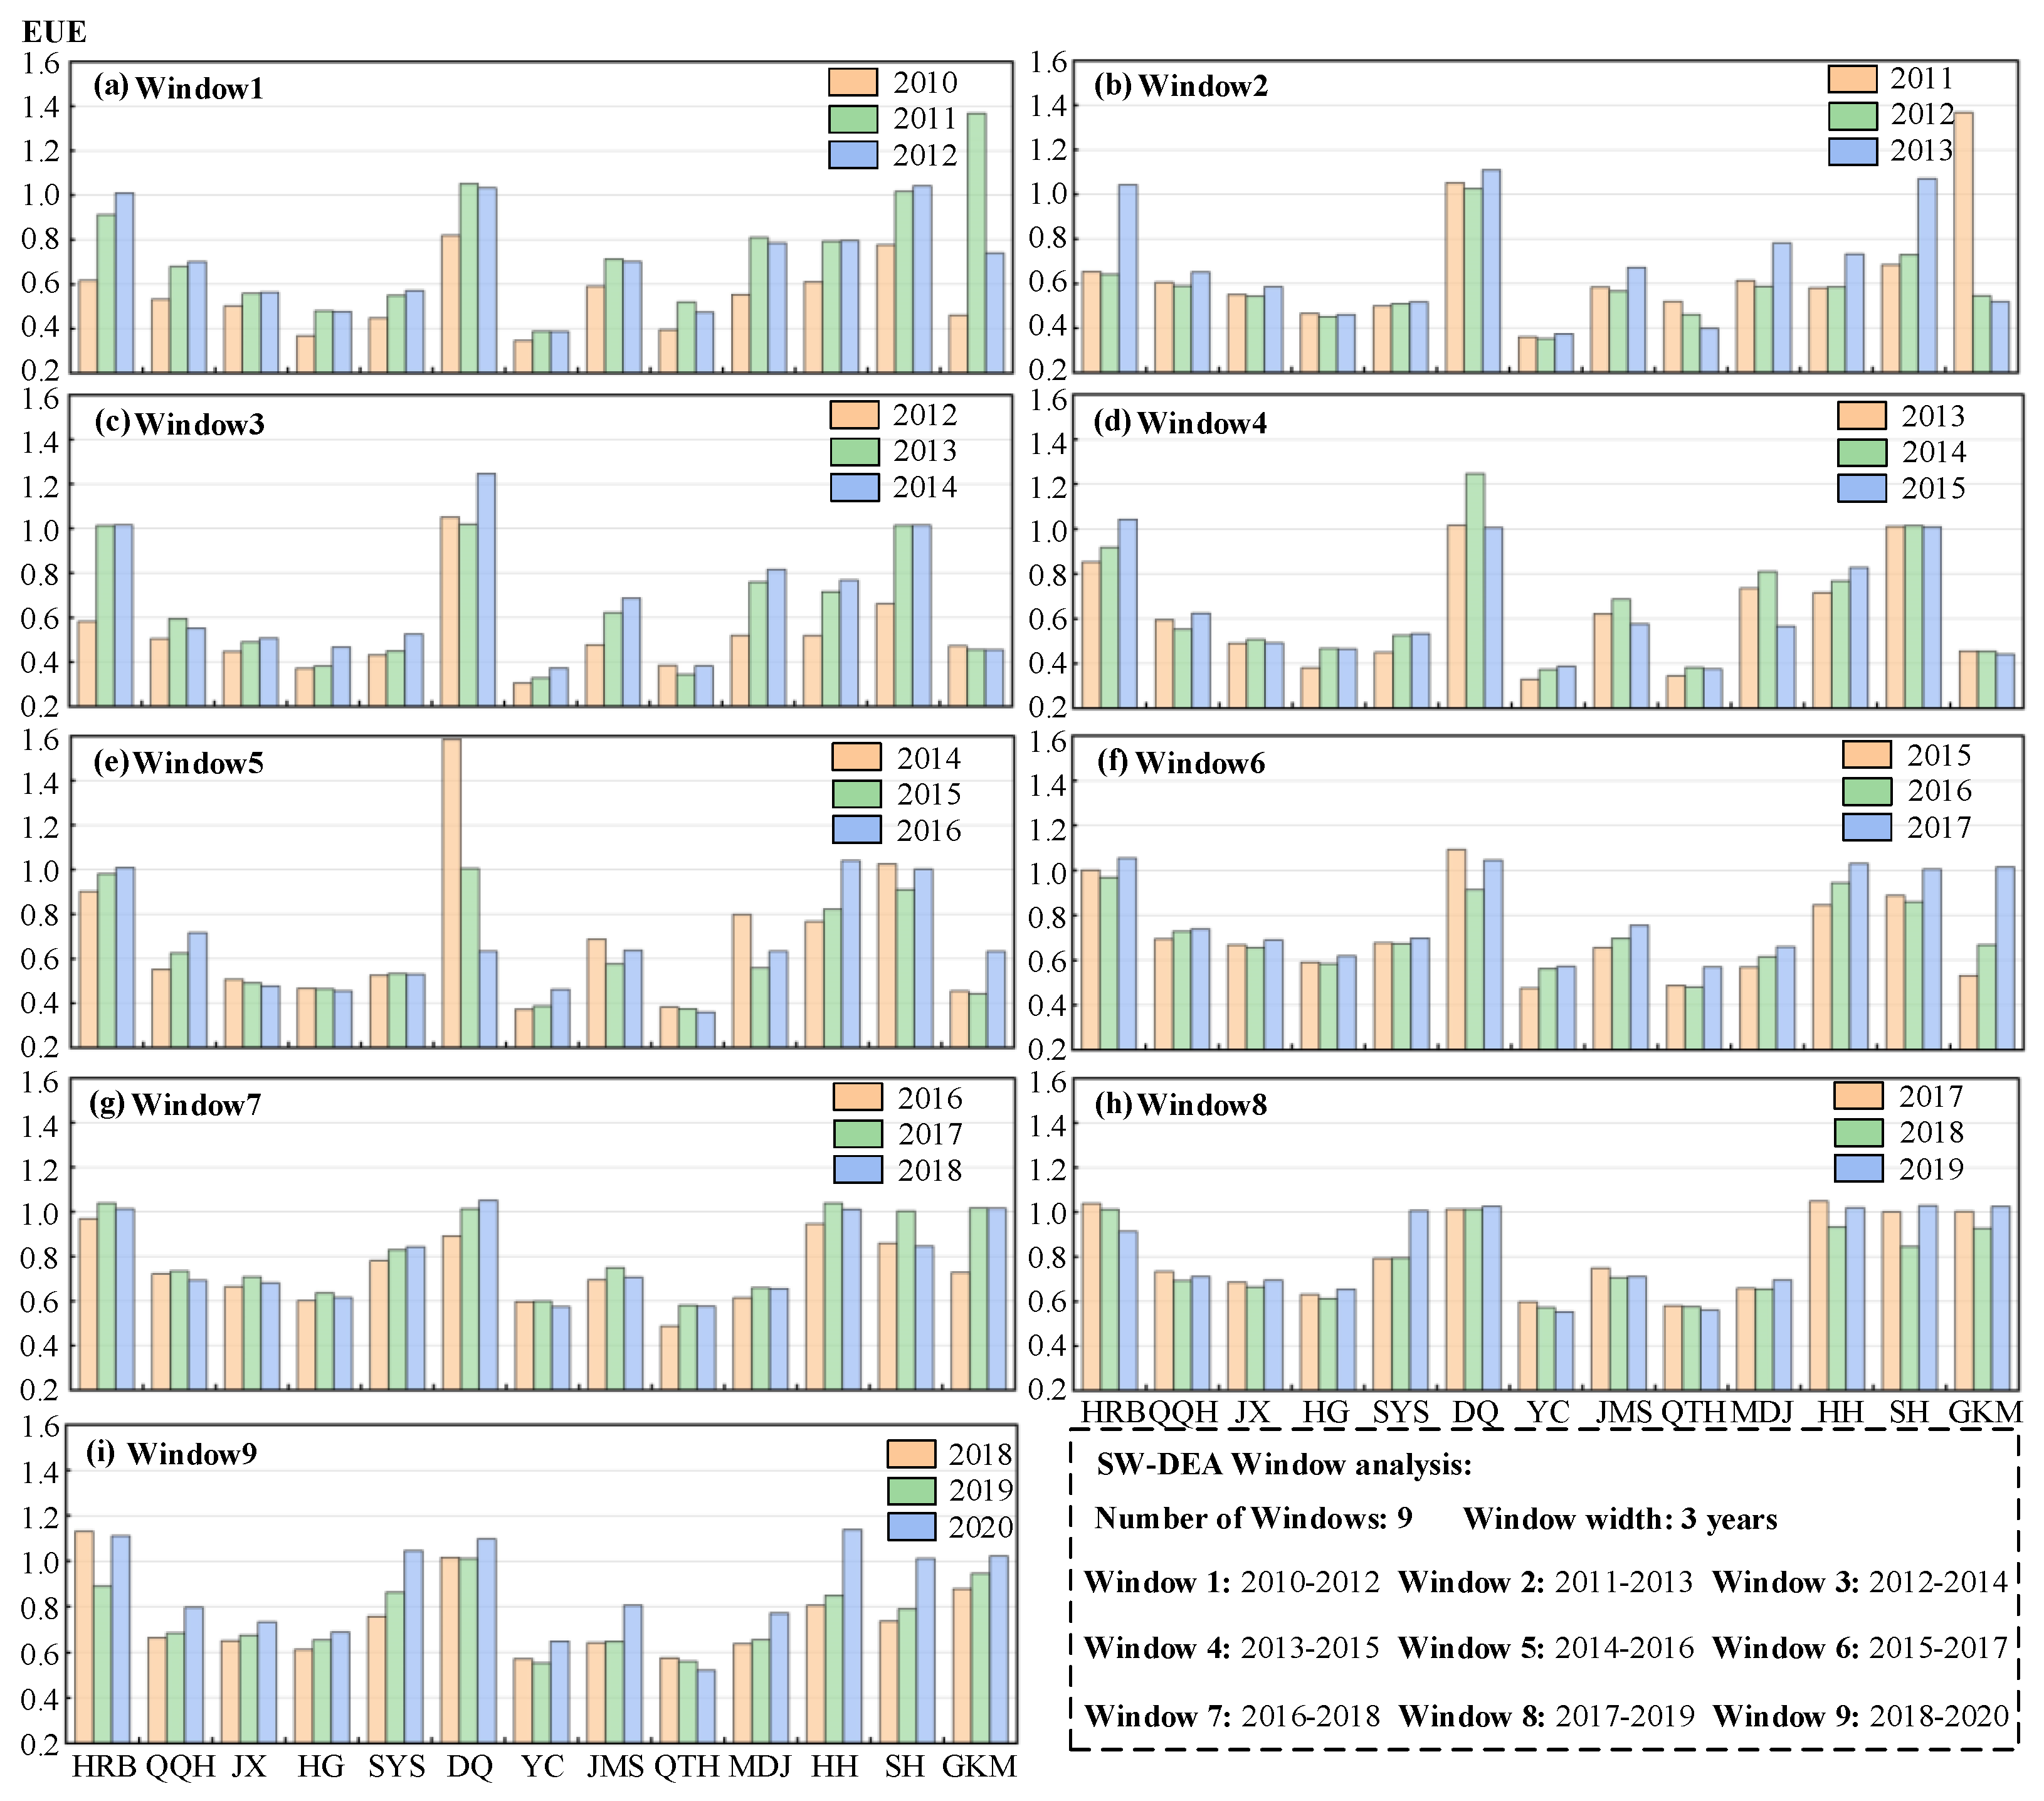
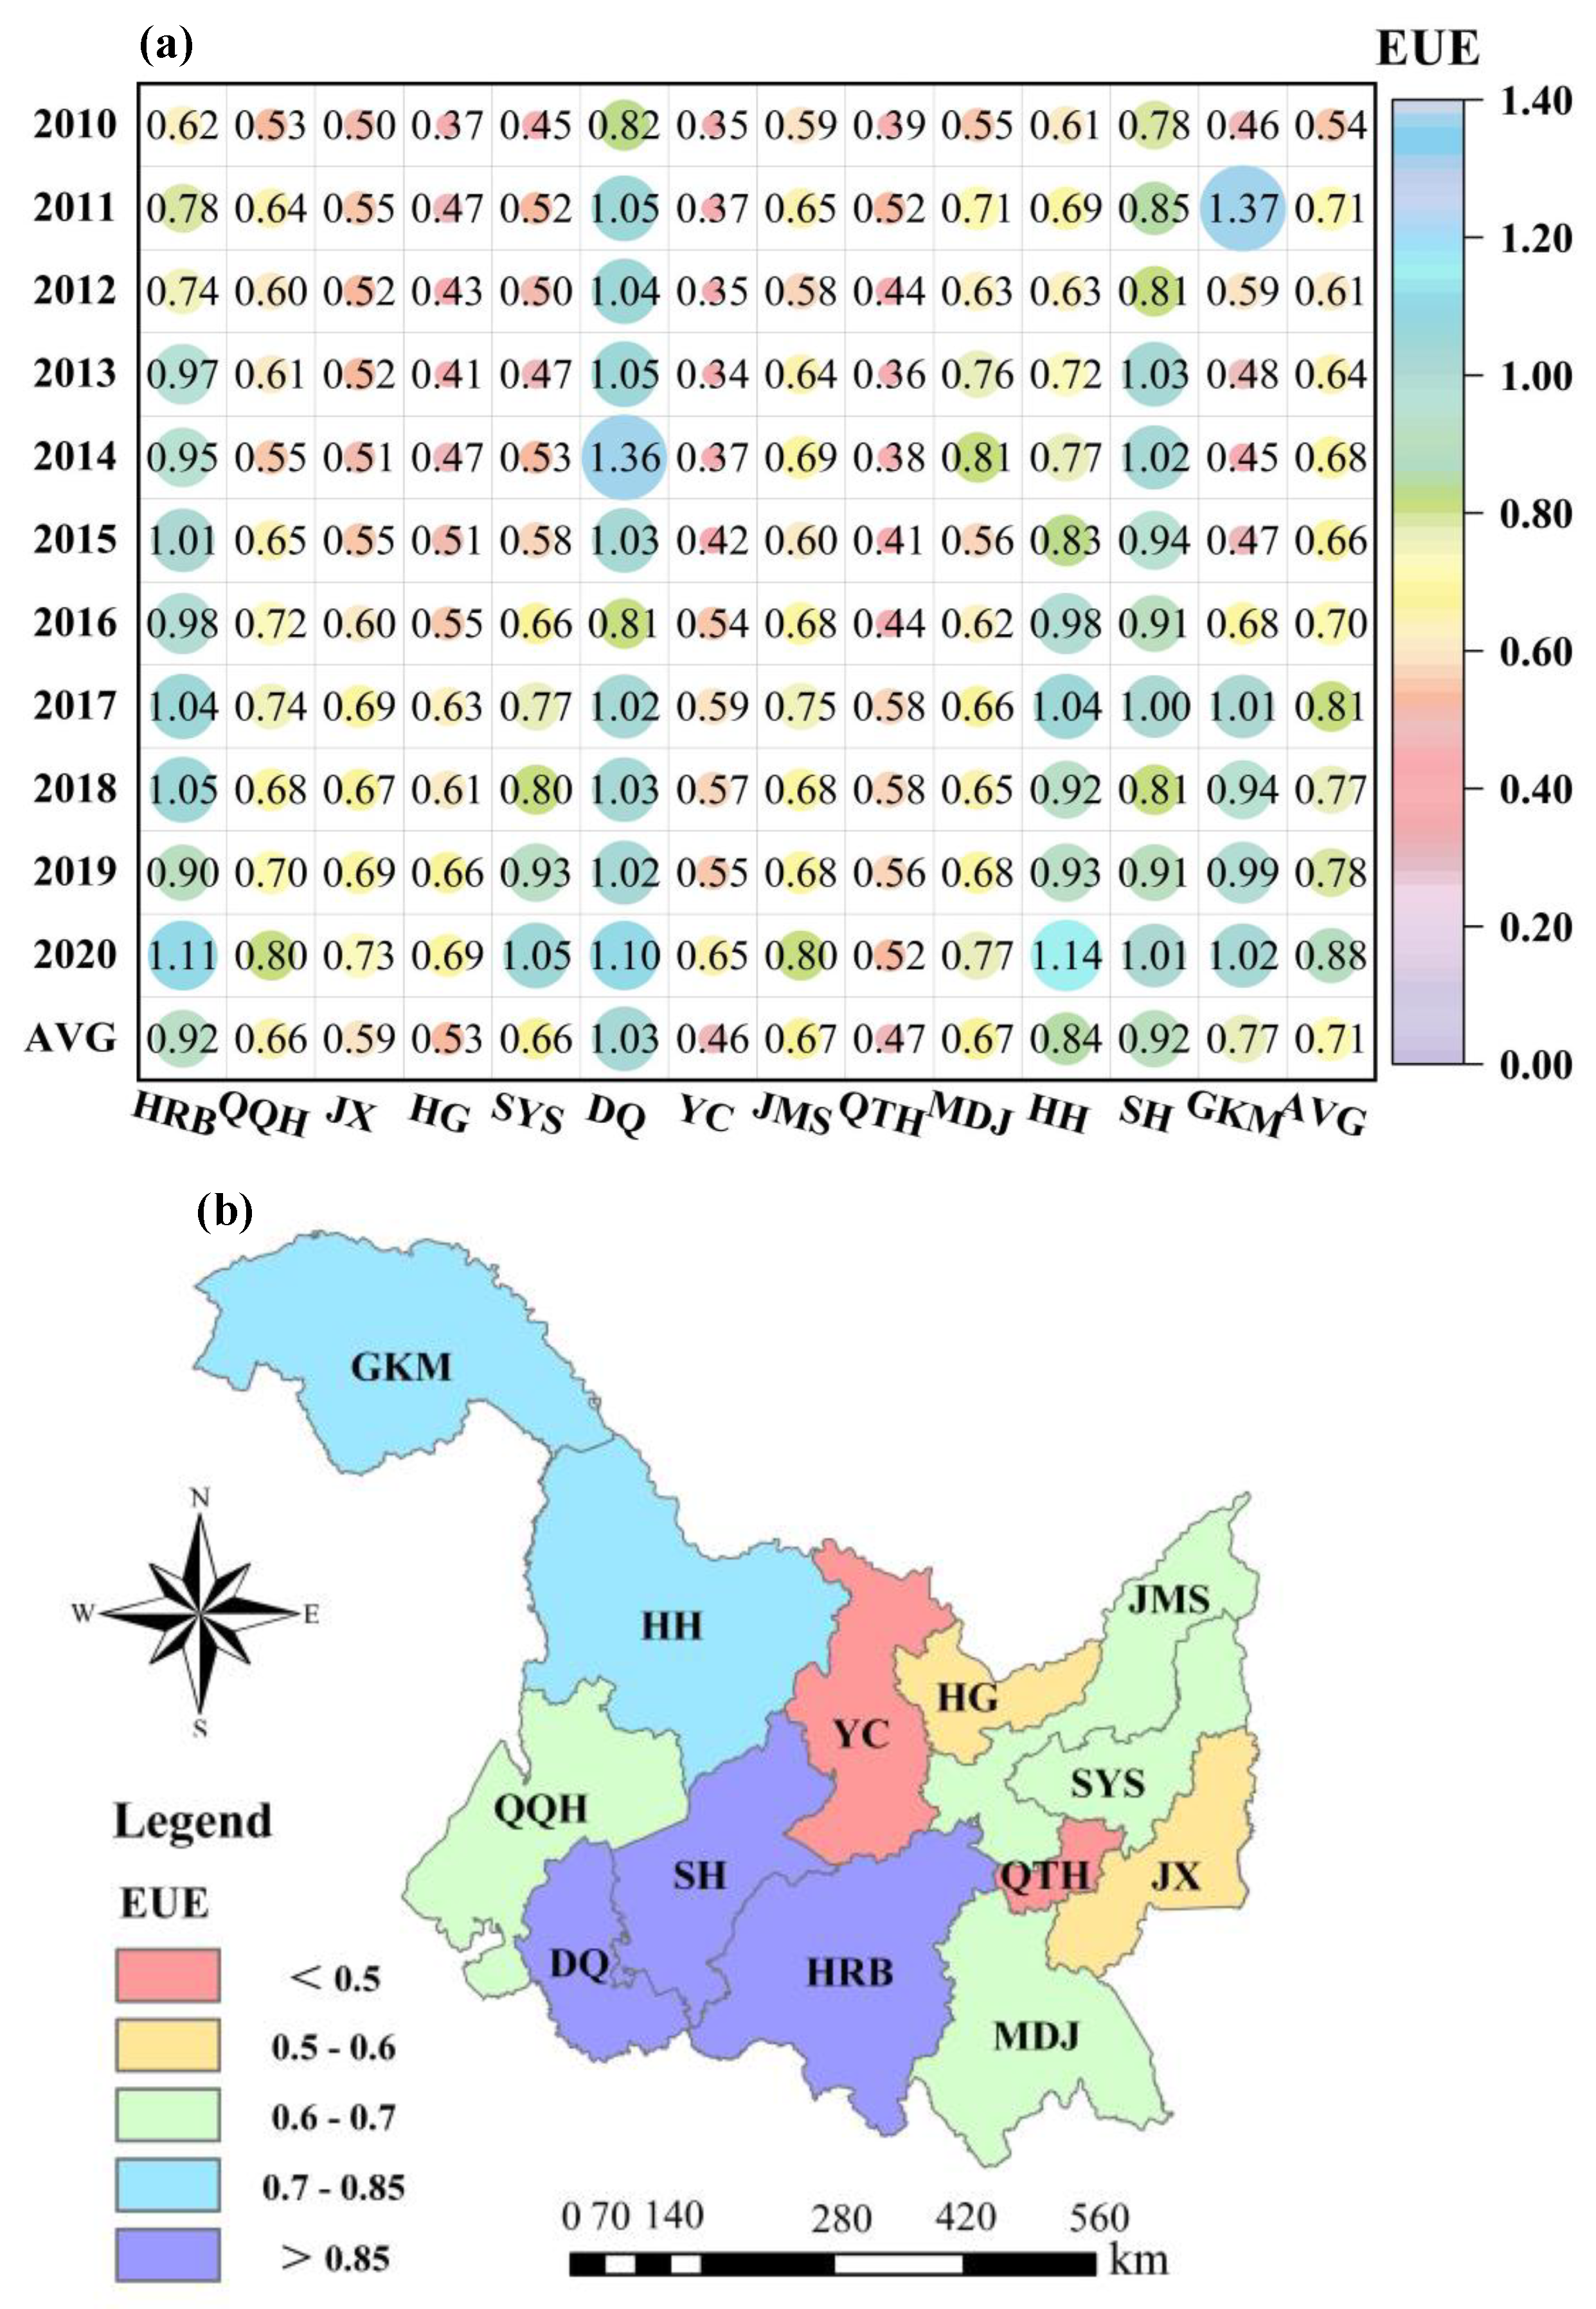
4.1. Energy Utilization Efficiency
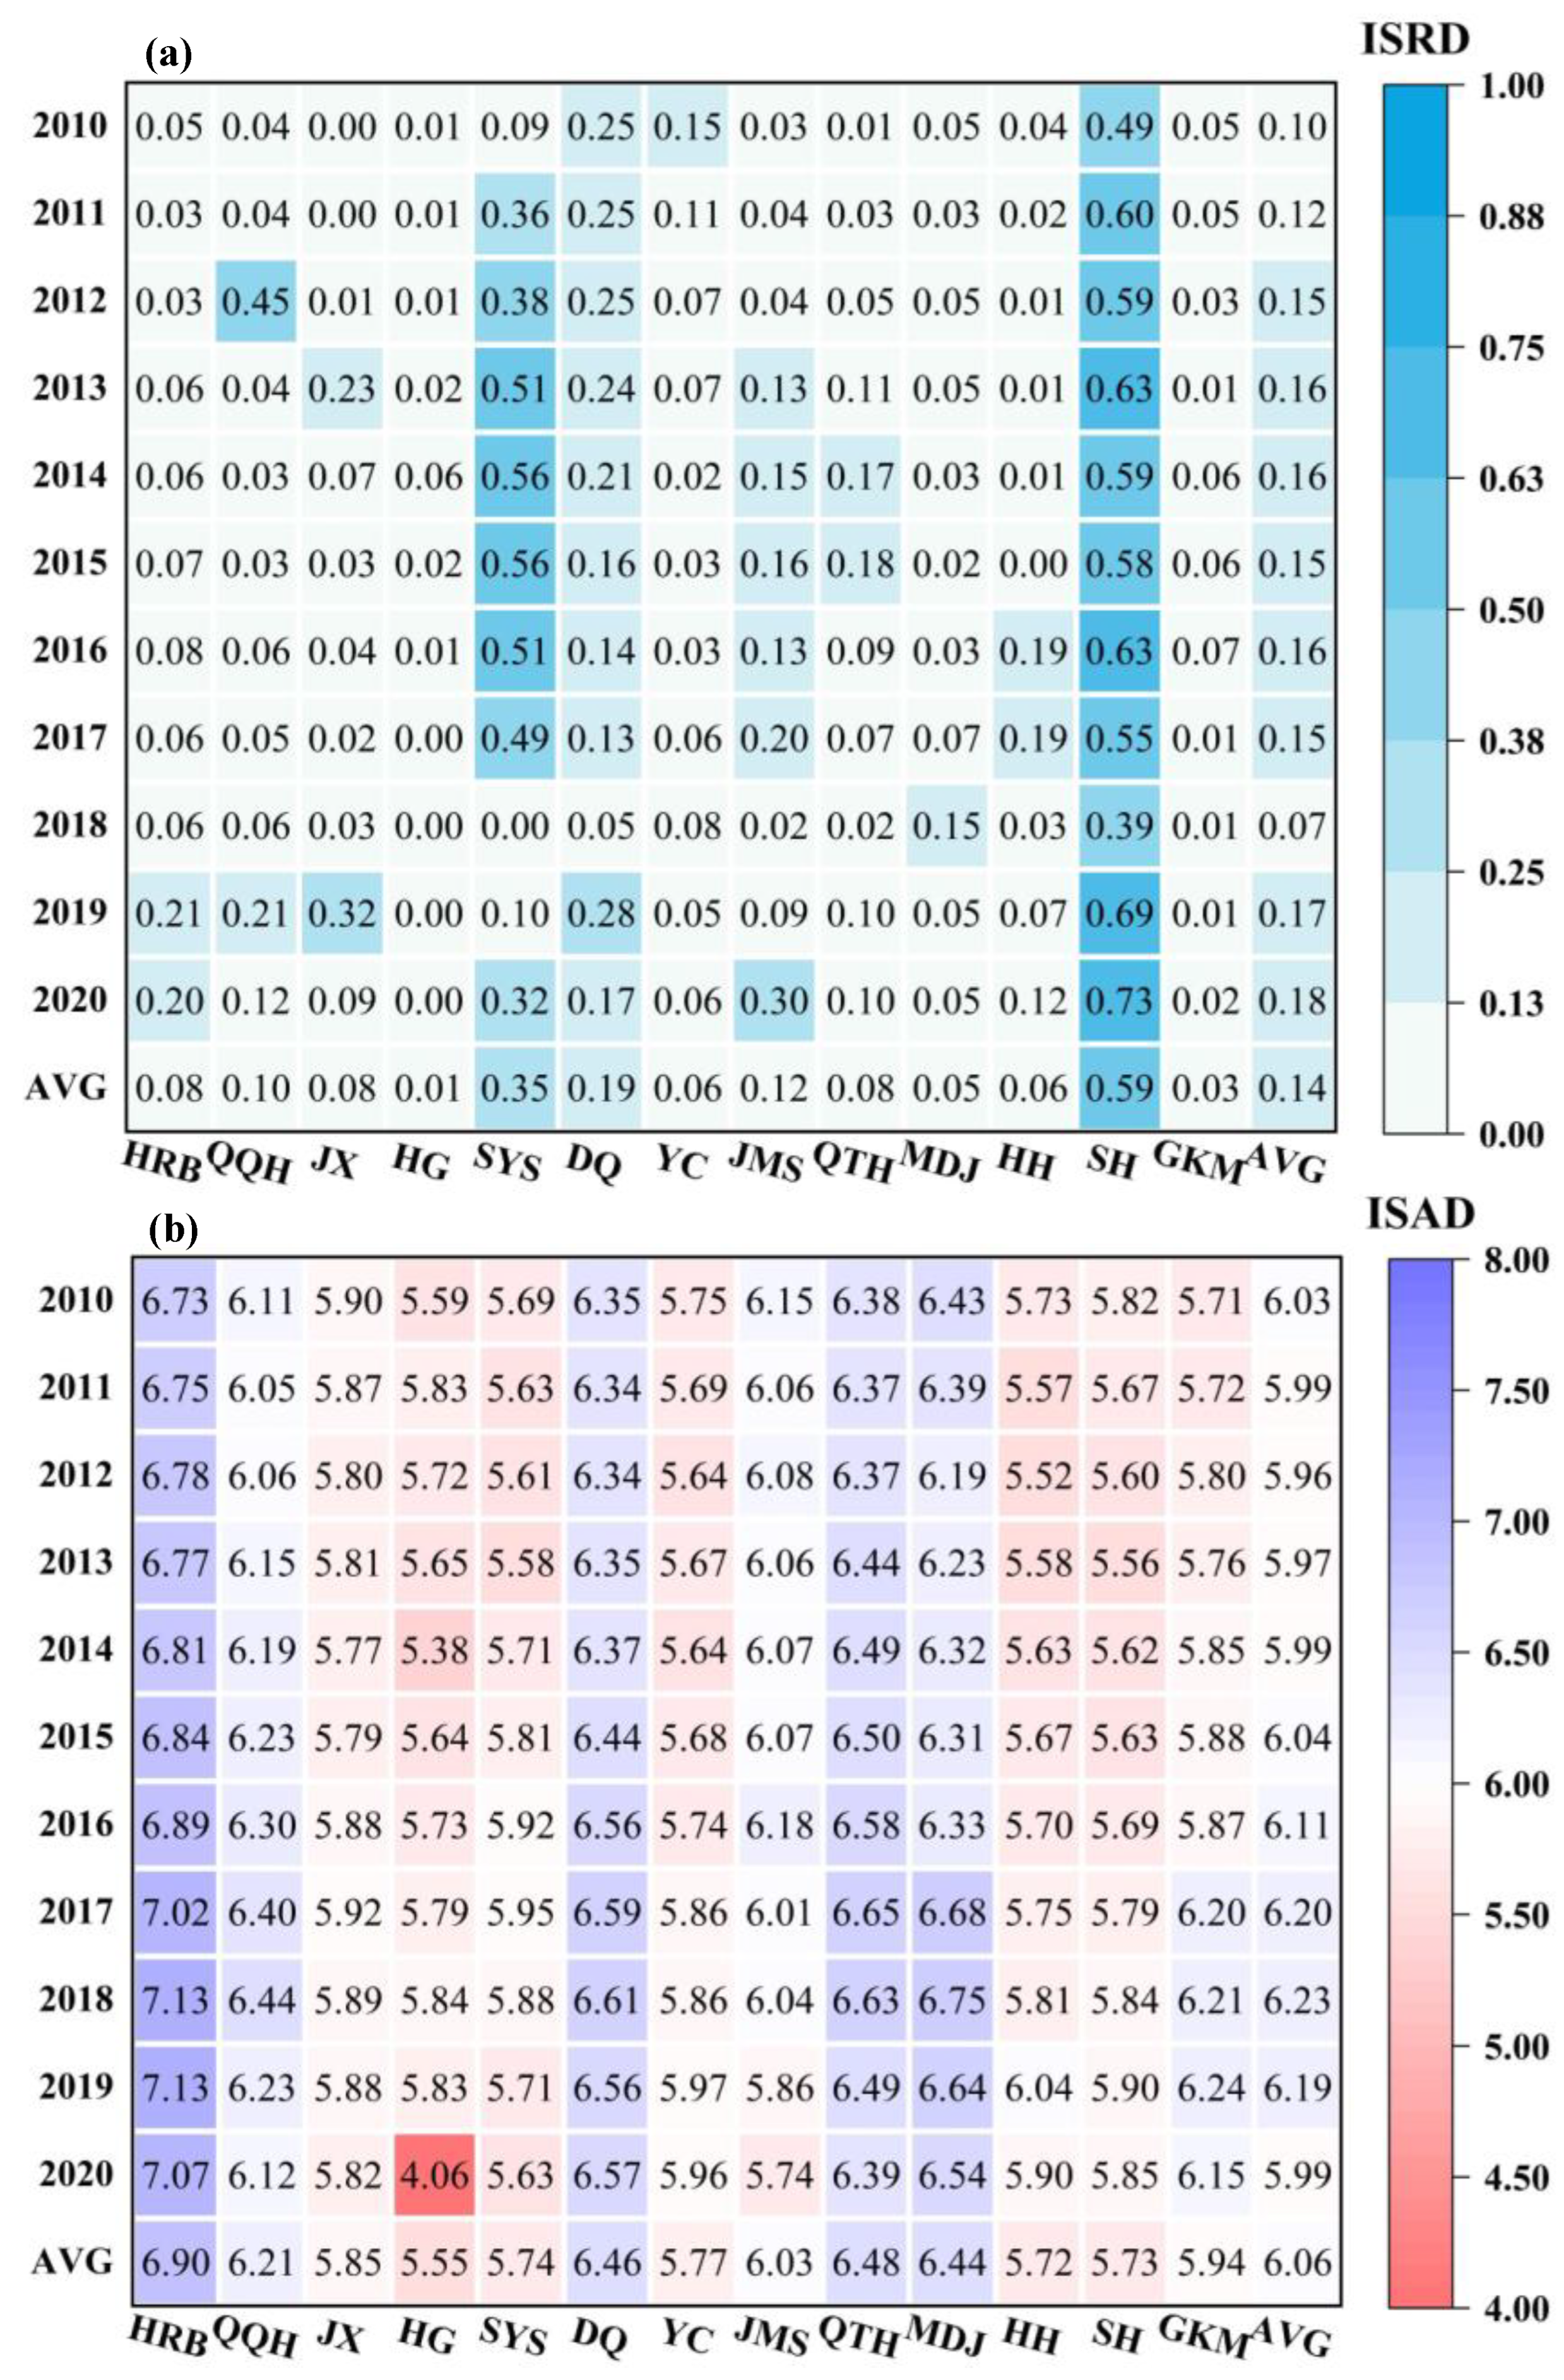
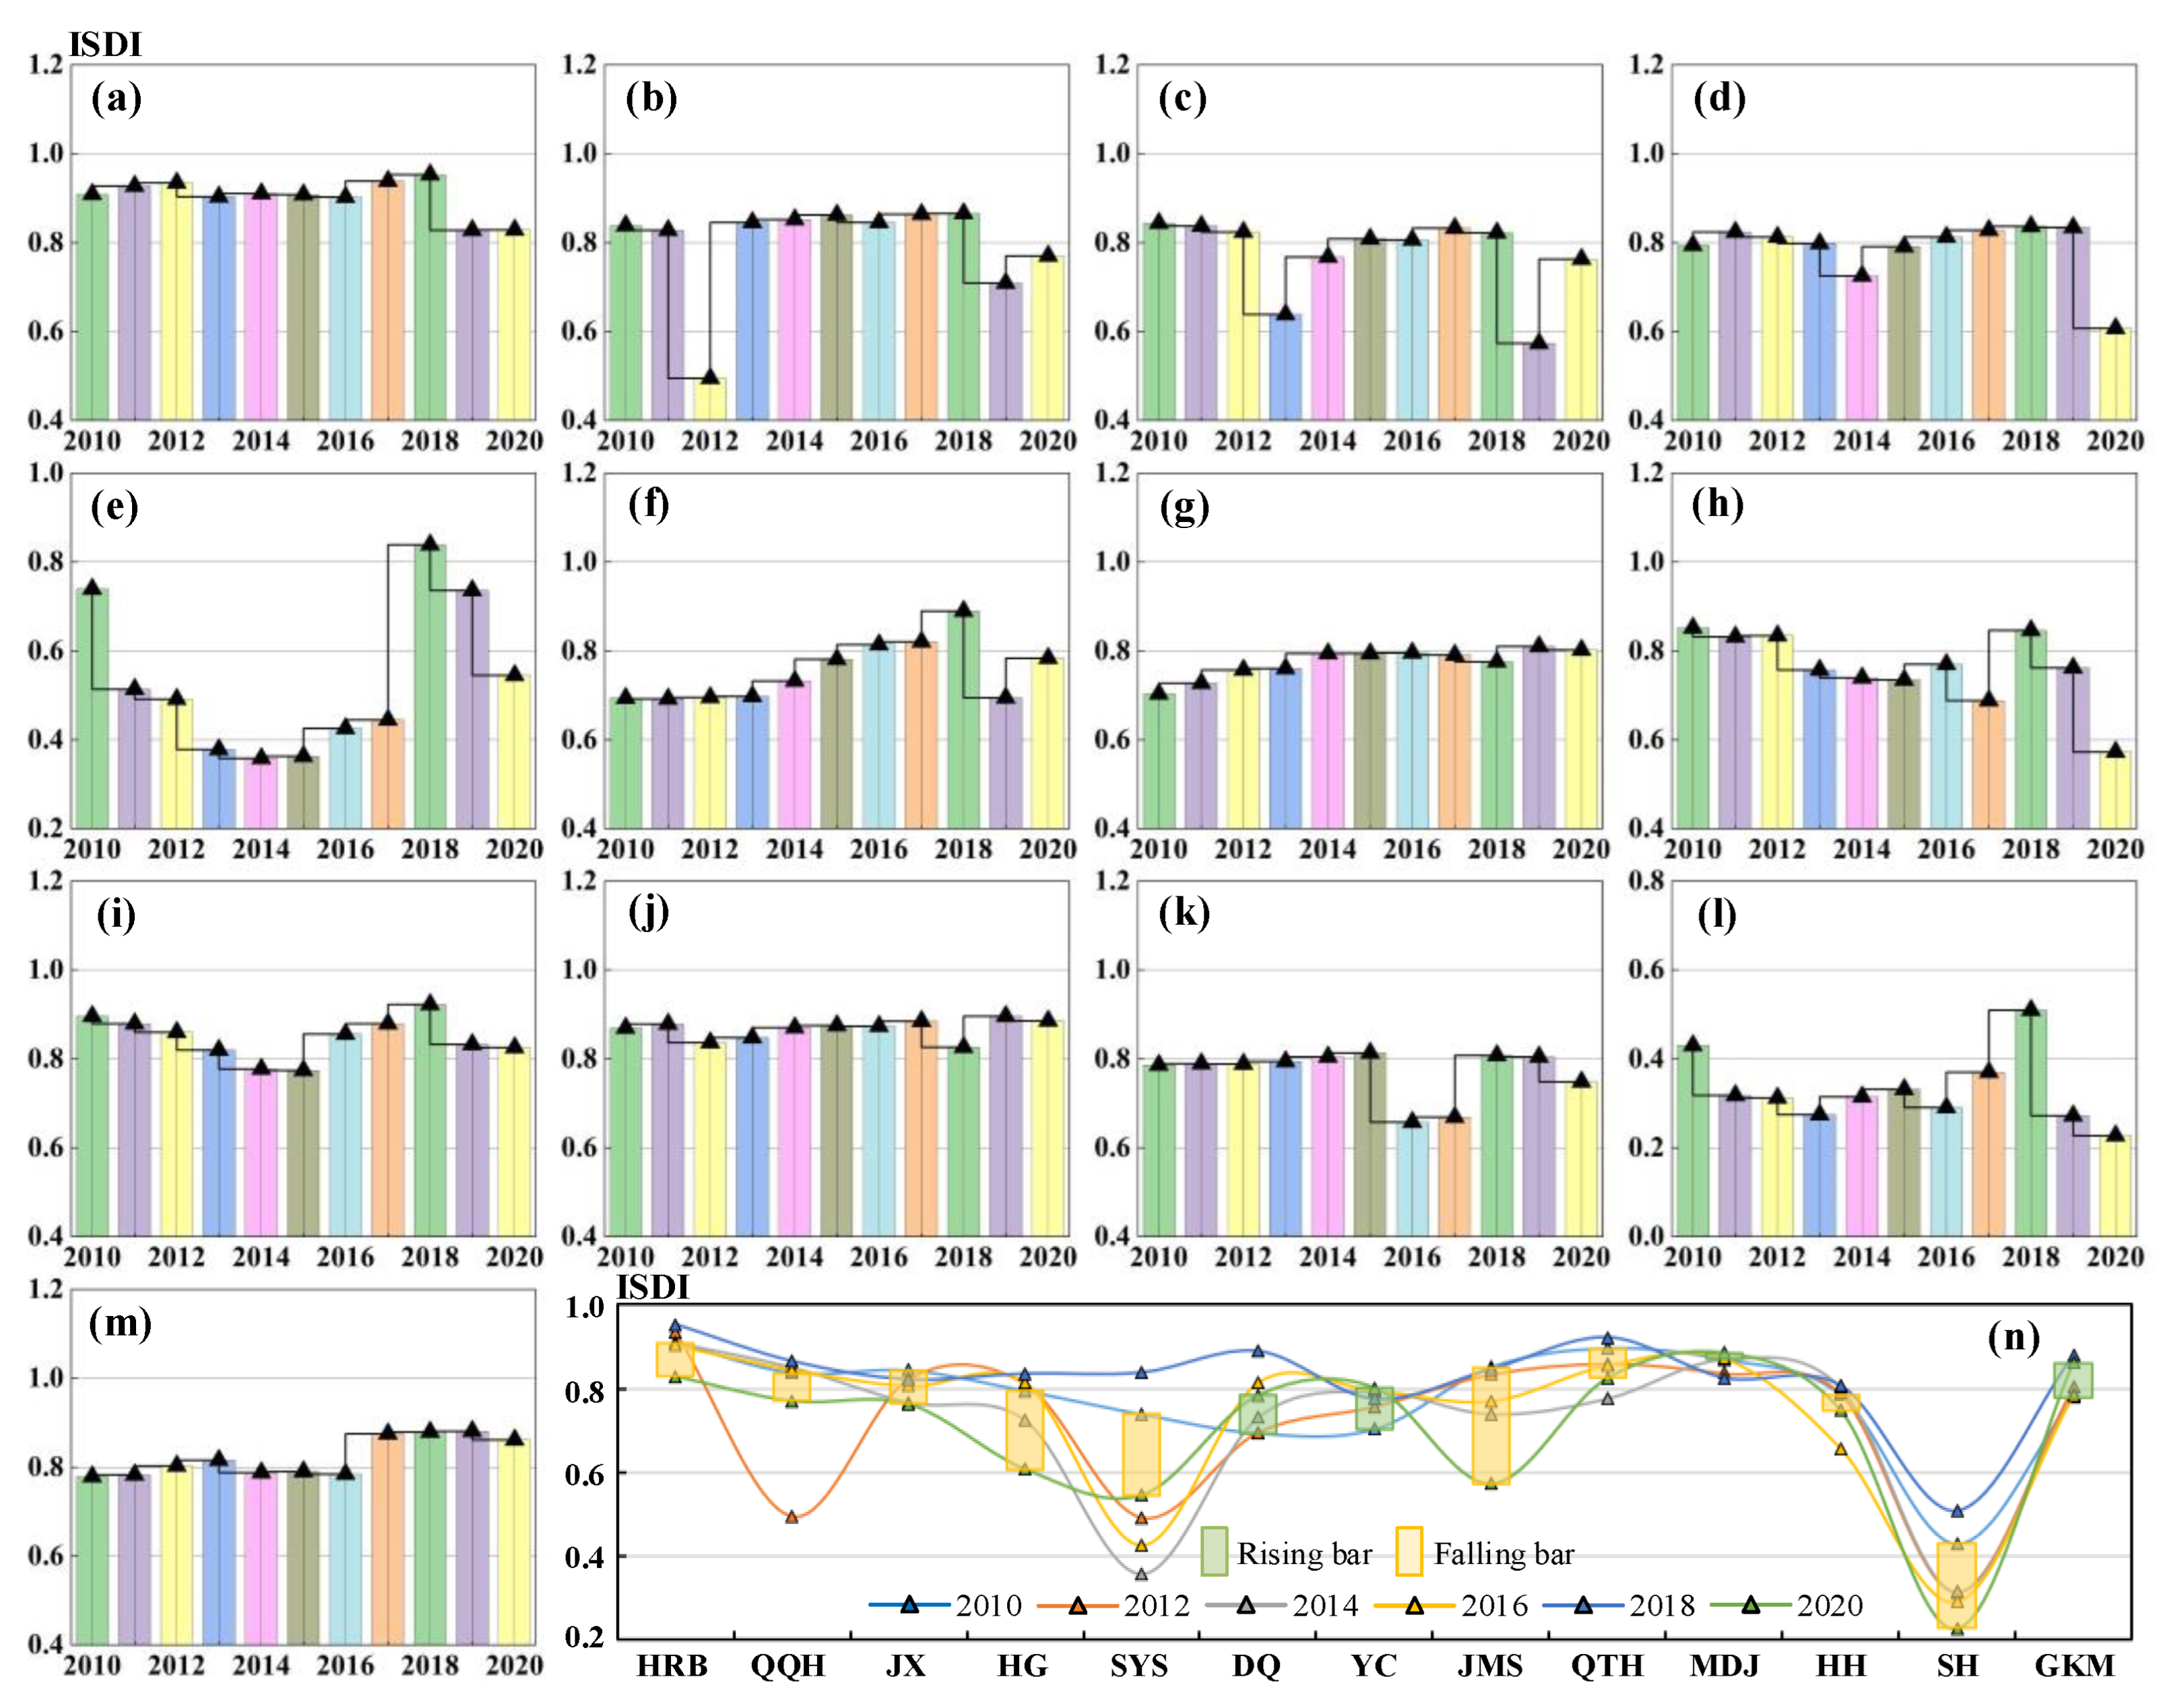
4.2. Industrial Structure Development Level
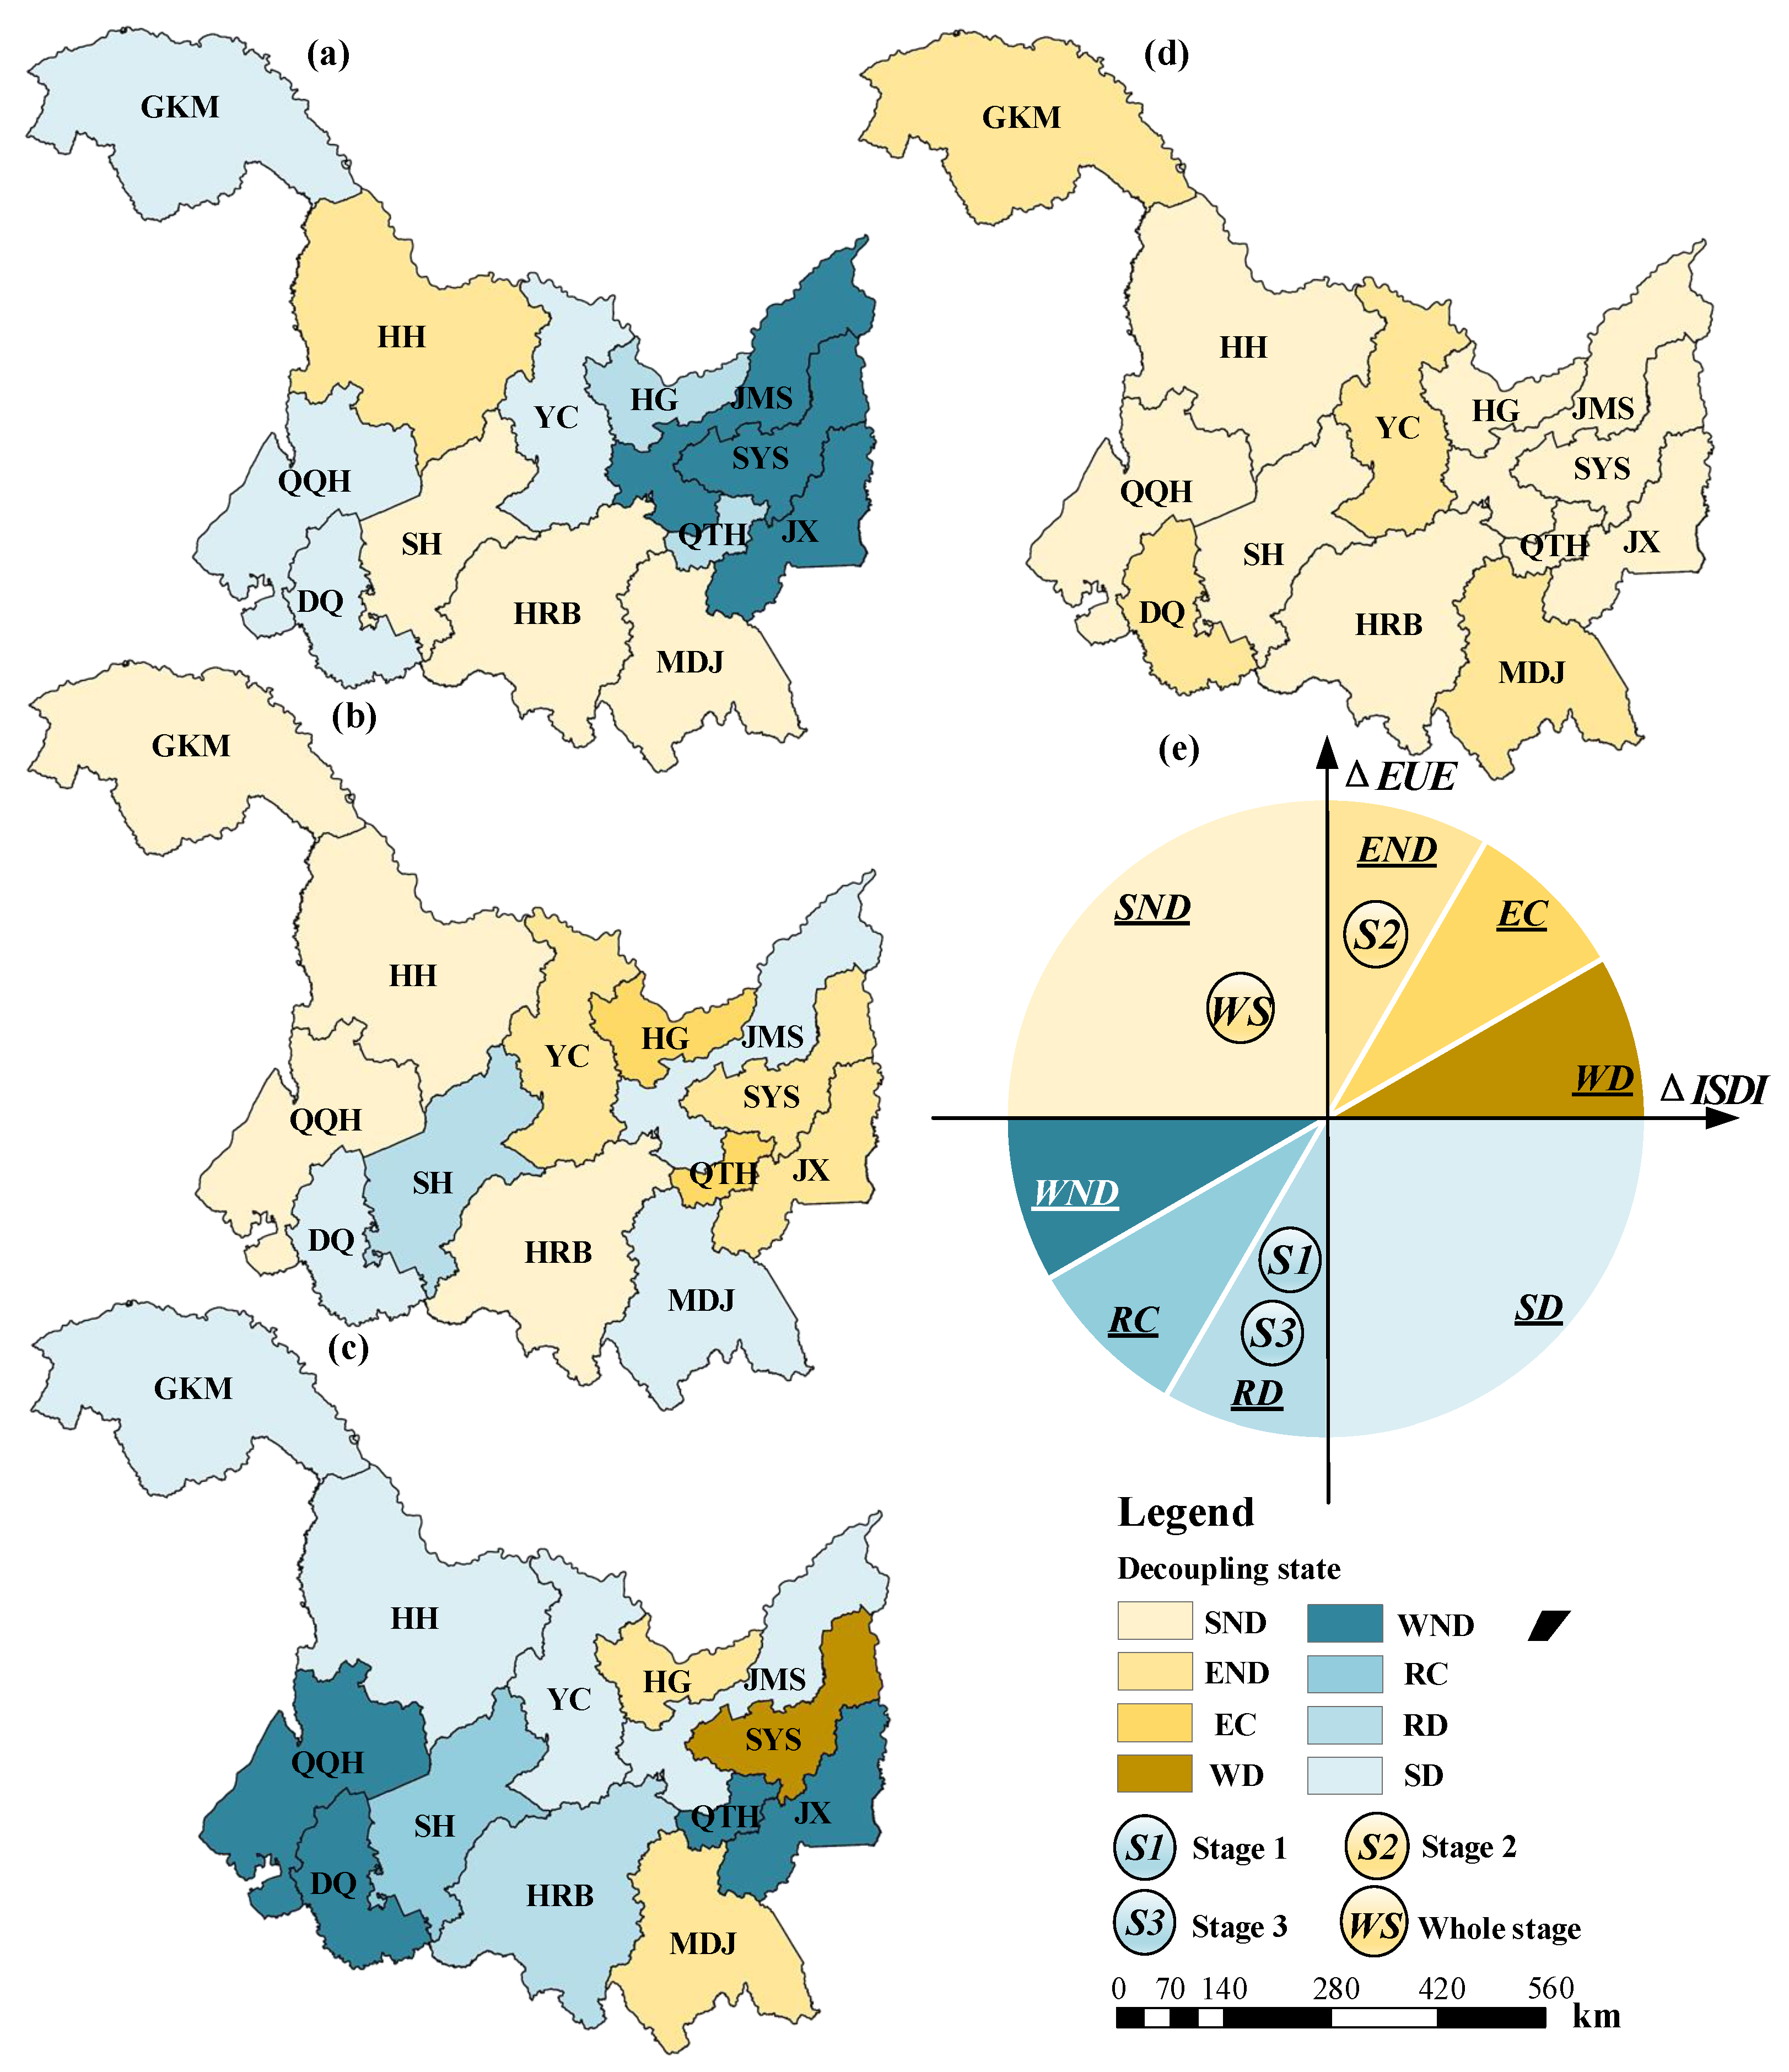
4.3. Relationship Identification between EUE and ISDI
5. Conclusions
- (1)
- The energy utilization efficiency at the urban scale in Heilongjiang Province improved overall during the study period, and the average EUE increased from 0.54 in 2010 to 0.88 in 2020. Spatial variations in energy utilization efficiency are evident, with southern cities exhibiting higher levels compared to other regions. However, the disparity among different cities has gradually diminished. Core cities, such as DQ and HRB, have consistently maintained a position at the production frontier, demonstrating remarkable advantages in terms of energy utilization efficiency.
- (2)
- The overall level of industrial structure development in Heilongjiang Province has experienced a slight downward trend, with the most significant decline observed between 2018 and 2020. The primary factor contributing to this decline is the employment–population factor. Southern cities centered around HRB exhibited a more advanced level of industrial structure development. Cities like SH and SYS showed relatively slower progress in industrial structure development, underscoring the urgency to promptly establish new industrial development orientations and drive profound optimization of the industrial structure.
- (3)
- The harmonious relationship between energy utilization and industrial structure exhibited distinct stage-based characteristics from 2010 to 2020. Overall, the harmonious relationship was predominantly characterized by strong negative decoupling, with the ISDI lagging behind the improvement in EUE. The dynamic synergy between energy utilization and industrial structure development was weak, resulting in a lack of favorable decoupling. All 13 cities demonstrated varying degrees of negative decoupling. It is essential to ensure the enhancement of energy utilization levels while promptly establishing a sustainable industrial layout and high-quality industrial structure.
Author Contributions
Funding
Institutional Review Board Statement
Informed Consent Statement
Data Availability Statement
Acknowledgments
Conflicts of Interest
References
- Energy, U.N. The Energy Challenge for Achieving the Millennium Development Goals. In United Nations Framework Convention on Climate Change; UN: New York, NY, USA, 2005; Available online: https://www.undp.org/sites/g/files/zskgke326/files/publications/The%20Energy%20Challenge%20for%20Achieving%20the%20MDGs_2005.pdf (accessed on 13 March 2023).
- Zakari, A.; Khan, I.; Tan, D.; Alvarado, R.; Dagar, V. Energy efficiency and sustainable development goals (SDGs). Energy 2022, 239, 122365. [Google Scholar] [CrossRef]
- Brockway, P.E.; Sorrell, S.; Semieniuk, G.; Heun, M.K.; Court, V. Energy efficiency and economy-wide rebound effects: A review of the evidence and its implications. Renew. Sustain. Energy Rev. 2021, 141, 110781. [Google Scholar] [CrossRef]
- Zhao, F.; Bai, F.; Liu, X.; Liu, Z. A Review on Renewable Energy Transition under China’s Carbon Neutrality Target. Sustainability 2022, 14, 15006. [Google Scholar] [CrossRef]
- The State Council of China (SC). China’s Energy Development in the New Era. 2020. Available online: http://www.gov.cn/zhengce/2020-12/21/content_5571916.htm (accessed on 13 March 2023).
- Chen, W.; Lei, Y.; Wu, S.; Li, L. Opportunities for low-carbon socioeconomic transition during the revitalization of Northeast China: Insights from Heilongjiang province. Sci. Total Environ. 2019, 683, 380–388. [Google Scholar] [CrossRef]
- Hepburn, C.; Qi, Y.; Stern, N.; Ward, B.; Xie, C.; Zenghelis, D. Towards carbon neutrality and China’s 14th Five-Year Plan: Clean energy transition, sustainable urban development, and investment priorities. Environ. Sci. Ecotechnol. 2021, 8, 100130. [Google Scholar] [CrossRef]
- Zhang, A.; Zhong, R.Y.; Farooque, M.; Kang, K.; Venkatesh, V.G. Blockchain-based life cycle assessment: An implementation framework and system architecture. Resour. Conserv. Recycl. 2020, 152, 104512. [Google Scholar] [CrossRef]
- Jin, T.; Kim, J. A comparative study of energy and carbon efficiency for emerging countries using panel stochastic frontier analysis. Sci. Rep. 2019, 9, 6647. [Google Scholar] [CrossRef] [Green Version]
- Xu, T.; You, J.; Li, H.; Shao, L. Energy efficiency evaluation based on data envelopment analysis: A literature review. Energies 2020, 13, 3548. [Google Scholar] [CrossRef]
- Wang, L.W.; Le, K.D.; Nguyen, T.D. Assessment of the energy efficiency improvement of twenty-five countries: A DEA approach. Energies 2019, 12, 1535. [Google Scholar] [CrossRef] [Green Version]
- Zhang, C.; Chen, P. Applying the three-stage SBM-DEA model to evaluate energy efficiency and impact factors in RCEP countries. Energy 2022, 241, 122917. [Google Scholar] [CrossRef]
- Jebali, E.; Essid, H.; Khraief, N. The analysis of energy efficiency of the Mediterranean countries: A two-stage double bootstrap DEA approach. Energy 2017, 134, 991–1000. [Google Scholar] [CrossRef]
- Ren, F.R.; Tian, Z.; Pan, J.J.; Chiu, Y.H. Cross-regional comparative study on energy efficiency evaluation in the Yangtze River Basin of China. Environ. Sci. Pollut. Res. 2020, 27, 34037–34051. [Google Scholar] [CrossRef]
- Ma, M.; Wang, Q. Assessment and forecast of green total factor energy efficiency in the yellow river basin—A perspective distinguishing the upper, middle and lower stream. Sustainability 2022, 14, 2506. [Google Scholar] [CrossRef]
- Zhao, H.; Guo, S.; Zhao, H. Provincial energy efficiency of China quantified by three-stage data envelopment analysis. Energy 2019, 166, 96–107. [Google Scholar] [CrossRef]
- Li, Y.; Liu, A.C.; Wang, S.M.; Zhan, Y.; Chen, J.; Hsiao, H.F. A Study of Total-Factor Energy Efficiency for Regional Sustainable Development in China: An Application of Bootstrapped DEA and Clustering Approach. Energies 2022, 15, 3093. [Google Scholar] [CrossRef]
- Wang, H.; Wang, M. Effects of technological innovation on energy efficiency in China: Evidence from dynamic panel of 284 cities. Sci. Total Environ. 2020, 709, 136172. [Google Scholar] [CrossRef]
- Keirstead, J. Benchmarking urban energy efficiency in the UK. Energy Policy 2013, 63, 575–587. [Google Scholar] [CrossRef]
- Pan, X.; Guo, S.; Han, C.; Wang, M.; Song, J.; Liao, X. Influence of FDI quality on energy efficiency in China based on seemingly unrelated regression method. Energy 2020, 192, 116463. [Google Scholar] [CrossRef]
- Eguchi, S.; Takayabu, H.; Lin, C. Sources of inefficient power generation by coal-fired thermal power plants in China: A metafrontier DEA decomposition approach. Renew. Sustain. Energy Rev. 2021, 138, 110562. [Google Scholar] [CrossRef]
- Sueyoshi, T.; Yuan, Y.; Goto, M. A literature study for DEA applied to energy and environment. Energy Econ. 2017, 62, 104–124. [Google Scholar] [CrossRef]
- Aldieri, L.; Grafström, J.; Vinci, C.P. The effect of Marshallian and Jacobian knowledge spillovers on jobs in the solar, wind and energy efficiency sector. Energies 2021, 14, 4269. [Google Scholar] [CrossRef]
- Ślusarz, G.; Gołębiewska, B.; Cierpiał-Wolan, M.; Gołębiewski, J.; Twaróg, D.; Wójcik, S. Regional diversification of potential, production and efficiency of use of biogas and biomass in Poland. Energies 2021, 14, 742. [Google Scholar] [CrossRef]
- Chen, Y.; Wong, C.W.; Yang, R.; Miao, X. Optimal structure adjustment strategy, emission reduction potential and utilization efficiency of fossil energies in China. Energy 2021, 237, 121623. [Google Scholar] [CrossRef]
- Meng, M.; Qu, D. Understanding the green energy efficiencies of provinces in China: A Super-SBM and GML analysis. Energy 2022, 239, 121912. [Google Scholar] [CrossRef]
- Wang, X.; Wang, Q. Research on the impact of green finance on the upgrading of China’s regional industrial structure from the perspective of sustainable development. Resour. Policy 2021, 74, 102436. [Google Scholar] [CrossRef]
- Chen, M.; Chen, R.; Zheng, S.; Li, B. Green Investment, Technological Progress, and Green Industrial Development: Implications for Sustainable Development. Sustainability 2023, 15, 3808. [Google Scholar] [CrossRef]
- Zhang, H.; Zhang, J.; Song, J. Analysis of the threshold effect of agricultural industrial agglomeration and industrial structure upgrading on sustainable agricultural development in China. J. Clean. Prod. 2022, 341, 130818. [Google Scholar] [CrossRef]
- Svensson, O.; Khan, J.; Hildingsson, R. Studying industrial decarbonisation: Developing an interdisciplinary understanding of the conditions for transformation in energy-intensive natural resource-based industry. Sustainability 2020, 12, 2129. [Google Scholar] [CrossRef] [Green Version]
- Zhang, Y.; Dilanchiev, A. Economic recovery, industrial structure and natural resource utilization efficiency in China: Effect on green economic recovery. Resour. Policy 2022, 79, 102958. [Google Scholar] [CrossRef]
- Muhammad, S.; Pan, Y.; Agha, M.H.; Umar, M.; Chen, S. Industrial structure, energy intensity and environmental efficiency across developed and developing economies: The intermediary role of primary, secondary and tertiary industry. Energy 2022, 247, 123576. [Google Scholar] [CrossRef]
- Wan, L.; Zheng, Q.; Wu, J.; Wei, Z.; Wang, S. How does the ecological compensation mechanism adjust the industrial structure? Evidence from China. J. Environ. Manag. 2022, 301, 113839. [Google Scholar] [CrossRef]
- Hu, W.; Tian, J.; Chen, L. An industrial structure adjustment model to facilitate high-quality development of an eco-industrial park. Sci. Total Environ. 2021, 766, 142502. [Google Scholar] [CrossRef]
- Wang, Q.; Wang, X.; Liu, Y.; Li, R. Urbanization and water consumption at national-and subnational-scale: The roles of structural changes in economy, population, and resources. Sustain. Cities Soc. 2021, 75, 103272. [Google Scholar] [CrossRef]
- Ren, S.; Hao, Y.; Xu, L.; Wu, H.; Ba, N. Digitalization and energy: How does internet development affect China’s energy consumption? Energy Econ. 2021, 98, 105220. [Google Scholar] [CrossRef]
- Zhu, B.; Zhang, T. The impact of cross-region industrial structure optimization on economy, carbon emissions and energy consumption: A case of the Yangtze River Delta. Sci. Total Environ. 2021, 778, 146089. [Google Scholar] [CrossRef]
- Li, B.; Wang, Z.; Xu, F. Does Optimization of Industrial Structure Improve Green Efficiency of Industrial Land Use in China? Int. J. Environ. Res. Public Health 2022, 19, 9177. [Google Scholar] [CrossRef]
- Mi, Z.; Sun, X. Provinces with transitions in industrial structure and energy mix performed best in climate change mitigation in China. Commun. Earth Environ. 2021, 2, 182. [Google Scholar] [CrossRef]
- Mi, Z.F.; Pan, S.Y.; Yu, H.; Wei, Y.M. Potential impacts of industrial structure on energy consumption and CO2 emission: A case study of Beijing. J. Clean. Prod. 2015, 103, 455–462. [Google Scholar] [CrossRef] [Green Version]
- Pishdar, M.; Danesh Shakib, M.; Antucheviciene, J.; Vilkonis, A. Interval type-2 fuzzy super sbm network dea for assessing sustainability performance of third-party logistics service providers considering circular economy strategies in the era of industry 4.0. Sustainability 2021, 13, 6497. [Google Scholar] [CrossRef]
- Andersen, P.; Petersen, N.C. A procedure for ranking efficient units in data envelopment analysis. Manag. Sci. 1993, 39, 1261–1264. [Google Scholar] [CrossRef]
- Halkos, G.E.; Tzeremes, N.G. Exploring the existence of Kuznets curve in countries’ environmental efficiency using DEA window analysis. Ecol. Econ. 2009, 68, 2168–2176. [Google Scholar] [CrossRef]
- Du, K.; Cheng, Y.; Yao, X. Environmental regulation, green technology innovation, and industrial structure upgrading: The road to the green transformation of Chinese cities. Energy Econ. 2021, 98, 105247. [Google Scholar] [CrossRef]
- Miśkiewicz, J. Globalization—Entropy unification through the Theil index. Phys. A Stat. Mech. Its Appl. 2008, 387, 6595–6604. [Google Scholar] [CrossRef]
- Tian, Q.; Zhao, T.; Yuan, R. An overview of the inequality in China’s carbon intensity 1997–2016: A Theil index decomposition analysis. Clean Technol. Environ. Policy 2021, 23, 1581–1601. [Google Scholar] [CrossRef]
- Xin-gang, Z.; Fan, L. Spatial distribution characteristics and convergence of China’s regional energy intensity: An industrial transfer perspective. J. Clean. Prod. 2019, 233, 903–917. [Google Scholar] [CrossRef]
- Li, Y.; Wei, M.; Liu, L.; Yu, B.; Dong, Z.; Xue, Q. Evaluation of the effectiveness of VOC-contaminated soil preparation based on AHP-CRITIC-TOPSIS model. Chemosphere 2021, 271, 129571. [Google Scholar] [CrossRef]
- Tapio, P. Towards a theory of decoupling: Degrees of decoupling in the EU and the case of road traffic in Finland between 1970 and 2001. Transp. Policy 2005, 12, 137–151. [Google Scholar] [CrossRef] [Green Version]
- Liu, F.; Kang, Y.; Guo, K. Is electricity consumption of Chinese counties decoupled from carbon emissions? A study based on Tapio decoupling index. Energy 2022, 251, 123879. [Google Scholar] [CrossRef]
- Pan, Z.; Fang, Z.; Chen, J.; Hong, J.; Xu, Y.; Yang, S. Driving factors of decoupling between economic development and water consumption in food and energy in north-west China—Based on the tapio-lmdi method. Water 2021, 13, 917. [Google Scholar] [CrossRef]
- Qi, J.; Hu, M.; Han, B.; Zheng, J.; Wang, H. Decoupling Relationship between Industrial Land Expansion and Economic Development in China. Land 2022, 11, 1209. [Google Scholar] [CrossRef]
- Chen, Y.; Zhao, J.; Lai, Z.; Wang, Z.; Xia, H. Exploring the effects of economic growth, and renewable and non-renewable energy consumption on China’s CO2 emissions: Evidence from a regional panel analysis. Renew. Energy 2019, 140, 341–353. [Google Scholar] [CrossRef]
- Chen, C.; Xue, B.; Cai, G.; Thomas, H.; Stückrad, S. Comparing the energy transitions in Germany and China: Synergies and recommendations. Energy Rep. 2019, 5, 1249–1260. [Google Scholar] [CrossRef]
- Feng, J.; Hong, G.; Qian, W.; Hu, R.; Shi, G. Aging in China: An international and domestic comparative study. Sustainability 2020, 12, 5086. [Google Scholar] [CrossRef]
- Lv, D.; Gao, H.; Zhang, Y. Rural economic development based on shift-share analysis in a developing country: A case study in Heilongjiang Province, China. Sustainability 2021, 13, 1969. [Google Scholar] [CrossRef]
- Zhang, F.; Deng, X.; Phillips, F.; Fang, C.; Wang, C. Impacts of industrial structure and technical progress on carbon emission intensity: Evidence from 281 cities in China. Technol. Forecast. Soc. Chang. 2020, 154, 119949. [Google Scholar] [CrossRef]
- Ma, X.; Liu, Y.; Wei, X.; Li, Y.; Zheng, M.; Li, Y.; Cheng, C.; Wu, Y.; Liu, Z.; Yu, Y. Measurement and decomposition of energy efficiency of Northeast China—Based on super efficiency DEA model and Malmquist index. Environ. Sci. Pollut. Res. 2017, 24, 19859–19873. [Google Scholar] [CrossRef]

| Study | Scope | Method |
|---|---|---|
| Wang et al. (2019) [11] | 25 countries | SBM model and Malmquist Index |
| Zhang and Chen (2022) [12] | 13 RECP countries | Three-stage SBM model |
| Jebali et al. (2017) [13] | Mediterranean countries | Two-stage bootstrap DEA model |
| Ren et al. (2020) [14] | 30 provinces, China | Metafrontier DEA model |
| Ma and Wang (2022) [15] | 96 cities, China | Super-EBM model |
| Zhao et al. (2019) [16] | 30 provinces, China | Three-stage DEA model |
| Li et al. (2022) [17] | 30 provinces, China | Bootstrapped DEA model |
| Wang and Wang (2020) [18] | 284 cities, China | Malmquist–Luenberger index |
| Keirstead (2013) [19] | 198 cities, UK | DEA and Regression model |
| Pan et al. (2020) [20] | 30 provinces, China | SBM and Regression model |
| Eguchi et al. (2021) [21] | Thermal power plant | Multi-hierarchy DEA model |
| Aldieri et al. (2021) [22] | American companies | DEA model and Malmquist Index |
| Ślusarz et al. (2021) [24] | Provinces of Poland | CCR-DEA model |
| Chen et al. (2021) [25] | 30 provinces, China | Mixed integer DEA model |
| Meng and Qu (2022) [26] | 29 provinces, China | Super-SBM and GML model |
| △EUE/EUE0 | △ISDI/ISDI0 | TDI | Decoupling Status |
|---|---|---|---|
| >0 | >0 | >1.2 | Expansive negative decoupling (END) |
| >0 | <0 | <0 | Strong negative decoupling (SND) |
| <0 | <0 | [0, 0.8) | Weak negative decoupling (WND) |
| <0 | <0 | >1.2 | Recessive decoupling (RD) |
| <0 | >0 | <0 | Strong decoupling (SD) |
| >0 | >0 | [0, 0.8) | Weak decoupling (WD) |
| >0 | >0 | [0.8, 1.2) | Expansive connection (EC) |
| <0 | <0 | [0.8, 1.2) | Recessive connections (RC) |
| Type | Indicator | Meaning |
|---|---|---|
| Input | Total energy consumption | Reflects energy resource input |
| Fixed asset investment | Reflects capital factor input | |
| Number of employees | Reflects human resource input | |
| Carbon dioxide emissions | Reflect environmental constraint input | |
| Output | Gross domestic product | Reflects economic benefit output |
Disclaimer/Publisher’s Note: The statements, opinions and data contained in all publications are solely those of the individual author(s) and contributor(s) and not of MDPI and/or the editor(s). MDPI and/or the editor(s) disclaim responsibility for any injury to people or property resulting from any ideas, methods, instructions or products referred to in the content. |
© 2023 by the authors. Licensee MDPI, Basel, Switzerland. This article is an open access article distributed under the terms and conditions of the Creative Commons Attribution (CC BY) license (https://creativecommons.org/licenses/by/4.0/).
Share and Cite
Han, P.; Zhou, Z. The Harmonious Relationship between Energy Utilization Efficiency and Industrial Structure Development under Carbon Emission Constraints: Measurement, Quantification, and Identification. Sustainability 2023, 15, 11426. https://doi.org/10.3390/su151411426
Han P, Zhou Z. The Harmonious Relationship between Energy Utilization Efficiency and Industrial Structure Development under Carbon Emission Constraints: Measurement, Quantification, and Identification. Sustainability. 2023; 15(14):11426. https://doi.org/10.3390/su151411426
Chicago/Turabian StyleHan, Ping, and Ziyu Zhou. 2023. "The Harmonious Relationship between Energy Utilization Efficiency and Industrial Structure Development under Carbon Emission Constraints: Measurement, Quantification, and Identification" Sustainability 15, no. 14: 11426. https://doi.org/10.3390/su151411426
APA StyleHan, P., & Zhou, Z. (2023). The Harmonious Relationship between Energy Utilization Efficiency and Industrial Structure Development under Carbon Emission Constraints: Measurement, Quantification, and Identification. Sustainability, 15(14), 11426. https://doi.org/10.3390/su151411426