Article

Spatial Differentiation and Driving Factors of Traditional Villages in Jiangsu Province

1
College of Horticulture, Nanjing Agricultural University, Nanjing 210095, China
2
Key Laboratory of Landscaping, Ministry of Agriculture, Nanjing 210095, China
*
Author to whom correspondence should be addressed.
Sustainability 2023, 15(14), 11448; https://doi.org/10.3390/su151411448
Submission received: 15 June 2023 / Revised: 15 July 2023 / Accepted: 20 July 2023 / Published: 24 July 2023
(This article belongs to the Special Issue Intelligent GIS Application for Spatial Data Analysis)

Abstract

:
Jiangsu Province, situated in the Yangtze River basin, has rich traditional village resources and a prominent position in economic development and cultural integration. This study focuses on the analysis of the variation distribution pattern of traditional villages in Jiangsu Province using six batches of traditional village directories with data until 2023 as research samples. By employing ANN, Voronoi graph analysis, and Moran’s I index, the researchers determined the spatial distribution characteristics of rural settlements. Additionally, kernel density and spatial autocorrelation techniques were used to further examine the spatial distribution patterns, and geographic detector detection was introduced. The results showed the following: (1) The spatial distribution of traditional village settlements in Jiangsu Province showed a significant clustering distribution that is mainly concentrated in central Jiangsu Province. (2) The driving factors reflected a strong symbiotic relationship of “air–water–soil–man”. The spatial distribution of traditional villages was mainly driven by the annual mean temperature and soil type. The interaction between factors was dominated by the enhancement relationship between the two factors. (3) According to the detection results of risk areas in the region, the average annual temperature was 17~17.6 °C, the annual precipitation was 133.0~145.7 billion m3, the average annual wind speed was 0.549~0.565 m/s, the GDP was 85,100~204,000 CNY/km−2, and the population density was 2.32~3.91 thousand/km−2. Arable land was the main type of area and was conducive to the gathering of traditional villages. The preservation of rural settlements should take into account the complex and diverse factors that affect their distribution. Additionally, it is crucial to tailor protection strategies to specific local conditions and conduct flexible research.

1. Introduction

In China, traditional villages play a significant role as invaluable repositories of agricultural and cultural heritage [1]. According to the relevant definition provided by the Ministry of Housing and other departments, traditional villages refer to villages with multiple values that were formed earlier and have a complete scale [2]. However, with the development and expansion of urban modernization, the safeguarding and advancement of traditional villages are threatened. At the same time, with the implementation of measures, such as awarding subsidies for the construction of pilot villages, village protection work is also being carried out. Jiangsu is an economically developed and leading area of urbanization in China, with a dense population and densely populated towns, and its traditional villages have the characteristics of Jiangnan water towns. Therefore, the problem of rural development is more complicated. Exploring the differences in the spatial distribution of traditional villages in Jiangsu Province and its driving factors is not only the theoretical basis for the rational planning of rural settlement layouts but also a practical problem in rural revitalization strategies.
Studies on rural settlements have been conducted since the 19th century. Starting with early qualitative descriptions of the relationship between settlements and natural environments [3], 3S technology has gradually begun to be used. For example, Clark et al. [4] explored the factors related to rural settlements in the outer suburbs of the United States. Ristic et al. [5] analyzed the influence of the geographical arrangement traits of rural communities in Serbia on tourism development. To date, a large number of scholars have conducted research on traditional villages. Studies on traditional villages have mainly focused on their spatial layout [6,7,8], their evolution process [9], the evaluation of their driving factors [10,11,12], and their protection and spatial optimization [13,14,15,16,17]. On a geographical scale, most studies have been carried out in countries [18,19], in different administrative regions [20,21,22], and in different geomorphic regions [23,24,25,26].
However, most of these are mainly qualitative descriptions and case studies [20,21]. Based on different administrative spatial units, the authors paid more attention to the distribution pattern of the spatial location of rural settlements, and the research methods were relatively simple. In recent years, the emergence of the digital technology of geographic detectors has led to the investigation of the conservation and management of traditional villages at a new level [27]. Based on this technology, the differences in the spatial distribution of research objects can be detected and the driving force behind them can be revealed [28]. However, current scholars mostly use geodetectors based on Excel plugins [27] and can only use the experience to determine the key issues of spatial data discretization and spatial scale effects in geodetectors. The optimal classification of spatial differentiation is rarely used as a parameter of the geographic detector model to reveal the driving factors, but this paper can solve this problem with the help of the GD package in the R programming language [29]. Therefore, the geographical differentiation and deterministic influencing factors can be quantitatively analyzed more accurately to assist in decision making for the protection of traditional villages.
Studying the spatial differentiation of rural settlements in Jiangsu Province and objectively revealing the driving factors have important “theoretical and practical” significance. The key to preserving traditional villages lies in optimizing their spatial distribution, which relates to the research on their spatial pattern characteristics [30]. Furthermore, studying the factors that influence regional differentiation in these villages can offer policy guidance for implementing appropriate protection measures [31]. Therefore, this study uses a total of six batches of traditional village catalogs in Jiangsu Province up to 2023 as samples, and 15 driving factors are selected, such as elevation, temperature, precipitation, wind speed, vegetation type, NDVI (normalized difference vegetation index), soil type, and soil pH value [32,33], to explore the driving forces affecting the distribution of these villages in this region. It is expected that the spatial differentiation and driving force detection of rural settlements in Jiangsu Province will not only provide a scientific basis and reference for their protection and development but also provide some reference for the protection and development of villages in other areas.

2. Study Area and Data Source

2.1. Research Area

Jiangsu Province is located in the Yangtze River Delta region of China (Figure 1), with an area of 107,200 km2. It has a developed social economy and advantageous geographical conditions. Flat terrains and plain areas account for more than 80% of the total area. The water network is densely covered by rivers and numerous lakes. The main rivers include the Beijing–Hangzhou Grand Canal, the Yangtze River, the Qinhuai River, and the Tongyang Canal. The main lakes include Taihu Lake and Hongze Lake. Traditional villages in Jiangsu Province have distinct historical, regional, and cultural characteristics, with profound cultural deposits, and are of high value for protection, development, and research [34]. As of 2023, 502 provincial-level traditional villages have been identified and announced in six batches [35]. On the other hand, the prosperity and rapid development of the social economy in the Yangtze River Delta also pose a serious threat to traditional villages [36]. Therefore, taking traditional villages in Jiangsu Province as a case study is representative and forward looking.

2.2. Indicator Selection and Data Source

The driving factor dataset required by traditional villages was selected according to the environmental characteristics of the study area and divided into four categories: geomorphic data, meteorological data, ecological data, and socioeconomic data. There were 15 statistical datasets (Table 1). Data were mostly obtained from publicly accessible databases, while a small number of statistical datasets required spatial processing. In addition, necessary information about traditional villages was obtained from government documents and coordinate points picked up on maps. The data source with an inconsistent original resolution was evenly interpolated and refined in the subsequent calculation process so that its resolution reached 30 m × 30 m. The data of annual precipitation, annual mean temperature, and annual mean wind speed were calculated and synthesized using the corresponding monthly dataset grid. The annual NDVI values were synthesized with 16d band temporal resolution, radiometric calibration, and ENVI correction of Luojia-1 luminous remote sensing data. The ArcGIS 10.6 platform was used to perform projection correction and boundary clipping for all original image data.

3. Methodology

In this study, a 5 × 5 km grid was used to divide the study area into 6252 evaluation units in order to spatialize the core density and driving factors of traditional villages. The nearest neighbor index, Voronoi diagram, and Moran’s I index were calculated using ArcGIS10.6 to explore the spatial distribution characteristics of resources. Secondly, the sample’s nuclear density value was determined. Thirdly, Geoda software was used to analyze the spatial autocorrelation of resource distribution. Finally, 15 detection indicators were screened, and the attribute data of the research objects and driving factors in the corresponding grid were extracted and assigned to the center point of the grid. Then, the geodetector, building upon the optimal parameters of the R language GD package [29], was adopted to select the optimal spatial data discretization mode to reveal the driving factors of the spatial distribution characteristics of rural settlements.

3.1. Spatial Distribution Characteristics Research Methods

3.1.1. Nearest Neighbor Index Calculation

The nearest neighbor index was used to explore the spatial distribution characteristics of the resources. The nearest neighbor index is a common index used for defining the spatial agglomeration type of elements. The Euclidean distance method was used to calculate the index, and the formula is as follows:
R e = 1 N / A 2
R = R i / R e
In Formula (1), Re is the closest distance between traditional villages in theory, referred to as the theoretical distance; A is the area of Jiangsu Province; and N is the total number of traditional villages. In Formula (2), R is the nearest proximity index, and Ri represents the actual nearest distance between resources, namely the average observation distance, referred to as the actual distance.

3.1.2. Voronoi Diagram Analysis

A Voronoi diagram was employed to investigate the spatial distribution characteristics of resources [37]. In this research, the coefficient of variation (CV) was used to further verify the agglomeration characteristics of traditional village points. The formula used is as follows:
CV = (Std/Ave) × 100%
where CV is the variation coefficient of the Voronoi polygon; Std and Ave are the standard deviation and mean value of the Voronoi polygon area, respectively. Generally, when CV > 64%, the rural settlement points are clustered; when CV < 33%, these points are uniformly distributed, and randomly distributed when in between.

3.1.3. Spatial Autocorrelation Analysis

Geoda1.14, a spatial metrology model developed by Dr. Luc Anselin and his team at the University of Chicago’s Center for Spatial Data Science, provides a user-friendly interface and a wealth of methods for exploratory spatial data analysis. Examples include spatial autocorrelation statistics and basic spatial regression analysis. In this paper, the spatial statistical tool in ArcGIS10.6 was used to calculate the global Moran’s I index of the research object, and Geoda software was used to analyze the spatial autocorrelation of resource distribution, and LISA cluster map of traditional villages under county units in Jiangsu Province was drawn.

3.1.4. Kernel Density Estimation

Kernel density reflects the dispersion and aggregation characteristics of the point elements. The estimation formula is as follows:
K x = 1 n d i = 1 n a x x i d
where K(x) is the kernel density value, n is the number of traditional villages in Jiangsu Province, d is the search radius (d > 0), a is the weight value, and x − xi is the distance between resource x and sample resource xi.

3.2. Geodetector

3.2.1. Optimal Parameter Selection

A geodetector is a statistical analysis method that is used to detect spatial heterogeneity and reveal the causes of heterogeneity [28]. This method takes the q value as the criterion to judge the effect of discretization classification. Five methods, such as equal intervals and natural breaks, can be used to classify the driving factor data. In this study, the natural breaks classification method was selected, the classification level was set to 5~12 categories, and the number of categories with the largest q value was selected as the optimal parameter for the geodetector analysis.

3.2.2. Factor Detection and Interactive Detection

A geodetector based on optimal parameters is employed to reveal the driving force of geographical dispersion differentiation of rural settlements, and its model is as follows:
P = 1 1 N σ 2 i = 1 L N i σ i 2
In Formula (5), P is the explanatory power index of infuencing factors, whose value range is [0, 1]. L is the number of classifications in factor layer i, N refers to the number of samples, and σ2 refers to the sample variance. Ni and σ i 2 are the sample number and variance of the factor layer i, respectively. The primary determinants of the spatial differentiation of resources can be determined by comparing q values. The interaction detector evaluated the interaction effect by comparing the single-factor q value with the two-factor interaction q (Xi∩Xj) value [38].The driving force size criterion interval and corresponding interaction types are as follows (Table 2).

3.2.3. Risk Detection

It was determined that there was a significant difference in the mean value of attributes among the subregions of the evaluation index. The area in which traditional villages gather was searched and tested using t [33]. The specific calculation formula is as follows:
t = Y ¯ h = 1 Y ¯ h = 2 V a r Y h = 1 n n = 1 + V a r Y h = 2 n h = 2 1 2
where Y ¯ is the mean value of the linear regression coefficient of traditional villages and density in subregion h; nh is the number of samples in subregion h; and Var represents the variance.

4. Results and Analysis

4.1. Characteristics of Agglomeration Distribution

The distribution characteristics of traditional villages were comprehensively determined using the average nearest neighbor index (ANN), Voronoi diagram (Figure 2a), and Moran’s I (Table 3). It can be seen that the ANN index of traditional villages in the region is 0.656, the coefficient of variation (CV) is 162.19%, and Moran’s I is 0.570. The p-value corresponding to Moran’s I is less than 0.01, and the absolute value of its Z is much higher than its standard deviation, indicating that the probability of random distribution of traditional villages is less than 1%, that is, the spatial distribution of agglomeration. Jiangsu is low-lying and flat, with many rivers and lakes, mostly plains. Rural settlements are mostly concentrated in areas with gentle terrain, mild settlement climate, abundant precipitation, and fertile land, which is also consistent with the results above.

4.2. Spatial Distribution of Kernel Density

A kernel density distribution map of the ancestral villages in Jiangsu Province was obtained using kernel density analysis (Figure 2b). A total of 502 provincial-level traditional villages were identified and announced in six batches in Jiangsu, of which 252 are in southern Jiangsu, accounting for 50%; 136 are in central Jiangsu, accounting for 27%; and 114 are in northern Jiangsu, accounting for 23%. The spatial arrangement of traditional villages in Jiangsu Province is relatively clustered and uneven and is mainly concentrated in Yangzhou, Nanjing, and Taizhou. The villages are mainly clustered in flat plain areas, with a tendency to be distributed in high-altitude areas. The spatial distribution of ancient villages in Jiangsu Province is higher in the south and lower in the north. Their overall distribution pattern presents the characteristics of “multi-core in one belt”. On the whole, there is a large high-density aggregation area in the central region, and the aggregation degree in this area is relatively high. In the south, there are several small areas of high-density aggregation, although relatively small, but also of high density. In the northern region, there are only a few low-density areas and the distribution of settlements is sparse. This distribution pattern shows the spatial unevenness and differences between the ancient villages in Jiangsu Province. The spatial patterns of such villages in different regions are also different. Considering northern Jiangsu as a whole, the distribution of these villages can be observed to form three concentrated regions. These regions are primarily situated in the Jiawang District and Tongshan District of Xuzhou in the northwest, Lianyungang District in the northeast, and Yancheng District and Jianhu District in the southeast. In the middle of Jiangsu, ancient villages are mainly distributed in the central part of Taizhou to the northern part of Yangzhou and form a high-density distribution area in the northwest of the Jiangyan District of Taizhou. In addition, there are a few ancient villages in Yizheng City, Xinghua City, Rugao City, and other areas. On the other hand, the ancient villages in southern Jiangsu showed an obvious polynuclear distribution pattern, mainly scattered in the form of small settlements throughout the region. The core distribution areas were the Pukou District, Jiangning District, and Lishui District of Nanjing; Jurong City and Danyang City of Zhenjiang City; Wujin District of Changzhou City; Yixing City and Xishan District of Wuxi City; Wuzhong District and Kunshan City of Suzhou City; and Jurong City and Danyang City of Zhenjiang City. Among them, the Wuzhong District is the most dense area.

4.3. Spatial Autocorrelation Analysis

GeoDa was used to create the LISA clustering map (Figure 2c). The spatial distribution and correlation characteristics of traditional villages were divided into four cluster types: H-H (high–high), L-L (low–low), H-L (high–low), and L-H (low–high).
The spatial dispersion of traditional villages in Jiangsu has a certain positive spatial correlation, which is embodied in the two characteristics of high-value and low-value clusters. H-H clusters indicate that a district or county in the province has more resources than its neighboring districts and counties, which belong to the spatial correlation hotpot gathering area. Among them, Nanjing, Wuxi, Zhenjiang, and Taizhou are mainly located in the central and southern parts of Jiangsu Province. There are a large number of traditional villages forming H-H clusters. L-L clusters, which indicate that the resources of a certain district and its adjacent counties are small, belong to the cold spot gathering area of spatial correlation. Examples include Xuzhou, Lianyungang, Huai’an, Yancheng, and Suqian, which are located in the north. Due to various reasons, low-density cluster areas have been formed in traditional villages.
The L-H and H-L cluster types do not show obvious agglomeration characteristics. The L-H type, which indicates that the resource quantity of a certain district and county is lower than that of the surrounding districts and counties, belongs to the transition area of spatial correlation, including Changzhou and Nantong. H-L clusters indicate that a district or county has more resources, but adjacent districts or counties have fewer resources, showing a polarization effect in the spatial correlation. The two corresponding regions, Suzhou and Yangzhou, are famous historical and cultural cities with distinct traditional cultural characteristics, so the number of villages is relatively large.

4.4. Driving Force Detection of Spatial Heterogeneity

4.4.1. Determination of Driving Factors and Selection of Optimal Parameters

To gain a deeper understanding of the factors contributing to the spatial arrangement of various characteristics within rural settlements, the ArcGIS10.6 software was used to stack data in geographic space, a fishing net tool was used to generate provincial grid points, and a sampling tool was used to extract Y and X corresponding to grid points.

4.4.2. Geodetector Results and Analysis

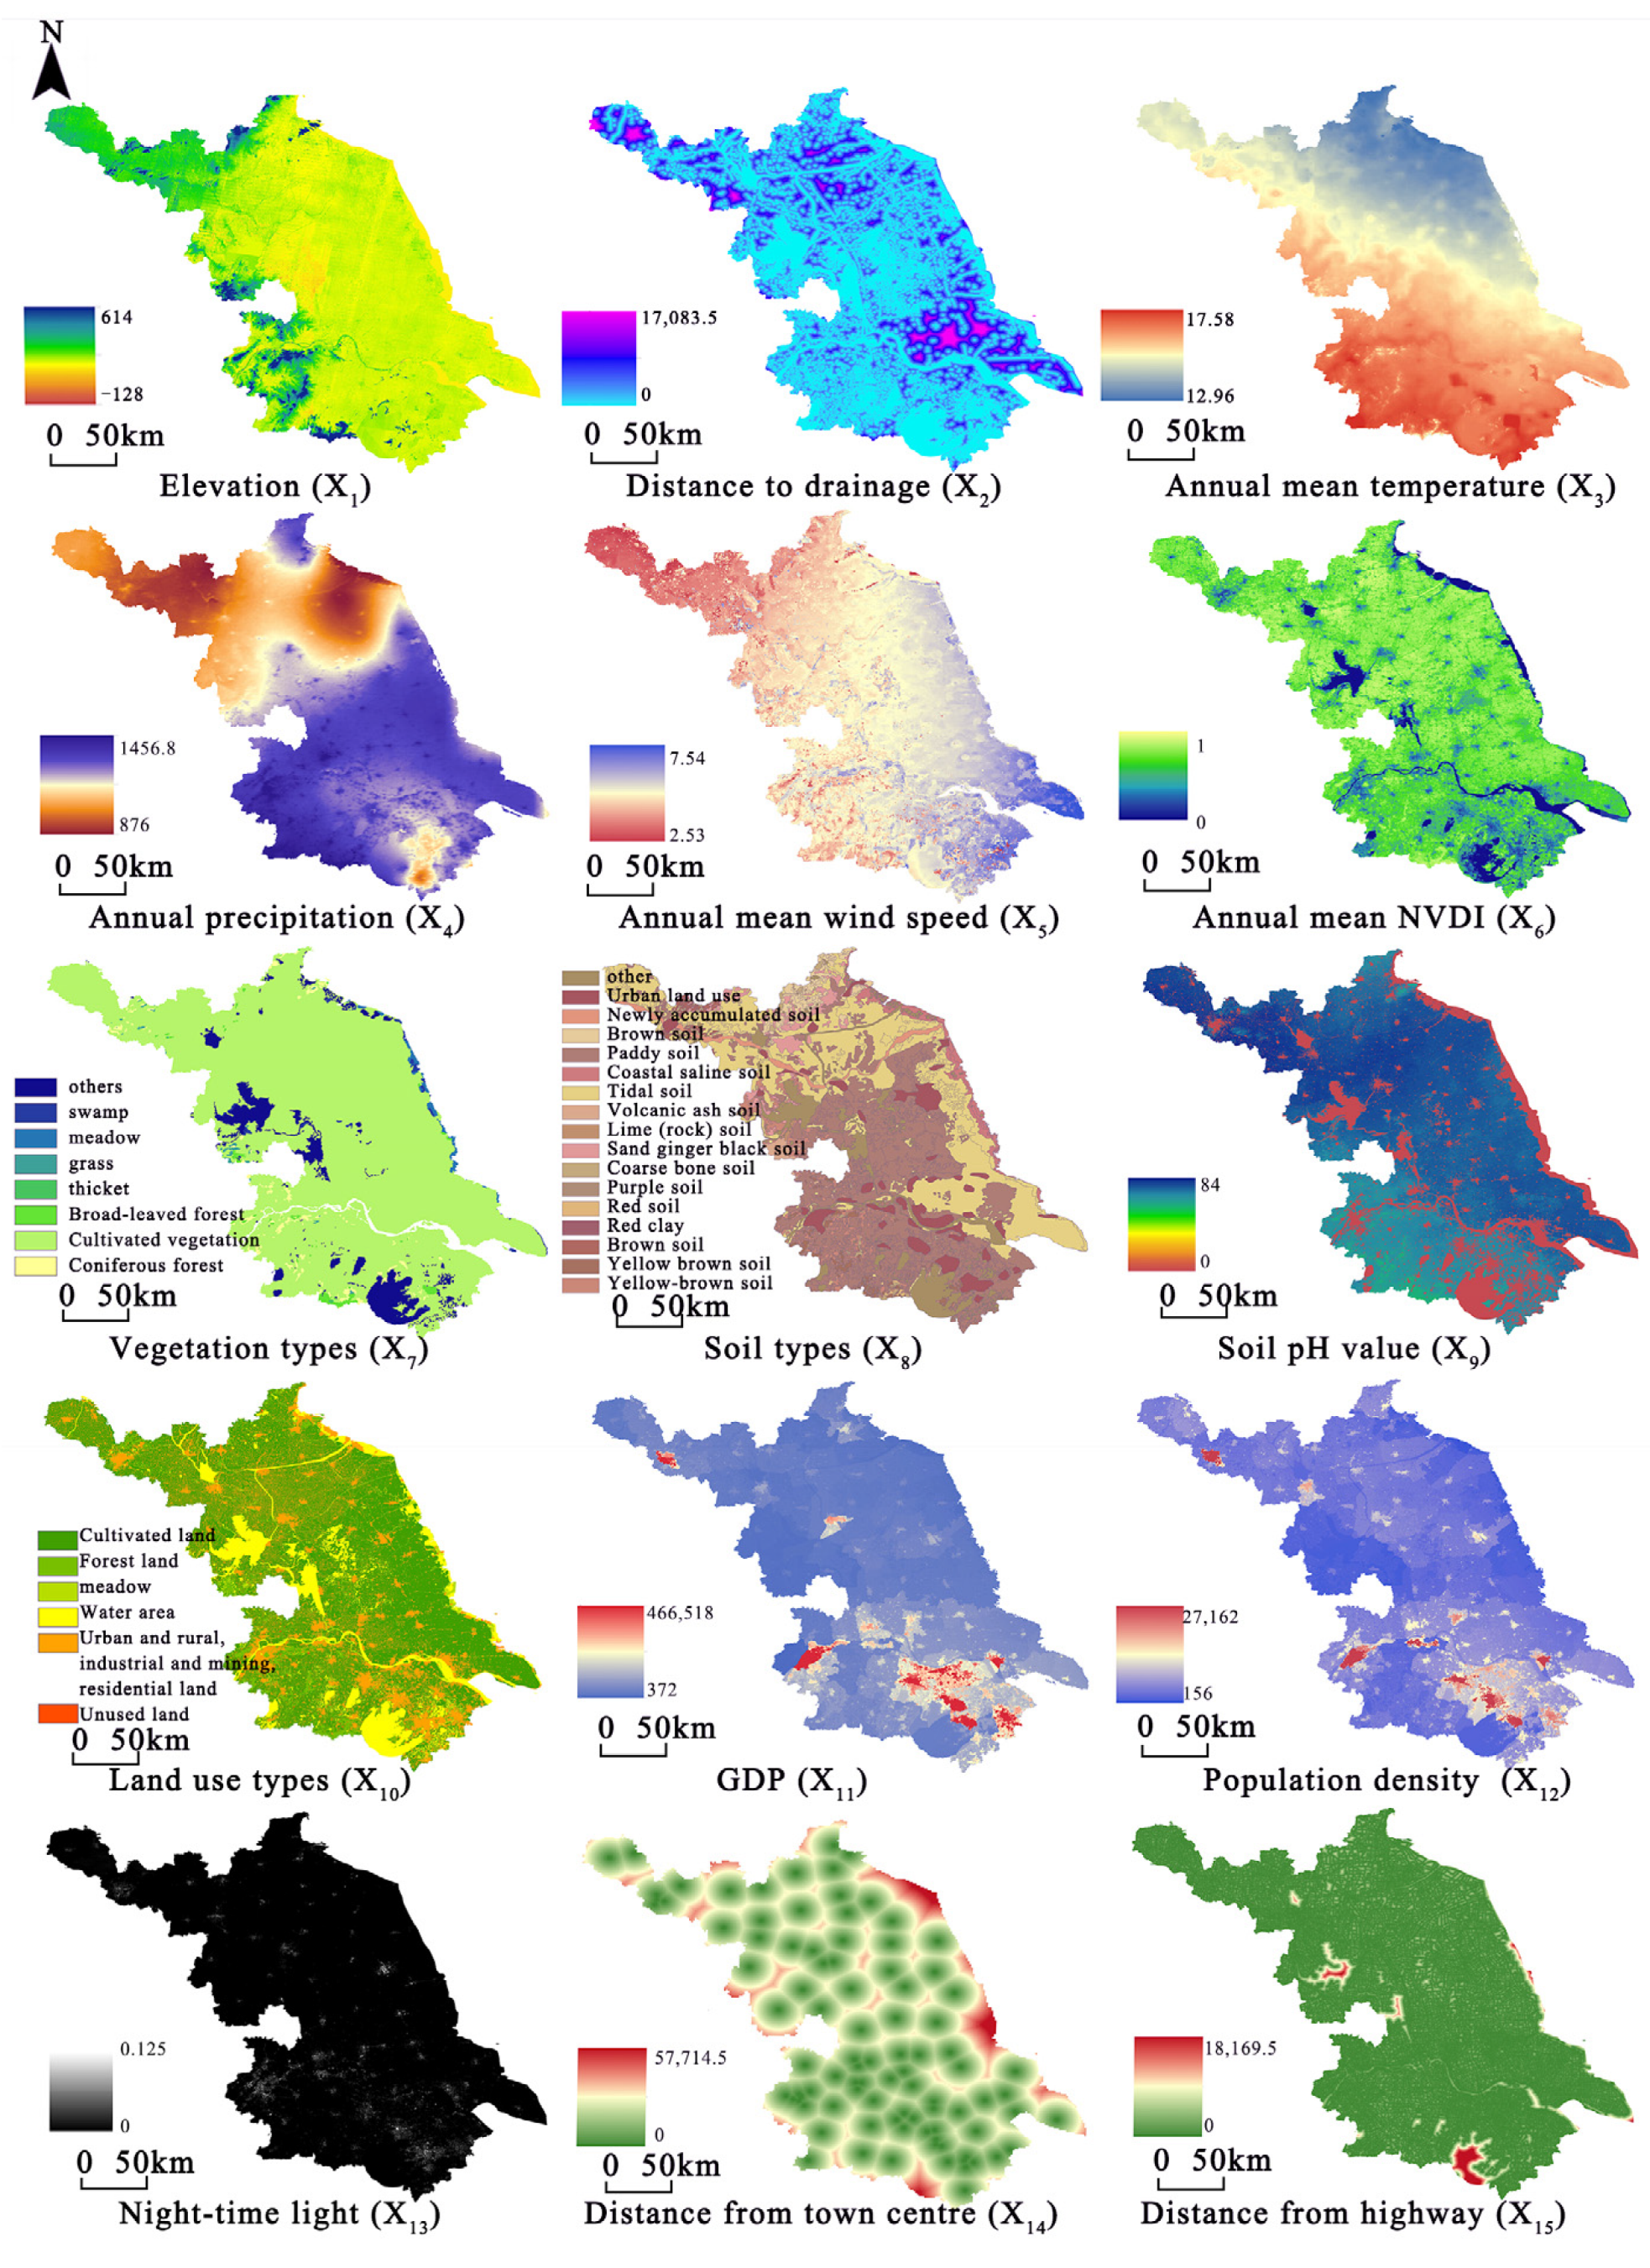
A series of data—including elevation DEM, distance from the river system, temperature, precipitation, wind speed, vegetation type, NDVI value, soil type, soil pH value, land use type, GDP, population density, remote sensing of night lights, distance from the urban center, and distance from the road—were combined (Figure 3).
(1)
Dominant factors
A single-factor driving force calculation was carried out for each driving factor in the region using a geographic detector (Figure 4). Variables Y and X superimposed on the spatial level were imported into this detector and the p-values of the significance test were both 0.000, showing a very significant statistical difference. The higher the value of q, the stronger the explanatory power of the corresponding factors for the spatial differentiation of the dependent variables. Based on these findings, the relative impact of each factor on the spatial distribution of traditional villages can be ranked as follows, from strong to weak: annual mean air temperature (0.3194) > soil type (0.1994) > annual precipitation (0.1984) > GDP (0.1796) > soil pH value (0.1681) > annual mean wind speed (0.1090) > land use type (0.1045) > distance to water system (0.0887) > population density (0.0599) > vegetation type (0.0196) > average annual NDVI value (0.0181) > remote sensing of night light (0.0165) > elevation (0.0154) > distance from town center (0.0144) > distance from road (0.0027).
Among the natural factors, the contribution rate of air temperature was the highest, and its q value was 0.3194, which was the main natural factor affecting the gathering of rural settlements. Precipitation and soil type were the secondary factors, with q values ranging from 0.1 to 0.2. Elevation and NDVI had the weakest influence on traditional village aggregations. Among the human factors, the contribution rate of GDP was the highest, with a q value of 0.1796. The q values of land use type and population density were both above 0.05, and their change had a weak impact on the accumulation of traditional villages.
(2)
Interactive factors
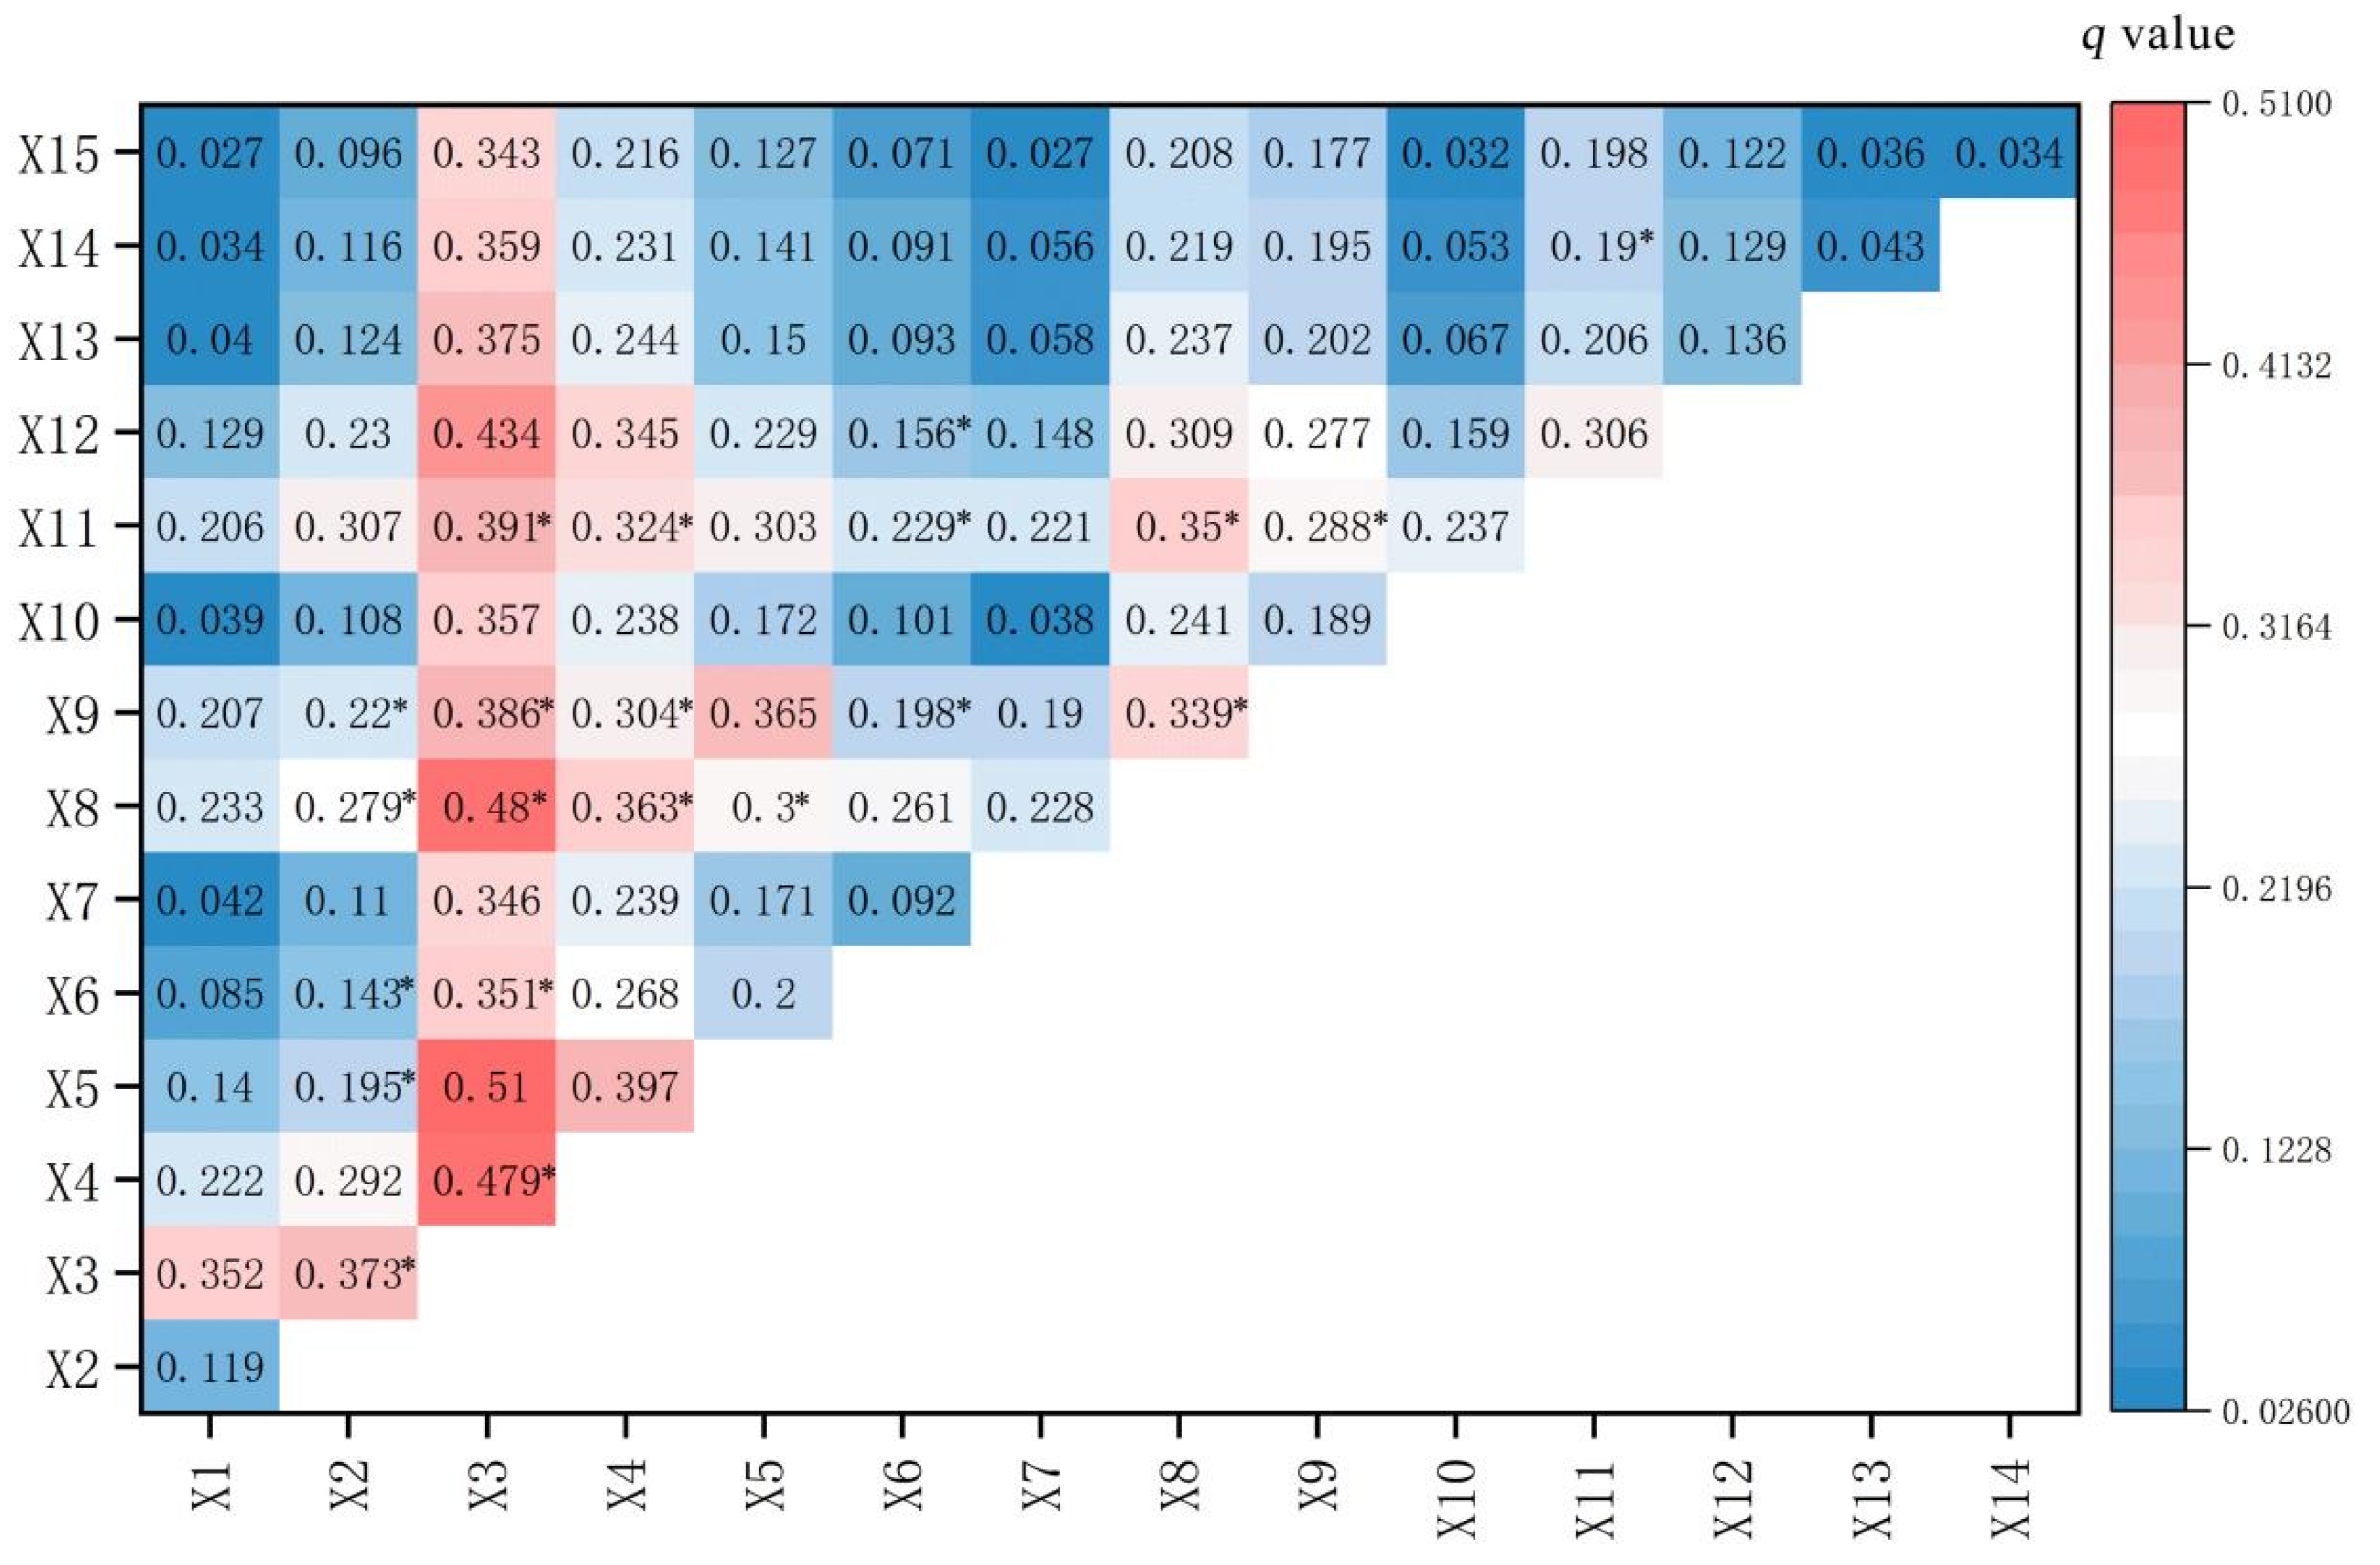
The interaction between the above 15 driving factors was explored, and the size of each interaction was reflected in the origin heat map in linear and equal interval classification (Figure 5).
It was found that the effect of driving factors on the distribution of traditional villages is not isolated but manifests as a nonlinear or double-factor enhancement effect. Among the 15 driving factors, the interaction between the two factors significantly influences the distribution pattern of traditional villages, surpassing the impact of a single factor. That is, the interaction between all such factors can better explain the differences in the distribution of resources.
According to the factor detection results (Figure 5), (a) the interaction between the annual mean temperature and annual mean wind speed had the greatest influence, and the q value was 0.510, indicating that the average temperature and annual mean wind speed were the main factors that jointly affected the value fluctuation of rural settlements and caused their spatial variation. (b) The interaction between the annual average temperature and annual precipitation, soil type, and population density was significant, and the q values were all greater than 0.4, indicating that temperature was the main influencing factor, and its interaction with water, soil, and humans had a more significant effect on the change in rural settlement density. (c) The interaction between the driving factors of rural settlement kernel density had an enhancement effect, and there was no independent factor. The interaction between the annual average temperature (X3)∩annual precipitation (X4), annual average temperature (X3)∩soil type (X8), soil type (X8)∩soil pH value (X9), GDP(X11)∩night light remote sensing (X13), vegetation type (X7∩soil pH value (X9) had a mutual enhancement relationship (band *). The interaction between the other factors had a nonlinear enhancement.
(3)
Risk detection
By analyzing the research results of the risk detector, the value range or type of the most appropriate factor conducive to the aggregation of traditional villages in the region was obtained (Table 4).
When the elevation is from 122 to 154 m, the distance to the water system is from 0 to 504 m, the average annual temperature is from 17 to 17.6 °C, the annual precipitation is from 1330 to 145.68 billion m3, the average annual wind speed is from 0.549 to 0.565 m/s, the average annual NDVI normalized value is from 0.0506 to 0.199, the vegetation type is cultivated vegetation, the soil type is latent paddy soil, the soil pH value is 5.63~6.32, the land use type is cultivated land, the GDP is 8.51~20,400 CNY/km−2, the population density is 2.32~3.91 thousand/km−2, night light remote sensing is 0.0095~0.0125 W/(m2·sr·μm), and the distance from the urban center is 247~4790 m. The area between 247~4790 m and 10,100 ~15,200 m away from the road is conducive to the gathering of traditional villages.

5. Discussion

5.1. Summary

In the process of implementing a rural revitalization strategy, attention should be paid to the study of the spatial distribution characteristics and driving factors of rural settlements, so as to clarify the driving factors of their development and reasonable distribution according to local conditions. According to the results of the factor detection, temperature and soil type are the main factors that affect the fluctuation of rural settlement values. The interaction between annual mean temperature and annual precipitation, soil type, and population density was significant. It shows that the interaction of air, water, soil, and human factors has a more significant influence on the change in rural settlement density when the air temperature is the main influencing factor.
On the basis of protecting traditional villages and rural settlement culture, Jiangsu should follow the regional differentiation law of the natural environment, social economy, and accessibility factors to optimize rural settlement spaces, so as to further promote rural revitalization. First of all, village planning is coordinated and divided into different village types, focusing on disadvantaged locations, small-scale and discrete broken villages, and targeted optimization according to different weaknesses. Broken rural patches can be integrated via reasonable relocation and other methods to promote the efficient implementation of village planning. Secondly, it is necessary to pay attention to the main driving factors to rationally allocate the rural settlement land space in Jiangsu. We should fully consider the interaction of driving factors with location accessibility, social economy, etc., on the basis of effectively protecting the traditional rural ecological environment and scientifically delineating the production and living space of rural settlements, which is based on population size, location conditions, resource environment, and future development level in order to improve land use efficiency. According to the natural features, human environment, local culture, and other resource endowments of traditional village areas, distinctive areas for rural leisure and tourism should be appropriately constructed around traditional villages and along traffic routes, and the rural settlement land space exceeding the regional carrying capacity should be withdrawn reasonably and orderly. Third, we will accelerate the development of a system for modernizing agriculture and rural areas. Relying on modern agriculture with the characteristics of water villages, we will build a national pilot zone for green agricultural development to reduce pollution from agricultural non-point sources. Based on the principles of ecological and environmental protection in traditional villages, we will promote the development of green agriculture and ecological leisure tourism and further build beautiful villages.

5.2. Limitations

This study has its limitations. First, we took 502 traditional villages from the list assessed by experts as empirical research. Since there is no unified definition of traditional villages on map spots at present, map spots and other data used by rural residents in land use data can be combined in the future. In order to enhance the robustness of traditional village map spot measurements, the human activities of villagers should be fully considered. Second, the selection of the factor data should be as comprehensive as possible. However, due to the fact that factors such as policy factors, industrial production and processing pollution, and public protection awareness cannot be studied quantitatively, and data acquisition involves a multidisciplinary scope and is limited by the length of the paper, only local factors were selected as the driving factors. Nonetheless, our driving factors included wind speed, NDVI, vegetation type, soil type, soil pH, the remote sensing of luminous light, and other important factors ignored in relevant studies, effectively reducing the uncertainty of important missing studies. Finally, although the geographic detector model can specifically divide and calculate the driving force of each factor when the natural discontinuous method is used for factor reclassification, the number of classifications directly affects the calculation results, thus affecting the value of the driving force. Nonetheless, we first compared different classification methods, selected the optimal number of classifications based on software, and selected the q value of each driving factor to obtain the best result. Via model calculation and processing, the size of the single-factor driving force, the size of the double-factor interaction, and the adaptation type or range of the driving factor detection index affecting the spatial differentiation of traditional villages were obtained. In addition, this study collected as much data as possible on various impact factors in the region, classified the data of the national category standard strictly according to the data type, and unified the classification level of the remaining data. Thus, omissions were effectively avoided and errors were reduced. Despite these limitations, we still believe that there is considerable room for research analyzing these factors, integrating them with research on the differentiation factors of traditional villages, and interpreting the formation mechanisms of traditional villages in detail.

5.3. Prospects for Future Research

Research on the driving forces of the spatial differentiation of traditional villages is still in the exploratory stage and is still being enriched by existing practices of different social traditions and geographical environments. Village protection planners need to pay attention to the following research perspectives: (1) Future research on traditional villages should be highly sustainable, focusing on the ecological and social benefits that may be further enhanced. It is necessary to develop a systematic evaluation framework and quantify the value of traditional villages in multiple dimensions. (2) In protecting traditional villages, planners should make good use of the enhancement benefits between factors and scientifically promote the development of rural human settlements. Interactive detection can identify whether the interaction between different factors increases or weakens the interpretation degree of the spatial differentiation of the research object, so as to quantify and judge the coupling ability between factors more scientifically and provide ideas for the systematic prediction of more reasonable coupling modes. For example, the interaction between “temperature factor and population factor” and “soil factor and vegetation factor” should be promoted in tandem according to different driving factors. The triangular relationship between humans, habitat, and climate should be handled in a harmonious manner, and the coupling development of a high-quality rural living environment and ecological environment should be promoted. (3) Planners should control and adjust according to the risk detection range. With the goal of multi-village joint development, joint protection is carried out for low-cluster areas that need to be developed around high-cluster areas. Based on the results of risk detection, the reasons for the development of low-aggregation areas should be identified, and reconstruction and support should be given to provide a more important basis for studying the cost–benefit analysis. Furthermore, depending on the geographical proximity of each village, similar industries, and other characteristics, from “fighting alone” to “group cooperation”, we will implement joint contribution and shared benefits, explore the development mode of “multi-village joint operation” in fruit and vegetable planting, integrate agriculture and tourism, cultivate characteristic industries, strengthen the village collective economy, promote rural employment and income, and help rural revitalization.
The factors affecting the distribution of rural settlements are very complex and diverse, which need to be supported by data from other disciplines. At the same time, the protection of traditional villages should be combined with multiple factors and regional differences according to local conditions and flexible research. This paper brings to mind research on detecting other traditional villages’ driving forces.

6. Conclusions

Taking the traditional villages of water towns in Jiangsu Province, China, as an example, this study comprehensively determined the spatial distribution pattern of traditional villages and used a geodetector to reveal the driving factors behind it. In conclusion: (1) The agglomeration of traditional villages in Jiangsu Province shows a significant clustering distribution. The spatial dispersion of ancient villages is generally higher in the south and lower in the north. Patches with a density of more than 0.02 /km2 are distributed in the central part of Taizhou and the northern part of Yangzhou. In the south of Jiangsu, the pattern of small settlements with multiple nuclei is obvious, and the patches with low density are mainly distributed in the coastal areas of the province and the north of Jiangsu. (2) Jiangsu is low-lying and flat with many rivers and lakes. Rural settlements are mostly distributed in areas with gentle terrain, mild climate, abundant precipitation, and fertile land, which is the same as the results of the index table of the spatial variation model of traditional villages. The driving factors of rural settlements reflect their uniqueness, and there is a strong symbiotic relationship of “air, water, soil and man”. The spatial dispersion of ancestral villages is mainly driven by the annual mean temperature, annual precipitation, soil type, and other factors. The driving force of the two-factor combination is significantly higher than that of a single factor, and the interaction between factors is dominated by the relationship of the two-factor enhancement. Among them, the concentration degree of traditional villages is most significantly influenced by the synergistic enhancement of the annual mean temperature and annual precipitation, and the interaction between the annual mean temperature and other factors is dominant. This reflects the fact that the main natural factors affecting the spatial distribution of traditional villages in the region are a series of meteorological factors dominated by air temperature, whereas the human factors are mainly GDP factors and population density factors. (3) The value range or type of each driving factor is divided according to the risk area detection of the geographic detector. The following characteristics are conducive to the gathering of traditional villages: when the value of elevation is in the 122~154 m range, the distance to the water system is 0~504 m; the average annual temperature is 17–17.6 °C; the annual precipitation is 133–145.68 billion m³; the average annual wind speed is 0.549~0.565 m/s; the average annual NDVI normalized value is 0.0506~0.199; the soil pH value is 5.63~6.32; the GDP is 8.51~20,400 CNY/km−2; the population density is 2.32~3.91 thousand people/km−2; the remote sensing of night lights is 0.0095~0.0125 W/(m2·sr·μm); the distance from the urban center is 247~4790 m; the distance from the highway is 10,100~15,200 m; and the main soil types are cultivated vegetation, removed latent paddy soil, and cultivated land.

Author Contributions

Conceptualization, Q.Z. and J.W.; Methodology, J.W.; Software, J.W.; Validation, J.W.; Formal analysis, J.W.; Investigation, J.W.; Resources, Q.Z. and J.W.; Data curation, J.W.; Writing—original draft, J.W.; Writing—review & editing, Q.Z.; Visualization, Q.Z.; Supervision, Q.Z.; Project administration, Q.Z.; Funding acquisition, Q.Z. All authors have read and agreed to the published version of the manuscript.

Funding

This research was funded by The Innovation and Extension Projects of Forestry Science and Technology in Jiangsu Province, China, grant number LYKJ[2020]16 and The APC was funded by Jiangsu Forestry Bureau.

Informed Consent Statement

Not applicable.

Data Availability Statement

The data presented in this study are available on request from the corresponding author.

Conflicts of Interest

The authors declare no conflict of interest.

References

  1. Hu, Y.; Chen, S.; Cao, W.; Cao, C. The concept and cultural connotation of traditional villages. Urban Dev. Stud. 2014, 1, 10–13. [Google Scholar]
  2. Notice on the Implementation of the Sixth Batch of Surveys and Recommendations for Chinese Traditional Villages by the Office of the Ministry of Housing and Urban-Rural Development, etc. Available online: https://www.mohurd.gov.cn/gongkai/zhengce/zhengcefilelib/202207/20220725_767319.html (accessed on 29 June 2023).
  3. Trewartha, G.T. Types of rural settlement in colonial America. Geogr. Rev. 1946, 36, 568–596. [Google Scholar] [CrossRef]
  4. Clark, J.K.; Mcchesney, R.; Munroe, D.K. Spatial characteristics of exurban settlement pattern in the United States. Landsc. Urban Plan. 2009, 90, 178–188. [Google Scholar] [CrossRef]
  5. Ristić, D.; Vukoičić, D.; Milinčić, M. Tourism and sustainable development of rural settlements in protected areas-Example NPKopaonik (Serbia). Land Use Policy 2019, 89, 104231. [Google Scholar] [CrossRef]
  6. Li, J.; Chu, J.; Wang, Y.; Ma, M.; Yang, X. Reconstruction of Traditional Village Spatial Texture Based on Parametric Analysis. Wirel. Commun. Mob. Comput. 2022, 6, 151421. [Google Scholar] [CrossRef]
  7. Liu, L.; Liu, Z. Delineation of traditional village boundaries: The case of Haishangqiao village in the Yiluo River Basin, China. PLoS ONE 2022, 17, e0279042. [Google Scholar] [CrossRef]
  8. Lin, M.; Jian, J.; Yu, H.; Zeng, Y.; Lin, M. Research on the spatial pattern and influence mechanism of industrial transformation and development of traditional villages. Sustainability 2021, 16, 8898. [Google Scholar] [CrossRef]
  9. Liang, B.; Xiao, D.; Tao, J.; Ji, J.; Zhuo, X.; Huang, Y. The temporal and spatial pattern and evolution of the distribution of traditional Hakka villages in Ganzhou. Econ. Geogr. 2018, 38, 196–2003. [Google Scholar]
  10. Chen, X.; Xie, W.; Li, H. The spatial evolution process, characteristics and driving factors of traditional villages from the perspective of the cultural ecosystem: A case study of Chengkan Village. Habitat Int. 2020, 104, 102250. [Google Scholar] [CrossRef]
  11. Liu, X.; Huang, Y.; Xiang, H.; Zhang, C.; Chen, J.; Xiao, D. Optimization strategies for the management mechanisms of conservation and utilization in traditional Chinese villages based on relevance analyses of performance evaluation. J. Asian Archit. Build. Eng. 2023, 22, 1699–1713. [Google Scholar] [CrossRef]
  12. Prevolšek, B.; Maksimović, A.; Puška, A.; Pažek, K.; Žibert, M.; Rozman, Č. Sustainable development of ethno-villages in Bosnia and Herzegovina: A multi criteria assessment. Sustainability 2020, 4, 1399. [Google Scholar] [CrossRef] [Green Version]
  13. Kim, G.W.; Kang, W.; Park, C.R.; Lee, D. Factors of spatial distribution of Korean village groves and relevance to landscape conservation. Landsc. Urban Plan. 2018, 176, 30–37. [Google Scholar] [CrossRef]
  14. Gao, X.; Li, Z.; Sun, X. Relevance between Tourist Behavior and the Spatial Environment in Huizhou Traditional Villages—A Case Study of Pingshan Village, Yi County, China. Sustainability 2023, 15, 5016. [Google Scholar] [CrossRef]
  15. Lv, W.; Tang, J. Studies of ancient townscape regeneration through the articulation of the space syntax methodology. Cogent. Eng. 2019, 1, 1603261. [Google Scholar] [CrossRef]
  16. Jiang, Y.; Li, N.; Wang, Z. Parametric Reconstruction of Traditional Village Morphology Based on the Space Gene Perspective—The Case Study of Xiaoxi Village in Western Hunan, China. Sustainability 2023, 15, 2088. [Google Scholar] [CrossRef]
  17. Xu, Q.; Wang, J. Recognition of values of traditional villages in Southwest China for sustainable development: A case study of Liufang Village. Sustainability 2020, 14, 7569. [Google Scholar] [CrossRef]
  18. Bian, J.; Chen, W.; Zeng, J. Spatial Distribution Characteristics and Influencing Factors of Traditional Villages in China. Int. J. Environ. Res. Public Health 2022, 19, 4627. [Google Scholar] [CrossRef]
  19. Su, H.R.; Wang, Y.W.; Zhang, Z.; Dong, W. Characteristics and Influencing Factors of Traditional Village Distribution in China. Land 2022, 11, 1631. [Google Scholar] [CrossRef]
  20. Wang, Q.; Liu, W.; Mao, L. Spatial Evolution of Traditional Village Dwellings in Heilongjiang Province. Sustainability 2023, 15, 5330. [Google Scholar] [CrossRef]
  21. Ma, H.; Tong, Y. Spatial differentiation of traditional villages using ArcGIS and GeoDa: A case study of Southwest China. Ecol. Inform. 2022, 68, 101416. [Google Scholar] [CrossRef]
  22. Jia, A.; Liang, X.; Wen, X.; Yun, X.; Ren, L.; Yun, Y. GIS-Based Analysis of the Spatial Distribution and Influencing Factors of Traditional Villages in Hebei Province, China. Sustainability 2023, 15, 9089. [Google Scholar] [CrossRef]
  23. Wei, D.; Wang, Z.; Zhang, B. Traditional Village Landscape Integration Based on Social Network Analysis: A Case Study of the Yuan River Basin in South-Western China. Sustainability 2021, 13, 13319. [Google Scholar] [CrossRef]
  24. Li, S.; Song, Y.; Xu, H.; Li, Y.; Zhou, S. Spatial Distribution Characteristics and Driving Factors for Traditional Villages in Areas of China Based on GWR Modeling and Geodetector: A Case Study of the Awa Mountain Area. Sustainability 2023, 15, 3443. [Google Scholar] [CrossRef]
  25. Katsue, F. Sustainability of terraced paddy fields in traditional satoyama landscapes of Japan. J. Environ. Manag. 2017, 202, 543–549. [Google Scholar]
  26. Li, M.; Ouyang, W.; Zhang, D. Spatial Distribution Characteristics and Influencing Factors of Traditional Villages in Guangxi Zhuang Autonomous Region. Sustainability 2023, 15, 632. [Google Scholar] [CrossRef]
  27. Chen, W.X.; Yang, L.Y.; Wu, J.H.; Wu, J.H.; Wang, G.Z.; Bian, J.J.; Zeng, J.; Liu, Z.L. Spatio-temporal characteristics and influencing factors of traditional villages in the Yangtze River Basin: A Geodetector model. Herit. Sci. 2023, 11, 111. [Google Scholar] [CrossRef]
  28. Wang, J.; Xu, C. Geodetector. Principle and prospect. Acta Geogr. Sin. 2017, 72, 116–134. [Google Scholar]
  29. Song, Y.; Wang, J.; Ge, Y.; Xu, C. An optimal parameters-based geographical detector model enhances geographic characteristics of explanatory variables for spatial heterogeneity analysis: Cases with different types of spatial data. GIScience Remote Sens. 2020, 57, 593–610. [Google Scholar] [CrossRef]
  30. Liu, T.; Wang, S.; Wang, Z.; Li, B.; Guo, S.; Wei, B. Data science based landscape ecology for traditional village landscape protection. Int. J. Comput. Appl. Technol. 2021, 65, 290–300. [Google Scholar] [CrossRef]
  31. Wu, C.; Chen, M.; Zhou, L.; Liang, X.; Wang, W. Identifying the spatiotemporal patterns of traditional villages in China: A multiscale perspective. Land 2020, 9, 449. [Google Scholar] [CrossRef]
  32. Li, C.; Wu, Y.; Gao, L.; Wu, Y.; Zheng, K.; Li, C. Spatial Differentiation and Driving Factors of Rural Settlement in Plateau Lake: A Case Study of the Area around the Erhai. Ecomomic Geogr. 2022, 42, 220–229. [Google Scholar]
  33. Chen, K.; Ding, K.Y.; Zhang, X.C. Analysis of spatio-temporal dynamics and driving forces of vegetation cover in the Fuyang River Basin based on the geographic detector. Earth Sci. Front. 2023, 6, 1–15. [Google Scholar]
  34. Ma, R.; Yang, S. The Effect of Social Network on Controlled-Release Fertilizer Use: Evidence from Rice Large-Scale Farmers in Jiangsu Province, China. Sustainability 2023, 15, 2982. [Google Scholar] [CrossRef]
  35. 502 Provincial-level Traditional Villages Are under Unified Protection. Available online: http://www.jiangsu.gov.cn/art/2023/6/4/art_60085_10913243.html (accessed on 29 June 2023).
  36. Wang, W.; Wu, Q.; Hu, C. Analysis of spatial distribution characteristics and Influencing factors of traditional villages in Jiangsu Province. J. Xi’an Univ. Archit. Technol. (Soc. Sci. Ed.) 2023, 42, 32–39. [Google Scholar]
  37. Tian, Y.; Kong, X.; Liu, Y. Combining weighted daily life circles and land suitability for rural settlement econstruction. Habitat Int. 2018, 76, 1–9. [Google Scholar] [CrossRef]
  38. He, Y.; Wang, W.; Chen, Y.; Yan, H. Assessing spatio-temporal patterns and driving force of ecosystem service value in the main urban area of Guangzhou. Sci. Rep. 2021, 11, 1–18. [Google Scholar] [CrossRef]
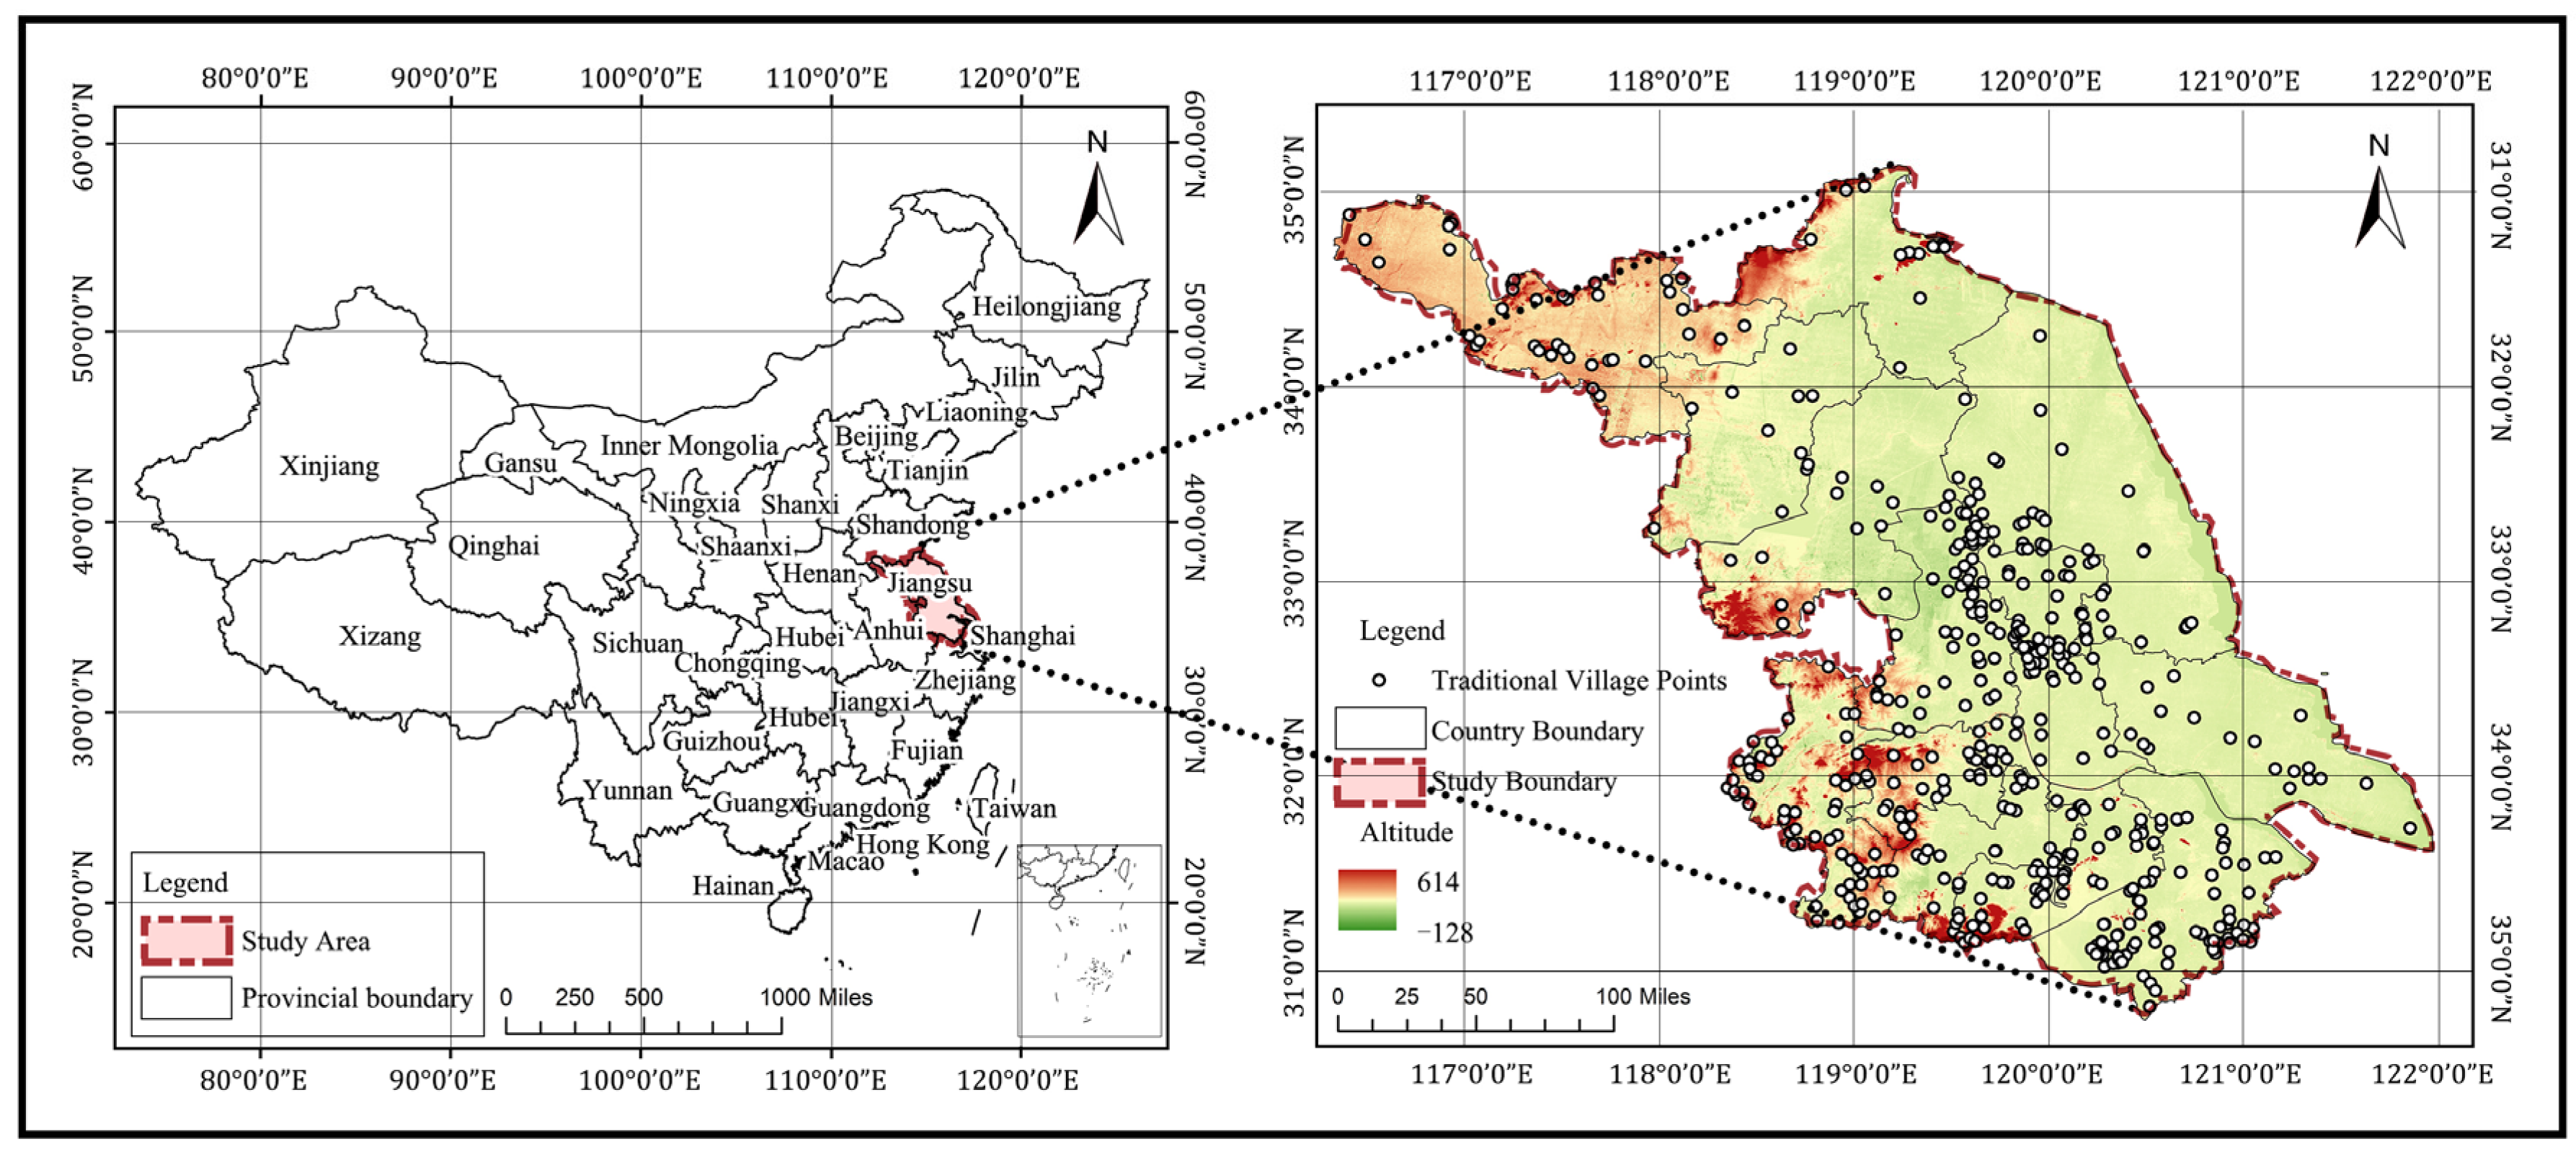
Figure 1. Map of the study area.
Sustainability 15 11448 g001
Figure 2. (a) Voronoi map, (b) kernel density, (c) spatial autocorrelation analysis of traditional villages.
Sustainability 15 11448 g002
Figure 3. Spatial distribution of driving factors.
Sustainability 15 11448 g003
Figure 4. The explanatory power of the driving factors of the spatial distribution (q value).
Sustainability 15 11448 g004
Figure 5. The results of interaction detection.
Sustainability 15 11448 g005
Table 1. Sources for input datasets.
CategoryDataset and TimeResolutionData Source
Research samplePoi of the traditional village (2012–2023)-http://www.chuantongcunluo.com/ (accessed on 1 May 2023)
Geomorphic dataDEM (2018)30 mhttp://www.gscloud.cn/ (accessed on 1 May 2023)
Drainage map (2018)-https://www.webmap.cn/ (accessed on 1 May 2023)
Meteorological dataAnnual mean temperature (2022)1 kmhttp://www.geodata.cn/ (accessed on 1 May 2023)
Annual precipitation (2022)1 kmhttp://www.geodata.cn/ (accessed on 1 May 2023)
Annual mean wind speed (2020)1 kmhttp://www.geodata.cn/ (accessed on 1 May 2023)
Ecological dataNDVI (2019)500 mhttp://ladsweb.nascom.nasa.gov/data/search.html (accessed on 1 May 2023)
Vegetation types (2018)500 mhttp://www.geodata.cn/ (accessed on 1 May 2023)
Soil types (2018)250 mhttp://www.geodata.cn/ (accessed on 1 May 2023)
Soil pH value (2020)250 mhttp://www.geodata.cn/ (accessed on 1 May 2023)
Socioeconomic dataLand use/cover (2020)30 mhttp://www.geodata.cn/ (accessed on 1 May 2023)
GDP (2019)1 kmhttp://www.resdc.cn/ (accessed on 1 May 2023)
China population in grid
transformation (2019)
1 kmhttp://www.resdc.cn/ (accessed on 1 May 2023)
Night light data (2018)130 mhttp://www.hbeos.org.cn/ (accessed on 1 May 2023)
Town center poi data (2023)-https://www.webmap.cn/ (accessed on 1 May 2023)
Road map (2018)-https://www.web-map.cn/ (accessed on 1 May 2023)
DEM, digital elevation model; GDP, gross domestic product; poi, point of interest.
Table 2. Model driving force size criterion of interval and interaction.
Criterion of IntervalInteraction
q(X1∩X2) < Min[q(X1),q(X2)]Nonlinear weakening
Min[q(X1),q(X2)] < q(X1∩X2) < Max[q(X1),q(X2)]Single-factor nonlinear weakening
q(X1∩X2) > Max[q(X1),q(X2)]Two-factor enhancement
q(X1∩X2) = q(X1) + q(X2)Independence
q(X1∩X2) > q(X1) + q(X2)Nonlinear enhancement
Table 3. Indicators of the spatial distribution pattern of traditional villages.
IndicatorsValueZscore
ANN0.656−14.748
CV162.19%-
Moran’s I0.5707.066
Table 4. Adaptation type or scope of driving factor detection index.
Evaluation IndexSuitable Range (Type)Mean Kernel Density (PCS/10,000 km²)
Elevation (X1)122~154 m0.008591
Distance to drainage (X2)0~504 m0.006285
Annual mean temperature (X3)17~17.6 °C0.008107
Annual precipitation (X4)1330~1456.8 billion m³0.007363
Annual mean wind speed (X5)0.549~0.565 m/s0.007134
Annual mean NVDI (X6)0.0506~0.199 (normalized value)0.006680
Vegetation types (X7)Cultivated vegetation0.006838
Soil types (X8)Take off the latent paddy soil0.006962
Soil pH value (X9)5.63 < pH < 6.320.007248
Land use types (X10)Cultivated land0.011355
GDP (X11)8510~204,000 CNY/km−20.008222
Population density (X12)2.32~3.91 thousand people/km−20.008087
Night light (X13)0.0095~0.0125 W/(m2·sr·μm)0.008528
Distance from town center (X14)247~4790 m0.005185
Distance from highway (X15)10,100~15,200 m0.006110
Disclaimer/Publisher’s Note: The statements, opinions and data contained in all publications are solely those of the individual author(s) and contributor(s) and not of MDPI and/or the editor(s). MDPI and/or the editor(s) disclaim responsibility for any injury to people or property resulting from any ideas, methods, instructions or products referred to in the content.