
An Anti-Condensation Radiant Heating Floor System in Buildings under Moistening Weather


Abstract
:1. Introduction
2. Methodology
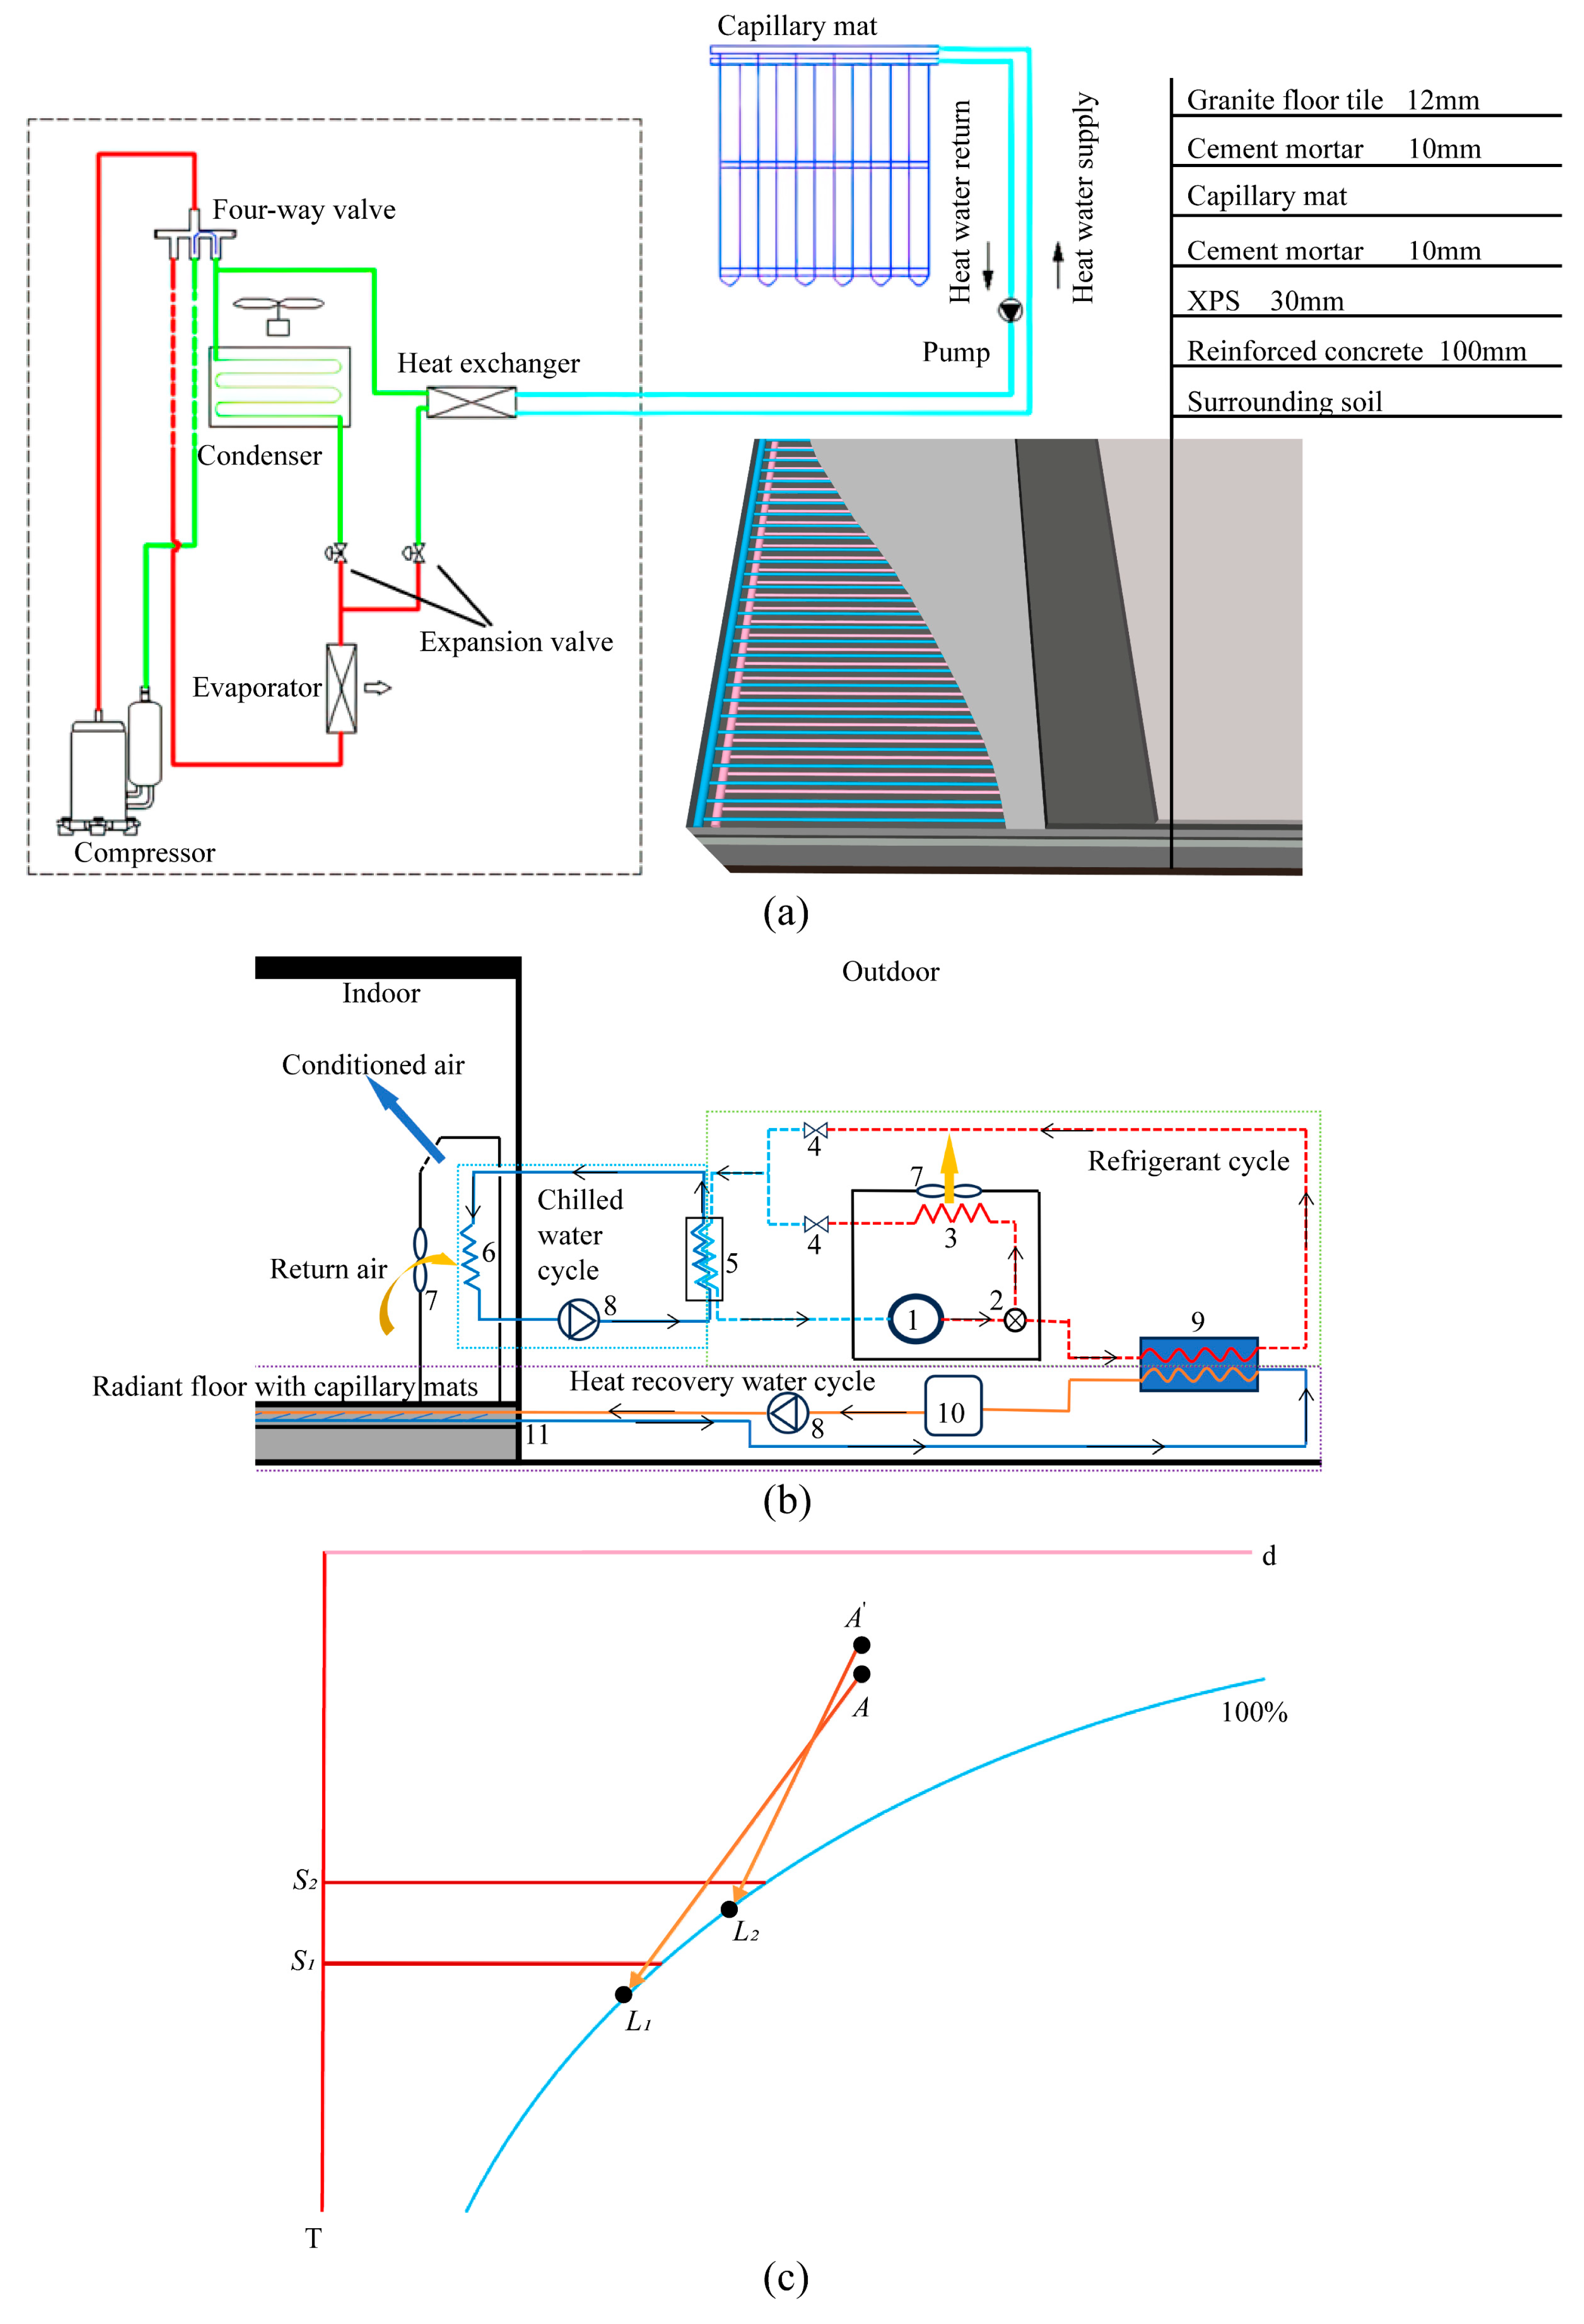
2.1. IAFS Principle
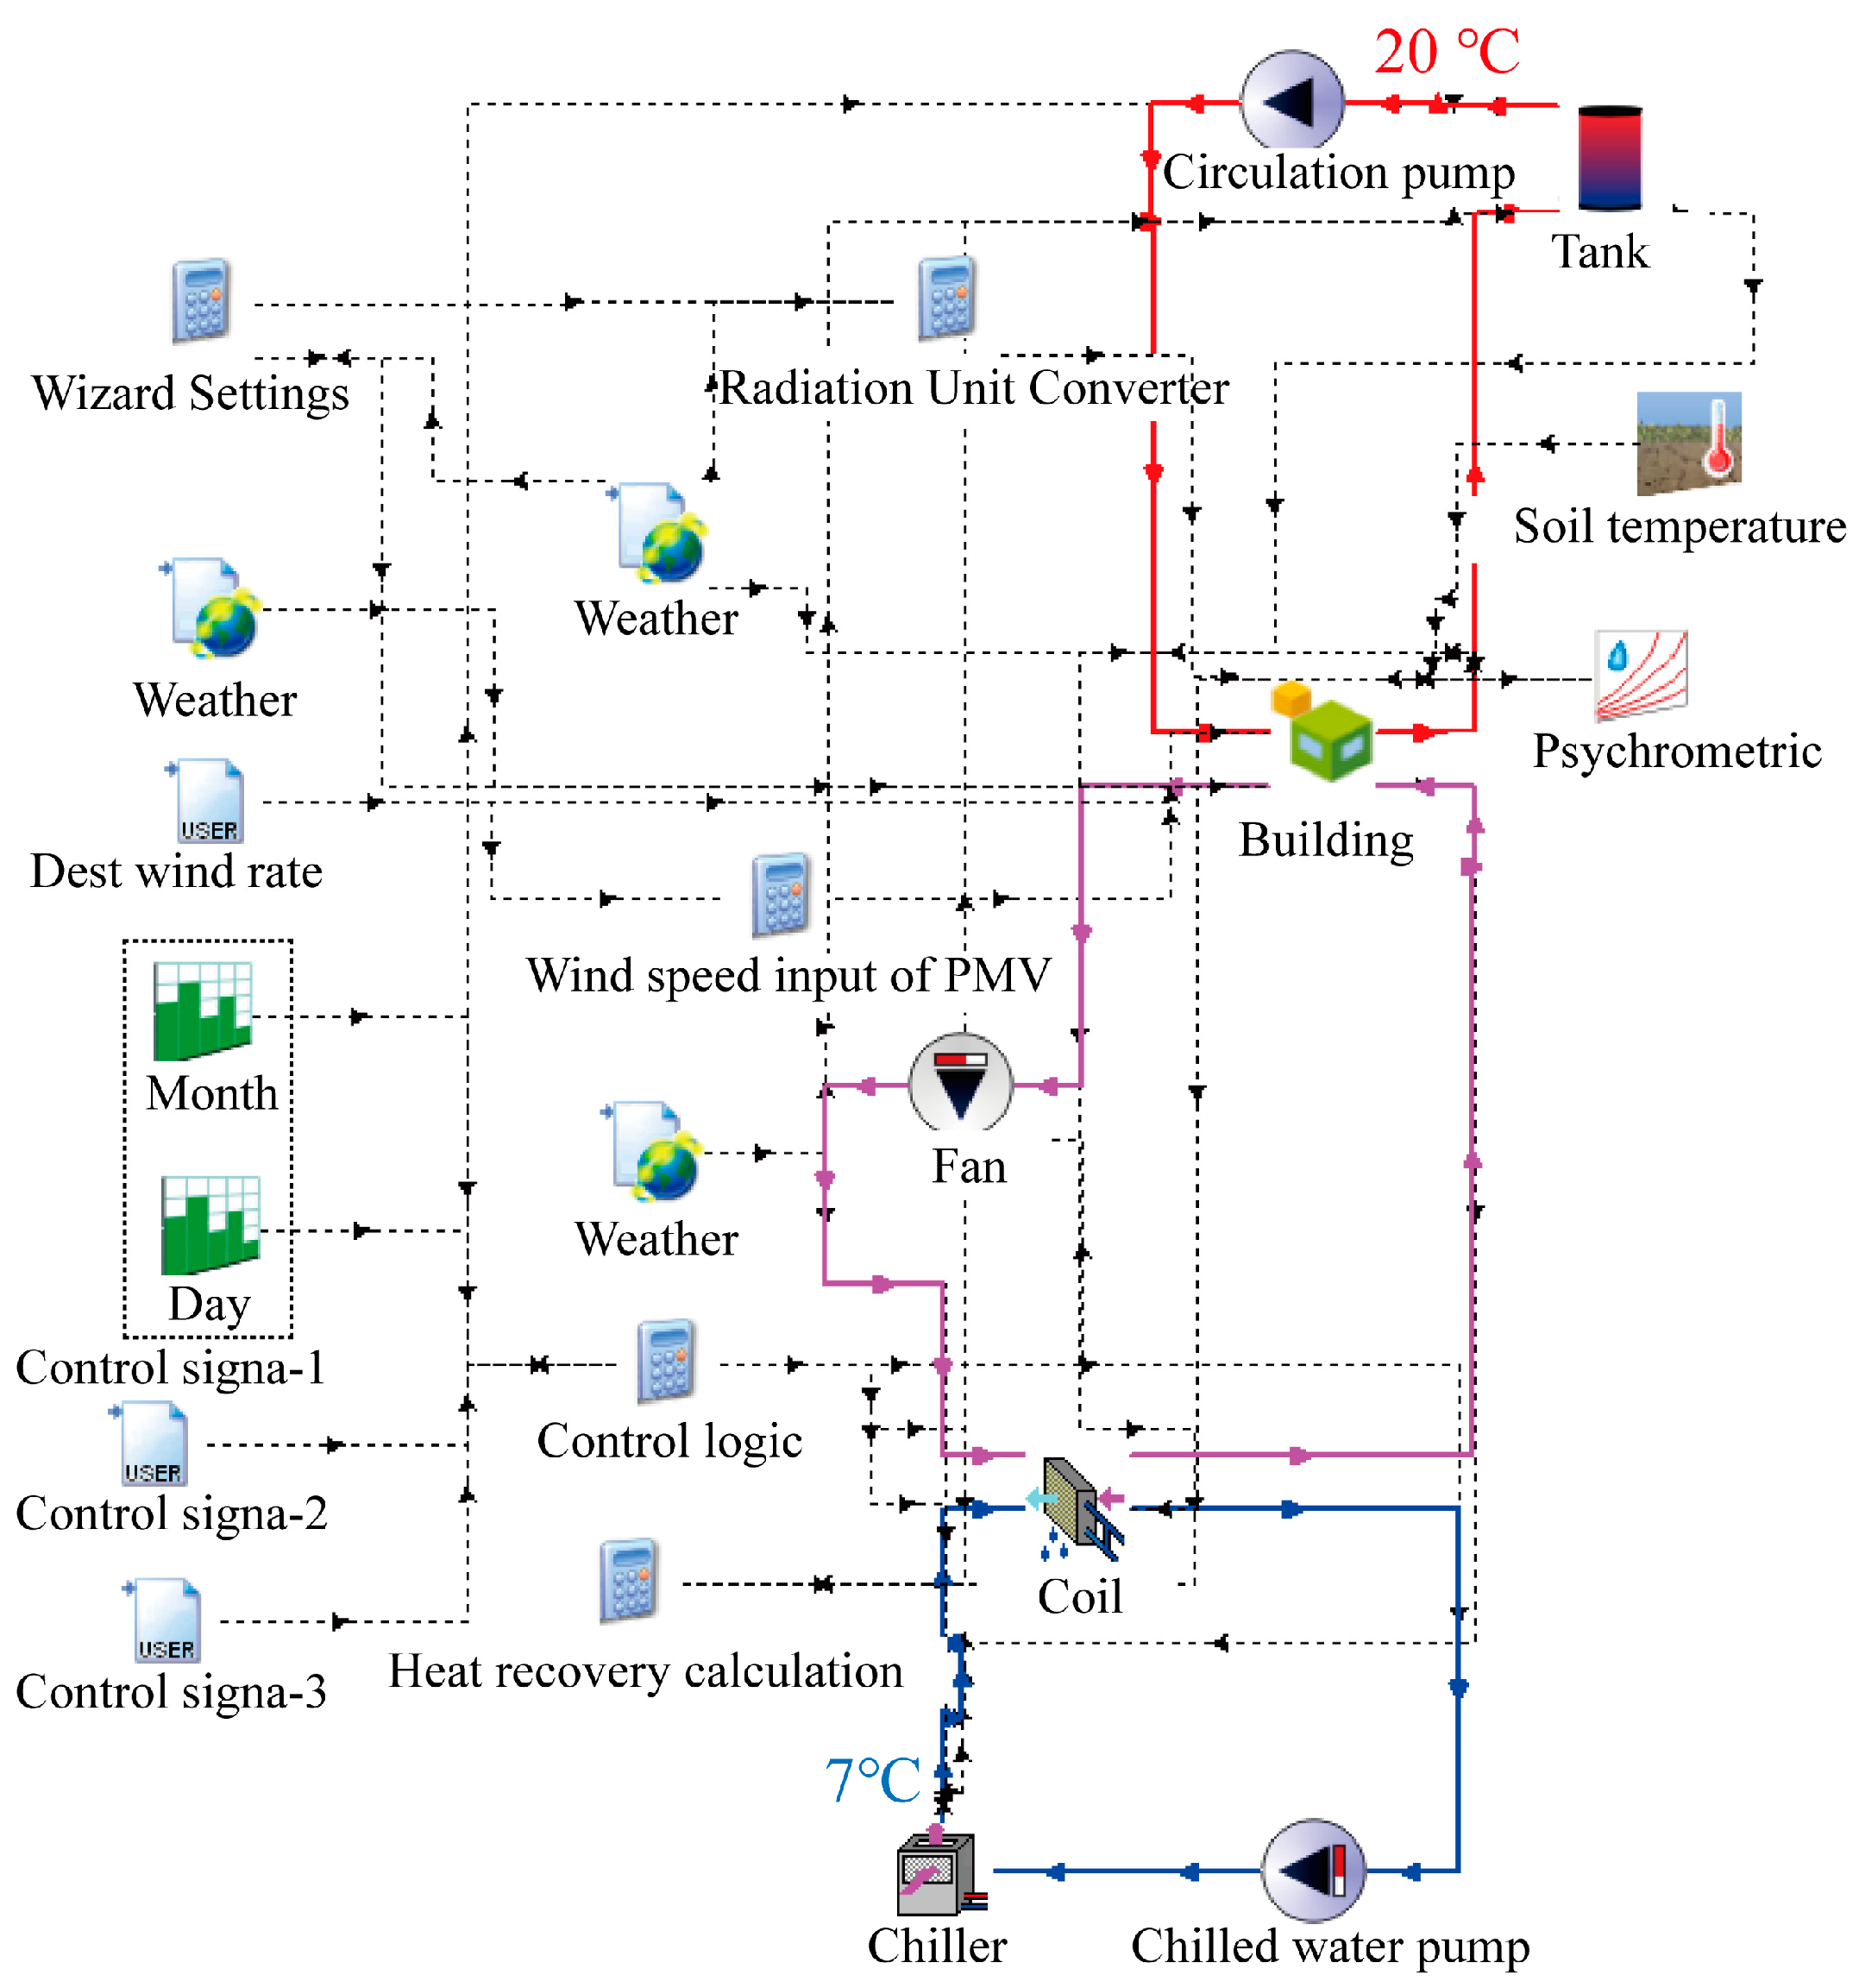
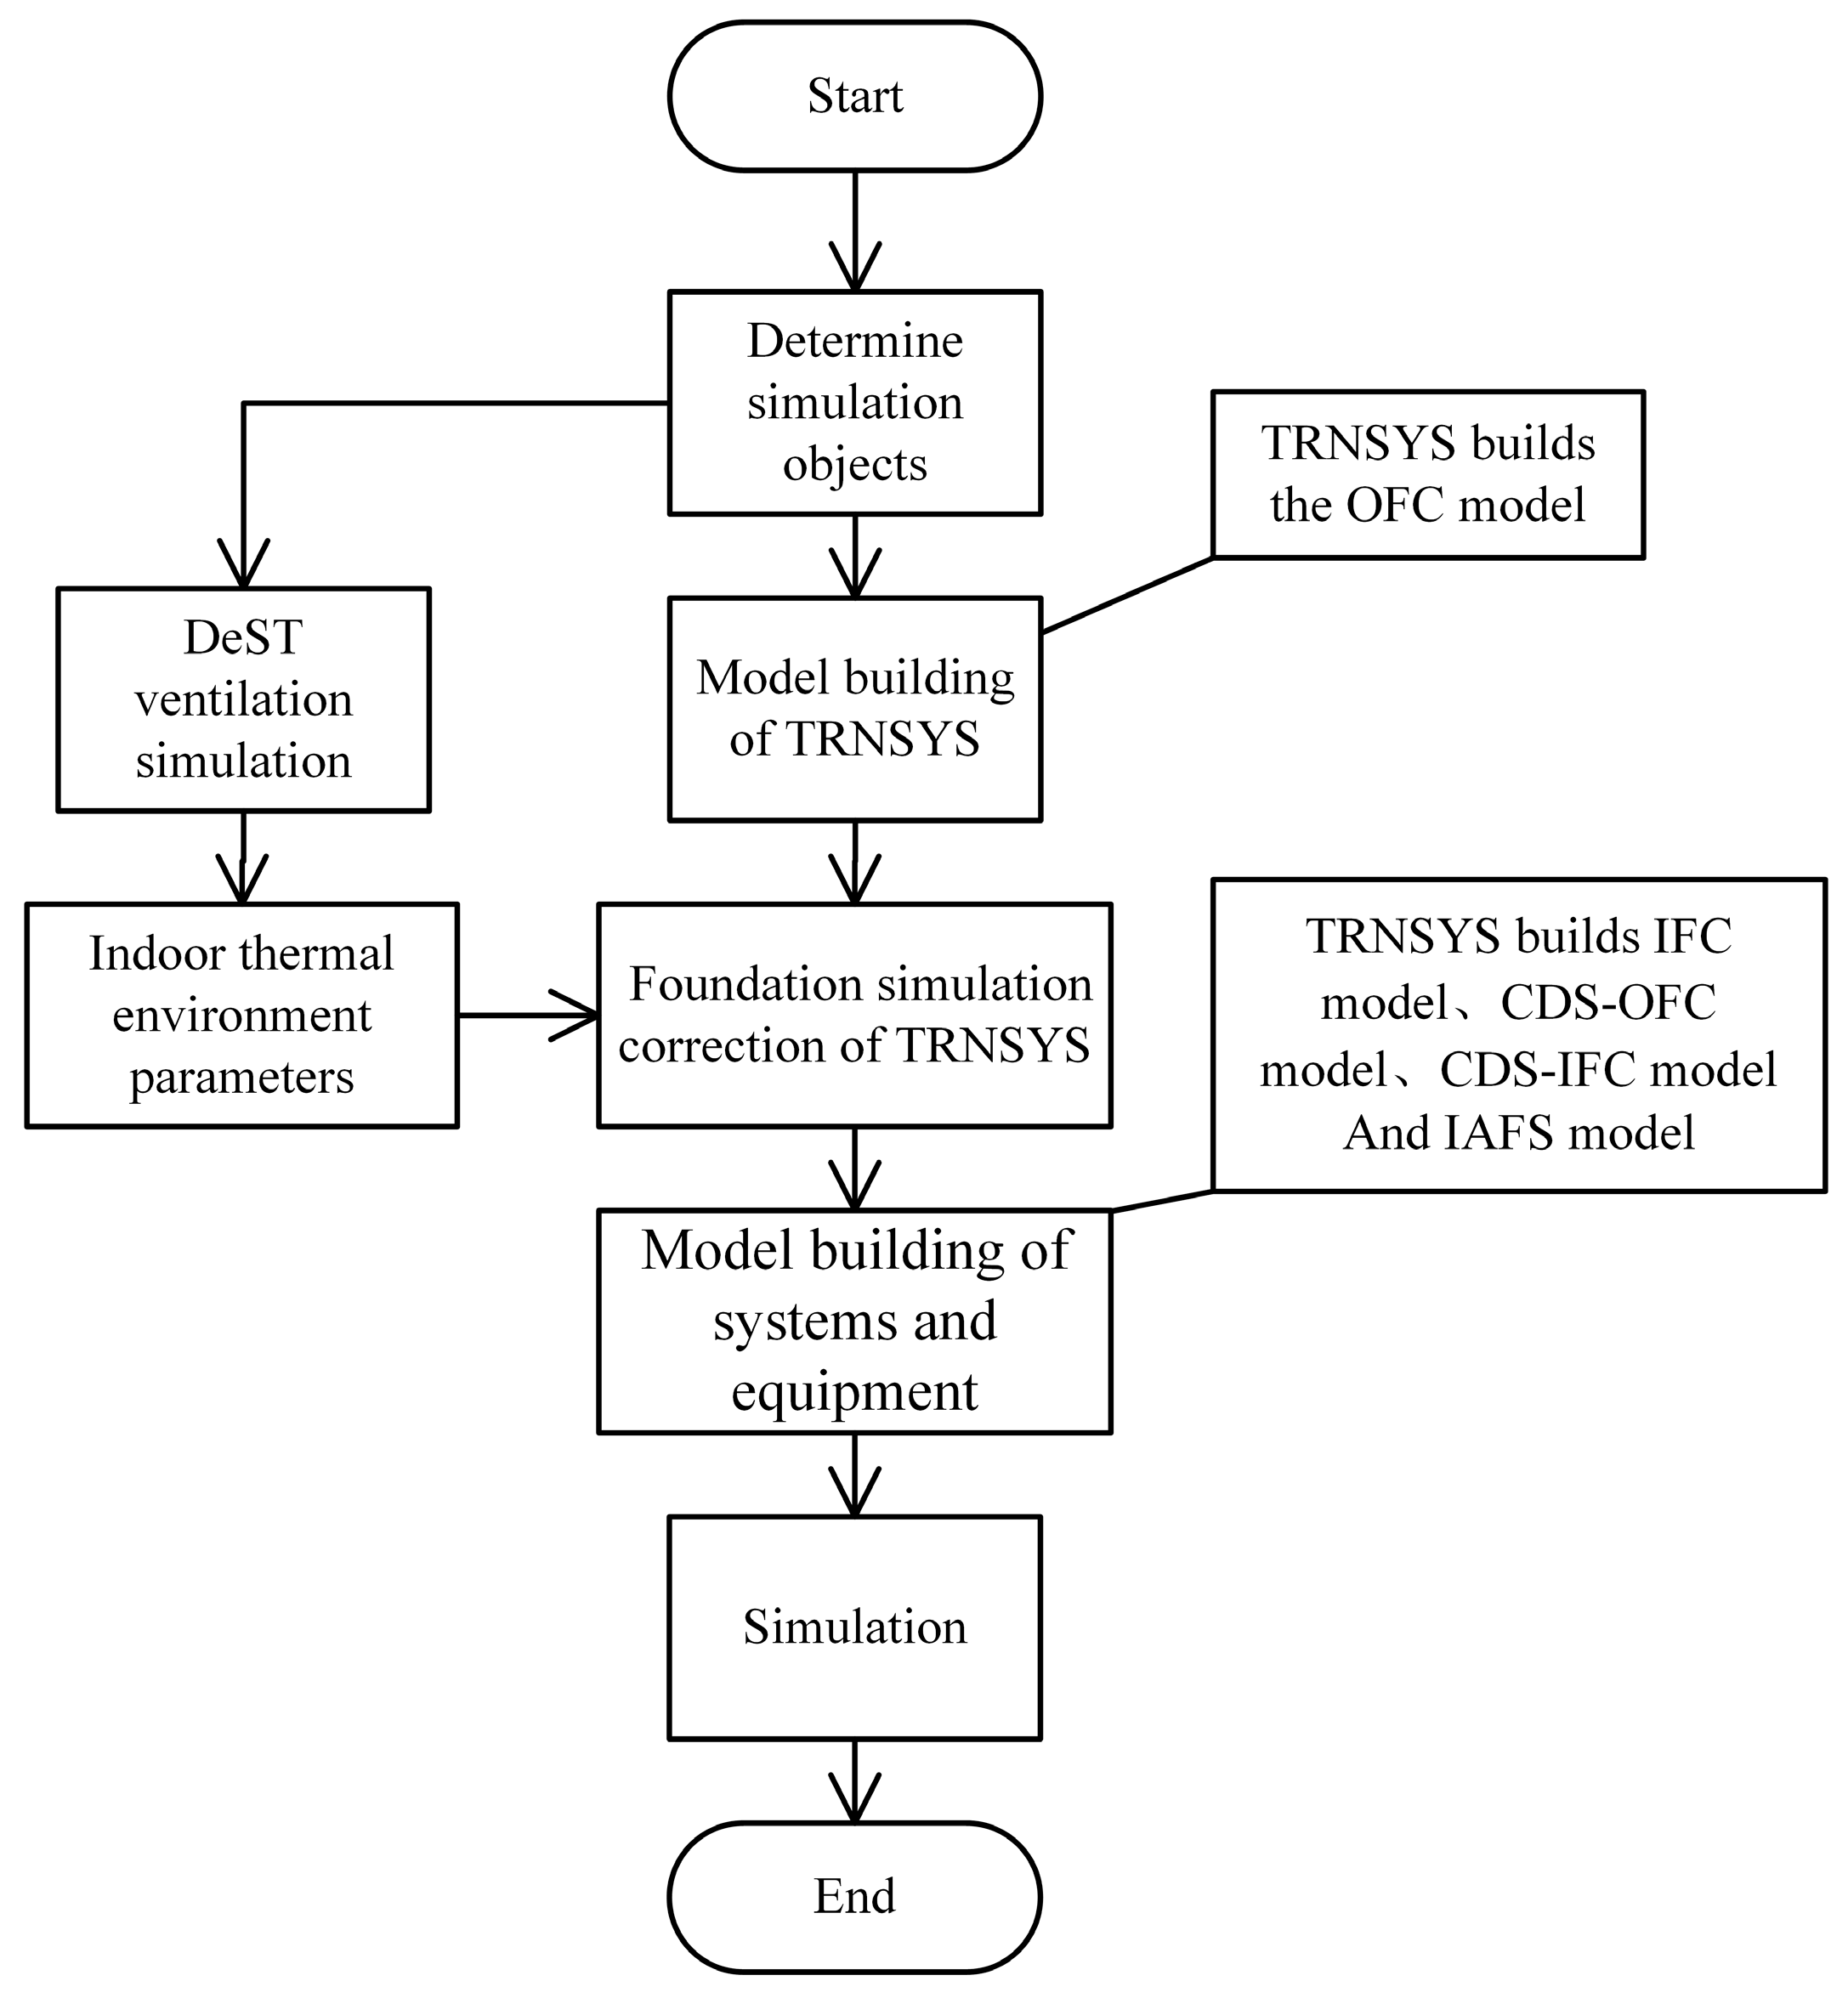
2.2. Methods
2.3. Case Study
2.3.1. Climatic Conditions and Building Description
2.3.2. Analysis of Results
3. Results
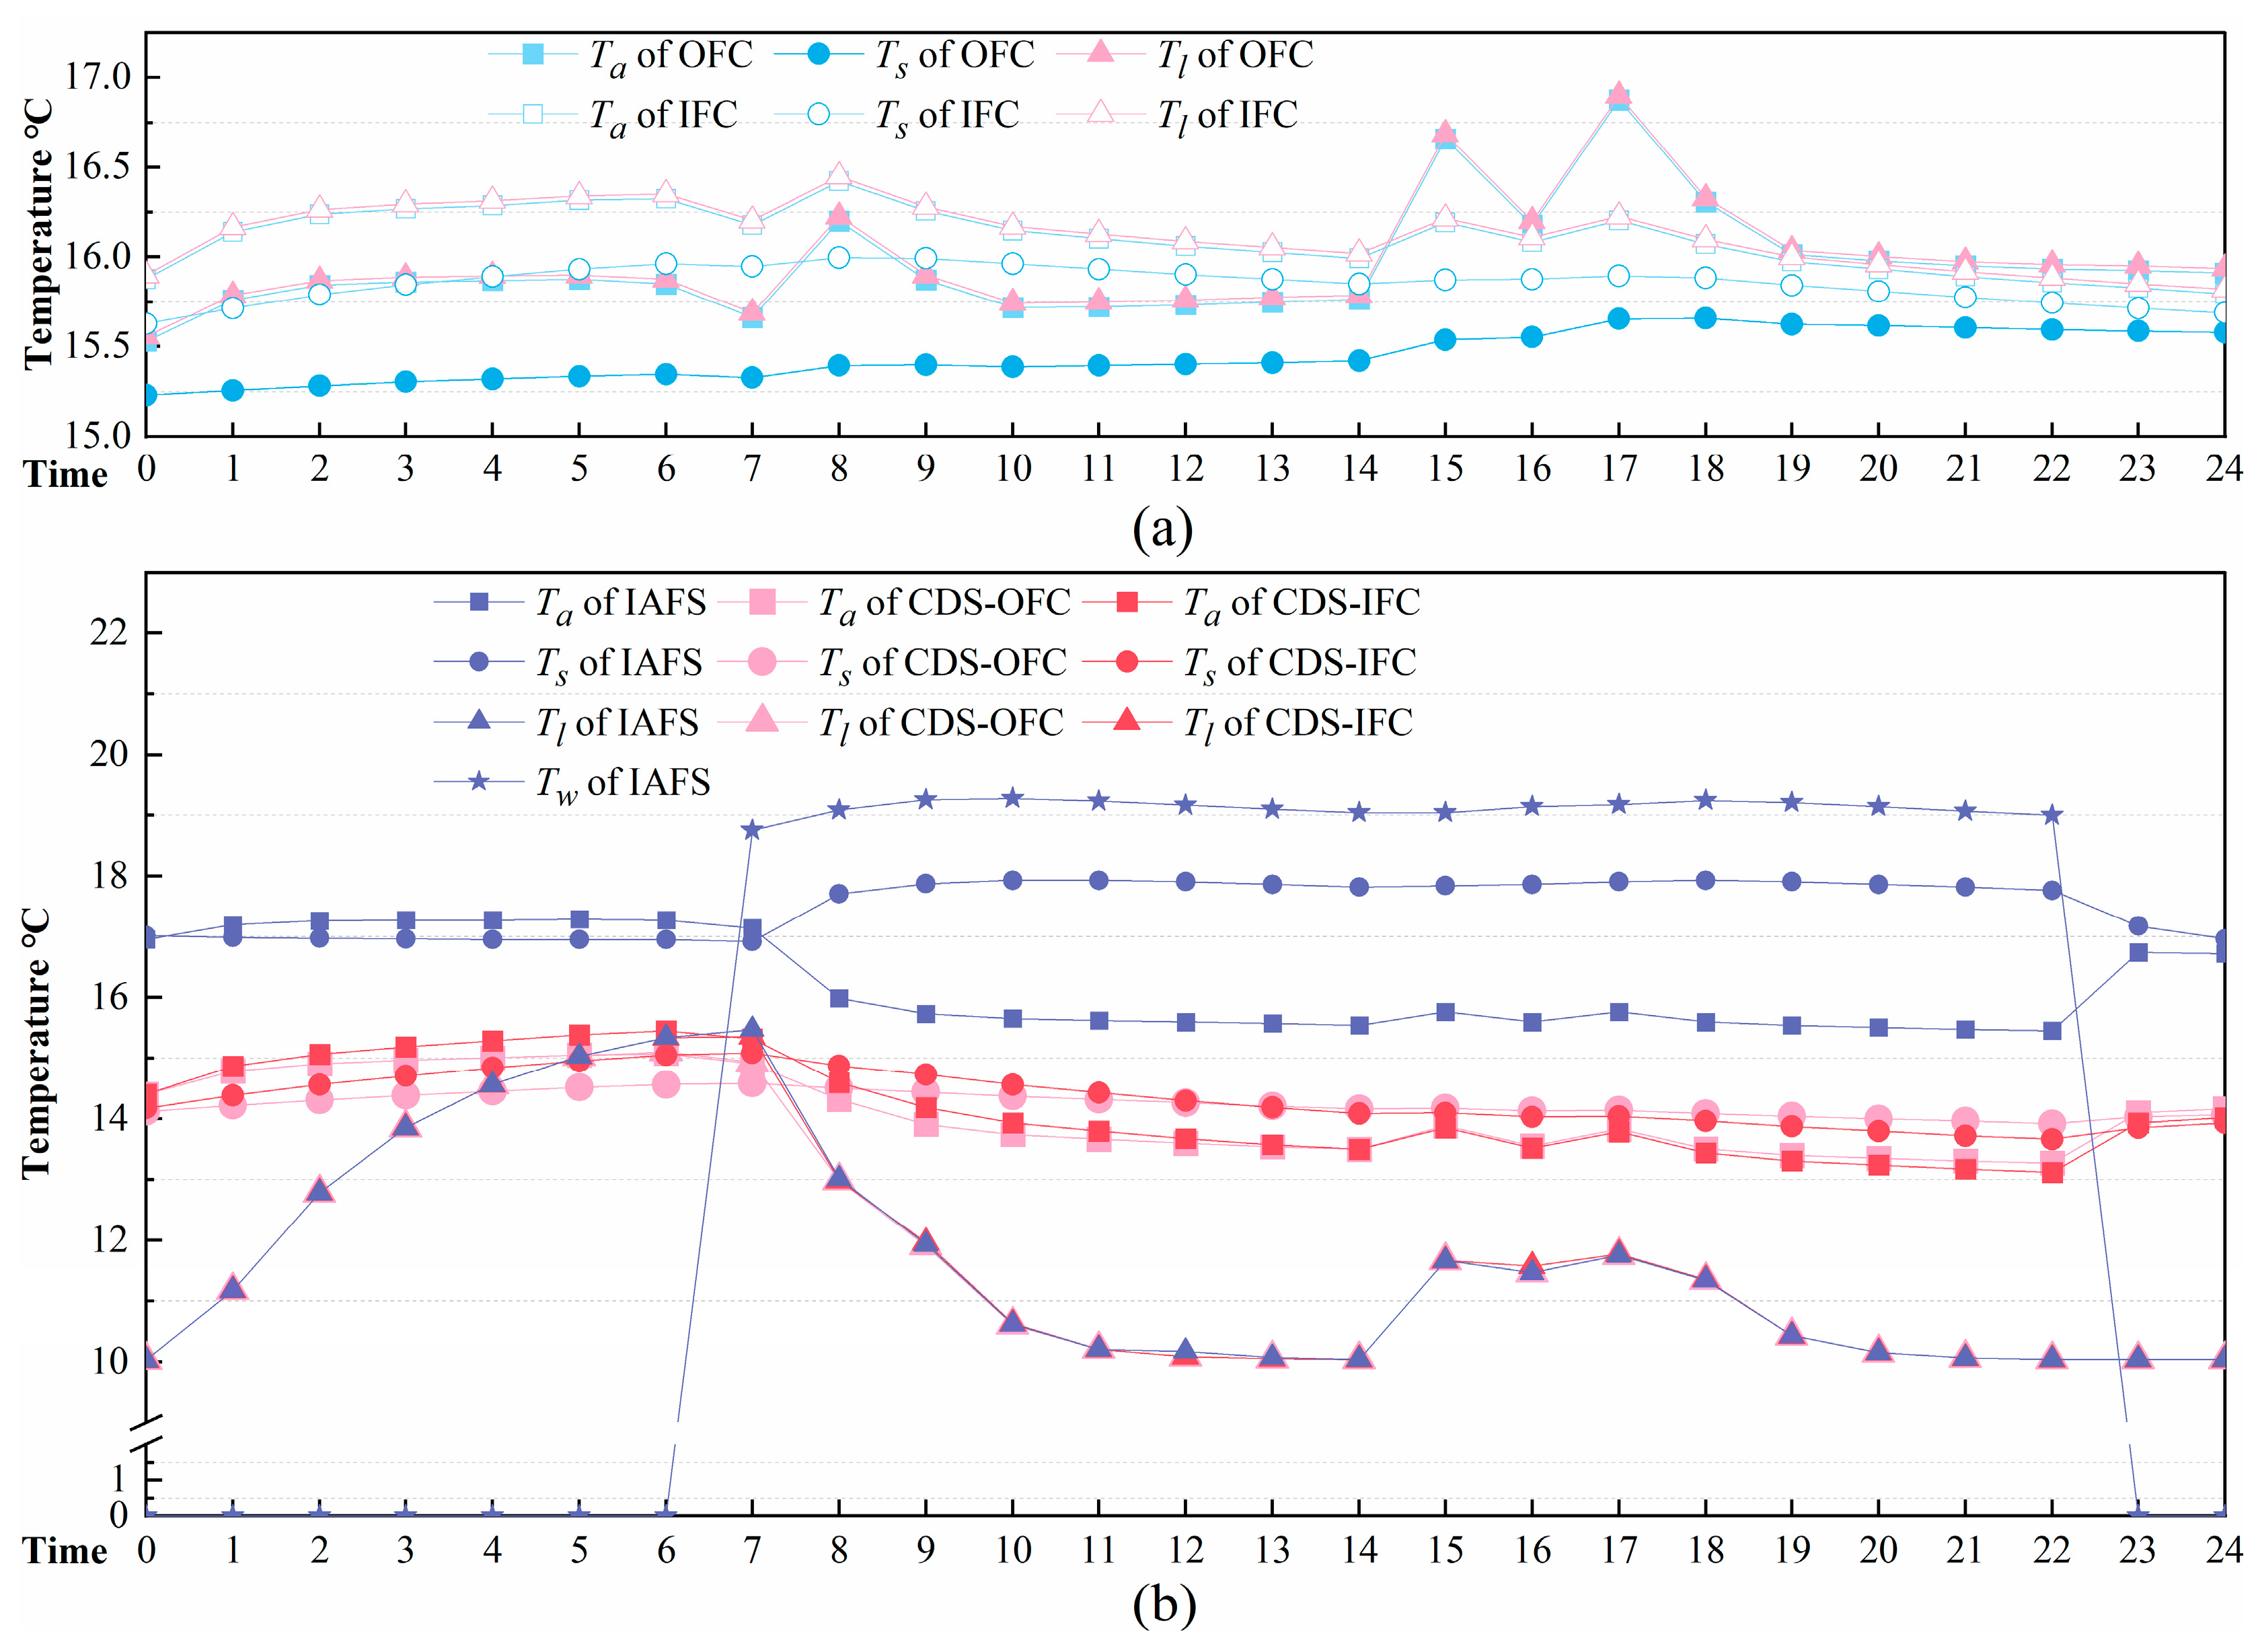
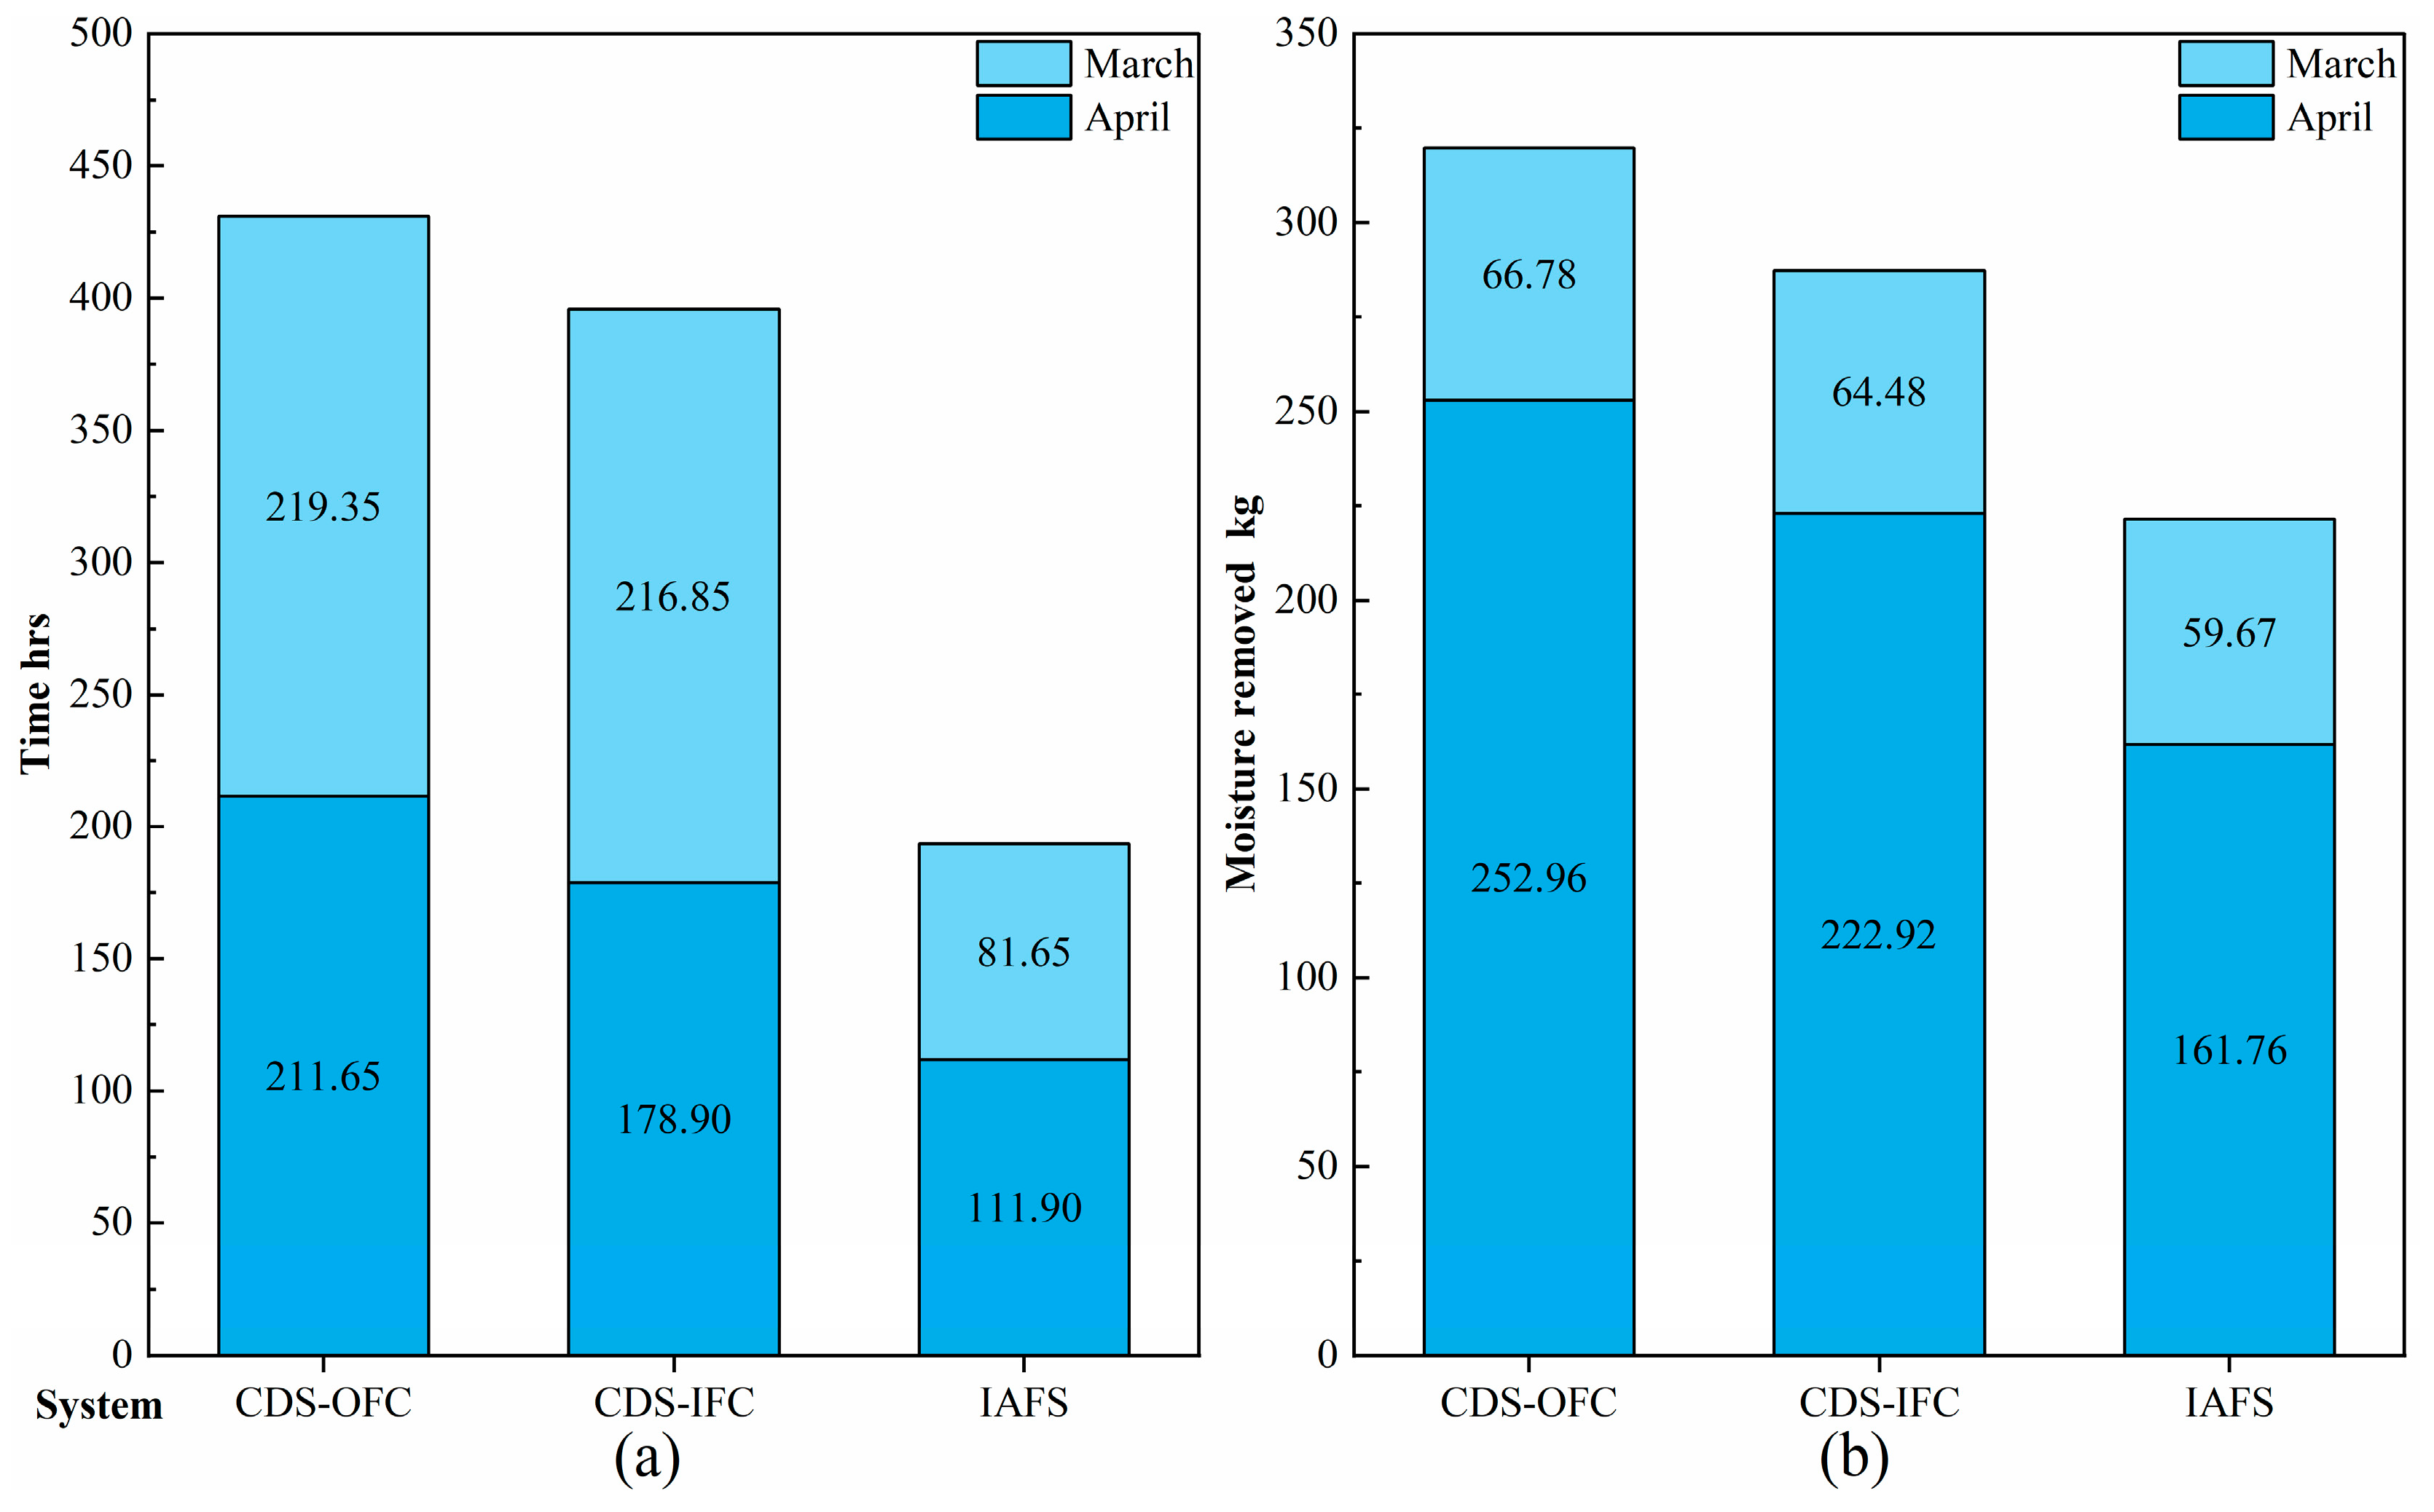
3.1. Condensation Risk Control
3.1.1. IFC vs. OFC
3.1.2. CDS-IFC vs. IFC
3.1.3. IAFS vs. CDS-OFC
3.2. Indoor Comfort
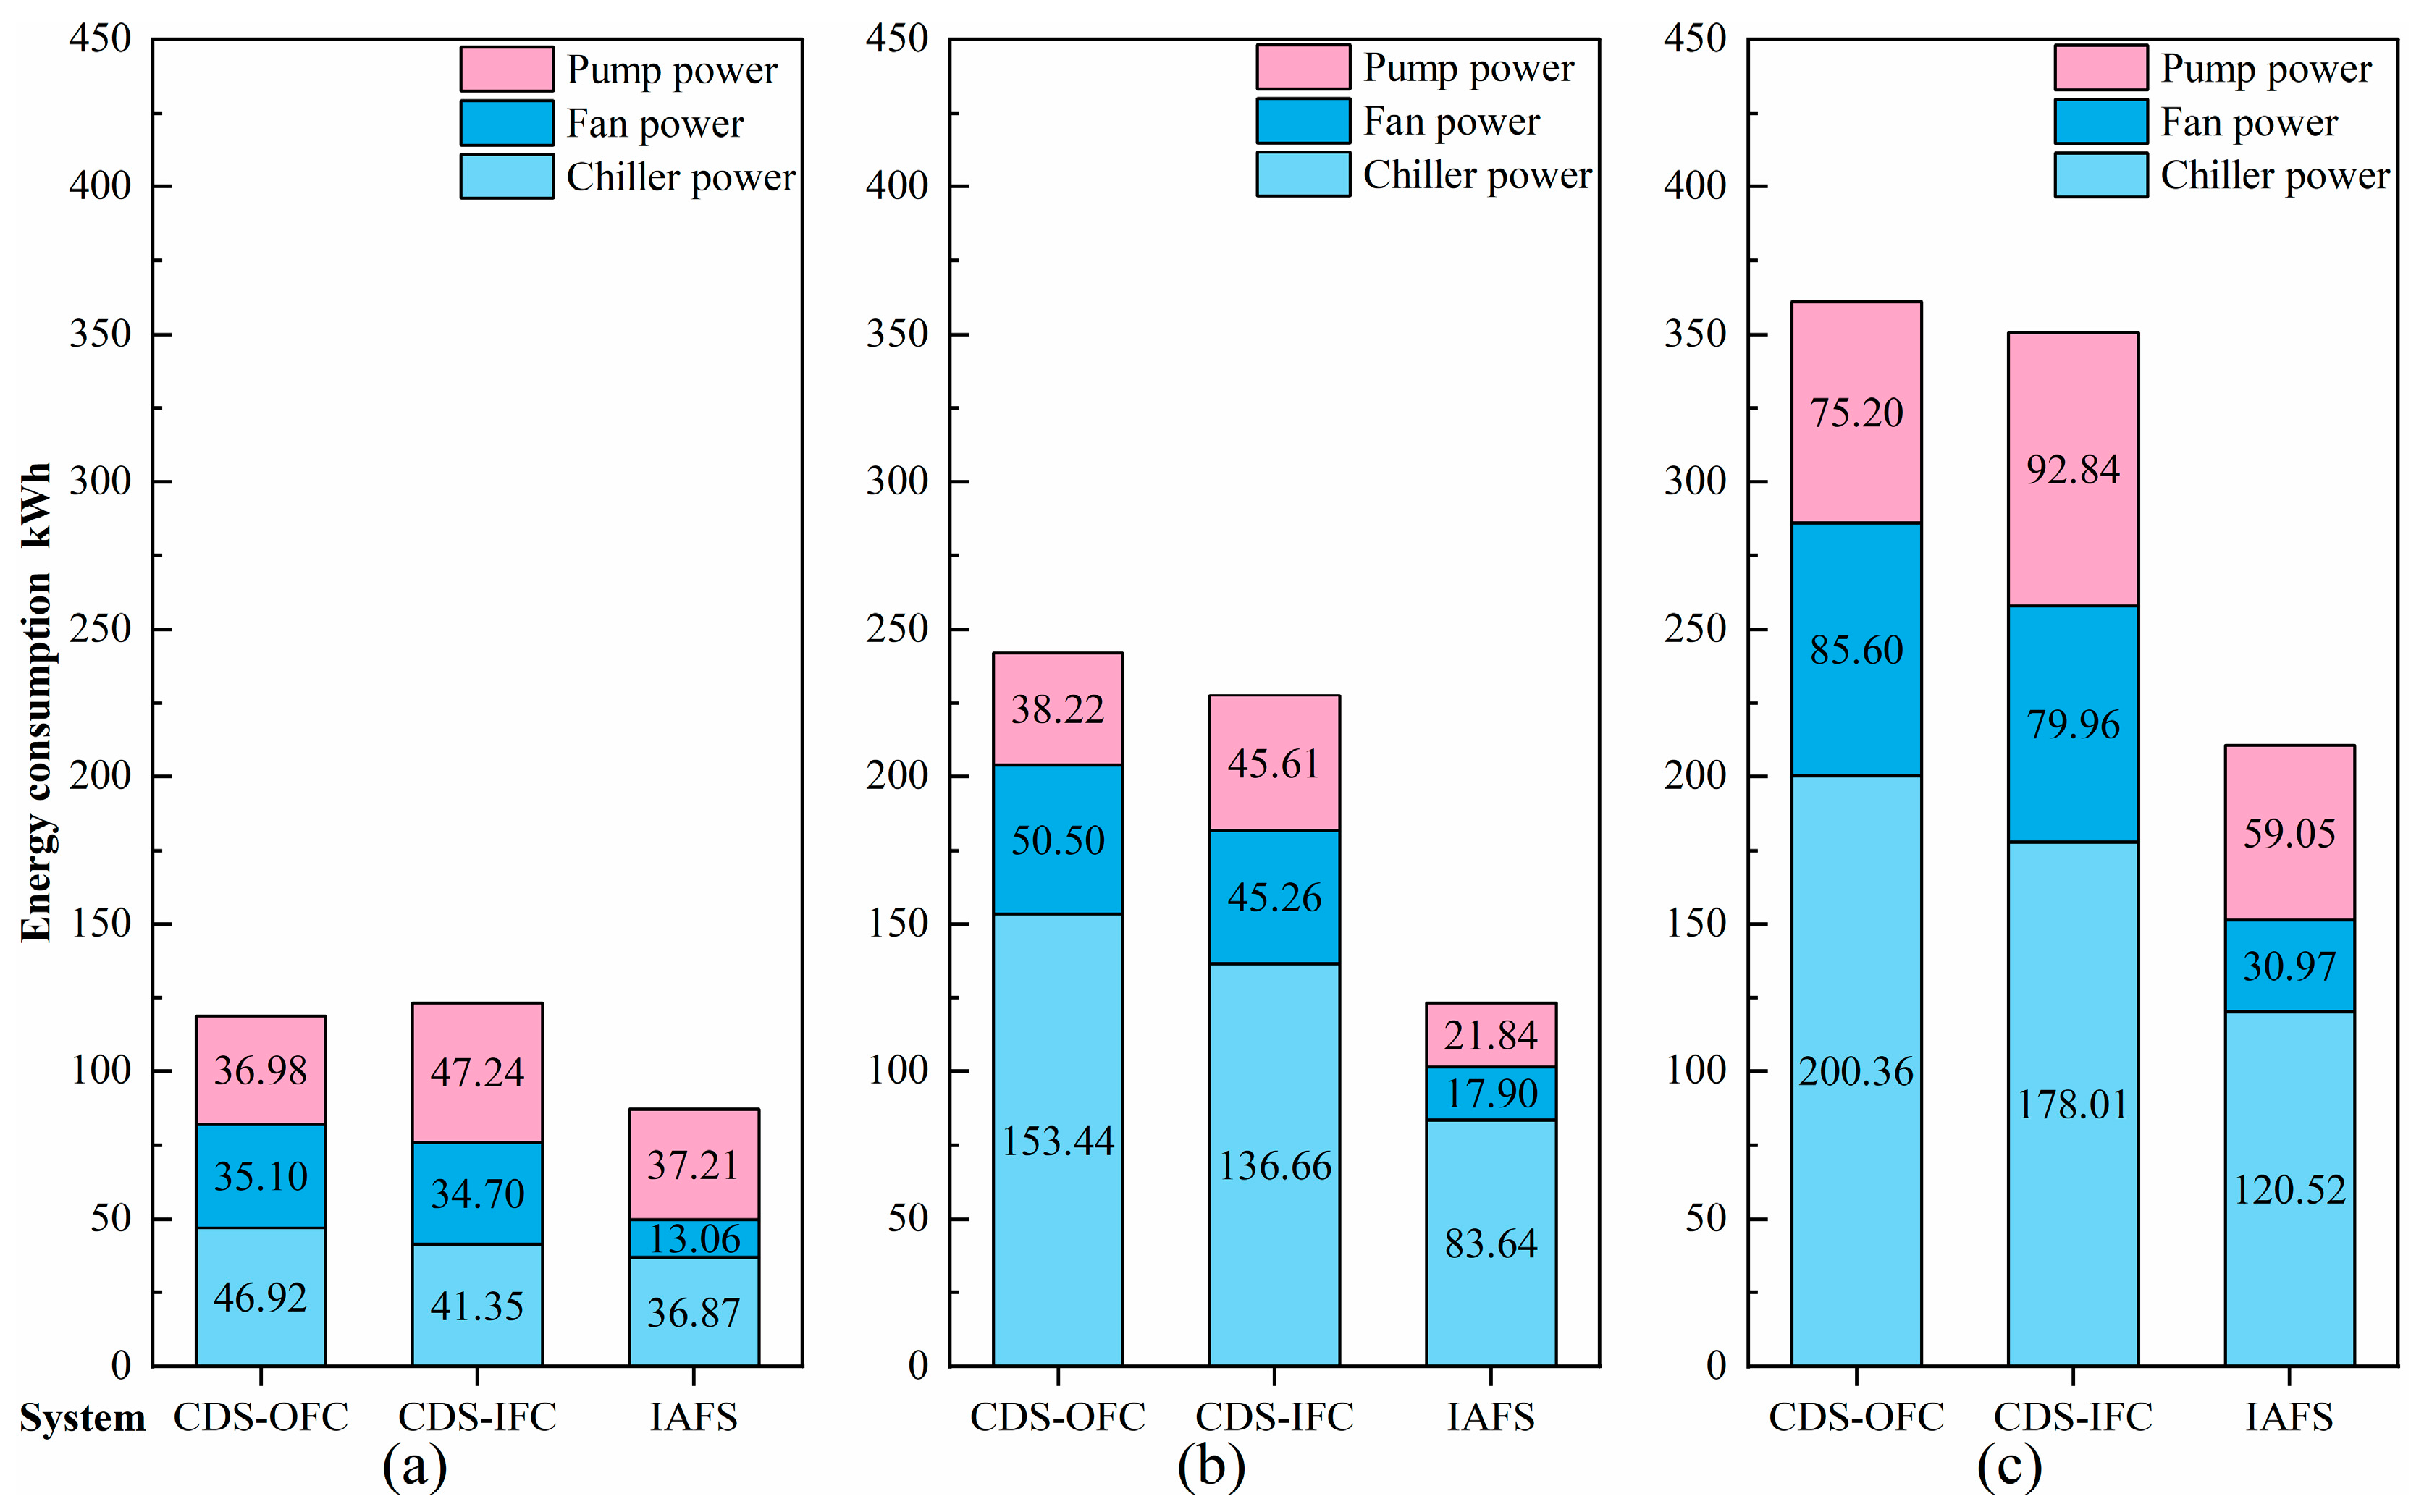
3.3. Energy Consumption
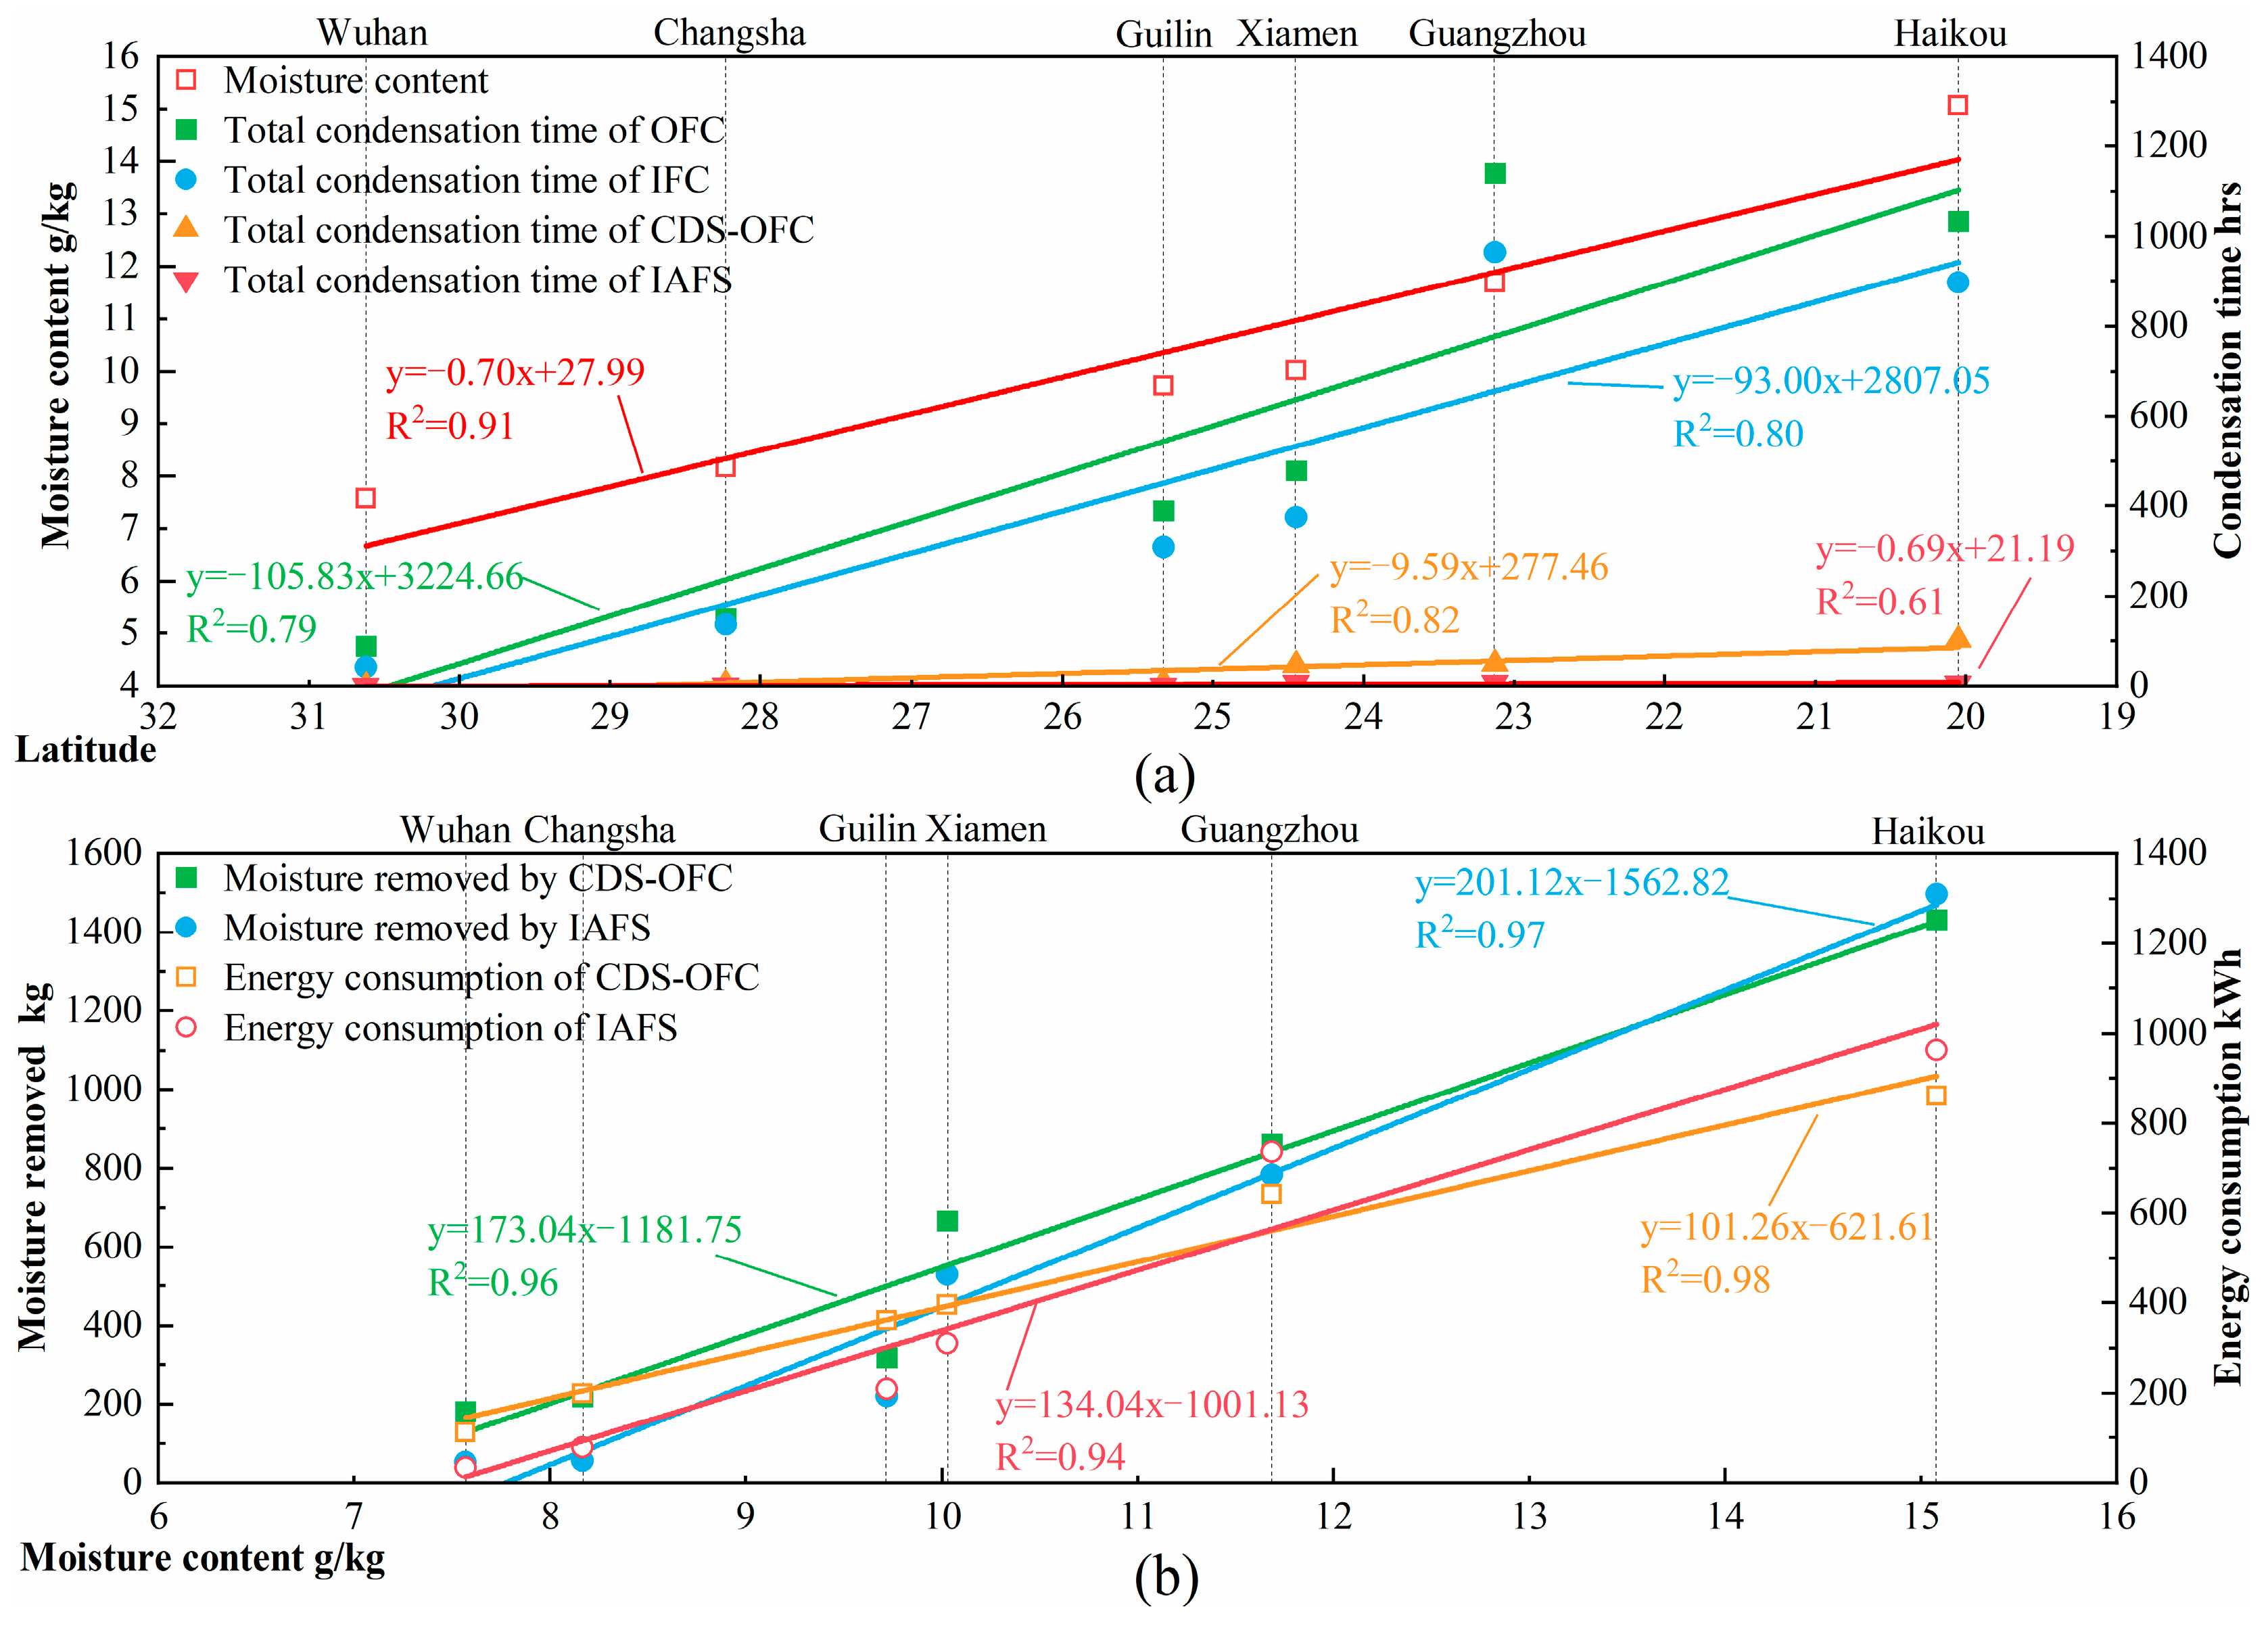
3.4. Application of IAFS in Other Cities
3.4.1. Condensation Risk Control
3.4.2. Energy Consumption
4. Discussion
5. Conclusions
Author Contributions
Funding
Institutional Review Board Statement
Informed Consent Statement
Data Availability Statement
Conflicts of Interest
Abbreviations
| c | Heat pump ambient temperature correction factor |
| CAPr | Normalized cooling capacity |
| COPr | Normalized coefficient of performance |
| d | Heat pump outlet water temperature correction factor |
| Ga | Water flow after pump frequency conversion, m3/h |
| Go | Rated water flow of pump, m3/h |
| Ta | Indoor air temperature, °C |
| Tamb | Ambient temperature, °C |
| Te | Outlet water temperature, °C |
| Tl | Indoor air dew-point temperature, °C |
| To,amb | Ambient temperature of heat pump standard conditions, °C |
| To,e | Outlet water temperature of heat pump standard conditions, °C |
| Tr,amb | Normalized ambient temperature |
| Tr,e | Normalized outlet water temperature |
| Ts | Floor surface temperature, °C |
| Tw | Supply water temperature, °C |
| CAP | Chiller cooling capacity |
| CDS | Cooling dehumidification system |
| COP | Coefficient of performance |
| IAFS | Innovative anti-condensation floor system |
| IFC | Innovative floor with capillary mats |
| OFC | Original floor construction without capillary mats |
| PMV | Predicted mean vote |
| XPS | Extrusion polystyrene insulation |
References
- Zhang, Y.; Wu, Z.; Zhang, M.; Mai, J.; Jin, L.; Wang, F. Smart Indoor Humidity and Condensation Control in the Spring in Hot-Humid Areas. Build. Environ. 2018, 135, 42–52. [Google Scholar] [CrossRef]
- Du, C.; Li, B.; Zhao, Z.; Norbäck, D.; Cai, J.; Deng, Q.; Lu, C.; Qian, H.; Zheng, X.; Zhang, X.; et al. Home Dampness/Mold(D/M) Improvement in Children’s Residences over the Past Decade in China-a Comparison of Repeated Surveys in 2010 and 2019. Build. Environ. 2021, 205, 108181. [Google Scholar] [CrossRef]
- Mendell, M.J.; Macher, J.M.; Kumagai, K. Measured Moisture in Buildings and Adverse Health Effects: A Review. Indoor Air 2018, 28, 488–499. [Google Scholar] [CrossRef]
- Qian, H.; Tang, M.; Wang, D.; Fang, J. Effect of Insulation Ground on Anti-Condensation in Rural Residence. Procedia Eng. 2017, 180, 91–98. [Google Scholar] [CrossRef]
- Tang, M.; Lin, X.; Xu, Y.; Ren, J.; Qian, H. Study on the Optimization of Ground Damp-proofing in Rural Residence in Hot Summer and Cold Winter Zone. Build Sci. 2022, 38, 113–118. [Google Scholar] [CrossRef]
- Nan, Y.; Feng, Y.; Zhong, H.; Liu, Y. Damp Proof Design for Raised Floors of Rammed Earth Folk House in Sichuan and Chongqing. Build Sci. 2015, 31, 90–94. [Google Scholar] [CrossRef]
- Song, J.; Yu, X.; Zhang, Z. Moisture-proof Engineering Measures of Light Wood Frame Construction. Architect. Technol. 2011, 42, 596–598. [Google Scholar]
- Yue, L.; Yonggao, Y.; Xingwang, Z.; Chengbin, Z. Effects of Liquid-Desiccant Air Conditioning Processes on the Presence of Inhalable Particles in the Air. Build. Environ. 2021, 194, 107662. [Google Scholar] [CrossRef]
- Englart, S.; Rajski, K. A Novel Membrane Liquid Desiccant System for Air Humidity Control. Build. Environ. 2022, 225, 109621. [Google Scholar] [CrossRef]
- Zhao, H.; Wu, Y.; Lin, B.; Sun, H. Experimental investigation on the improvement of cooling and dehumidification of a direct-expansion terminal integrated with flat heat pipe. Energy Build. 2022, 260, 111922. [Google Scholar] [CrossRef]
- Fang, S.; Xu, Z.; Zhou, X.; Zhang, H.; Zhi, X.; Qiu, L. Cascade deep air dehumidification with integrated direct-contact cooling and liquid desiccant absorption. Energy Convers. Manag. 2022, 268, 115959. [Google Scholar] [CrossRef]
- Salins, S.S.; Kota Reddy, S.V.; Kumar, S. Effect of Climatic Conditions on the Performance of a Multistage Dynamic Dehumidifier Test Rig. Build. Environ. 2021, 205, 108245. [Google Scholar] [CrossRef]
- Cui, Q.; Qu, H.; Sun, B.; Gao, E.; Zhang, X. Operating characteristics and performance evaluation of carbon dioxide heat pump driven liquid desiccant dehumidification systems: A comparative study. Energy Convers. Manag. 2022, 254, 115298. [Google Scholar] [CrossRef]
- Zhang, L.; Liu, X.-H.; Jiang, Y. Ideal Efficiency Analysis and Comparison of Condensing and Liquid Desiccant Dehumidification. Energy Build. 2012, 49, 575–583. [Google Scholar] [CrossRef]
- Tian, S.; Su, X.; Geng, Y.; Li, H.; Liang, Y.; Di, Y. Heat Pump Combined with Single-Stage or Two-Stage Desiccant Wheel System? A Comparative Study on Different Humidity Requirement Buildings. Energy Convers. Manag. 2022, 255, 115345. [Google Scholar] [CrossRef]
- Ge, F.; Wang, C. Exergy Analysis of Dehumidification Systems: A Comparison between the Condensing Dehumidification and the Desiccant Wheel Dehumidification. Energy Convers. Manag. 2020, 224, 113343. [Google Scholar] [CrossRef]
- Li, Z.; Liu, X.-H.; Lun, Z.; Jiang, Y. Analysis on the Ideal Energy Efficiency of Dehumidification Process from Buildings. Energy Build. 2010, 42, 2014–2020. [Google Scholar] [CrossRef]
- Han, X.; Zhang, X.; Wang, L.; Niu, R. A Novel System of the Isothermal Dehumidification in a Room Air-Conditioner. Energy Build. 2013, 57, 14–19. [Google Scholar] [CrossRef]
- Ge, F.; Guo, X.; Hu, Z.; Chu, Y. Energy Savings Potential of a Desiccant Assisted Hybrid Air Source Heat Pump System for Residential Building in Hot Summer and Cold Winter Zone in China. Energy Build. 2011, 43, 3521–3527. [Google Scholar] [CrossRef]
- Su, W.; Li, H.; Sun, B.; Li, S.; Zhang, X. Performance Investigation on a Frost-Free Air Source Heat Pump System Employing Liquid Desiccant Dehumidification and Compressor-Assisted Regeneration Based on Exergy and Exergoeconomic Analysis. Energy Convers. Manag. 2019, 183, 167–181. [Google Scholar] [CrossRef]
- Zhi, Y.; Yang, X. Household solid desiccant dehumidifier with multiple operating modes: Concept and prototype device. J. Build. Eng. 2023, 66, 105964. [Google Scholar] [CrossRef]
- Xu, S.; Niu, J.; Ma, H.; Ma, G. Cooling and Dehumidification Performance Study of a New Air Conditioning System with Double Evaporation Temperature. Energy Build. 2023, 295, 113294. [Google Scholar] [CrossRef]
- Xu, A.; Wang, Y.; Song, T.; Xie, N.; Liu, Z. Thermodynamic analyses of an innovative system combined dehumidification, cooling and heating driven by solar energy. Energy Convers. Manag. 2023, 279, 116757. [Google Scholar] [CrossRef]
- He, F.; Yang, W.; Ling, Z.Y.; Ling, Z. Comparative investigation on performance of single-stage and double-stage desiccant dehumidification boxes under hot-humid climatic conditions. Int. J. Refrig. 2023, 146, 109–120. [Google Scholar] [CrossRef]
- Li, W.; Yin, Y.; Wang, Y. Performance evaluation of a heat pump-driven liquid desiccant dehumidification system integrated with fresh air supply. Energy Build. 2022, 275, 112473. [Google Scholar] [CrossRef]
- Shamim, J.A.; Hsu, W.-L.; Paul, S.; Yu, L.; Daiguji, H. A Review of Solid Desiccant Dehumidifiers: Current Status and near-Term Development Goals in the Context of Net Zero Energy Buildings. Renew. Sustain. Energy Rev. 2021, 137, 110456. [Google Scholar] [CrossRef]
- de Dear, R.J.; Akimoto, T.; Arens, E.A.; Brager, G.; Candido, C.; Cheong, K.W.D.; Li, B.; Nishihara, N.; Sekhar, S.C.; Tanabe, S.; et al. Progress in Thermal Comfort Research over the Last Twenty Years. Indoor Air 2013, 23, 442–461. [Google Scholar] [CrossRef] [Green Version]
- Zhu, Y.; Luo, M.; Ouyang, Q.; Huang, L.; Cao, B. Dynamic Characteristics and Comfort Assessment of Airflows in Indoor Environments: A Review. Build. Environ. 2015, 91, 5–14. [Google Scholar] [CrossRef]
- Lowenstein, A. Review of Liquid Desiccant Technology for HVAC Applications. HVAC&R Res. 2008, 14, 819–839. [Google Scholar] [CrossRef]
- Rafique, M.M.; Gandhidasan, P.; Bahaidarah, H.M.S. Liquid Desiccant Materials and Dehumidifiers—A Review. Renew. Sustain. Energy Rev. 2016, 56, 179–195. [Google Scholar] [CrossRef]
- Wang, L.; Wang, G. Application of temperature and humidity independent control to a combined workshop of a cigarette factory in Shanghai. Heat. Vent. Air Cond. 2015, 8, 73–76. [Google Scholar]
- Abdullah, S.; Zubir, M.N.B.M.; Muhamad, M.R.B.; Newaz, K.M.S.; Öztop, H.F.; Alam, M.S. Technological development of evaporative cooling systems and its integration with air dehumidification processes: A review. Energy Build. 2023, 283, 112805. [Google Scholar] [CrossRef]
- Qi, R.; Dong, C.; Zhang, L. A review of liquid desiccant air dehumidification: From system to material manipulations. Energy Build. 2020, 215, 109897. [Google Scholar] [CrossRef]
- Chen, R.; Li, Y. Property Equipment and Facilities Management, 3rd ed.; Beijing Institute of Technology Press: Beijing, China, 2021; p. 158. [Google Scholar]
- Min, Y.; Shi, W.; Shen, B.; Chen, Y.; Yang, H. Enhancing the cooling and dehumidification performance of indirect evaporative cooler by hydrophobic-coated primary air channels. Int. J. Heat Mass Transf. 2021, 179, 121733. [Google Scholar] [CrossRef]
- Hu, R.; Lu, L.; Lu, J.; Liang, C.; Lan, T.; He, Z. A Moisture-proof System of Building Envelope Surface Based on Inverse Carnot Cycle. CN216203898U, 5 April 2022. [Google Scholar]
- Hu, R.; Niu, J.L. A Review of the Application of Radiant Cooling & Heating Systems in Mainland China. Energy Build. 2012, 52, 11–19. [Google Scholar] [CrossRef]
- Li, B. Application and Characteristic of the Heating System with Low-temperature Hot-water Floor Radiation. J. North China Univ. Water Resour. Electr. Power (Nat. Sci. Ed.) 2007, 4, 45–47. [Google Scholar] [CrossRef]
- Zheng, M.; Pan, S. Application as Commissioning Tool of Various HVAC Simulation Programs and Visual Tools. In Proceedings of the 10th International Building Performance Simulation Association Conference and Exhibition-Building Simulation, Beijing, China, 3 September 2007; pp. 1975–1982. [Google Scholar]
- Crawley, D.B.; Hand, J.W.; Kummert, M.; Griffith, B.T. Contrasting the Capabilities of Building Energy Performance Simulation Programs. Build. Environ. 2008, 43, 661–673. [Google Scholar] [CrossRef] [Green Version]
- Yan, D.; Xia, J.; Tang, W.; Song, F.; Zhang, X.; Jiang, Y. DeST—An Integrated Building Simulation Toolkit Part I: Fundamentals. Build. Simul. 2008, 1, 95–110. [Google Scholar] [CrossRef]
- Zhang, M. Study on Coupled Natural Ventilation Simulation Analysis and Design Guide. Master’s Thesis, Tsinghua University, Beijing, China, 2011. [Google Scholar]
- TRNSYS. Transient System Simulation Tool. Available online: http://www.trnsys.com (accessed on 20 September 2022).
- Ma, X.; Wang, X. Simulation on Solar Assisted Air Source Heat Pump Heating System in Rural House by Using TRNSYS. IOP Conf. Ser. Earth Environ. Sci. 2020, 508, 012035. [Google Scholar] [CrossRef]
- Lu, S.; Zhao, Y.; Fang, K.; Li, Y.; Sun, P. Establishment and Experimental Verification of TRNSYS Model for PCM Floor Coupled with Solar Water Heating System. Energy Build. 2017, 140, 245–260. [Google Scholar] [CrossRef]
- Atienza Márquez, A.; Cejudo López, J.M.; Fernández Hernández, F.; Domínguez Muñoz, F.; Carrillo Andrés, A. A Comparison of Heating Terminal Units: Fan-Coil versus Radiant Floor, and the Combination of Both. Energy Build. 2017, 138, 621–629. [Google Scholar] [CrossRef]
- “China Geography Encyclopedia” Series Editorial Committee. Gaoligong Shan; World Publishing Corporation Guangdong Branch: Guangzhou, China, 2017; pp. 16–17. [Google Scholar]
- Zhang, Y.; Mai, J.; Zhang, M.; Wang, F.; Zhai, Y. Adaptation-Based Indoor Environment Control in a Hot-Humid Area. Build. Environ. 2017, 117, 238–247. [Google Scholar] [CrossRef]
- Air Cooled Chiller/Air Source Heat Pump YCAC Series. Available online: http://file.co188.com/ebook/openEBook2.action?bookId=1145700435775&pageNo=0 (accessed on 20 September 2022).
- Jiang, Y.; Shi, X.; Zhou, X.; Jin, X.; An, J.; Yan, D. Comparison and Verification of the Simulation Results of DeST Based on ASHARE-140 Standard. In Proceedings of the 16th IBPSA Conference, Rome, Italy, 2–4 September 2019; pp. 1506–1513. [Google Scholar]


| Methods /Measures | Cost | Efficiency | Durability |
|---|---|---|---|
| Solid Desiccant [31,32] | Low investment and operating costs | Less stable | Limits practical applications and needs regeneration |
| Liquid Desiccant [31,33] | High initial investment | Effectively controls the indoor humidity | High-temperature heat source and high salt solution consumption |
| Cooling Dehumidification [34,35] | High initial investment and operating costs | Stable and reliable | Free from cross-contamination and convenient management |
| Ventilation | Relatively low | Low | Susceptible to the influence of external environmental factors |
| Floor Structure/System | Describe |
|---|---|
| OFC | Original floor construction without capillary mats |
| IFC | Innovative floor with capillary mats |
| CDS-OFC | Cooling dehumidifier used in the room with OFC |
| CDS-IFC | Cooling dehumidifier used in the room with IFC |
| IAFS | Innovative anti-condensation floor system |
| Equipment | Technical Parameter | System Involved |
|---|---|---|
| Chiller | Air-Cooled Chiller | CDS-OFC |
| Cooling capacity: 13.9 kW | CDS-IFC | |
| Rated power: 5.1 kW | IAFS | |
| Chilled water pump | Water flow rate: 1.6 m3/h | CDS-OFC |
| Water lift: 16 m | CDS-IFC | |
| Rated power: 0.37 kW | IAFS | |
| Circulation pump | Water flow rate: 1.1 m3/h | IAFS |
| Water lift: 8.5 m | ||
| Rated power: 0.18 kW | ||
| Capillary mat | Pipe spacing: 20 mm | IAFS |
| Diameter: 4.3 mm pipe | IFC | |
| Wall thickness: 0.8 mm | ||
| Fan coil | Supply air flow rate: 1020 m3/h | CDS-OFC |
| Rated power: 0.16 kW | CDS-IFC | |
| IAFS |
Disclaimer/Publisher’s Note: The statements, opinions and data contained in all publications are solely those of the individual author(s) and contributor(s) and not of MDPI and/or the editor(s). MDPI and/or the editor(s) disclaim responsibility for any injury to people or property resulting from any ideas, methods, instructions or products referred to in the content. |
© 2023 by the authors. Licensee MDPI, Basel, Switzerland. This article is an open access article distributed under the terms and conditions of the Creative Commons Attribution (CC BY) license (https://creativecommons.org/licenses/by/4.0/).
Share and Cite
Hu, R.; Liang, J.; Lan, T.; Yin, Y.; Liu, G. An Anti-Condensation Radiant Heating Floor System in Buildings under Moistening Weather. Sustainability 2023, 15, 11580. https://doi.org/10.3390/su151511580
Hu R, Liang J, Lan T, Yin Y, Liu G. An Anti-Condensation Radiant Heating Floor System in Buildings under Moistening Weather. Sustainability. 2023; 15(15):11580. https://doi.org/10.3390/su151511580
Chicago/Turabian StyleHu, Rong, Jincan Liang, Ting Lan, Yingde Yin, and Gang Liu. 2023. "An Anti-Condensation Radiant Heating Floor System in Buildings under Moistening Weather" Sustainability 15, no. 15: 11580. https://doi.org/10.3390/su151511580
APA StyleHu, R., Liang, J., Lan, T., Yin, Y., & Liu, G. (2023). An Anti-Condensation Radiant Heating Floor System in Buildings under Moistening Weather. Sustainability, 15(15), 11580. https://doi.org/10.3390/su151511580