Article

Precursor Signal Identification and Acoustic Emission Characteristics of Coal Fracture Process Subjected to Uniaxial Loading

1
College of Safety Science and Engineering, Xi’an University of Science and Technology, Xi’an 710054, China
2
Key Laboratory of Western Mine and Hazard Prevention, Ministry of Education of China, Xi’an 710054, China
3
School of Chemistry and Chemical Engineering, Xi’an University of Science and Technology, Xi’an 710054, China
*
Author to whom correspondence should be addressed.
Sustainability 2023, 15(15), 11581; https://doi.org/10.3390/su151511581
Submission received: 17 May 2023 / Revised: 25 June 2023 / Accepted: 25 July 2023 / Published: 26 July 2023
(This article belongs to the Collection Mine Hazards Identification, Prevention and Control)

Abstract

:
In deep underground mine engineering, the critical warning signals before the sudden failure of coal are crucial to predict coal or rock dynamic catastrophes and to help the coal industry grow sustainably. Therefore, with the objective of accurately identifying the precursor signals of coal fracture, a uniaxial compression test was adopted. Tests were performed on multiple sets of raw coal samples, and acoustic emission (AE) technology was used to capture the deformation and destruction courses of the coal samples. Furthermore, the signal intensity of AE energy was discussed. Based on the critical slowing down theory, the AE energy sequence was processed. The results indicate that there are significant discrepancies in the strength of coal affected by initial pore fissures. During the whole loading process, the AE energy signals showed obvious stage characteristics, and there was a high risk of rapid coal energy storage during the unstable rupture development (URD) stage, which predicted the imminent destruction of the coal. The variance mutation point that was not affected by the lag step selection was easier to identify than that of the autocorrelation coefficient, and the precursor points were all in the URD stage, which is more accurate than using the AE cumulative energy curve slope.

1. Introduction

In recent years, China has promoted a green shift in its energy structure and encouraged the energy sector to follow a sustainable development path. As the basic power of China, coal will still occupy a dominant position in China’s energy for a considerable period of time in the future [1,2], and mining coal resources safely and efficiently is the key to ensure the sustainable development of the coal industry [1]. With the increasing of the number and capacity of deep coal mines in the last few years, the deep mining of coal resources in China has become an inevitable trend. Coal or rock dynamic catastrophes such as coal burst, roof pressuring, and coal and gas outburst are becoming increasingly serious, causing an enormous threat to the safe production of coal mines [3,4] and seriously hindering the sustainable development of the coal mining industry. Therefore, research of effective coal or rock dynamic catastrophe monitoring methods has become an important scientific issue that will be helpful to guarantee the sustainable development of coal as the main energy source in the energy structure.
The extension of cracks in coal rocks is an extremely complex phenomenon that is accompanied by the emergence, extension and penetration of microcracks during the loading process, causing the deformation of coal rocks at the same time [5,6]. Numerous studies have shown that strain is an important index of coal rock fracture evolution [5,7]. Munoz proposed a non-contact optical uniaxial compressive strain measurement method based on 3D DIC to measure the strain field formed by compressed sandstone more accurately [8]. Ma et al. analyzed the evolution law of strain field on a loaded coal or rock surface. It is believed that the evolution of microcracks in coal or rock is related to the statistical index of strain field [9]. Hou et al. studied the practical micro-scale deformation and crack evolution law of in situ coal seams through simulation experiments [10]. Based on the relationship between strain and fracture development, many scholars have conducted studies from another aspect.
During the process of loading coal or rock, there is the plastic deformation of coal/rock [11,12], associated with the release of energy, part of which is released as elastic waves, namely acoustic emission (AE) [13,14]. These acoustic emission signals provide an effective index for the coal fracture process [15,16] because they reflect the location, formed mechanism and releasing energy of coal rock micro-cracks [17,18]. As a means of non-destructively monitoring and characterizing the development of internal fractures in quasi-brittle materials [19], one of the areas of acoustic emission studies in the laboratory is the time-varying parameters of damage generation [20,21], determining how microcracks accumulate under external loading [22,23]. In the course of destroyed coal or rock, AE means can capture a variety of parameters, including impact times, ringing counts, energy, etc. [24,25], and the occurrence of coal or rock dynamics catastrophes can be predicted [26,27]. Although the genesis of dynamic catastrophes can be forecast by AE as a concomitant signal in coal or rock fracture, its effectiveness is not stable. In the last few years, scientists have discovered that when complex dynamic systems approach a tipping point before a mutation occurs, there is a phenomenon with predictive significance called critical slowing down [28,29]. The critical slowing phenomenon has enormous potential in disclosing whether a sophisticated dynamic system is susceptible to ruinous mutations. Nowadays, it has been used to predict ecological problems [28], earthquakes [29] and climate disasters [30,31]. Therefore, to further identify the precursors of disaster occurrence accurately and effectively is a key issue in the future research field of coal engineering for coal rock dynamics disasters.
Based on the previous research, acoustic emission technology has achieved many excellent results with regard to early warning potential rupture indicators [32,33] in the monitoring and application [34] of rock [35,36], but there are few research results on the critical slowing down of coal specimens [37,38]. Therefore, the research on critical slowing down of coal is particularly important for forewarning and prevention of dynamic catastrophes in the coal mining industry. Through uniaxial compression experiments, AE signals were captured during the fracture process of coal. The critical slowing down theory was used as the basic principle, and the AE signal generated by coal failure was processed. It was concluded that the variance and autocorrelation coefficient characterized the critical slowing phenomenon appearing in the later stage of coal fracture. The sudden increase phenomenon can be regarded as an effective precursor of coal instability destruction.

2. Experiment

2.1. Experimental System

The experimental system is shown in Figure 1 and is composed of the loading control subsystem and the AE monitoring subsystem. In the loading control subsystem, the experimental platform of impact mechanics at high and low frequency was used. The output maximum force is 3000 kN, the output maximum impact force is 1000 kN, the impact reaction time is <0.3 s, the precision of the test machine is 1%, the speed of piston displacement is 1–50 mm/min, and the loading rate of the sample machine is 0.02–2% FS. There are force and displacement control methods that can be used to carry out uniaxial compression, tensile, cyclic loading and other mechanical experiments. In the acoustic emission monitoring subsystem, a Micro-II Express acoustic emission monitoring and data analysis instrument was adopted that could collect the AE data of 24 probes at the same time.

2.2. Experimental Method

During the uniaxial compression loading process, the acoustic emission monitoring data were collected simultaneously. The experimental loading method was force-controlled loading (the loading rate of 50 N/s), in which the stress–strain was recorded automatically. Six acoustic emission probes (model was NANO-30, peak frequency was 300 kHz) were pasted on the surface of each coal sample to measure AE signal when it was damaged under uniaxial compression. The amplification ratio of the pre-amplifier was set at 40 dB, and the threshold was set at 40 dB. The signal sampling rate was 1 MHz and the sampling length was 1024 points (the first 1/4 of which are pre-triggered) to ensure the coupling between the sample and each AE probe. When the coal sample was placed on the experimental platform, a stress of 0.5 kN could be preloaded first.

2.3. Experimental Material

To avoid the contingency of experimental phenomena, the uniaxial compression experiments shown in Figure 2 had three groups of rectangular standard coal samples with a length × width × height of 50 mm × 50 mm × 100 mm. The parallelism of both ends of the samples was no more than 0.05 mm, and the axial deviation was no more than 0.25 mm. In order to verify the validity of the precursors of coal fracture based on the critical slowing down theory for samples with different damage conditions, coal samples with different internal fractures and damage conditions were selected for the test.

3. Results

3.1. Mechanical Properties of Coal in Loading Process

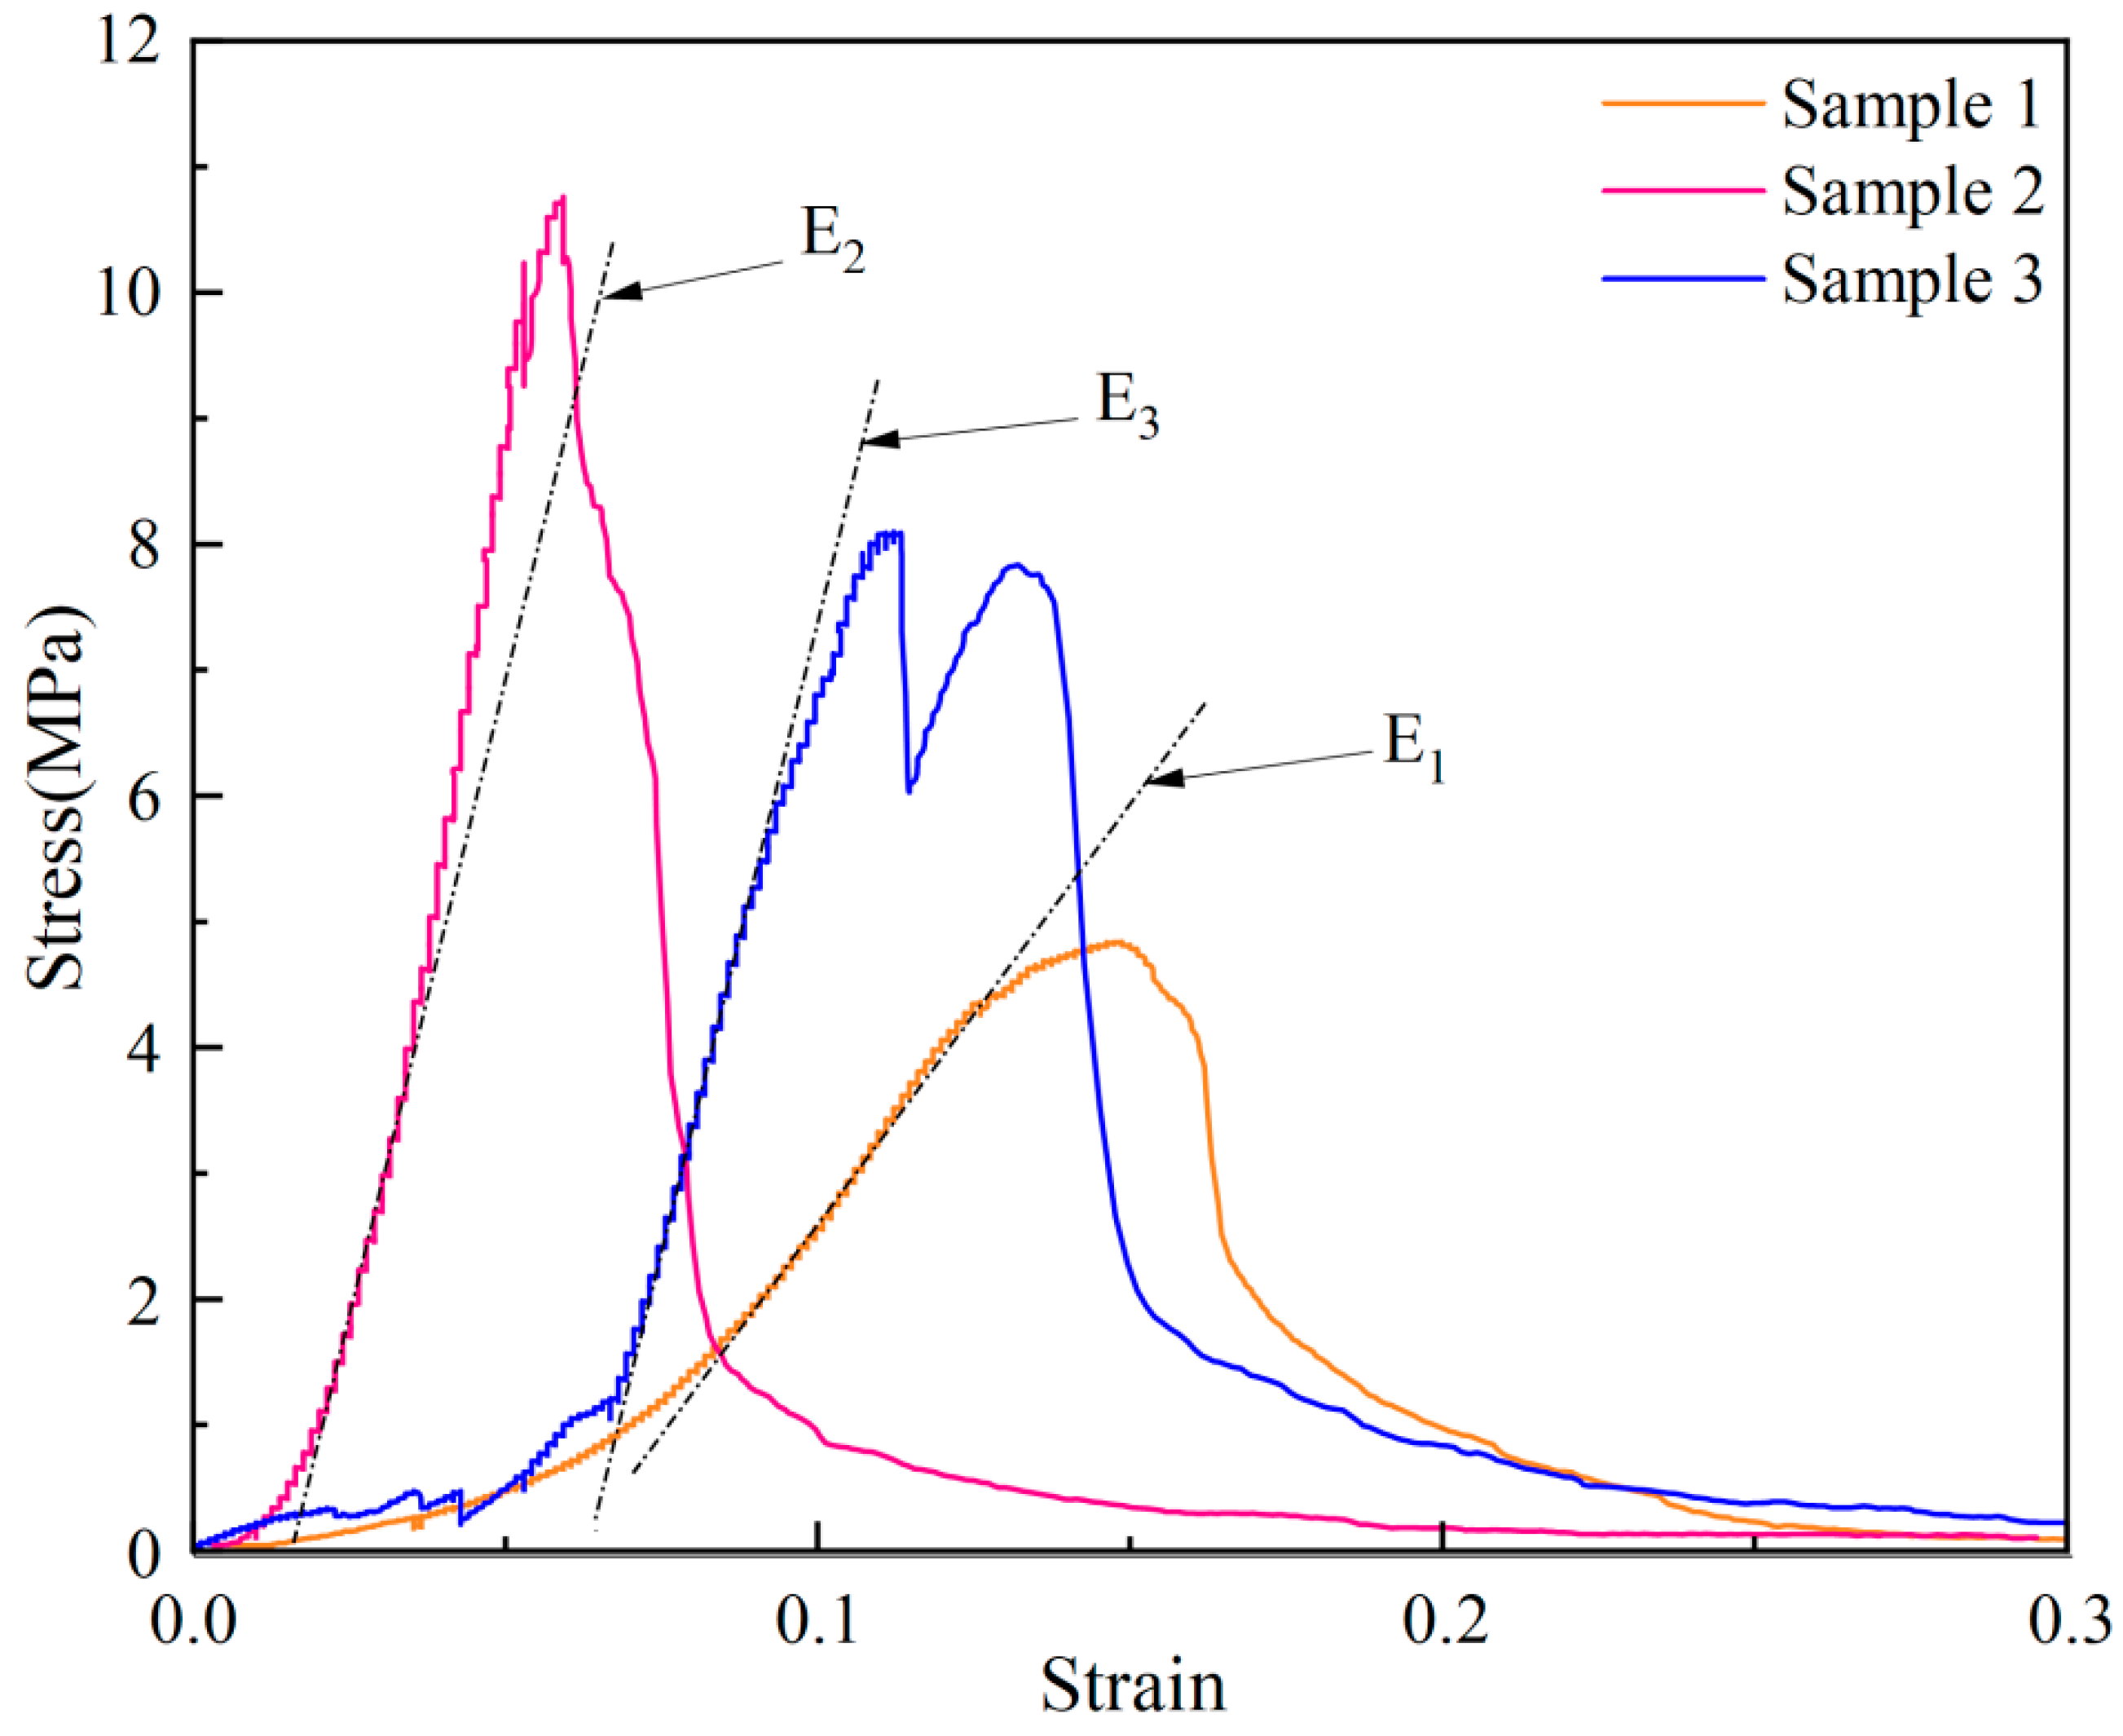
The deformation and failure states of coal samples vary during loading due to their own internal damage and primary fracture conditions [39,40]. Figure 3 shows the stress–strain curve, which has typical compaction, elastic, strengthening and post-peak phases.
The strength of coal is significantly different among raw coal samples taken from the same coal source and is influenced by its pores and fissures. However, the better the integrity of the coal samples, i.e., no obvious surface fissures, the higher the strength, the longer the elastic phase, the more obvious the stress drop in the post-peak phase, and the shorter the damage time. On the contrary, the more significant the softening characteristics of the post-peak stress, the longer the damage time. The elastic modulus was calculated according to the stress–strain relationship in the elastic phase, and the uniaxial compressive strength was calculated at the time of coal destruction. The elastic modulus, uniaxial compressive strength and size of breaking strain of the coal samples used in the test affected by fissures were obtained statistically as shown in Table 1, and the statistical results show that the elastic modulus and uniaxial compressive strength increased with the increase in coal body integrity and the breaking strain decreased with the increase in coal body integrity.

3.2. Evolution Laws of AE Energy

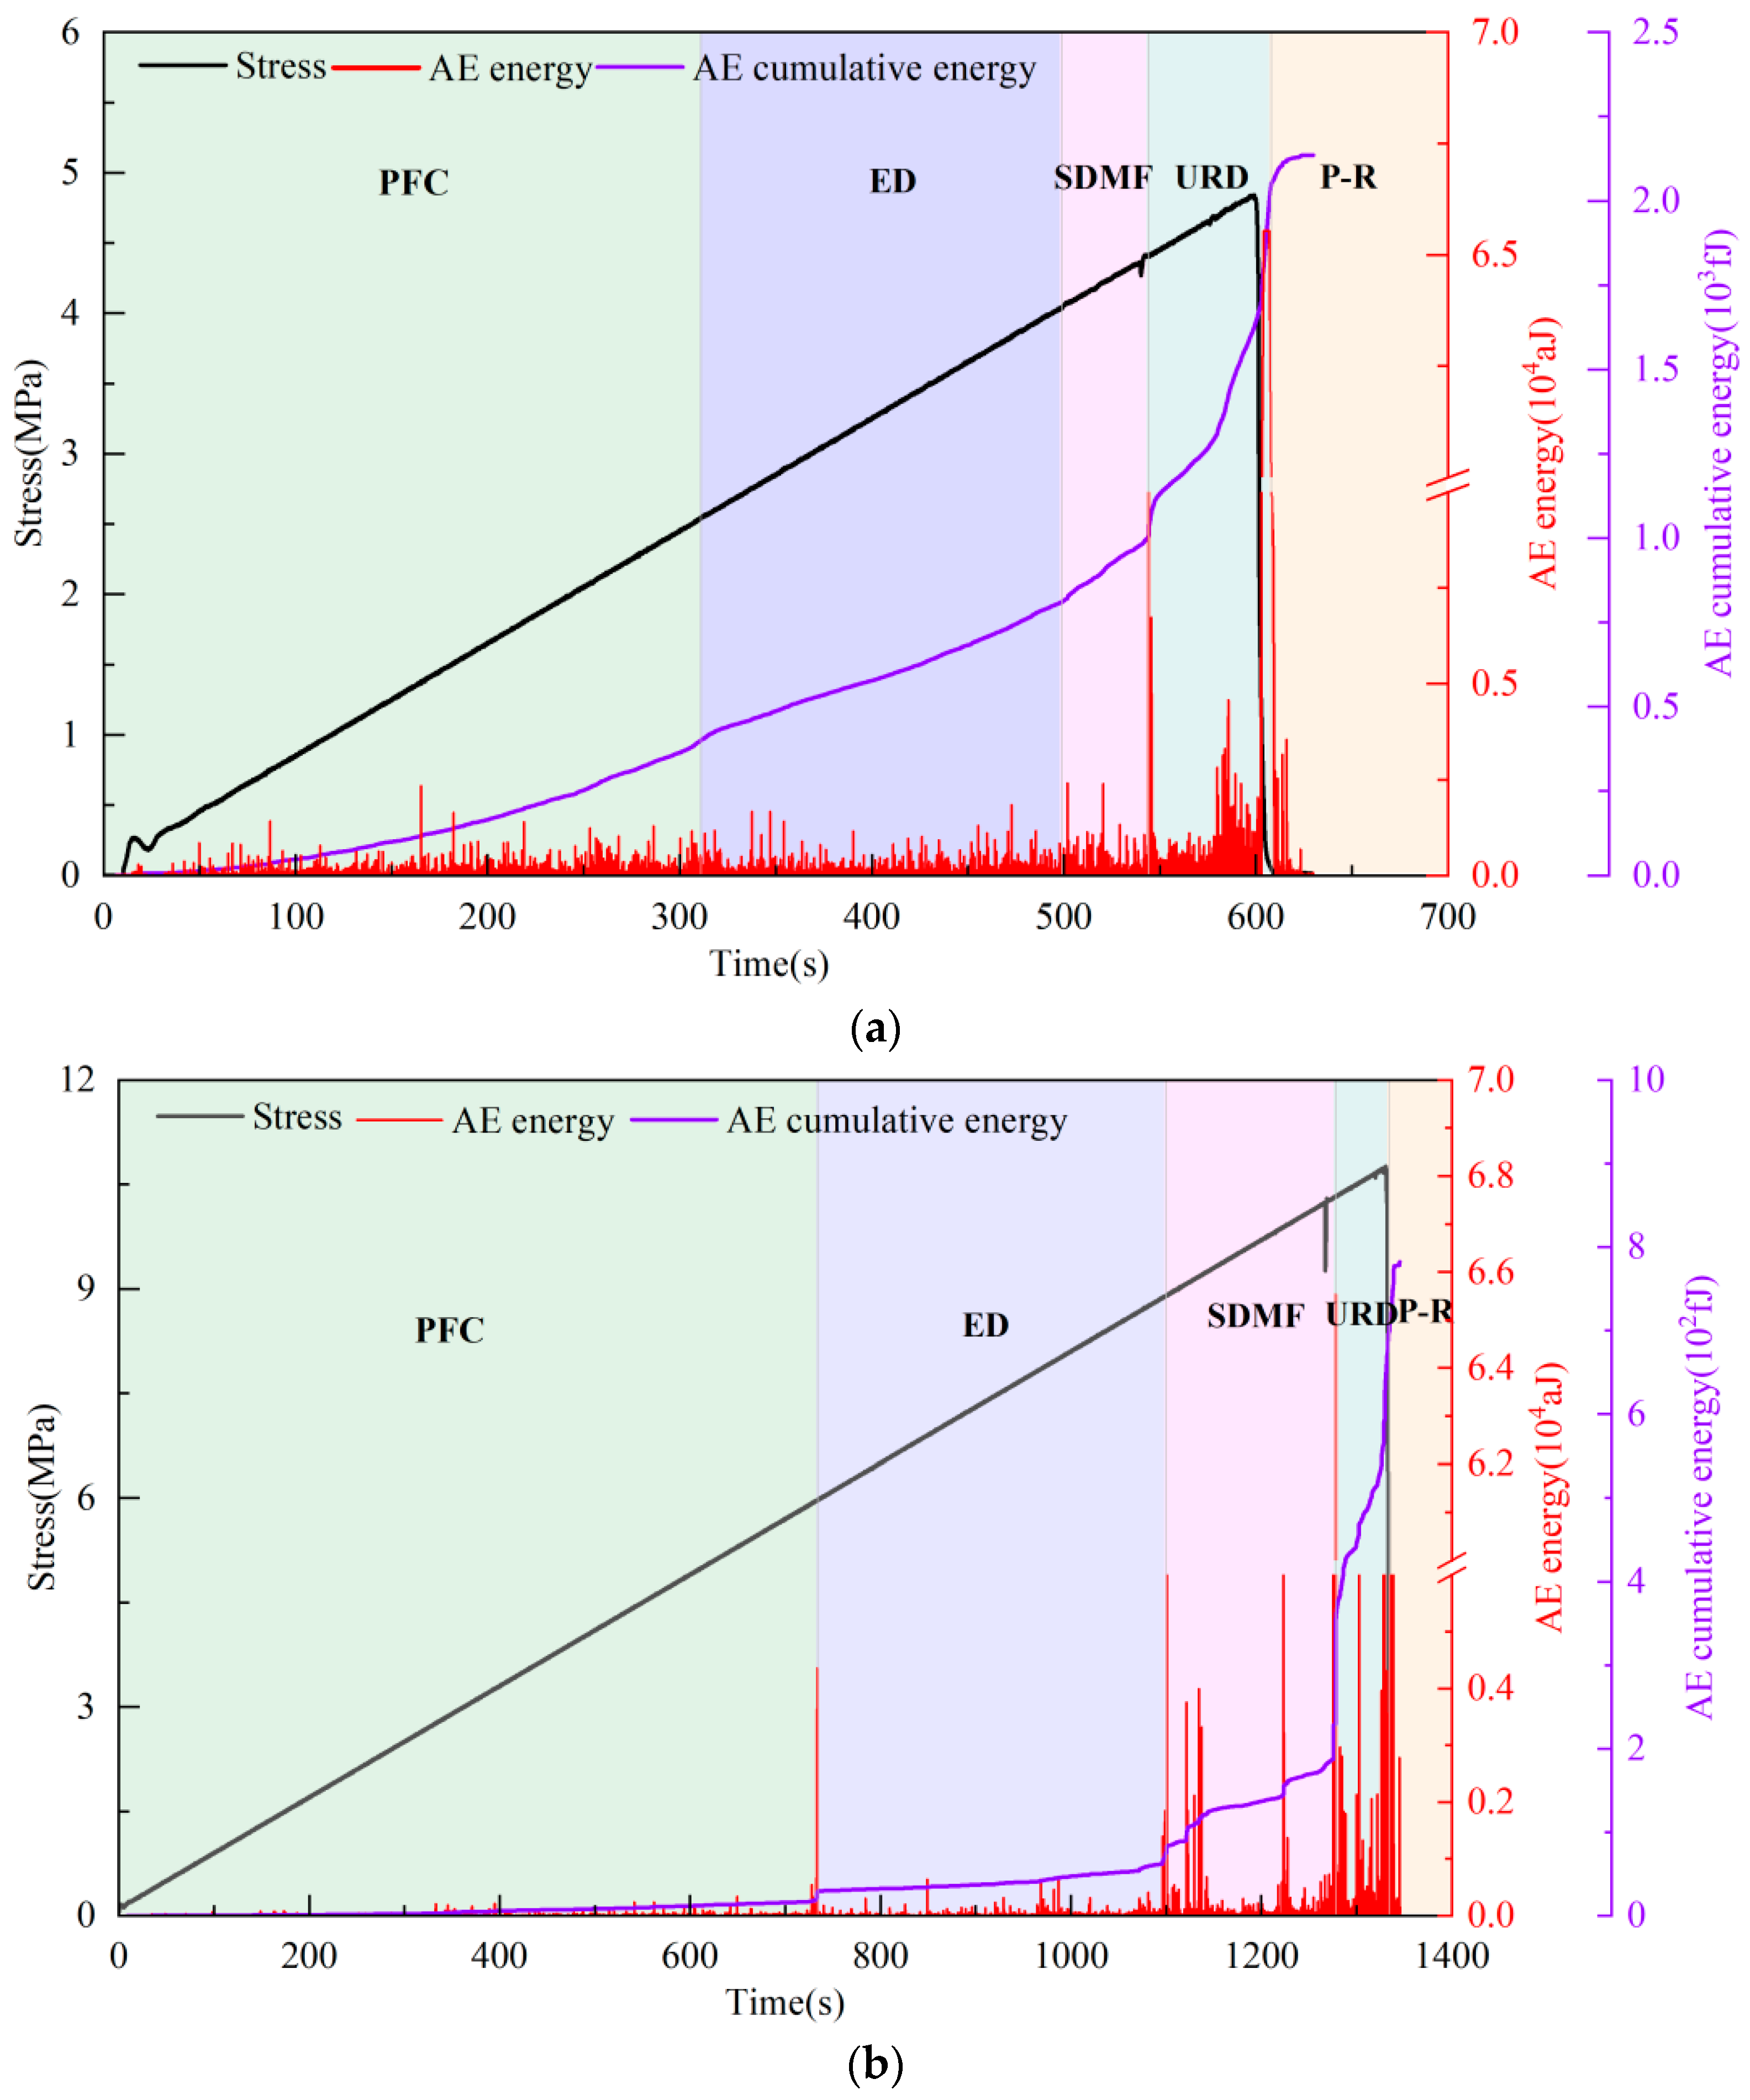
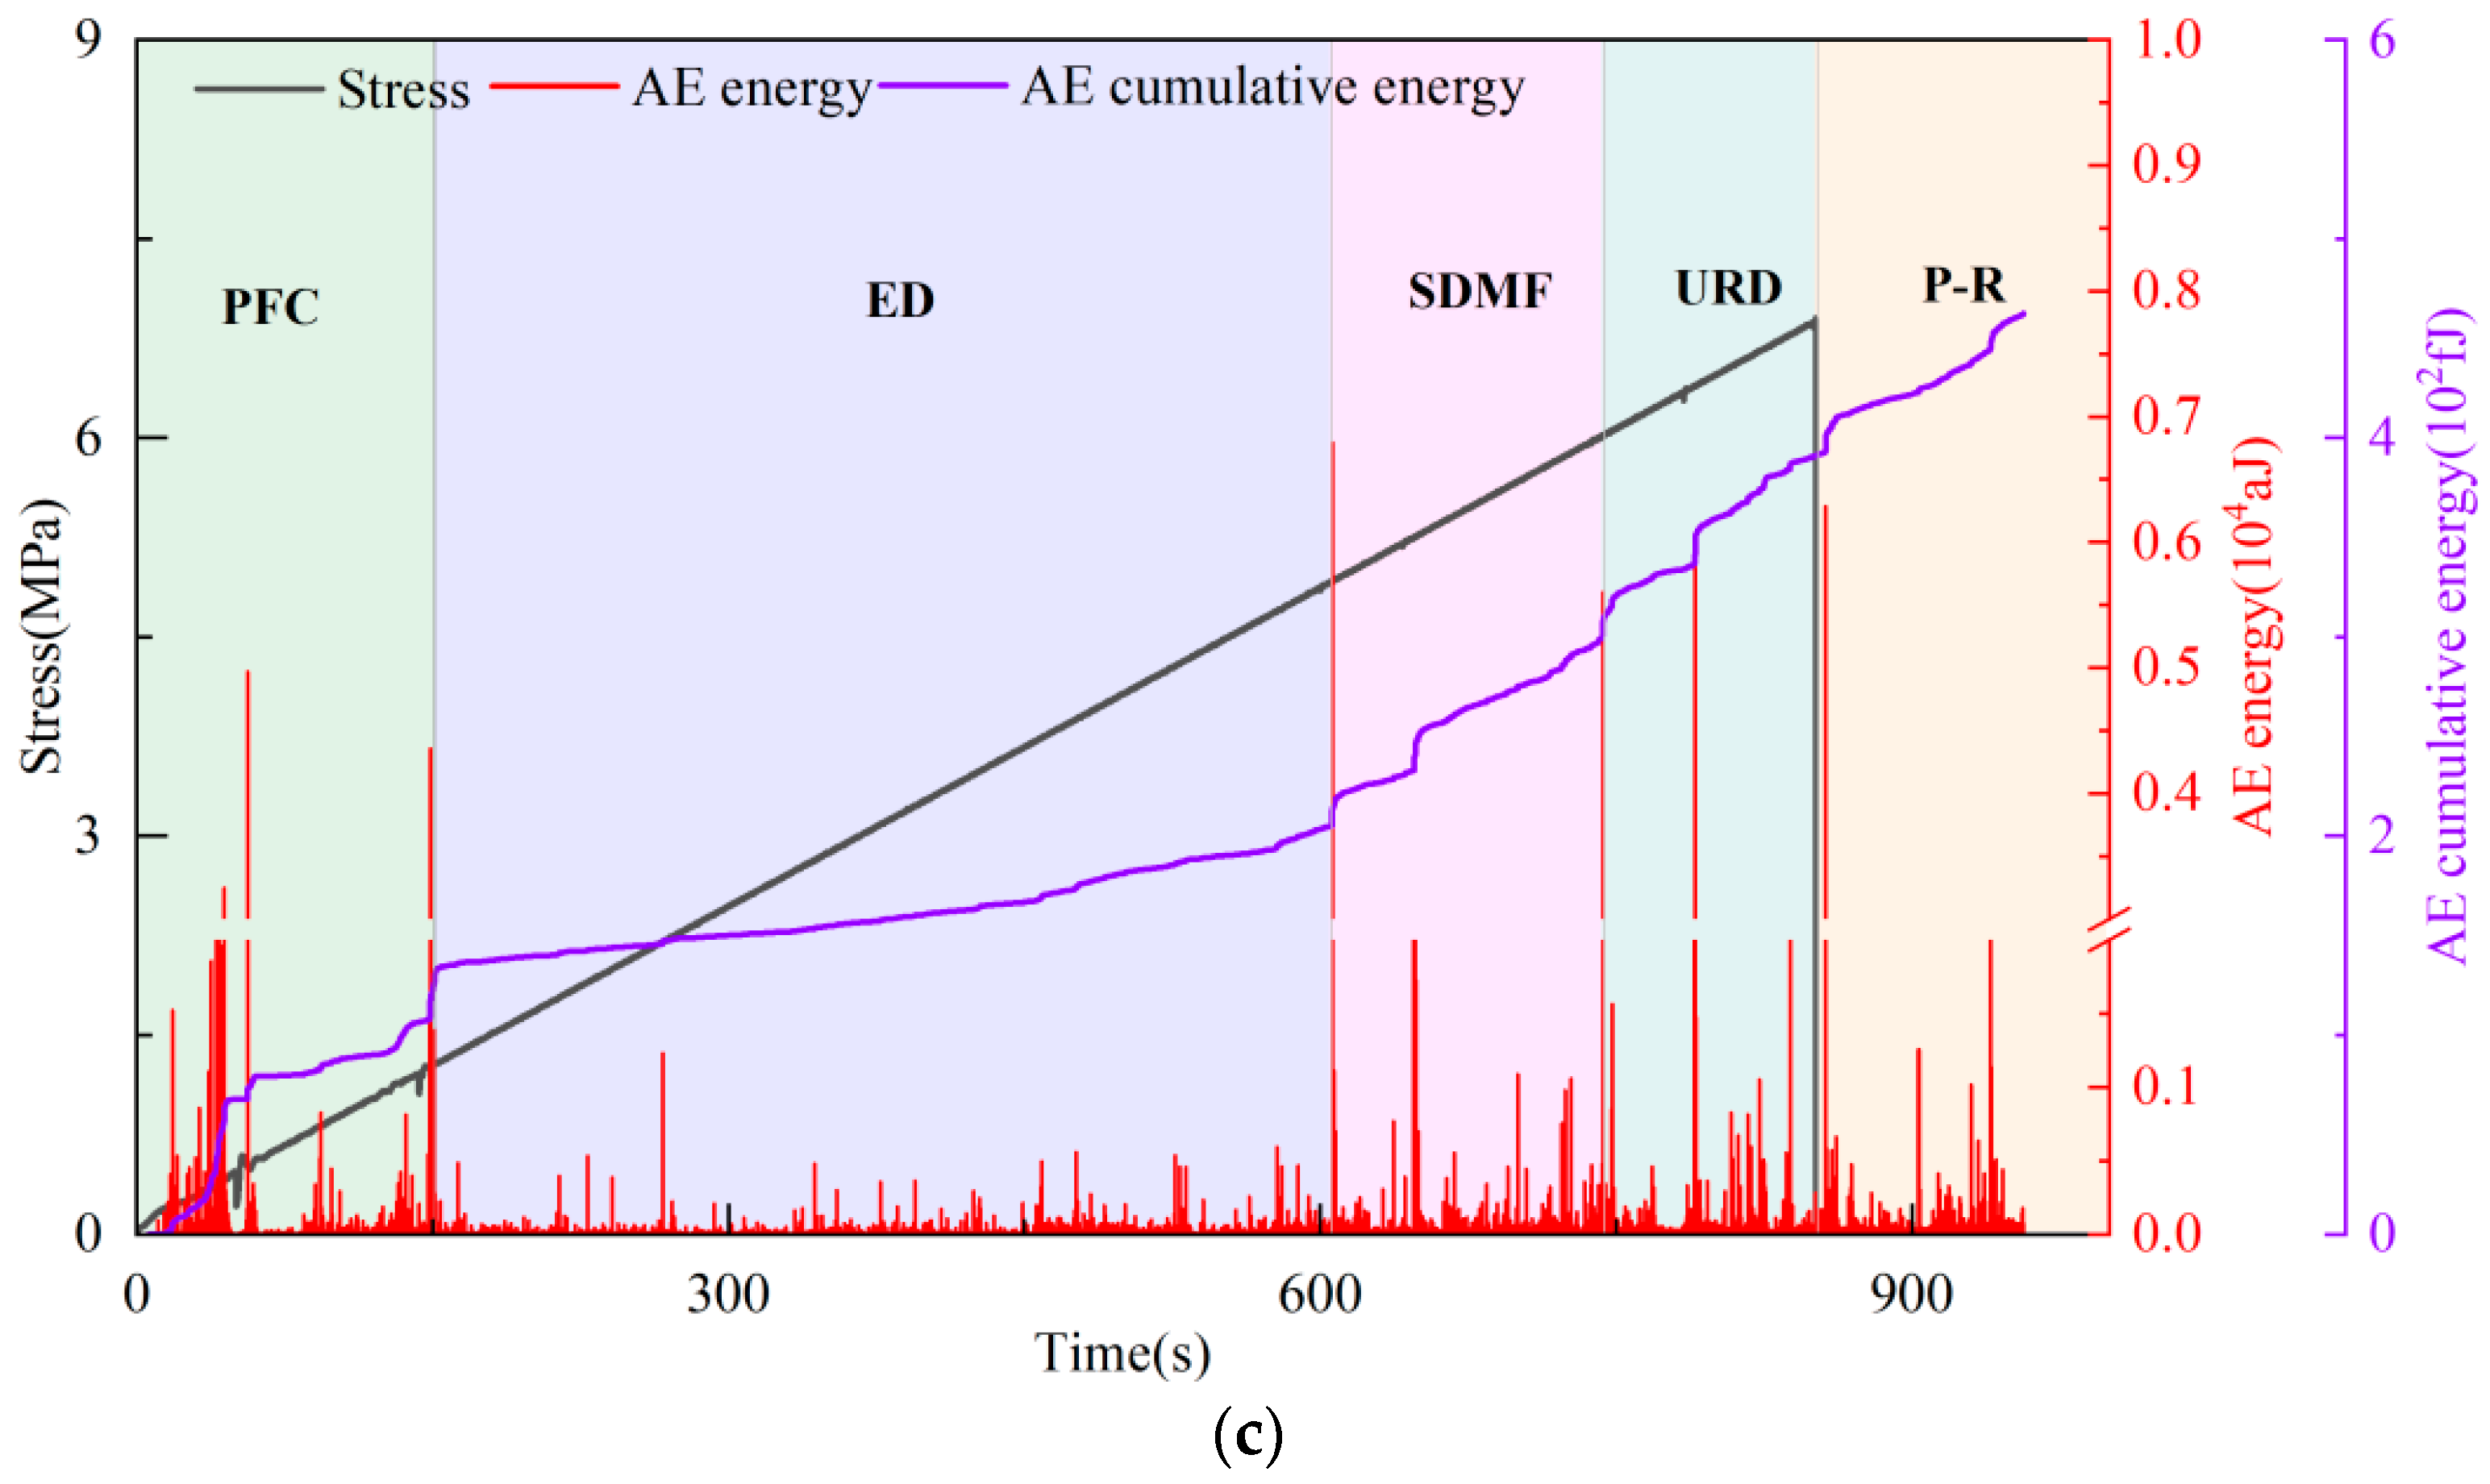
Compressive force was applied to the coal samples until they were destroyed. Figure 4 is the curve of AE energy, cumulative energy and stress with time. According to the relation between AE energy and time, the AE signals can be assigned to five phases: pore-fracture compaction (PFC) phase, elastic deformation (ED) phase, stable development of microelastic fractures (SDMF) phase, unstable fracture development (UFD) phase and posterior rupture (PR) phase.
The AE energy of the three samples show the same variation characteristics in the corresponding stages. The AE energy is weak at the incipience of loading, and the original pores or damage inside the coal become compacted by the exterior load. With the increase in stress, a little AE energy is generated, and the cumulative energy has a slow growth trend. In this phase, the original damage or pores are compacted and begin to produce new micro-cracks inside the samples. The AE energy grows steadily until a sudden change occurs at some point, and similarly, there is a tendency for the accumulated AE energy to grow abruptly. In this phase, new micro-cracks start to emerge, grow and expand inside the samples, then connect with the original pores to form larger cracks. When the samples reach the stress maximum, the peak AE energy appears, and then samples destabilize and break. However, due to the existence of local micro-cracks in the destroyed coal, the AE energy does not suddenly disappear, but gradually decreases until it tends to be stable.
When sample 1 is in the PFC phase, the stress in this phase accounts for 0–51.5% of the peak stress, after which the coal enters the ED phase. In this phase, stress accounts for 51.5–84.0% of the peak stress. The frequency of the AE signal is higher than that in the PFC phase, and when entering the SMFD phase, the stress in this phase only accounts for 84–90% of the peak stress. After a short time, the coal sample starts to enter the later loading stage, which is called the URD stage. The stress in this stage reaches 90–100% of the peak stress, and the peak stress is followed by the PR stage.
There are similar physical characteristics between sample 1 and sample 2, so the generation of the acoustic emission signal also has a similar rule; in the PFC stage, stress accounted for 0–55.3%; in the ED stage, stress accounted for 55.3–82.7%; in the SDMF stage, stress accounted for 82.7–96.3%; and in the URD stage, stress accounted for 96.3–100%.
The acoustic emission law of sample 3 is affected by its internal pore cracks, and it is slightly different from the other two samples. The AE signal is more pronounced at the beginning of loading by the original damage. In the PFC phase, the stress accounts for 0–16.7%; in the ED phase, stress accounts for 16.7–62.8%; in the SDMF phase, stress accounts for 62.8–76.9%; and in the URD phase, stress accounts for 76.9–100%.
In summary, the AE signals caused by coal failure correspond well to the whole loading process with their significant variation in features, and the accumulated energy of AE can more intuitively reflect these stage characteristics.

3.3. Cumulative Acoustic Emission Energy Risk Index

The cumulative AE energy is the cumulative value of AE rupture events, which can be used as a characteristic index of coal rupture AE events during the loading process [41]. The analysis of its variation law aims to analyze the evolutionary features of the energy accumulation in the loading course of the coal sample so as to provide a new index for the fracture precursor signal and offer a reference for the prediction of coal fractures.
According to the change law of the cumulative AE energy curve (Figure 4), it can be seen that the fracture of coal under load is a process of energy accumulation and then release. The PFC and ED stage and SDMF and URD phase in fracture development are all part of the energy accumulation process. When the energy accumulation is up to a certain critical value, the energy releases as coal breaks. Based on the experience of previous studies [41,42], the cumulative AE energy can be used as an index to determine the risk of coal rupture. The slope of the cumulative AE curve of each stage was obtained by the linear fitting method and the definition of the risk index P1 is the ratio of PFC to ED slope in the cumulative curve (Figure 4) while P2 is the ratio of SDMF to ED slope in the cumulative curve and P3 is the ratio of URD to ED slope in the cumulative curve. The calculation formula of P1, P2 and P3 is:
P 1 = K 1 K 2
P 2 = K 3 K 2
P 3 = K 4 K 2
where K1 is the slope of the PFC stage; K2 is the slope of the ED stage; K3 is the slope of the SDMF stage; and K4 is the slope of the URD stage.
The calculation results of P1, P2 and P3 are shown in Table 2.
It can be seen from Table 2 that the range of risk index P1 is between 0.21 and 3.74, that of P2 is between 2.27 and 4.57, and that of P3 is between 6.37 and 64.71. (1) When P < 2.27, the PFC phase has similar fluctuation characteristics to the ED phase and has a weak risk of rupture. (2) When 2.27 < P < 6.37, this indicates that the coal in the SDMF phase has a medium risk of fracture, and the acoustic emission energy appears “convex” in shape. (3) When P > 6.37, this is the time period of rapid energy storage of coal fracture. At this time, the possibility of coal fracture is greatly increased and has a high risk of fracture. Therefore, effective prediction should be carried out in the URD phase to reduce the occurrence of disasters caused by coal fracture.

4. Discussion

4.1. Critical Slowing down Theory

In natural dynamic systems, if the phase state changes, i.e., when the system transitions from the old phase to a new phase, a dispersion rise and fall phenomenon favoring the formation of the new phase will occur near the proximity point, and this dispersion rise and fall is characterized by increased amplitude, elongated time, slower recovery of perturbations, and less ability to recover to the old phase, which is called the critical slowing down phenomenon [38,43], In dynamic systems, this phenomenon is usually characterized as a phenomenon of increasing variance and autocorrelation coefficients of the covariates. Therefore, the computational analysis of the variance and autocorrelation coefficients of acoustic emission characteristic parameters with time can provide a precursor prediction method for the loaded rupture of coal samples.
Variance is a characteristic mass that represents the deviation of data from the mean value x ¯ in a sample, denoted as s2; s is called the mean square error, and the calculation formulas are:
S 2 = 1 n i = 1 n ( x i x ¯ ) 2
S = 1 n i = 1 n ( x i x ¯ ) 2
An autocorrelation coefficient is a statistical quantity that represents the relevance between different times of the same argument. The autocorrelation coefficient with lag length (j) is marked as r(j) so as to judge the possibility of predicting xi+j by xi. For variable x, the autocorrelation coefficient with lag length (j) is:
r ( j ) = 1 n j i = 1 n j ( x i x ¯ s ) ( x i + j x ¯ s )
s is the mean square error of n-length time series, and s is obtained by (5).
Firstly, it is assumed that there is a periodic variable ∆t with a recovery speed of λ. In a simple model of autoregression, it can be represented as:
x n + 1 = e λ Δ t x n + s ε n
where xn is the deflection distance of system state from disturbance state to equilibrium state. If λ and ∆t are not determined by xn, the course can be simplified to a one-step autoregressive model:
x n + 1 = α x n + s ε n
Among them, the autocorrelation coefficient α = e λ t , and the pair (8) autoregressive process is examined by square deviation:
V a r x n + 1 = E ( x n 2 ) + ( E ( x n ) ) 2 = s 2 1 α 2
Generally, as the system approaches the critical point, the recovery rate of small perturbations becomes slower and slower. When it approaches the critical point, the reparatory rate λ tends to 0 and the autoregressive item α tends to 1 [44,45]. The variance of (9) tends to infinity, so the variance can also be used as an index to determine whether the system reaches the critical state. In summary, when the complex multi-dynamic system approximates the critical point, the reparatory rate of the perturbation gradually decreases and approaches 0. At this time, the autocorrelation coefficient and variance increase of the disturbance information are two important indexes for testing the critical slowing down phenomenon.

4.2. The Effect on Different Window or Lag Length on Critical Slowing Down

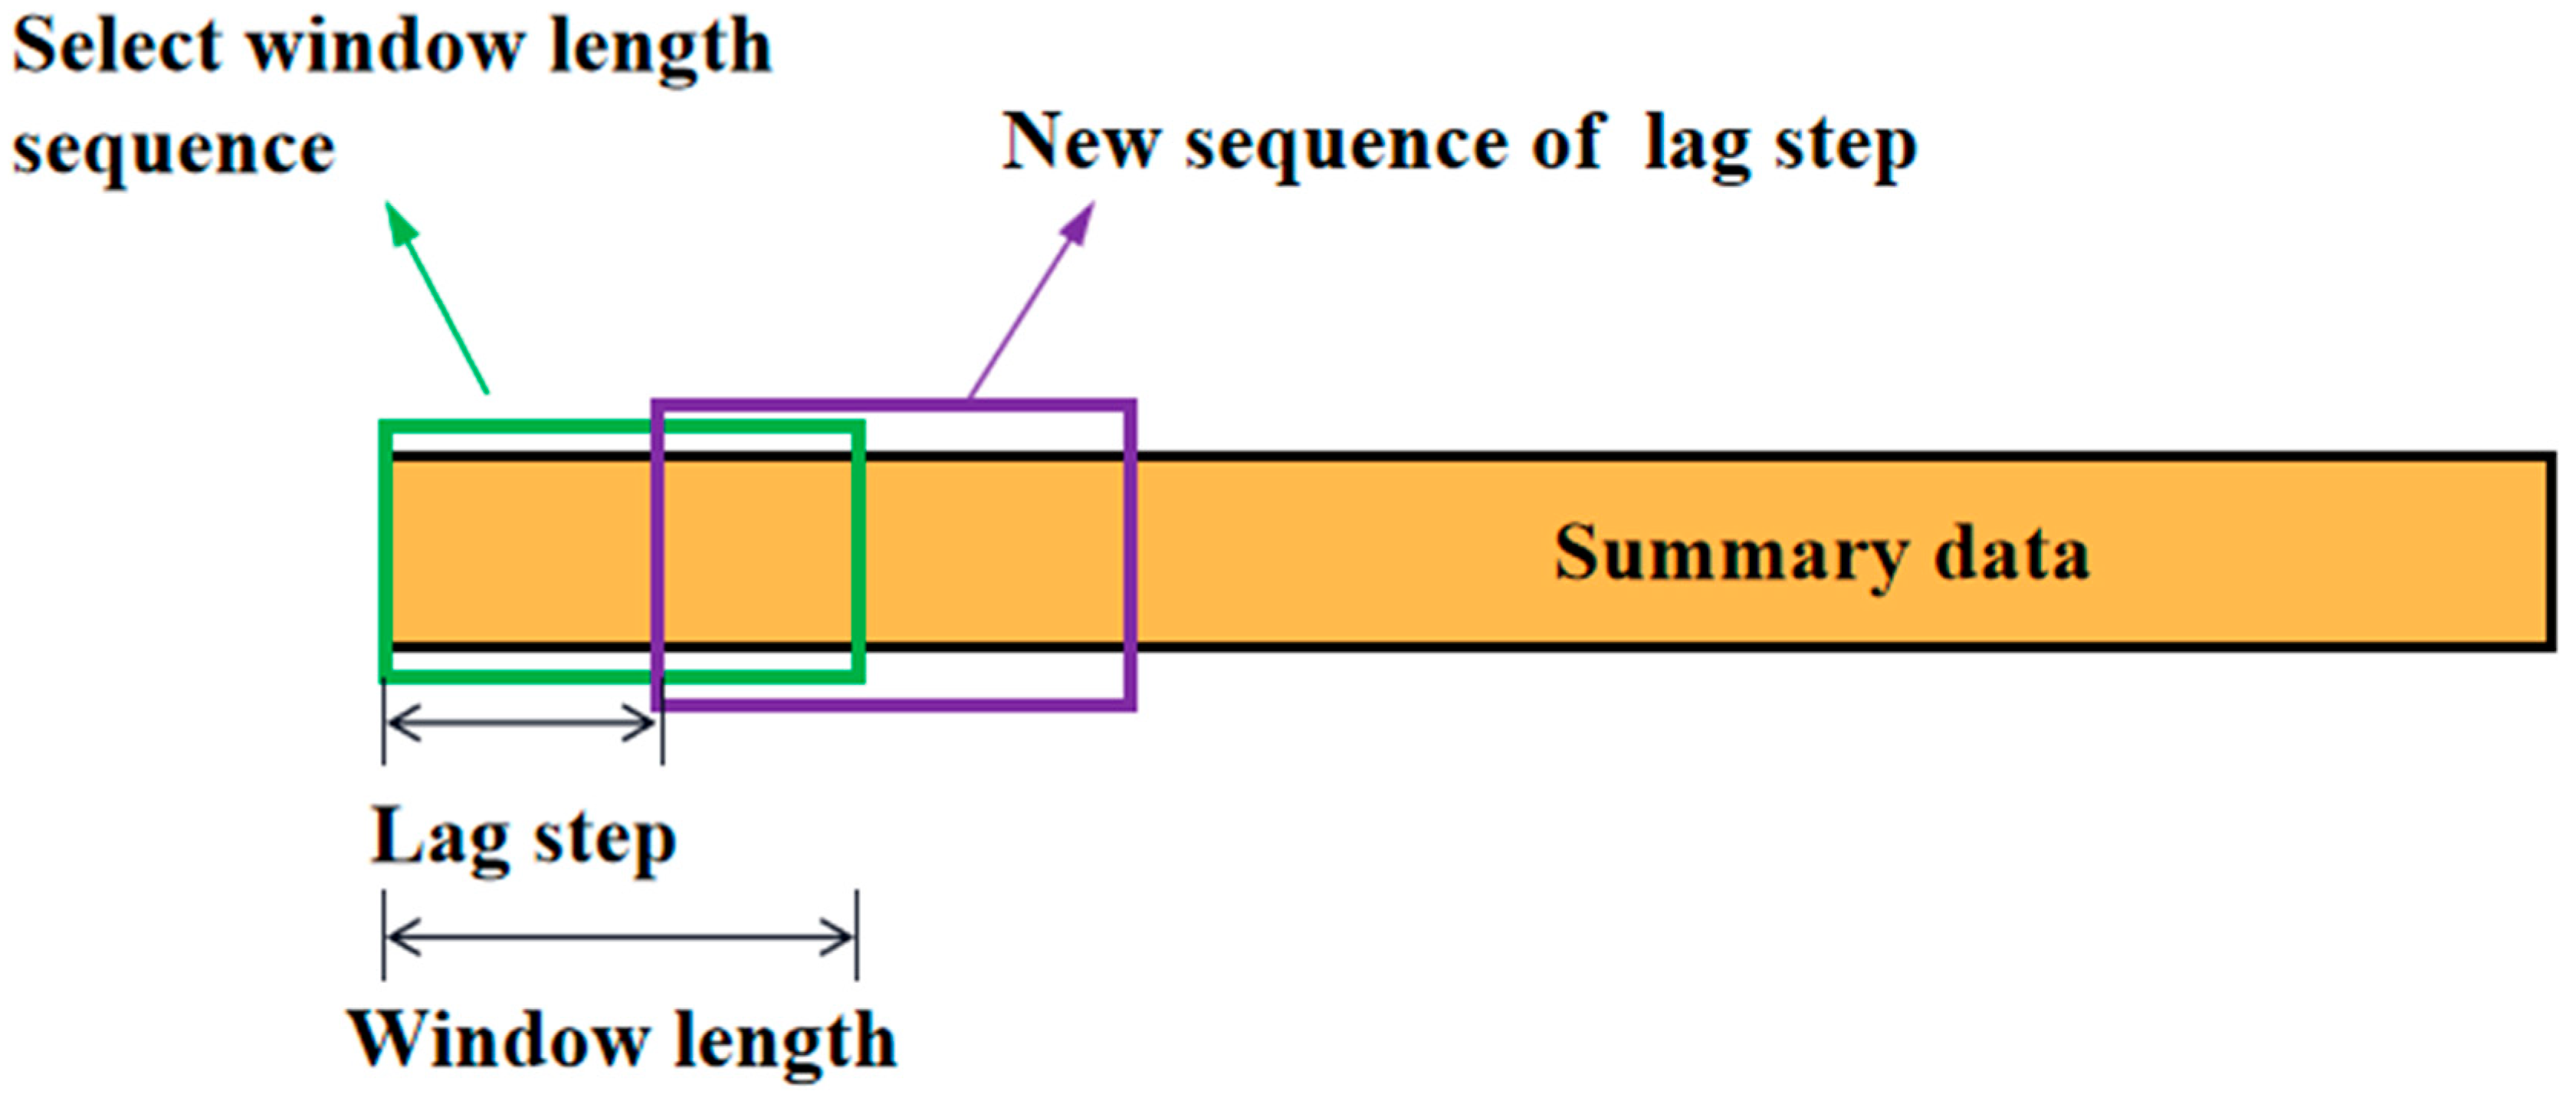
Before calculating the autocorrelation coefficient and variance, we first need to select the appropriate size of window or lag length, because the change and stability situation of the autocorrelation coefficient and variance are closely relevant to the window or lag length size. As shown in Figure 5, a certain unit that needs to be calculated for a sequence is referred to as the window length, and the lag step represents the length of the lag sequence to be slid backward to obtain a new sequence of window length, starting from the selected window length sequence [38,43]. To investigate the effect on different window lengths or lag steps on the critical slowing down characteristics, there are different window length and lag steps selected for comparative analysis.
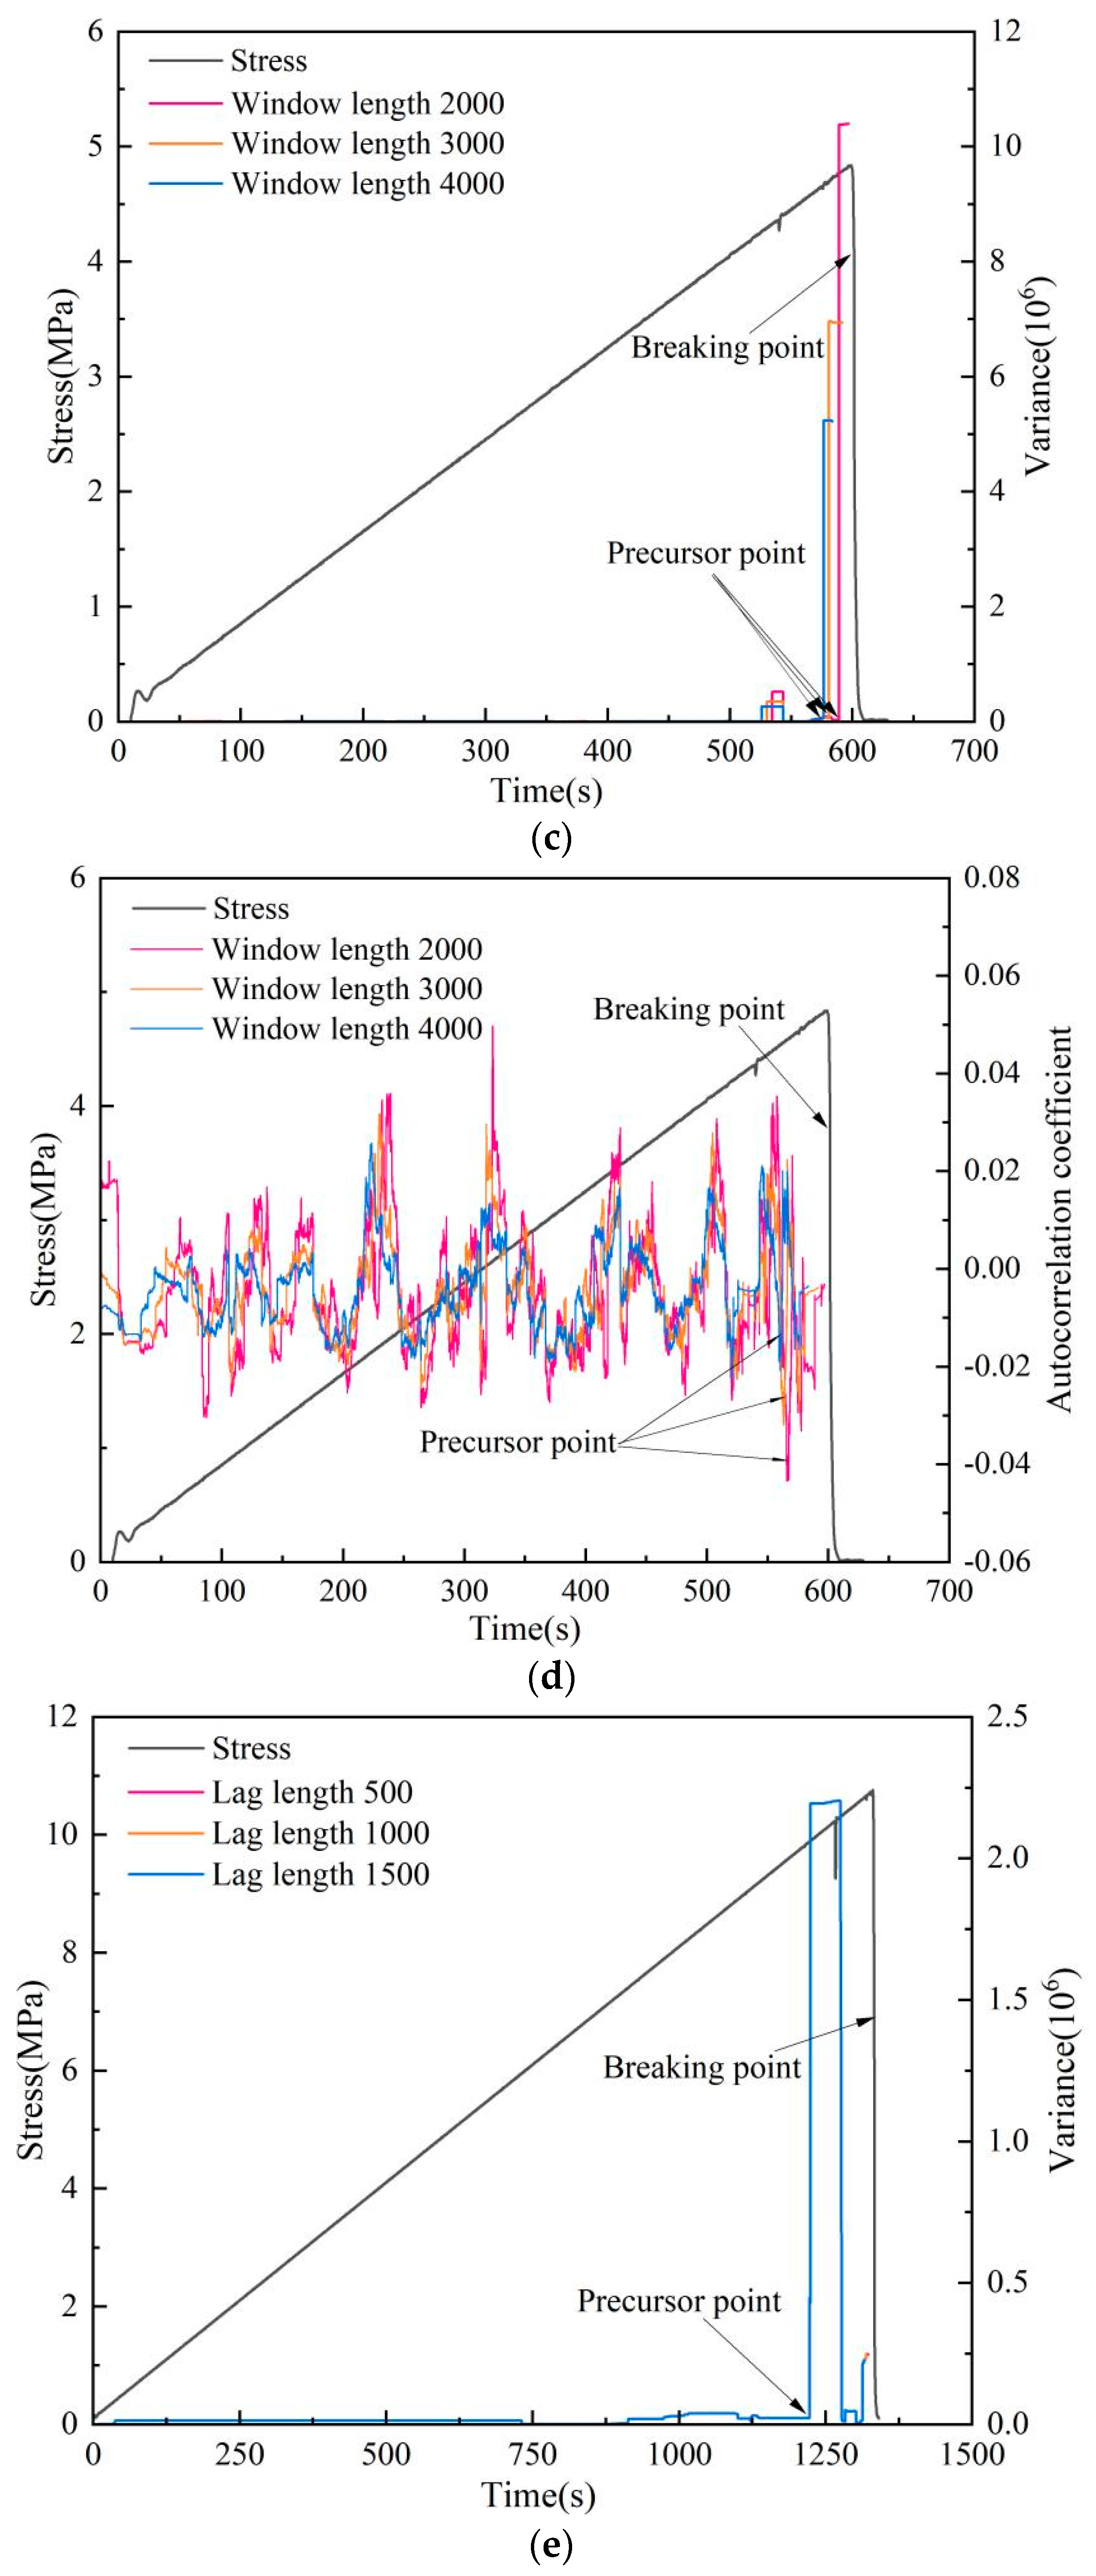
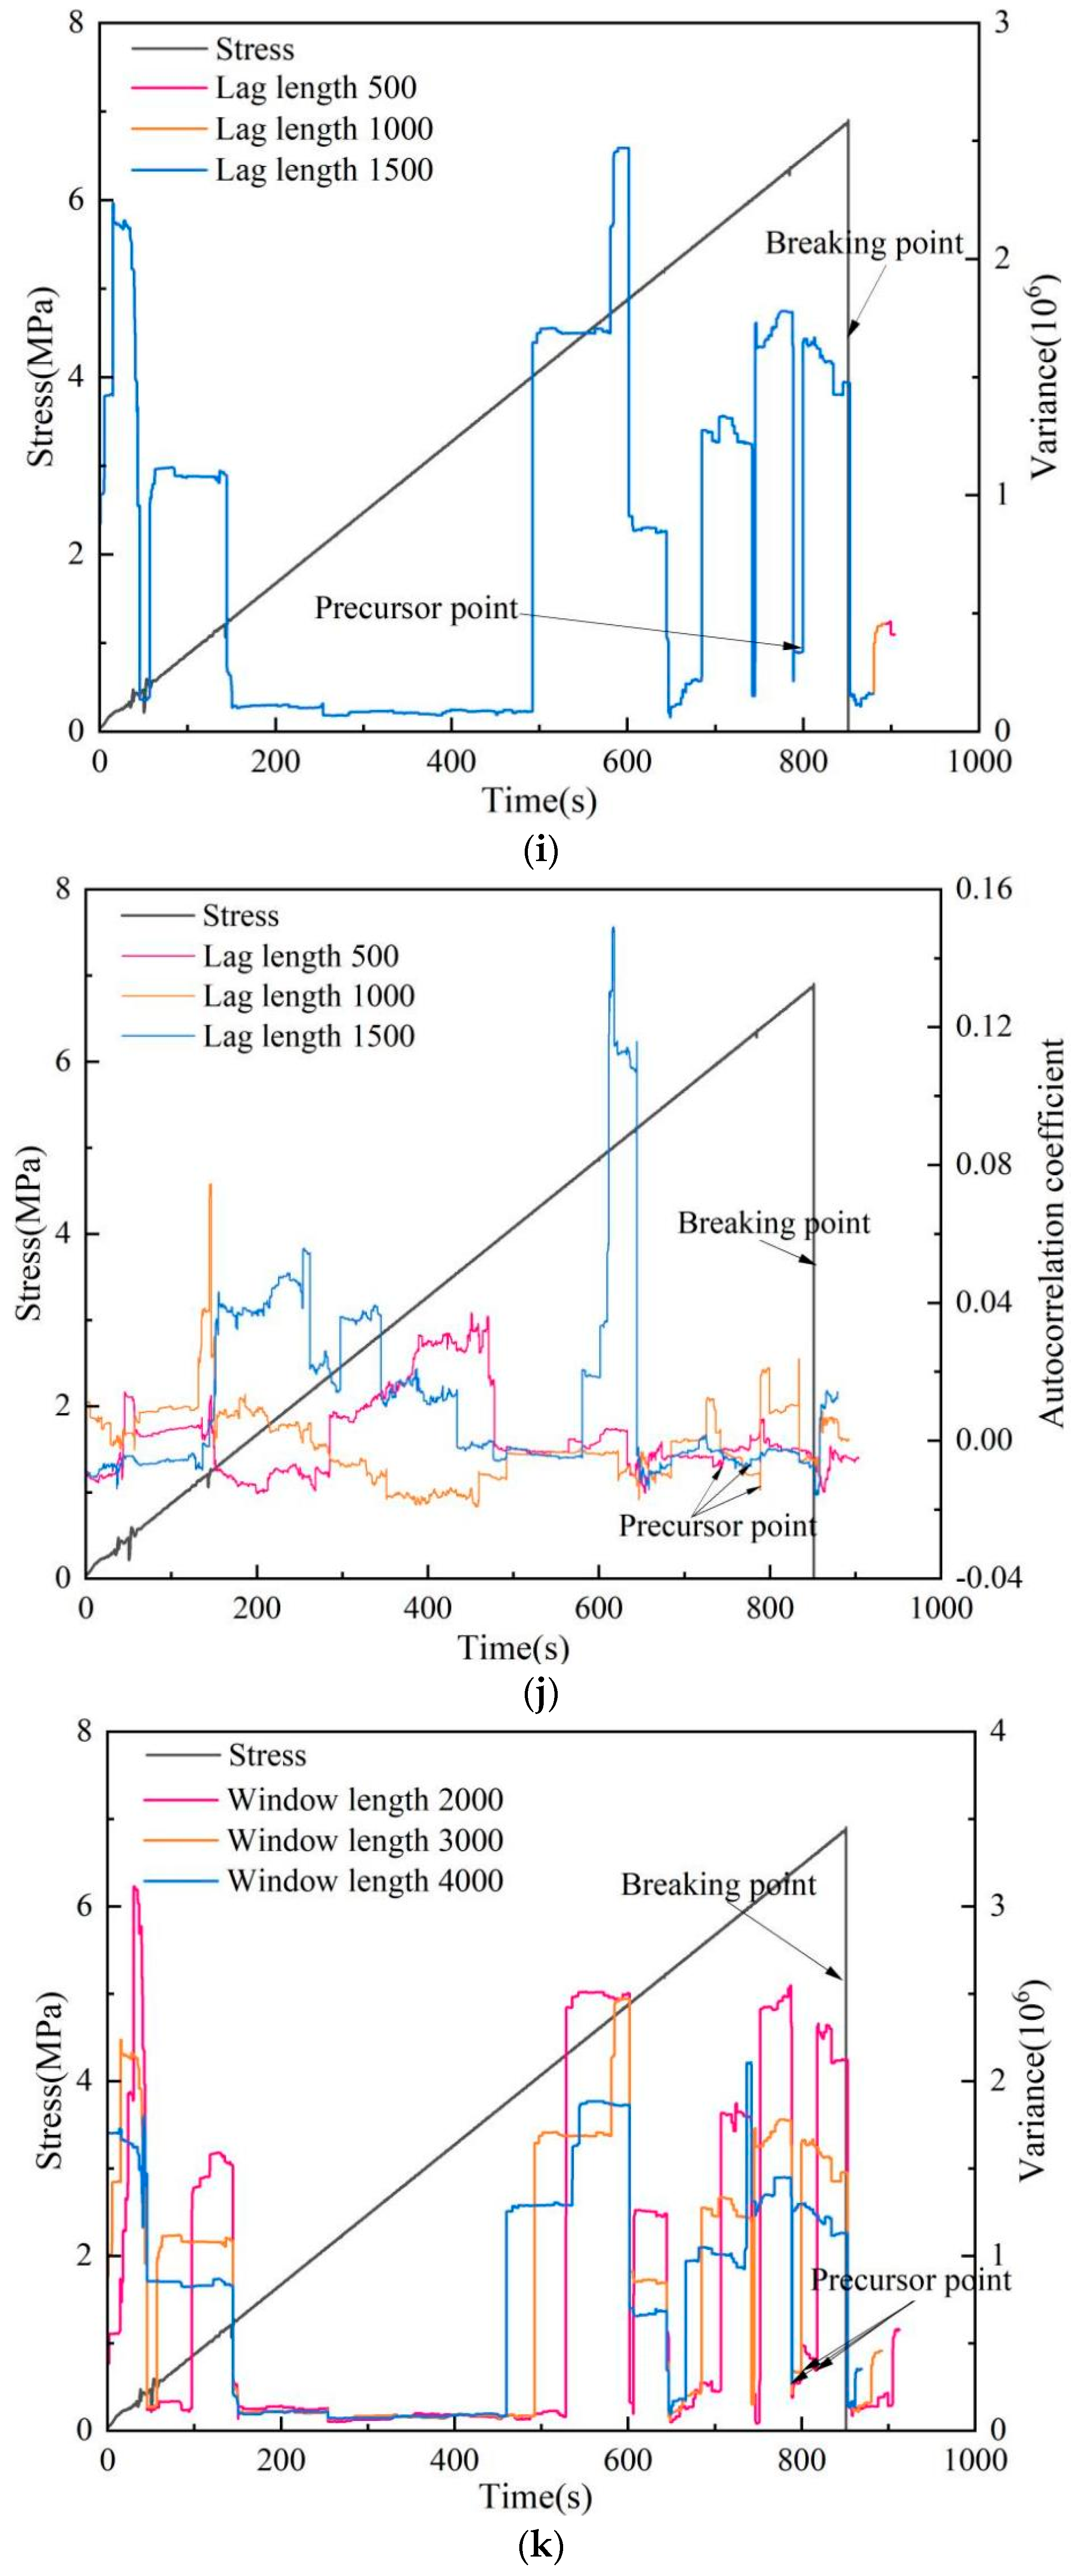
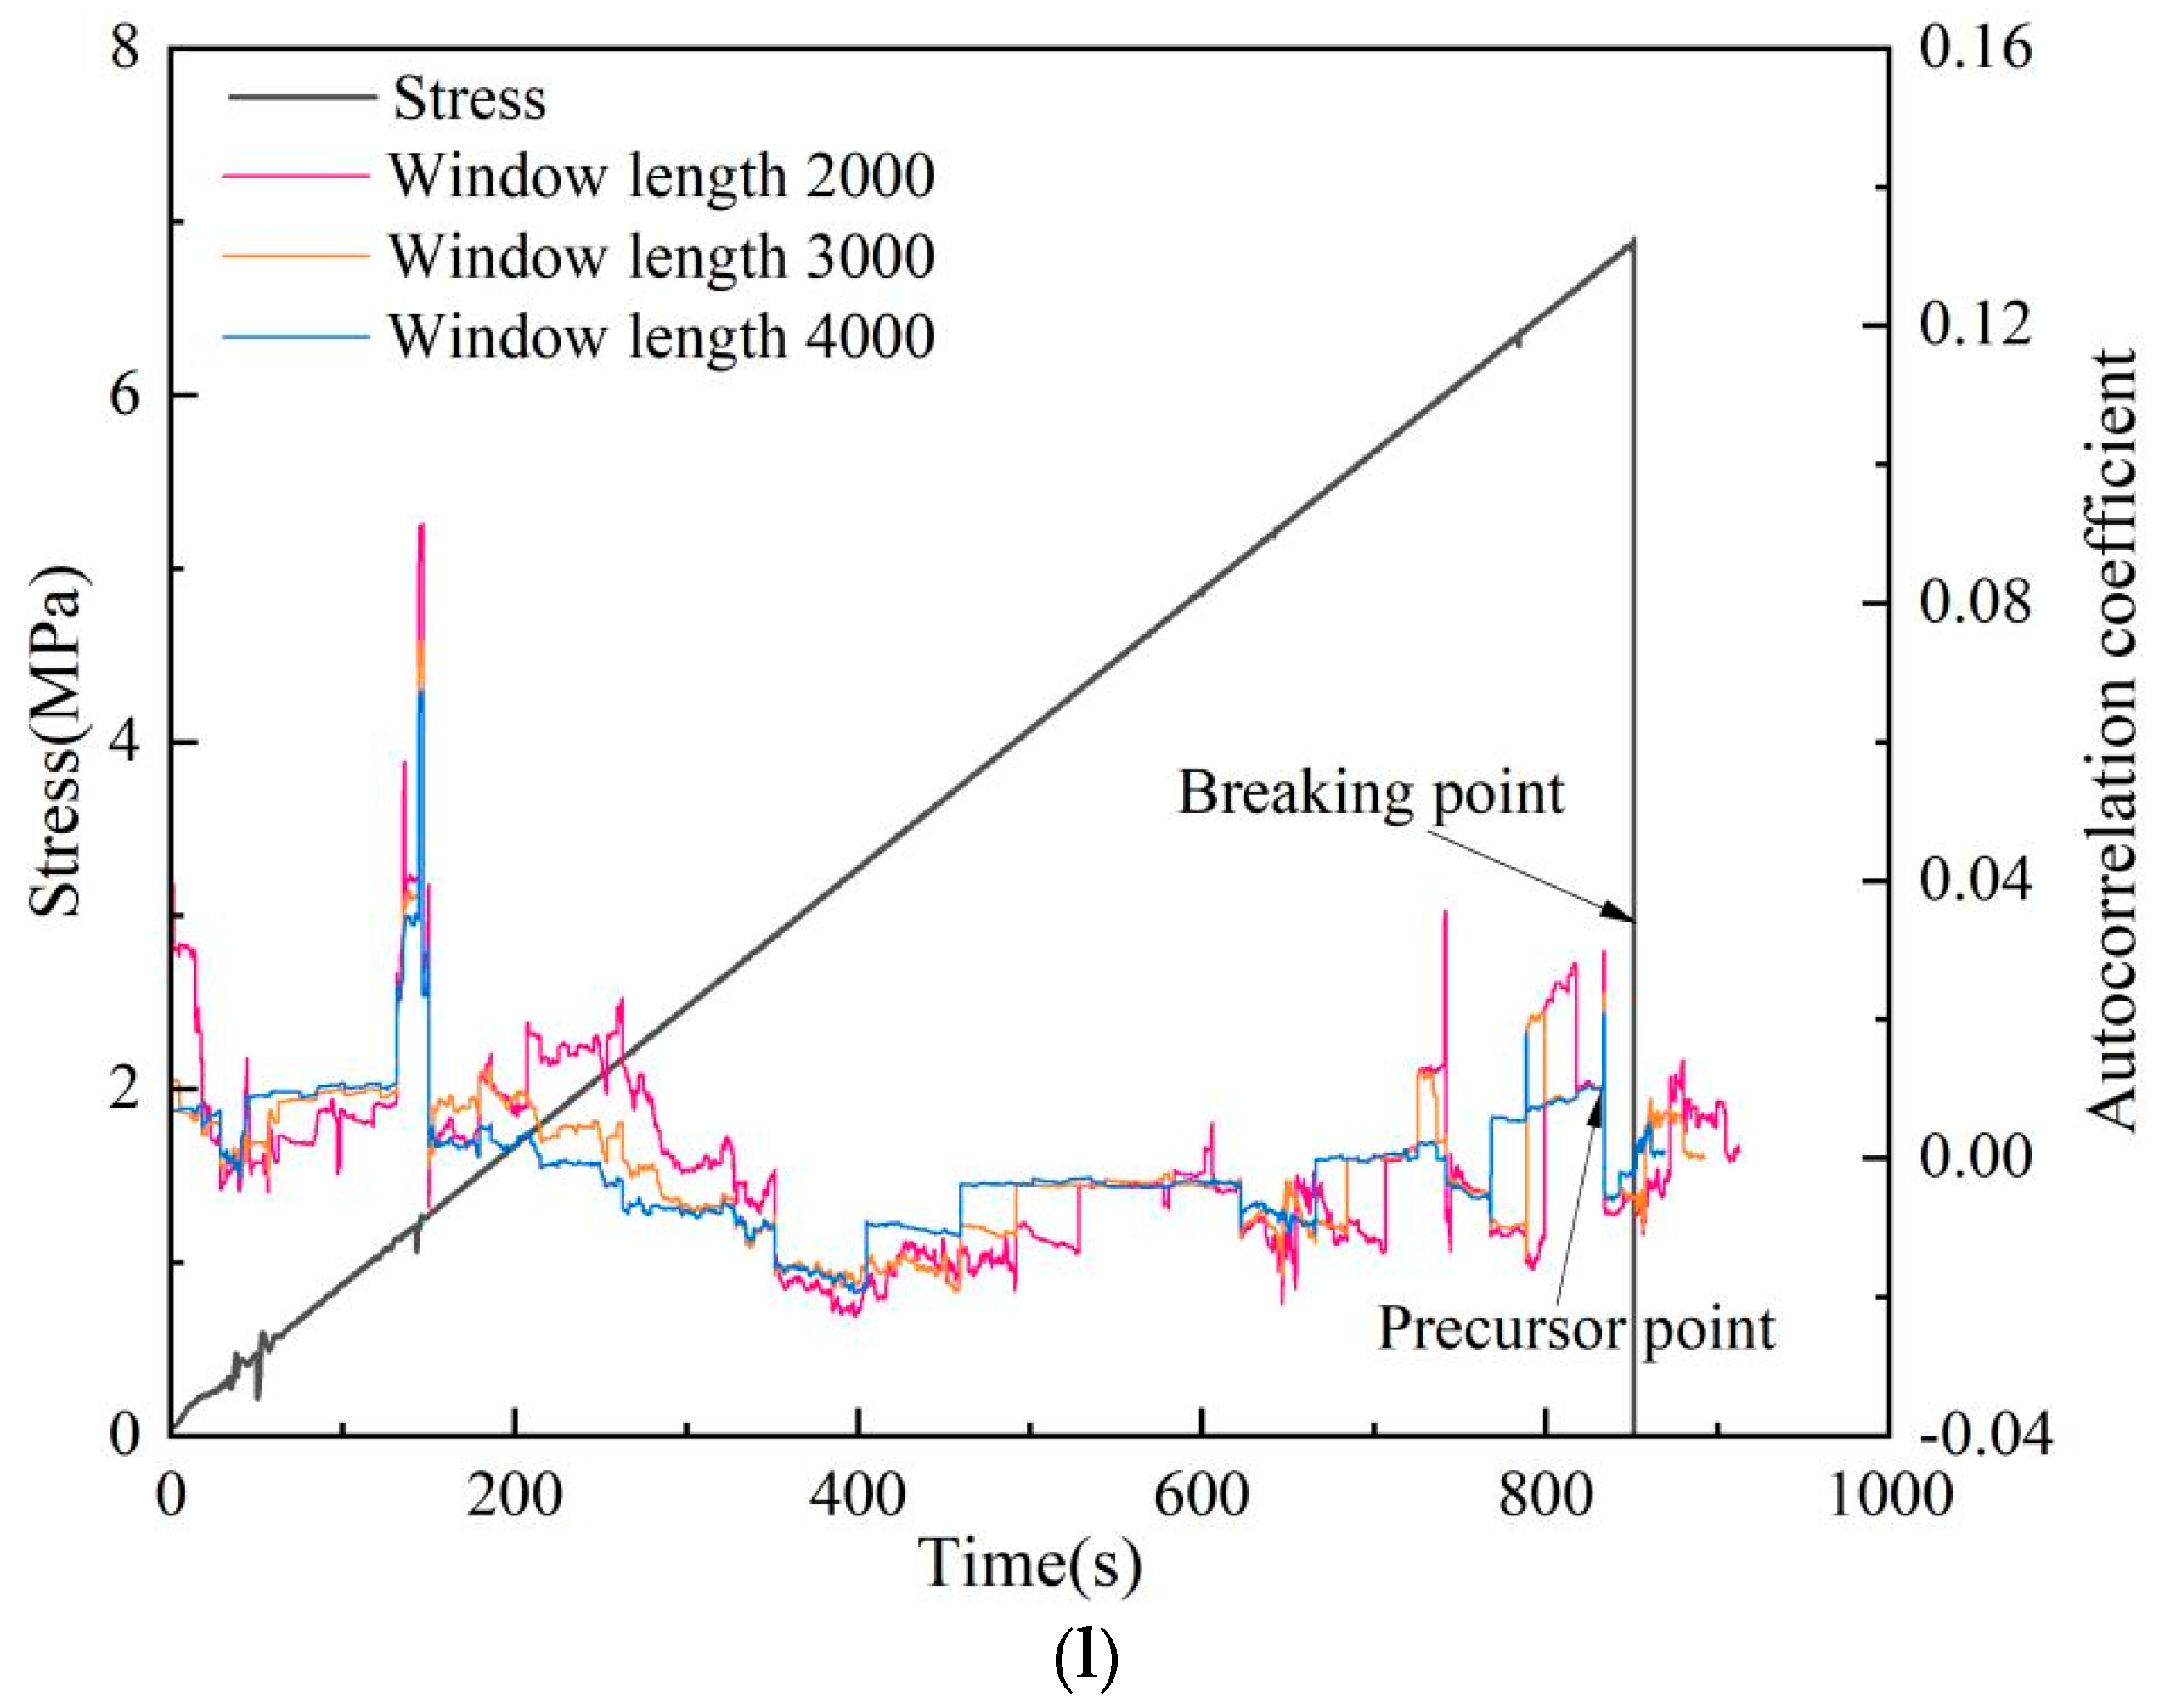
Due to the large amount of raw test data, the window length and the lag step should be chosen accordingly as a larger value. Firstly, the window length is 3000, and the lag steps are 500, 1000 and 1500. Then, the lag step is 1000, and the window lengths are 2000, 3000 and 4000. The effects of different lag steps and window lengths on the autocorrelation coefficient and variance are compared separately in Figure 6.
The window length was taken as 3000 to compare the effect of variance for different lag steps. As shown in the Figure 6a,e,i, the variance curves relative to the lag steps of 500, 1000 and 1500 show the same trajectory with time and reunite together, and the time points of sudden increase are basically the same, that is, the variance curve does not vary with the variation in lag length.
The window length was taken as 3000 to compare the effect of the autocorrelation coefficient for different lag steps. The autocorrelation coefficient curves with different lag steps of the same window length are shown in Figure 6b,f,j. It can be seen that different lag steps have a certain influence on the autocorrelation coefficient, but this change does not show the overall regularity. There is no obvious correlation between the fluctuation range and the choice of lag step size, but the trend of local change is consistent, meaning that the autocorrelation coefficient has independent variation characteristics under the new sequence of lag step size.
A lag step of 1000 was taken to compare the effect of different window lengths on the variance. Figure 6c,g,k show the same lag length variance curves with different window length. As shown in the figure, the variance curves with various window lengths of 2000, 3000 and 4000 show the same change rule and affect the change range of variance; in particular, the increase in the inflection point of the variance curve reduces with the growth in window length.
A lag step of 1000 was taken to compare the effect of different window lengths on the autocorrelation coefficient. As can be seen in Figure 6d,h,l, when the lag step lengths are equal, the change trend of the autocorrelation coefficient curve corresponding to different window lengths is relatively consistent, and the volatility range of the curve gradually reduces with the growth in window length or even tends to be stable; that is, to determine the length of the new series, the larger window length series is selected, with a smaller effect on the autocorrelation coefficient.
In summary, although the precursor points of critical slowing can be successfully captured by both variance and autocorrelation coefficient, however, compared with the variance, the autocorrelation coefficient presents a messy change process with more peaks, which is very easy to be judged as a pseudo-signal. Therefore, the variance is more definite than the autocorrelation coefficient precursor signal, so the variance can be used as the main criterion of the precursor signal and the autocorrelation coefficient as an auxiliary criterion.

4.3. Compare the Precursor Characteristics of Each Index

Usually, the sudden increase in acoustic emission signal level and the increase in slope of the accumulated energy curve of acoustic emission are often shown before the destabilization damage of coal [46], which is because the microfracture is sprouting and developing through, so the precursor point of each index characterization must be controlled in the URD stage if the precursor signal of coal rupture can be effectively identified.
Based on the load, cumulative energy of acoustic emission, variance and autocorrelation coefficient versus time, the magnitude of the load values corresponding to the precursor signals characterized by the cumulative energy, positive sequence variance and autocorrelation coefficient are summarized from the loads and compared with the load at the damage point. The degree of damage load at the precursory signal point is represented by each index before the failure of the coal sample is analyzed. According to the effect of different window or lag length on the critical slowing, the lag step of 1000 and window length of 3000 were selected to calculate the critical slowing down precursor index. As shown in Figure 6, among the three samples, the strength corresponding to the appearance of the damage precursor signal of sample 1 is 4.651 MPa and the peak strength is 4.840 MPa, which is about 96.1% of the peak strength; the strength corresponding to the appearance of the damage precursor of sample 2 is 9.895 MPa and the peak strength is 10.736 MPa, which is about 92.2% of the peak strength; and the strength corresponding to the appearance of the damage precursor of sample 3 is 6.472 MPa and the peak strength is 6.904 MPa, which is about 93.7% of the peak strength. The precursor signals all appear in the URD stage and have sufficient validity. From Figure 4, the precursor signal is characterized by a steep change in the slope of the accumulative energy curve of AE. The strength corresponding to the appearance of the damage precursor signal of sample 1 is 4.452 MPa and the peak strength is 4.836 MPa, which is about 90.8% of the peak strength; the strength corresponding to the appearance of the damage critical precursor of test coal sample 2 is 8.626 MPa and the peak strength is 10.736 MPa, which is about 80.4% of the peak strength; and the strength corresponding to the appearance of the sample 3 damage critical precursor is 5.676 MPa and the peak strength is 8.092 MPa, which is about 82.2% of the peak strength. The precursor signals of sample 2 and sample 3 appear in the SDMF stage. Although they can indicate the damage of coal to some extent, the early warning characteristics are not obvious. The calculation results show that the precursor signal characterized by variance and autocorrelation coefficient is more accurate and effective.
From a time perspective, the precursor signal appeared 24 s earlier for sample 1, 25 s earlier for sample 2 and 50 s earlier for sample 3 after the critical slowing treatment, accounting for 4.0%, 1.9% and 5.8% of the total loading time, respectively, all of which were in the URD stage. The precursor signals characterized by the cumulative energy curve were 45 s, 54 s and 103 s earlier, accounting for 7.5%, 4.1% and 12.1% of the total loading time. This shows that the occurrence time of the precursor signal represented by the critical slowing down is neither too early to become a false signal nor too late to cause difficulties in early warning work. Therefore, on the basis of the critical slowing theory, effective measures are taken to deal with the fracture of coal with good timeliness in the precursor of failure, which has a certain use as a reference for enriching the AE monitoring technology of coal failure.

5. Conclusions

(1) The strengths of coal samples are significantly different due to the influence of internal pore fractures. The elastic moduli and uniaxial compressive strengths grow with increase in coal integrity, while the failure strain decreases.
(2) AE signals are generated during the destruction of the coal, and the whole loading process can be divided into five stages: PFC, ED, SDMF, URD, and P-R. The accumulated AE energy can reflect the characteristics of these stages more intuitively.
(3) Based on the acoustic emission signal, a risk index of acoustic emission parameters was established. According to P1, P2 and P3, the risk was divided into three levels: weak risk, medium risk and high risk. At a high risk index, the possibility of coal fracture is greatly increased and there is a high risk of fracture. Therefore, effective prediction should be carried out in the URD stage to reduce the occurrence of disasters caused by coal fracture. Furthermore, this conclusion was obtained for uniaxial compression conditions. The study of other loading conditions as well as samples is necessary to verify this result.
(4) The critical slowing precursor point characterized by variance is clearer and more accurate and provides an early warning response to coal rupture at the URD stage. In underground coal mining engineering operations, effective measures must be taken to prevent and manage coal rupture after capturing the precursor signals at this stage so as to reduce the losses caused by coal–rock power disasters. This can serve as a reference for enriching the AE monitoring technology of coal failure.

Author Contributions

Conceptualization, X.K.; methodology, X.K., Y.C., P.J., D.H., T.Z., J.H. and X.L.; software, M.Z.; validation, M.Z.; formal analysis, M.Z.; investigation, M.Z.; resources, M.Z.; data curation, M.Z.; writing—original draft preparation, M.Z.; writing—review and editing, M.Z.; visualization, M.Z.; supervision, X.K.; project administration, X.K.; funding acquisition, X.K. All authors have read and agreed to the published version of the manuscript.

Funding

This research was funded by Xiangguo Kong, the grants National Natural Science Foundation of China (51904236), Natural Science Basic Research Program of Shaanxi (2020JQ-756), China Postdoctoral Science Foundation (2021M693879) and Excellent Youth Program of Xi’an University of Science and Technology.

Conflicts of Interest

The authors declare no conflict of interest.

References

  1. Li, X.L.; Cao, Z.Y.; Xu, Y.L. Characteristics and trends of coal mine safety development. Energy Sources Part A Recovery Util. Environ. Eff. 2021, 1–19. [Google Scholar] [CrossRef]
  2. Lin, H.F.; Ji, P.F.; Kong, X.G.; Li, S.G.; Long, H.; Xiao, T.; Li, B. Experimental study on the influence of gas pressure on CH4 adsorption-desorption-seepage and deformation characteristics of coal in the whole process under triaxial stress. Fuel 2023, 333, 126513. [Google Scholar] [CrossRef]
  3. Lin, H.F.; Ji, P.F.; Kong, X.G.; Li, S.G.; Dou, G.D.; Li, K. Precise hole placement pattern and engineering practice of pre-pumping coal seam gas by down-seam drilling. J. Coal 2022, 47, 1220–1234. [Google Scholar]
  4. Qin, L.; Li, S.G.; Zhai, C.; Lin, H.F.; Zhao, P.X.; Shi, Y.; Bing, Y. Changes in the pore structure of lignite after repeated cycles of liquid nitrogen freezing as determined by nitrogen adsorption and mercury intrusion. Fuel 2020, 267, 117214. [Google Scholar] [CrossRef]
  5. Ma, W.B.; Chen, Y.L.; Yi, W.; Guo, S.C. Investigation on crack evolution behaviors and mechanism on rock-like specimen with two circular-holes under compression. Theor. Appl. Fract. Mech. 2022, 118, 103222. [Google Scholar] [CrossRef]
  6. Zhou, D.; Ye, Y.C.; Hu, N.Y.; Wang, W.Q.; Wang, X.H. Crack evolution of soft-hard composite layered rock-like specimens with two fissures under uniaxial compression. Front. Struct. Civ. Eng. 2021, 15, 1372–1389. [Google Scholar] [CrossRef]
  7. Ma, W.Q.; Wang, J.T.; Li, X.X.; Wang, T.X. Crack evolution and acoustic emission characteristics of rock specimens containing random joints under uniaxial compression. Acta Geophys. 2021, 69, 2427–2441. [Google Scholar] [CrossRef]
  8. Munoz, H.; Taheri, A.; Chanda, E.K. Pre-peak and post-peak rock strain characteristics during uniaxial compression by 3D digital image correlation. Rock Mech. Rock Eng. 2016, 49, 2541–2554. [Google Scholar] [CrossRef]
  9. Ma, S.P.; Zhou, H. The evolution of strain field on specimen surface during rock failure process Characteristics study. J. Rock Mech. Eng. 2008, 27, 1667–1673. [Google Scholar]
  10. Hou, C.L.; Jiang, B.; Li, M.; Song, Y.; Cheng, G.X. Micro-deformation and fracture evolution of in-situ coal affected by temperature, confining pressure, and differential stress. J. Nat. Gas Sci. Eng. 2022, 100, 104455. [Google Scholar] [CrossRef]
  11. Lockner, D.A.; Byerlee, J.D.; Kuksenko, V.; Ponomarev, A.; Sidorin, A. Quasi-static fault growth and shear fracture energy in granite. Nature 1991, 350, 39–42. [Google Scholar] [CrossRef]
  12. Cox, S.J.D.; Meredith, P.G. Microcrack formation and material softening in rock measured by monitoring acoustic emissions. Int. J. Rock Mech. Min. Sci. Geomech. Abstr. 1993, 30, 11–24. [Google Scholar] [CrossRef]
  13. He, M.C.; Miao, J.L.; Feng, J.L. Rock burst process of limestone and its acoustic emission characteristics under true-triaxial unloading conditions. Int. J. Rock Mech. Min. Sci. 2010, 47, 286–298. [Google Scholar] [CrossRef]
  14. Zhao, A.H.; Ma, Y.K.; Liu, J.; Chen, D.Z.; Yuan, H.Y.; Fu, M. Energy characteristics of AE signal frequency band during coal rupture in mines with gas. China Saf. Sci. J. 2020, 30, 115–121. [Google Scholar]
  15. Ishida, T.; Labuz, J.F.; Manthei, G.; Meredith, P.G.; Nasseri, M.H.B.; Shin, K.; Yokoyama, T.; Zang, A. ISRM suggested method for laboratory acoustic emission monitoring. Rock Mech. Rock Eng. 2017, 50, 665–674. [Google Scholar] [CrossRef]
  16. Zang, A.; Wagner, F.C.; Stanchits, S.; Dresen, G.; Andresen, R.; Haidekker, M.A. Source analysis of acoustic emissions in Aue granite cores under symmetric and asymmetric compressive loads. Geophys. J. Int. 1998, 135, 1113–1130. [Google Scholar] [CrossRef] [Green Version]
  17. Aker, E.; Kühn, D.; Vavryčuk, V.; Soldal, M.; Oye, V. Experimental investigation of acoustic emissions and their moment tensors in rock during failure. Int. J. Rock Mech. Min. Sci. 2014, 70, 286–295. [Google Scholar] [CrossRef]
  18. Wang, X.R.; Liu, X.F.; Wang, E.Y.; Li, X.L.; Zhang, X.; Zhang, C.; Kong, B. Experimental research of the AE responses and fracture evolution characteristics for sand-paraffin similar material. Constr. Build. Mater. 2017, 132, 446–456. [Google Scholar] [CrossRef]
  19. Burud, N.B.; Kishen, J.M.C. Investigation of long memory in concrete fracture through acoustic emission time series analysis under monotonic and fatigue loading. Eng. Fract. Mech. 2023, 277, 108975. [Google Scholar] [CrossRef]
  20. Triantis, D.; Kourkoulis, S.K. An alternative approach for representing the data provided by the acoustic emission technique. Rock Mech. Rock Eng. 2018, 51, 2433–2438. [Google Scholar] [CrossRef]
  21. Wang, X.R.; Wang, E.Y.; Liu, X.F. Damage characterization of concrete under multi-step loading by integrated ultrasonic and acoustic emission techniques. Constr. Build. Mater. 2019, 221, 678–690. [Google Scholar] [CrossRef]
  22. Lavrov, A. The Kaiser effect in rocks: Principles and stress estimation techniques. Int. J. Rock Mech. Min. Sci. 2003, 40, 151–171. [Google Scholar] [CrossRef]
  23. Lockner, D.A. The role of acoustic emission in the study of rock fracture. Int. J. Rock Mech. Min. Sci. Geomech. 1993, 30, 88–899. [Google Scholar] [CrossRef]
  24. Backers, T.; Stanchits, S.; Dresen, G. Tensile fracture propagation and acoustic emission activity in sand stone: The effect of loading rate. Int. J. Rock Mech. Mining Sci. 2005, 42, 1094–1101. [Google Scholar] [CrossRef]
  25. Wang, E.Y.; He, X.Q.; Liu, Z.T.; Li, Z.H. Study on frequency spectrum characteristics of acoustic emission in coal or rock de-formation and fracture. J. China Coal Soc. 2004, 29, 289–292. [Google Scholar]
  26. Xiao, C.X.; Jin, C.; Ding, X.; Pan, Y. Experimental study on rock burst tendency of coal with different moisture content based on acoustic emission time-frequency signals. J. China Coal Soc. 2018, 43, 931–938. [Google Scholar]
  27. Yang, D.; Hu, J.; Ma, S.; Zeng, P. Analysis of dynamic fracture of granite after uniaxial recompression predamaged by high confining pressure cyclic loading based on acoustic emission. Eng. Fract. Mech. 2022, 266, 108414. [Google Scholar] [CrossRef]
  28. Carpenter, S.R.; Brock, W.A. Rising variance: A leading indicator of ecological transition. Ecol Lett. 2006, 9, 311–318. [Google Scholar] [CrossRef]
  29. Yan, R.; Jiang, C.S.; Zhang, L.P. Study on critical slowing down phenomenon of radon concentrations in water before the Wenchuan Ms 8.0 earthquake. Chin. J. Geophys. 2011, 54, 1817–1826. [Google Scholar]
  30. Hao, W.; Wei, H.; Yan, P.C. Using the principle of critical slowing down to discuss the abrupt climate change. Acta Phys. Sin. 2013, 62, 556–565. [Google Scholar]
  31. Dakos, V.; Scheffer, M.; van Nes, E.H.; Brovkin, V.; Petoukhov, V.; Held, H. Slowing down as an early warning signal for abrupt climate change. Proc. Natl. Acad. Sci. USA 2008, 105, 14308–14312. [Google Scholar] [CrossRef] [PubMed]
  32. Hao, T.X.; Li, F.; Tang, Y.J.; Zhao, L.; Wang, Z. Infrared precursor of pre-cracked coal failure based on critical slowing down. Geomat. Nat. Hazards Risk 2022, 13, 1682–1699. [Google Scholar] [CrossRef]
  33. Loukidis, A.; Stavrakas, I.; Triantis, D. Non-extensive statistical mechanics in acoustic emissions: Detection of upcoming fracture in rock materials. Appl. Sci. 2023, 13, 3249. [Google Scholar] [CrossRef]
  34. Wei, Y.; Li, Z.H.; Kong, X.G.; Zhang, Z.B.; Wang, J.L.; Cheng, F.Q. Critical slowing characteristics of uniaxial compression damage in sandstone. J. Coal 2018, 43, 427–432. [Google Scholar]
  35. Zhu, X.; Liu, H.X.; Hu, J.W.; Fan, J. Experimental study on the characteristics of critical slowing precursors of sandstone damage acoustic emission. Geotechnics 2022, 43, 164–172. [Google Scholar]
  36. Li, D.X.; Wang, E.Y.; Li, Z.H.; Ju, Y.; Wang, D.; Wang, X. Experimental investigations of pressure stimulated currents from stressed sandstone used as precursors to rock fracture. Int. J. Rock Mech. Min. Sci. 2021, 145, 104841. [Google Scholar] [CrossRef]
  37. Wang, X.R.; Wang, E.Y.; Liu, X.; Zhou, X. Micromechanisms of coal fracture: Insights from quantitative AE technique. Theor. Appl. Fract. Mech. 2021, 114, 103000. [Google Scholar] [CrossRef]
  38. Kong, X.G.; Wang, E.Y.; Hu, S.B.; Li, Z.; Liu, X.; Fang, B.; Zhan, T. Critical slowing down on acoustic emission characteristics of coal containing methane. J. Nat. Gas Sci. Eng. 2015, 24, 156–165. [Google Scholar] [CrossRef]
  39. Yuan, S.X.; Jiang, T.; Lei, J.H.; Cui, C.H. Experimental study on fracture characteristics of rock-like material with prefabricated cracks under compression shear. Sci. Rep. 2022, 12, 2809. [Google Scholar] [CrossRef]
  40. Sun, H.; Chen, S.J.; Jin, A.B.; Zhu, D.F. Uniaxial compressive strength characteristics and crack evolution law of fractured rock samples. J. Northeast. Univ. Nat. Sci. Ed. 2022, 43, 404–413. [Google Scholar]
  41. Zhang, X.; Tang, J.P.; Pan, Y.S.; Yu, H. Experimental study on intensity and energy evolution of deep coal and gas outburst. Fuel 2022, 324, 124484. [Google Scholar] [CrossRef]
  42. Zhang, X.; Tang, J.P.; Yu, H.H.; Pan, Y. Gas pressure evolution characteristics of deep true triaxial coal and gas outburst based on acoustic emission monitoring. Sci. Rep. 2022, 12, 21738. [Google Scholar] [CrossRef]
  43. Kong, X.G.; Wang, E.Y.; He, X.Q.; Li, D.; Liu, Q. Time-varying multifractal of acoustic emission about coal samples subjected to uniaxial compression. Chaos Solitons Fractals 2017, 103, 571–577. [Google Scholar] [CrossRef]
  44. Scheffer, M.; Bascompte, J.; Brock, W.A.; Brovkin, V.; Carpenter, S.R.; Dakos, V.; Held, H.; Van Nes, E.H.; Rietkerk, M.; Sugihara, G. Early-warning signals for critical transitions. Nature 2009, 461, 53–59. [Google Scholar] [CrossRef]
  45. Ramos, O. Criticality in earthquakes. Good or bad for prediction? Tectonophysics 2009, 485, 321–326. [Google Scholar] [CrossRef]
  46. Zhang, Z.B.; Wang, E.Y.; Zhang, H.T.; Bai, Z.M.; Zhang, Y.H.; Chen, X. Research on nonlinear variation of elastic wave velocity dispersion characteristic in limestone dynamic fracture process. Fractals 2023, 31, 2350008. [Google Scholar] [CrossRef]
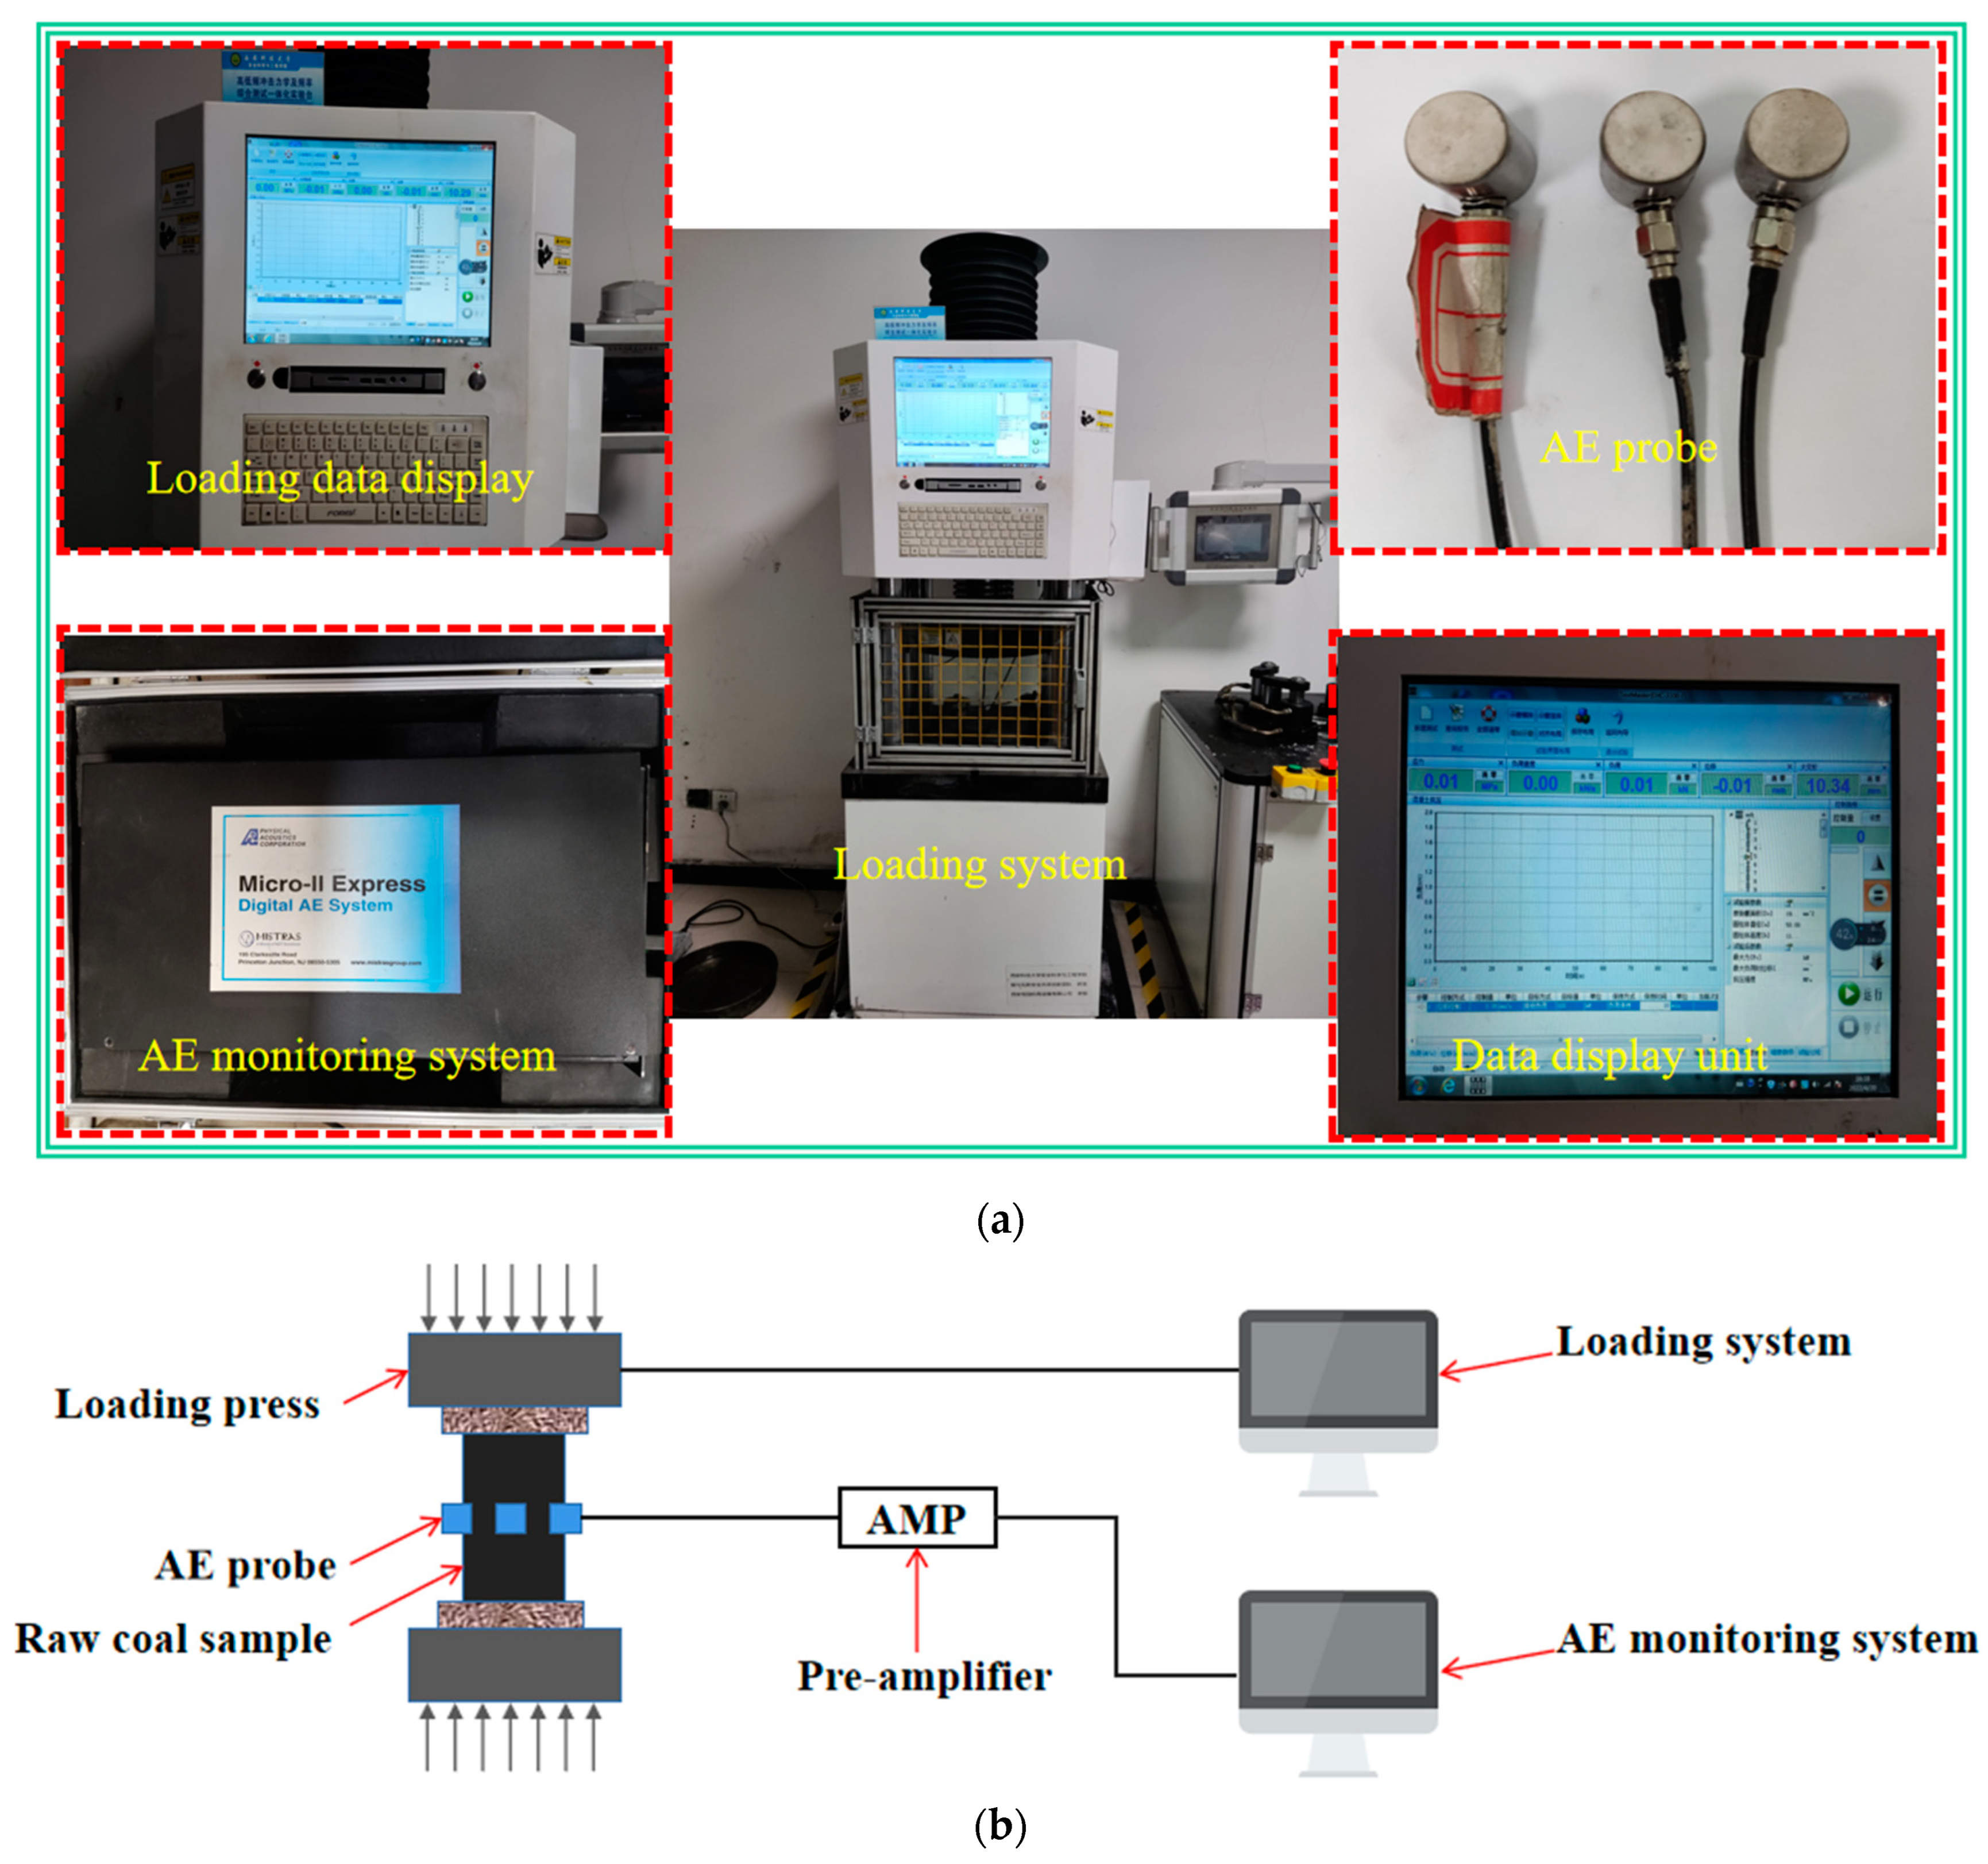
Figure 1. Experimental system. (a) Experimental equipment; (b) experimental composition.
Sustainability 15 11581 g001
Figure 2. Test samples. (a) Sample 1; (b) sample 2; (c) sample 3.
Sustainability 15 11581 g002
Figure 3. Stress–strain curves.
Sustainability 15 11581 g003
Figure 4. Acoustic emission energy, accumulated energy and stress with time during coal failure. (a) Sample 1; (b) Sample 2; (c) Sample 3.
Sustainability 15 11581 g004aSustainability 15 11581 g004b
Figure 5. Window length and lag step.
Sustainability 15 11581 g005
Figure 6. Comparison of variance and autocorrelation coefficient curve. (a) Sample 1 variance curves with different lag steps; (b) Sample 1 autocorrelation coefficient curves with different lag steps; (c) Sample 1 variance curves with different window lengths; (d) Sample 1 autocorrelation coefficient curves with different window lengths; (e) Sample 2 variance curves with different lag lengths; (f) Sample 2 autocorrelation coefficient curves with different lag steps; (g) Sample 2 variance curves with different window lengths; (h) Sample 2 autocorrelation coefficient curves with different window lengths; (i) Sample 3 variance curves with different lag steps; (j) Sample 3 autocorrelation coefficient curves with different lag steps; (k) Sample 3 variance curves with different window lengths; (l) Sample 3 autocorrelation coefficient curves with different window lengths.
Sustainability 15 11581 g006aSustainability 15 11581 g006bSustainability 15 11581 g006cSustainability 15 11581 g006dSustainability 15 11581 g006e
Table 1. The mechanical properties of coal samples.
Uniaxial Compressive Resistance Intensity/MPaElastic Modulus/MPaFailure Strain
Sample 14.84061.0940.149
Sample 210.760264.1510.059
Sample 38.096221.9510.111
Table 2. Loaded rupture risk determination indexes P1, P2 and P3.
K1K2K3K4P1P2P3
Sample 11.302.174.9316.200.592.277.46
Sample 20.030.140.649.060.214.5764.71
Sample 30.710.190.591.213.743.116.37
Disclaimer/Publisher’s Note: The statements, opinions and data contained in all publications are solely those of the individual author(s) and contributor(s) and not of MDPI and/or the editor(s). MDPI and/or the editor(s) disclaim responsibility for any injury to people or property resulting from any ideas, methods, instructions or products referred to in the content.