Article

Drought Characterization and Potential of Nature-Based Solutions for Drought Risk Mitigation in Eastern Ethiopia

by
Dejene W. Sintayehu
1,2,*,
Asfaw Kebede Kassa
3,
Negash Tessema
3,
Bekele Girma
3,
Sintayehu Alemayehu
4 and
Jemal Yousuf Hassen
2
1
The International Center for Tropical Agriculture, Addis Ababa P.O. Box 5689, Ethiopia
2
College of Agriculture and Environmental Sciences, Haramaya University, Dire Dawa P.O. Box 138, Ethiopia
3
Haramaya Institute of Technology, Haramaya University, Dire Dawa P.O. Box 138, Ethiopia
4
International Center for Tropical Agriculture (CIAT), Nairobi P.O. Box 823-00621, Kenya
*
Author to whom correspondence should be addressed.
Sustainability 2023, 15(15), 11613; https://doi.org/10.3390/su151511613
Submission received: 4 May 2023 / Revised: 11 July 2023 / Accepted: 12 July 2023 / Published: 27 July 2023

Abstract

:
Drought is one of the challenges in Ethiopia that affects the agricultural production. Ecosystems can mitigate the effects of climate-related hazards including drought. For this reason, nature-based solutions (NbS) are becoming more prominent to manage climate-related impacts in developing countries; however, there is still limited empirical evidence, which would inform NbS policy and practices. Thus, the aim of this study was to characterize droughts in Eastern Ethiopia (the case of Erer Sub-basin) and assess the effectiveness of various NbS for drought. The temporal changes in soil moisture deficit index (SMDI) (agricultural drought) and standard precipitation evapotranspiration index (SPEI) (meteorological drought) at various timescales (1, 3, and 6 months) between 1981 and 2020 were analyzed. Qualitative analysis was used to categorize and evaluate the effectiveness of NbS to mitigate drought risk by adopting a Living Labs approach. Overall, the study revealed that droughts showed an increasing trend with more frequency, longevity, and severity. The drought analysis results showed that SPEI’s variants were less reliable than SMDI0–5 and SMDI5–100. With an increase in rainfall, SPEI showed stronger relationships with SMDI0–5 at one and two-month delays between May and July. SPEI and SMDI5–100 performed better in terms of capturing actual drought occurrences than SMDI0–5. The results of focus group discussions (FGD) suggested NbS such as habitat restoration, structural restoration, reforestation, rehabilitation, revegetation, land enclosures, conservancies, and locally managed areas have been practiced as a strategy to manage drought risks. Overall, the study indicated that a new, comprehensive approach through nature-based solutions to reduce the risk of drought is urgently needed.

1. Introduction

Due to human-caused greenhouse gas emissions, the climate of the planet is changing, which leads to more extreme weather conditions such as droughts and floods. The main climatic risk to worldwide agricultural productivity is drought, particularly in regions where crops are entirely dependent on precipitation. Due to ongoing climate change, both the frequency and intensity of droughts have increased in many areas of the world. Evaporation is accelerated by warmer temperatures, which decreases surface water and dries out soils and vegetation. Because of this, dry spells last longer than they would in cooler conditions. The timing of when water is available is also changing due to climate change [1,2,3]. Without sufficient irrigation, a drought can result in a crop water deficit which can impede crop extension and diminish agricultural yields, endangering food security [4,5].
In particular, cereal crops are one of the crops that feed around twenty percent of the world’s population [6] and are vulnerable to drought or other natural disasters [7]. Globally, dryness decreased sorghum and maize yields by 20.6% during the year 1980 and 2015 [8]. Consequently, understanding how drought affects agriculture is crucial for reducing yield losses caused by drought [9]. Several strategies including ecosystem management, protection, and restoration have been suggested as a way to protect crops from the increased impact of drought.
A persistent discrepancy between water supply and demand is what causes a drought [10]. Insufficient precipitation and soil moisture are two typical factors that contribute to drought, which frequently leads to agricultural drought following a period of meteorological drought [11,12] Variabilities in the climate and anthropogenic factors are the main contributors to the shifting pattern of droughts. Droughts have a significant influence on agriculture, the environment, water supplies, and people. The growth of ecosystem services, the improvement of biodiversity, and soil and water conservation are all part of environmental rehabilitation [13]. Many scholars have tried to define agricultural drought using different drought indices such as agricultural and meteorological drought; the percentage of precipitation anomaly is one of the most popular meteorological drought indices [14].
Water in the soil is an essential indicator for agricultural drought monitoring [15]. Water availability, plant production, and crop output are all directly impacted by changes in the soil’s water balance and soil water stress [16,17,18]. According to [19], the crop moisture index, soil moisture percentage [20], normalized soil moisture [21], soil moisture anomaly [22], and other drought indices developed based on soil moisture content are suitable for describing agricultural drought. They have been extensively used to pinpoint and keep tabs on agricultural droughts [23,24]. Based on the soil moisture simulated using the SWAT (Soil and Water Assessment Tool) model, a soil moisture deficiency indicator (SMDI) was developed, which strongly correlated with cereal production during the crucial growing season [25].
A number of different governmental organizations have emphasized the necessity of switching to more sustainable food systems. It is encouraged to develop new frameworks for policymaking and take climate change adaptation measures that simultaneously address issues of water and food security, agricultural and rural landscape preservation, climate change mitigation, and ecosystem and biodiversity conservation [26,27]. Out of all the suggested strategies, the notion of nature-based solutions (NbS) have attracted considerable interest [28,29,30]. NbS employ or imitate natural processes to increase water availability (e.g., soil moisture retention, groundwater recharge), improve water quality (e.g., natural and artificial wetlands, riparian buffer strips), and decrease risks related to climate change and water-related disasters, which includes all management methods and measures that uphold and enhance ecosystem function while bringing about positive social and economic effects. In order to address social concerns including hunger, poverty, water shortages, and climate change, NbS emphasize the significance of biodiversity and the prudent use of natural resources. NbS are being more and more seen as strategic options to solve both the climate and biodiversity issues. In order to increase society’s and ecosystems’ capacity to adapt to climate change while promoting the development of a more robust and sustainable economy, NbS have been utilized all over the world [31,32]. Studies exploring the efficacy of NbS to control drought risks in the setting of developing nations are quite scarce, despite the rising body of evidence for NbS assisting climate change mitigation and adaptation.
Ethiopia, a developing country, is one of the most susceptible nations in the world to the consequences of natural and climatic calamities, which are made worse by environmental degradation and socioeconomic difficulties. It is crucial to conduct a complete and understandable synthesis of the available data on the efficacy of nature-based solutions (NbS) for addressing climate-related hazards, such as drought, in order to address drought vulnerability and its management [33]. Climate change has also increased the severity of heat waves and droughts [25,34], and severe water pollution, notably widespread groundwater contamination with arsenic, has increased the vulnerability to water scarcity [35]. Widespread poverty makes people more susceptible to these consequences [36].
However, the government of Ethiopia has also committed to a greenhouse gas (GHG) reduction of 21.85% below business-as-usual by 2030, of which 15% is conditional on foreign help. This extraordinarily high sensitivity to climate change has led to a concentration on climate adaptation [37]. The updated Nationally Determined Contribution (NDC) states that the GHG goals should not conflict with the national principles of maintaining a minimum 8% GDP growth rate, eliminating poverty by 2030, and guaranteeing food and nutrition security for all citizens. Ethiopia also aspires to become an upper middle-income nation over the coming ten years. The long-term goal of Ethiopia’s NDC is to create synergies between adaptation and mitigation measures [36].
Climate change, pollution, and resource overuse are causing ecosystems in East Hararghe, Ethiopia, to deteriorate, creating an increasing threat to livelihoods, particularly for the rural poor [38,39,40]. NbS can be one of the solutions to stop this degradation, increase climate resilience, empower local communities, and promote sustainable development; yet, they are not fully incorporated into national policy [41], in part because their advantages are not generally understood [42]. In a previous study exploring the consequences of drought and its risk mitigation strategies, several drought indices were linked with crop growth or yield-related factors [43], but only one meteorological or agricultural drought index was used. There have not been any studies that employed NbS in the area to lower drought risk, and there have not been many studies that have looked at different drought indicators and evaluated how well they are suited for monitoring drought conditions and their consequences on agriculture and crops. Therefore, the purpose of this study is to analyze and diagnose drought vulnerability and its management through NbS in the Erer Sub-basin of Eastern Ethiopia.
It is expected that this study would help in establishing a sub-basin-specific drought monitoring and mitigation practice that will utilize NbS. The results of the study have a significant impact on how climate adaptation and biodiversity management policies and commitments are designed and implemented. It also provides science-based evidence for designing effective and resilient NbS that benefit both people and nature.

2. Materials and Methods

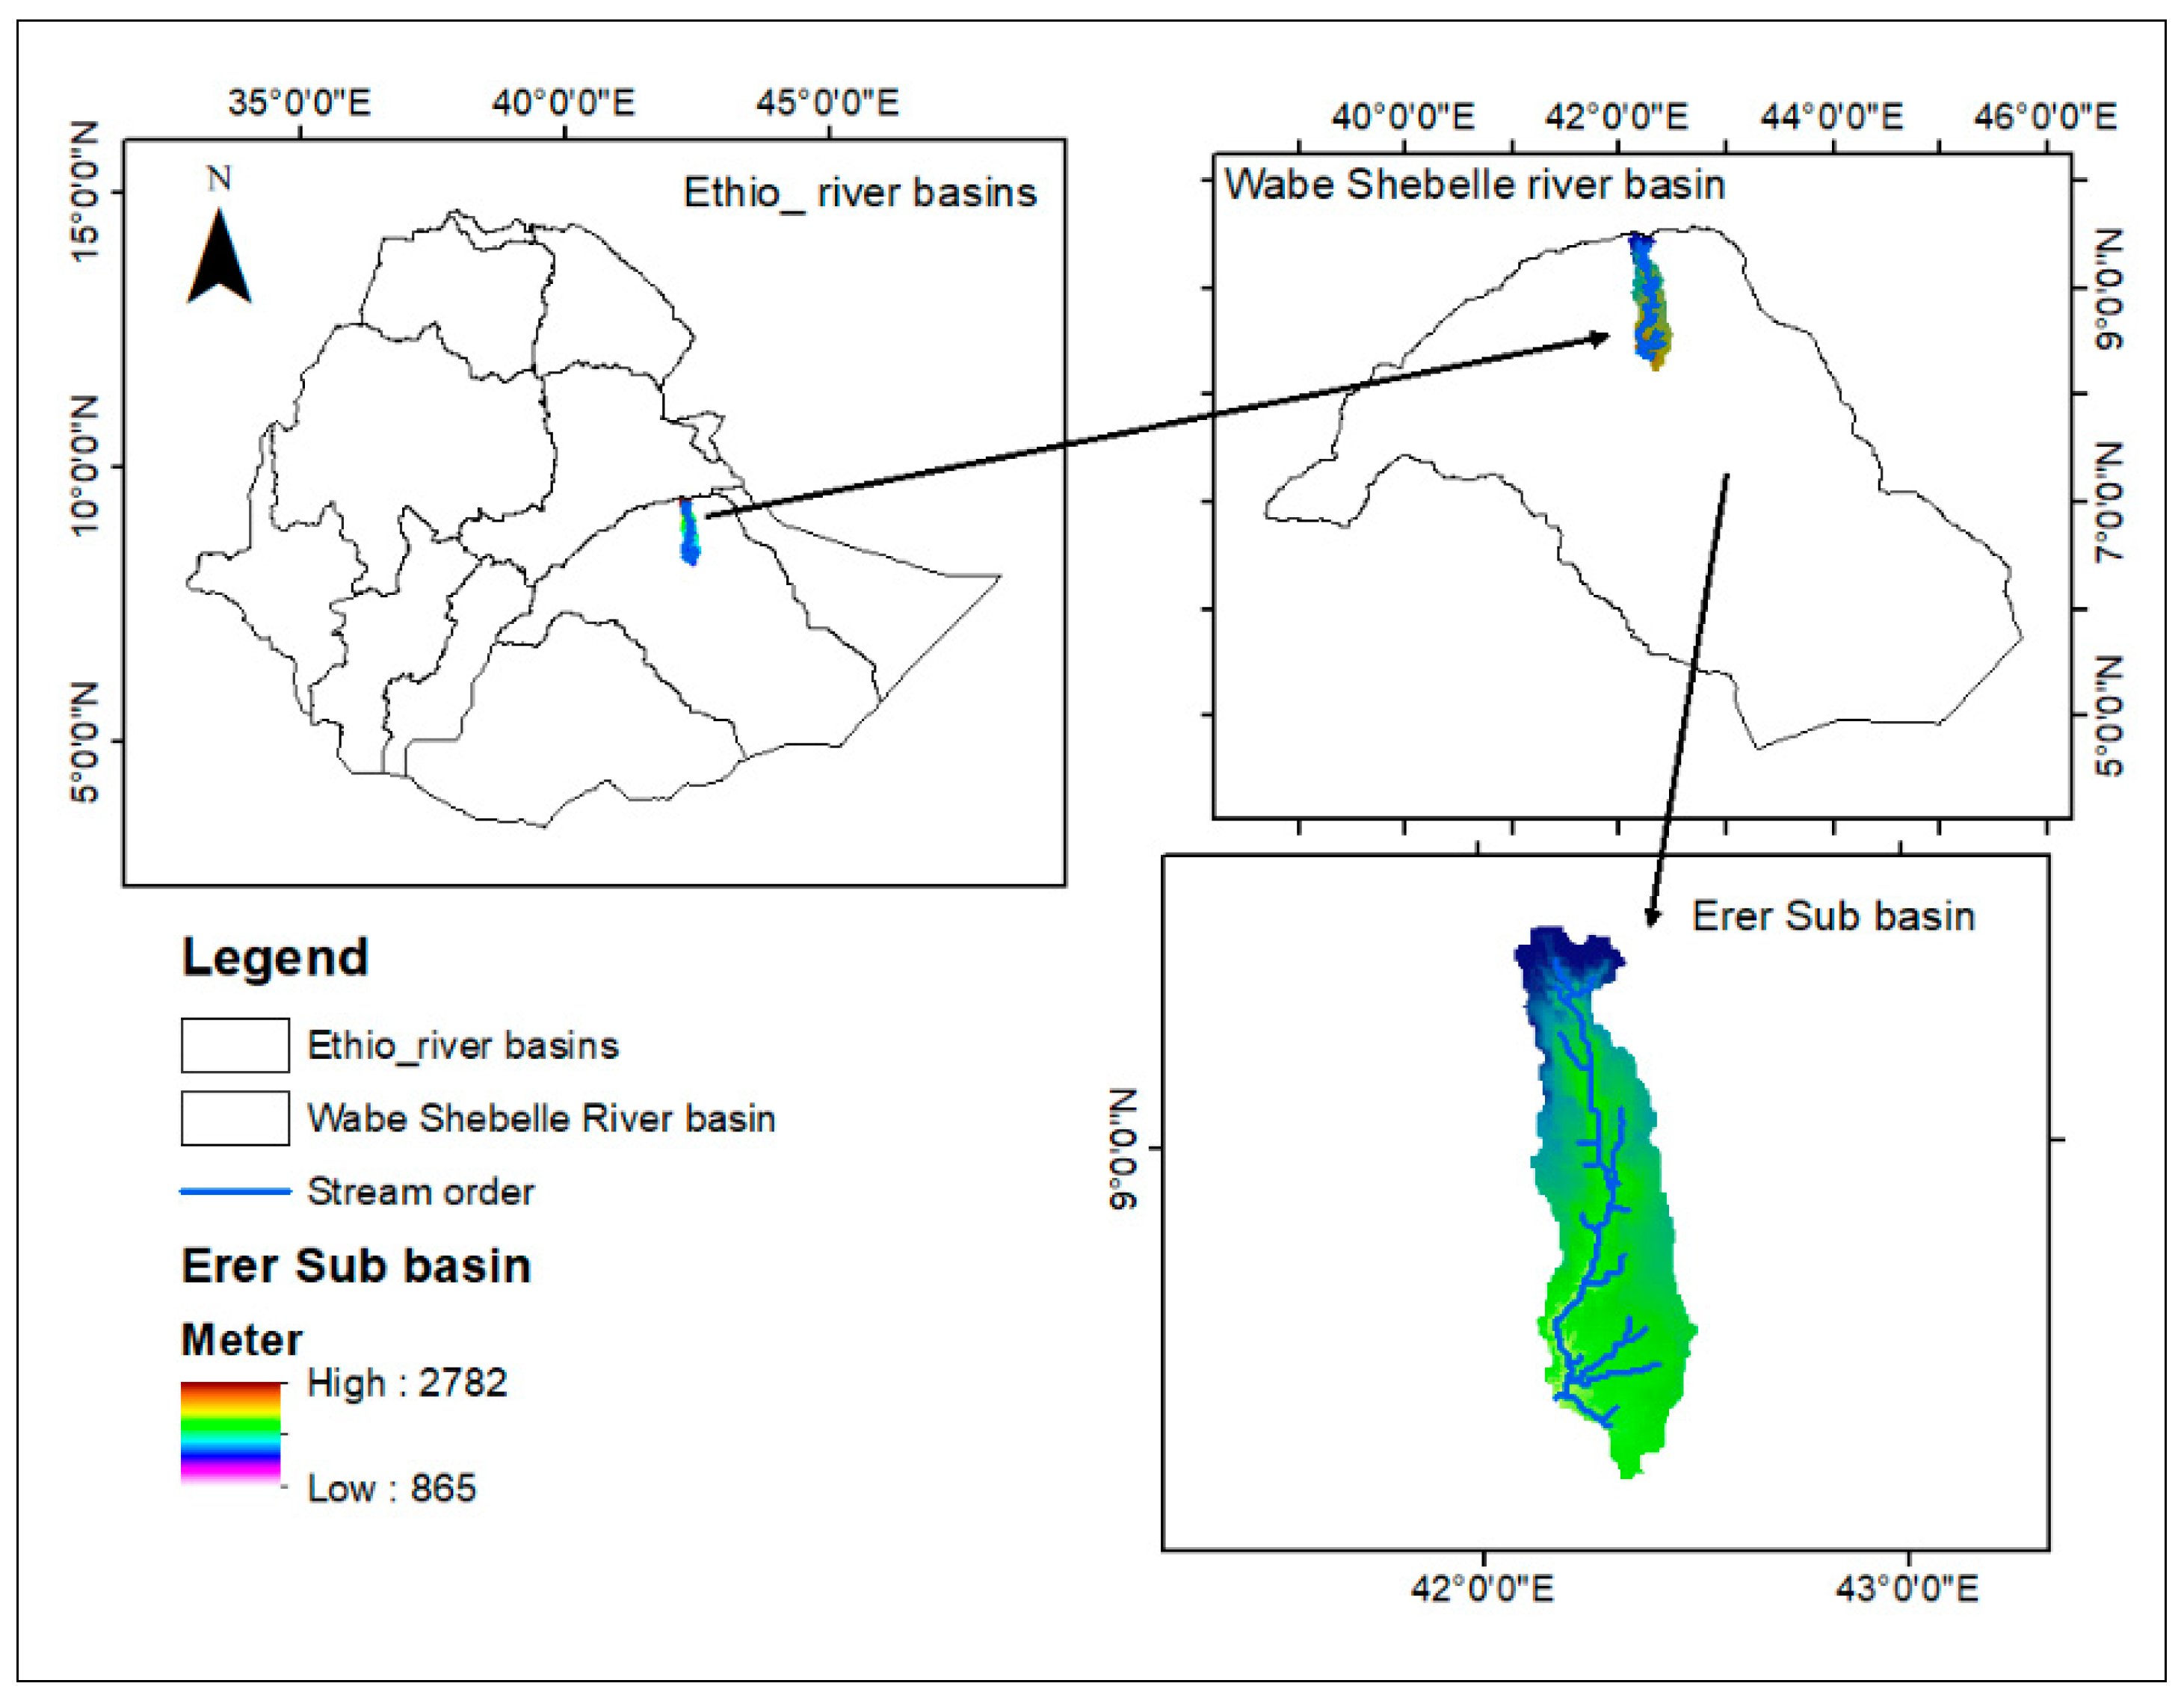
2.1. Description of the Study Area

The Upper Wabi Shebelle Basin’s Erer Sub-basin, with an elevation range of 800 to 2920 m above mean sea level (m.a.s.l.), is where this study was conducted. It is situated between latitudes 08°12′35″ and 09°31′07″ N and 42°04′27″ and 42°31′07″ E (Figure 1). The Erer Sub-basin has a drainage area of 3860 km2, is 500–1500 m above sea level, and has a 73.5% kolla (warm semiarid) climate. The woina dega (cool sub-humid; 1500–2300 m.a.s.l.) and dega (cool humid; 2300–3200 m.a.s.l.) climates, respectively, comprise around 25.12% and 1.36% of the entire drainage area [44].
According to information gathered from Kombolcha, Harar, Haramaya, Eerer, and Babile meteorological stations, the catchment experiences an average annual rainfall of between 744 and 1017 mm, with most of it falling in the rain season [45]. While the average monthly minimum temperature is 16.72 °C, the average monthly maximum temperature is 29.95 °C. According to the Ministry of Agriculture [46], the main soil types are calcaric regosols, eutric nitosols, eutric regosols, dystric cambisols, haplic xerosols, and humic cambisols, which account for up to 4%, 8%, 20%, 19%, 33%, and 16% of the total research area, respectively.

2.2. Data Set

2.2.1. Meteorological Data

The daily precipitation (P), relative humidity (RH), maximum and minimum temperatures (Tmax and Tmin), wind speed at 2 m (U), and sunshine hours were provided by the Ethiopian National Metrological Agency (NMA) as observed meteorological data. Table 1 lists the stations having years of records, percentages of missing data that are filled and subsequently included in the study, and years of records for each station. The missing data were filled in by linear regression to correct the meteorological data for subsequent studies. Five stations in the catchment’s limited records of the point rainfall were extended when the missing data were filled in. The consistency and homogeneity of rainfall were checked by the double mass curve technique [47] and by the non-dimensional homogeneity test [48], respectively.

2.2.2. Soil Moisture Data

The most accurate fields for the conditions and fluxes of the land surface are provided by the Noah-simulated Global Land Data Assimilation System (GLDAS), which combines satellite data and measurements from the ground [49]. The GLDAS has been used to hold 0.1 and 0.25 resolution simulations of the Noah, CLM, VIC, and Mosaic land surface models for the summer seasons of 1981 through 2020, along with a significant quantity of meteorological data, parameter maps, and outputs. Products ranging in depth from 0 to 200 cm are provided from GLDAS. We obtained the soil moisture datasets with 0–5 cm and 5–100 cm from the GLDAS 2.1 Noah model with 0.25 × 0.25 between 1981 and 2020 during the primary growing season (May to October) because summer maize and sorghum are the dominant crops in the Erer Sub-basin and 80% of the root distribution is at a depth of 0–100 cm [50].

2.2.3. Focus Group Discussions

Five focus group discussions (FGDs) were held throughout the catchment for the first data collection. For each of the five weather stations taken into consideration for the catchment, an FGD was conducted. A single FGD included invitations to seven to twelve people. The fluctuation of the climate-induced natural hazard (agricultural and meteorological drought) during the past 30 years was the topic of debate. The discussion participants who are older than 30 years were specifically chosen for this project in the belief that they would be able to recall and be familiar with the catchment’s climate-related threats from the previous 30 years. To make our conclusions more dependable, we contrasted the information we assessed with that we collected from the respondents.

2.3. Determination of Drought Indices

As shown in Figure 2, the study determines the two drought types meteorological and agricultural as an input for vulnerability and risk analysis using the methods as described in the following sub-sections. The focus group discussion was used as qualitative analysis to understand fluctuation of the climate-induced natural hazard (agricultural and meteorological drought) during the past 30 years and communities’ practice towards NbS.

2.3.1. Standardized Precipitation Evapotranspiration Index (SPEI)

The difference between precipitation (P) and reference crop evapotranspiration (ETo) for each site was used to calculate the SPEI (SPEI_1 for May, SPEI_3 for May–July, and SPEI_6 for May–October). May was selected as SPEI_1 because it ushers in the rainy season, which in the Sub-basin is followed by SPEI_3 and SPEI_6. The Penman–Monteith equation is advised by the Food and Agricultural Organization of the United Nations (FAO), as it has proven effective in numerous parts of the world [51]. The steps for computing SPEI are listed below [52]. In order to determine the ETo at the monthly timescale, we used:
ETo = 0.408 R n G + γ 900 T + 273 U 2 ( e s e a ) + γ ( 1 + 0.34 U 2 )
where T is the daily average temperature (°C); Rn is the net radiation (MJ m−2 d−1); the wind speed at 2 m (m s1) is U2; the saturated and actual water vapor pressures (kPa) are es and ea, respectively; the wet and dry meter constant (kPa/C) is equal to the slope of the saturated water vapor pressure-temperature curve (kPa/C).
Likewise, to calculate the difference between P and ETo, namely D, we carried out:
D = P − ETo
The fitting effects of the log-logistic, Pearson III, Lognormal, and generalized extreme values on the sequence were compared in [52] to normalize the data series D. In accordance with the findings, the log-logistic distribution performed better as follows:
F ( x ) = [ 1 + ( α x γ ) β ] 1
where α is the scale parameter, β shape parameter, and γ is the origin parameter, which can all be determined by fitting the linear moment, and F(x) is the cumulative probability distribution function for a particular timescale. The following calculations are made for the parameters:
α = ( ω o 2 ω ) β Γ ( 1 + 1 β ) Γ ( 1 1 β )
β = 2 ω 1 ω o 6 ω o ω o 6 ω 2
γ = ω o α Γ ( 1 + 1 β ) Γ ( 1 1 β )
where Γ is the factorial function; ω0, ω1, ω2 is the probability-weighted distance of the original data sequence D, and the calculation method was:
ω 1 = 1 N   i = 0 N 1 F i D
F i   = i 0.35 N
where N is the number of months involved in the calculation. To standardize the cumulative probability density, we used:
P D = 1 F x
when P(D)     0.5
W = 2 l n ( P ( D )
S P E I = c o + c 1 W + c 2 W 2 1 + d 1 W + d 2 W 2 + d 3 W 3
when P(D) > 0.5 ,   P D   is   replaced   by   1 P D .   Here   c o = 2.515517 ,   c 1 = 0.802853 ,   c 2 = 0.01032 ,   d 1 = 1.432788 ,   d 2 = 0.1892   a n d   d 3 = 0.001308 .

2.3.2. Soil Moisture Deficit Index (SMDI)

Using data on soil moisture content at 1, 3, and 6 timeframes from 1981 to 2020, SMDI was estimated at two soil levels of 0–5 cm and 5–100 cm. These were the calculations: (1) for a certain timeline, the long-term median, maximum, and minimum soil moisture values were utilized to calculate the % soil moisture deficit. The calculation was carried out as follows:
S D i j = s w i j M S W J M S W j m i n S W j × 100 , S W i j M S W j s w i j M S W j m a x S W j M S W j × 100 , S W i j > M S W j
where, in the soil profile, SDi, j represents the soil moisture deficit (%); SWi, j represents the soil moisture content at the given timescale (mm); MSWj represents the soil moisture content over the long term (mm); maxSWj represents the soil moisture content at its maximum (mm); minSWj represents the soil moisture content at its minimum (mm) (i = 1, 2,…, 58, and j = 1, 2,…, 12). (2) The seasonality of soil moisture is eliminated by applying Equation (13). So, SD is evaluated in relation to seasons. Choosing the time step during which the dryness measurements are gathered is the key problem in determining drought severity [15]. Thus, the drought index is calculated on an incremental basis as suggested by [53].
S M D I i j = S D i j 50 , j = 1 0.5   S M D I i j 1 + S D i j 50 , j > 1
The step during calculation was modified to 2 in order to compare SMDI and SPEI, and SMDI was then updated to match the SPEI result. The average value of the months that precede and include the current month is used to calculate the SPEI or SMDI value for a given month (or time period). A typical outcome for the month of May would be the SPEI or SMDI at the 1-month timeframe. Table 2 shows the classification of dry and wet environments using SPEI and SMDI.

2.3.3. Estimation of Drought Characteristics

The run theory is a time series analysis method that is widely used to identify the characteristics of drought [55]. Here, the run theory was used to analyze the droughts in the Eerer sub-basin. The truncation criterion was set at 0 in this study in accordance with the type of drought linked with the SPEI and SMDI values in the literature [56,57]. As a result, when the SPEI or SMDI value dropped below 0, drought was recognized [58]. Typically, the features of a drought are listed together with their frequency, length, and intensity. The ratio of the number of months when a drought occurs to the total number of months in a given period is how the number of droughts in a given time is assessed, according to the literature [55,58,59]. The length of a drought is the amount of time (for example, the number of months) between the beginning and the inference of the drought. It is determined by dividing the overall number of dry spells by the total length of those spells. The cumulative deficit with the SPEI or SMDI values consistently lower than 0 can be used to calculate the drought intensity, which measures the severity of the drought during the period of the drought. This study used the aforementioned methods to estimate the drought characteristics of the Eerer sub-basin utilizing SPEI and SMDI as the dry/wet state categorization shown in Table 2 [54].

2.4. Stakeholder Perspectives on Drought Risk Reduction Using NbS

A qualitative approach was adopted to examine the stakeholders’ perspectives on drought risk reduction using NbS, the extensive participatory procedures, and extensive collaborative planning techniques, employing a Living Labs approach [60]. A comparatively small group of FGD participants were used in this study to collect dense data and to construct an in-depth understanding of the semi-structured protocol used during the FGDs [61]. Potential stakeholders were identified using the systematic stakeholder mapping methodology proposed by [62] and based on information that was made available from the various locations, as well as their documentation and protocols. To address all the divergent perspectives, attitudes, and opinions, a systematic approach to selecting FGD partners was chosen in accordance with the principle of maximum contrasts based on the grounded theory [63]. A diverse variety of participants from a small size of population FGD participants were intended to be included. Different sociodemographic features, professional backgrounds, and perspectives were all included as criteria.
In accordance with the data collected, a list of stakeholders was created and then segmented into stakeholder groups. During the later stages of the collaborative planning and co-creation process, the local facilitator teams in charge of the stakeholder processes were asked to replace any stakeholders who were not responding to their requests, would not participate, or were only important for one or two steps [64]. Local facilitators were asked to assess the roles of stakeholders as well as their significance in the various co-design, co-implementation, and co-monitoring/evaluation stages, their relation, and their affectedness by drought risk based on the idea of interest–influence matrices and three-dimensional power-influence-attitude grids [65]. The decision-making processes for identifying viable ways to reduce the risks associated with drought and the stakeholders’ potential contribution to the NbS were additional criteria.
Stakeholder mapping data were also used to choose FGD participants at different sites around the Sub-basin through an iterative selection process. The FGD panel had at least one representative from each location’s corporate community, academic community, government, political personalities, and civil society (represented, for example, by local NGOs). Ref. [65] believed that the respondents’ histories and sociodemographic traits should represent a wide range of perspectives, various ideas, attitudes, and backgrounds across all case locations. However, in this study, not all of the individuals who were initially selected (about 15) could be questioned, as some declined the invitation to an FGD or said they could not participate at the scheduled time. Thus, other individuals had to be selected. There were also phone and video conversations used for the FGDs. When FGD participants declined to be recorded, notes were taken. For the evaluation, audio recordings of FGDs were transcribed and translated into English from the local languages Amharic and Afaan Oromo. The texts were then evaluated, condensed, and organized under or into essential assertions and relative frequency following the approach described by [66].

2.5. Drought and Nature-Based Solutions

Droughts often have adverse effects and appear to not offer any benefits [1]. They may have detrimental impacts such as lack of food and water, loss of revenue, and an increase in illness. They hurt agriculture and have the power to obliterate both plants and animals [67]. In the context of spatial planning and management strategies, it is necessary to take into account and consider the potential of nature-based solutions to alleviate drought risks or serve as sustainable solutions [43]. As a result, in this study, the severity class was determined after both meteorological and agricultural droughts were estimated using the mentioned indices (SPEI and SMDI) for three timescales (1, 3, and 6 months). A potential drought risk management approach was then investigated based on the information gathered through the FGD with the stakeholders after the severity class was determined. In order to do so, a Living Labs methodology was adopted as suggested by [60]. This methodology is essential to analyze stakeholders’ perspectives on drought risk reduction by adopting NbS, comprehensive participatory procedures, and extensive collaborative planning strategies.

3. Results and Discussion

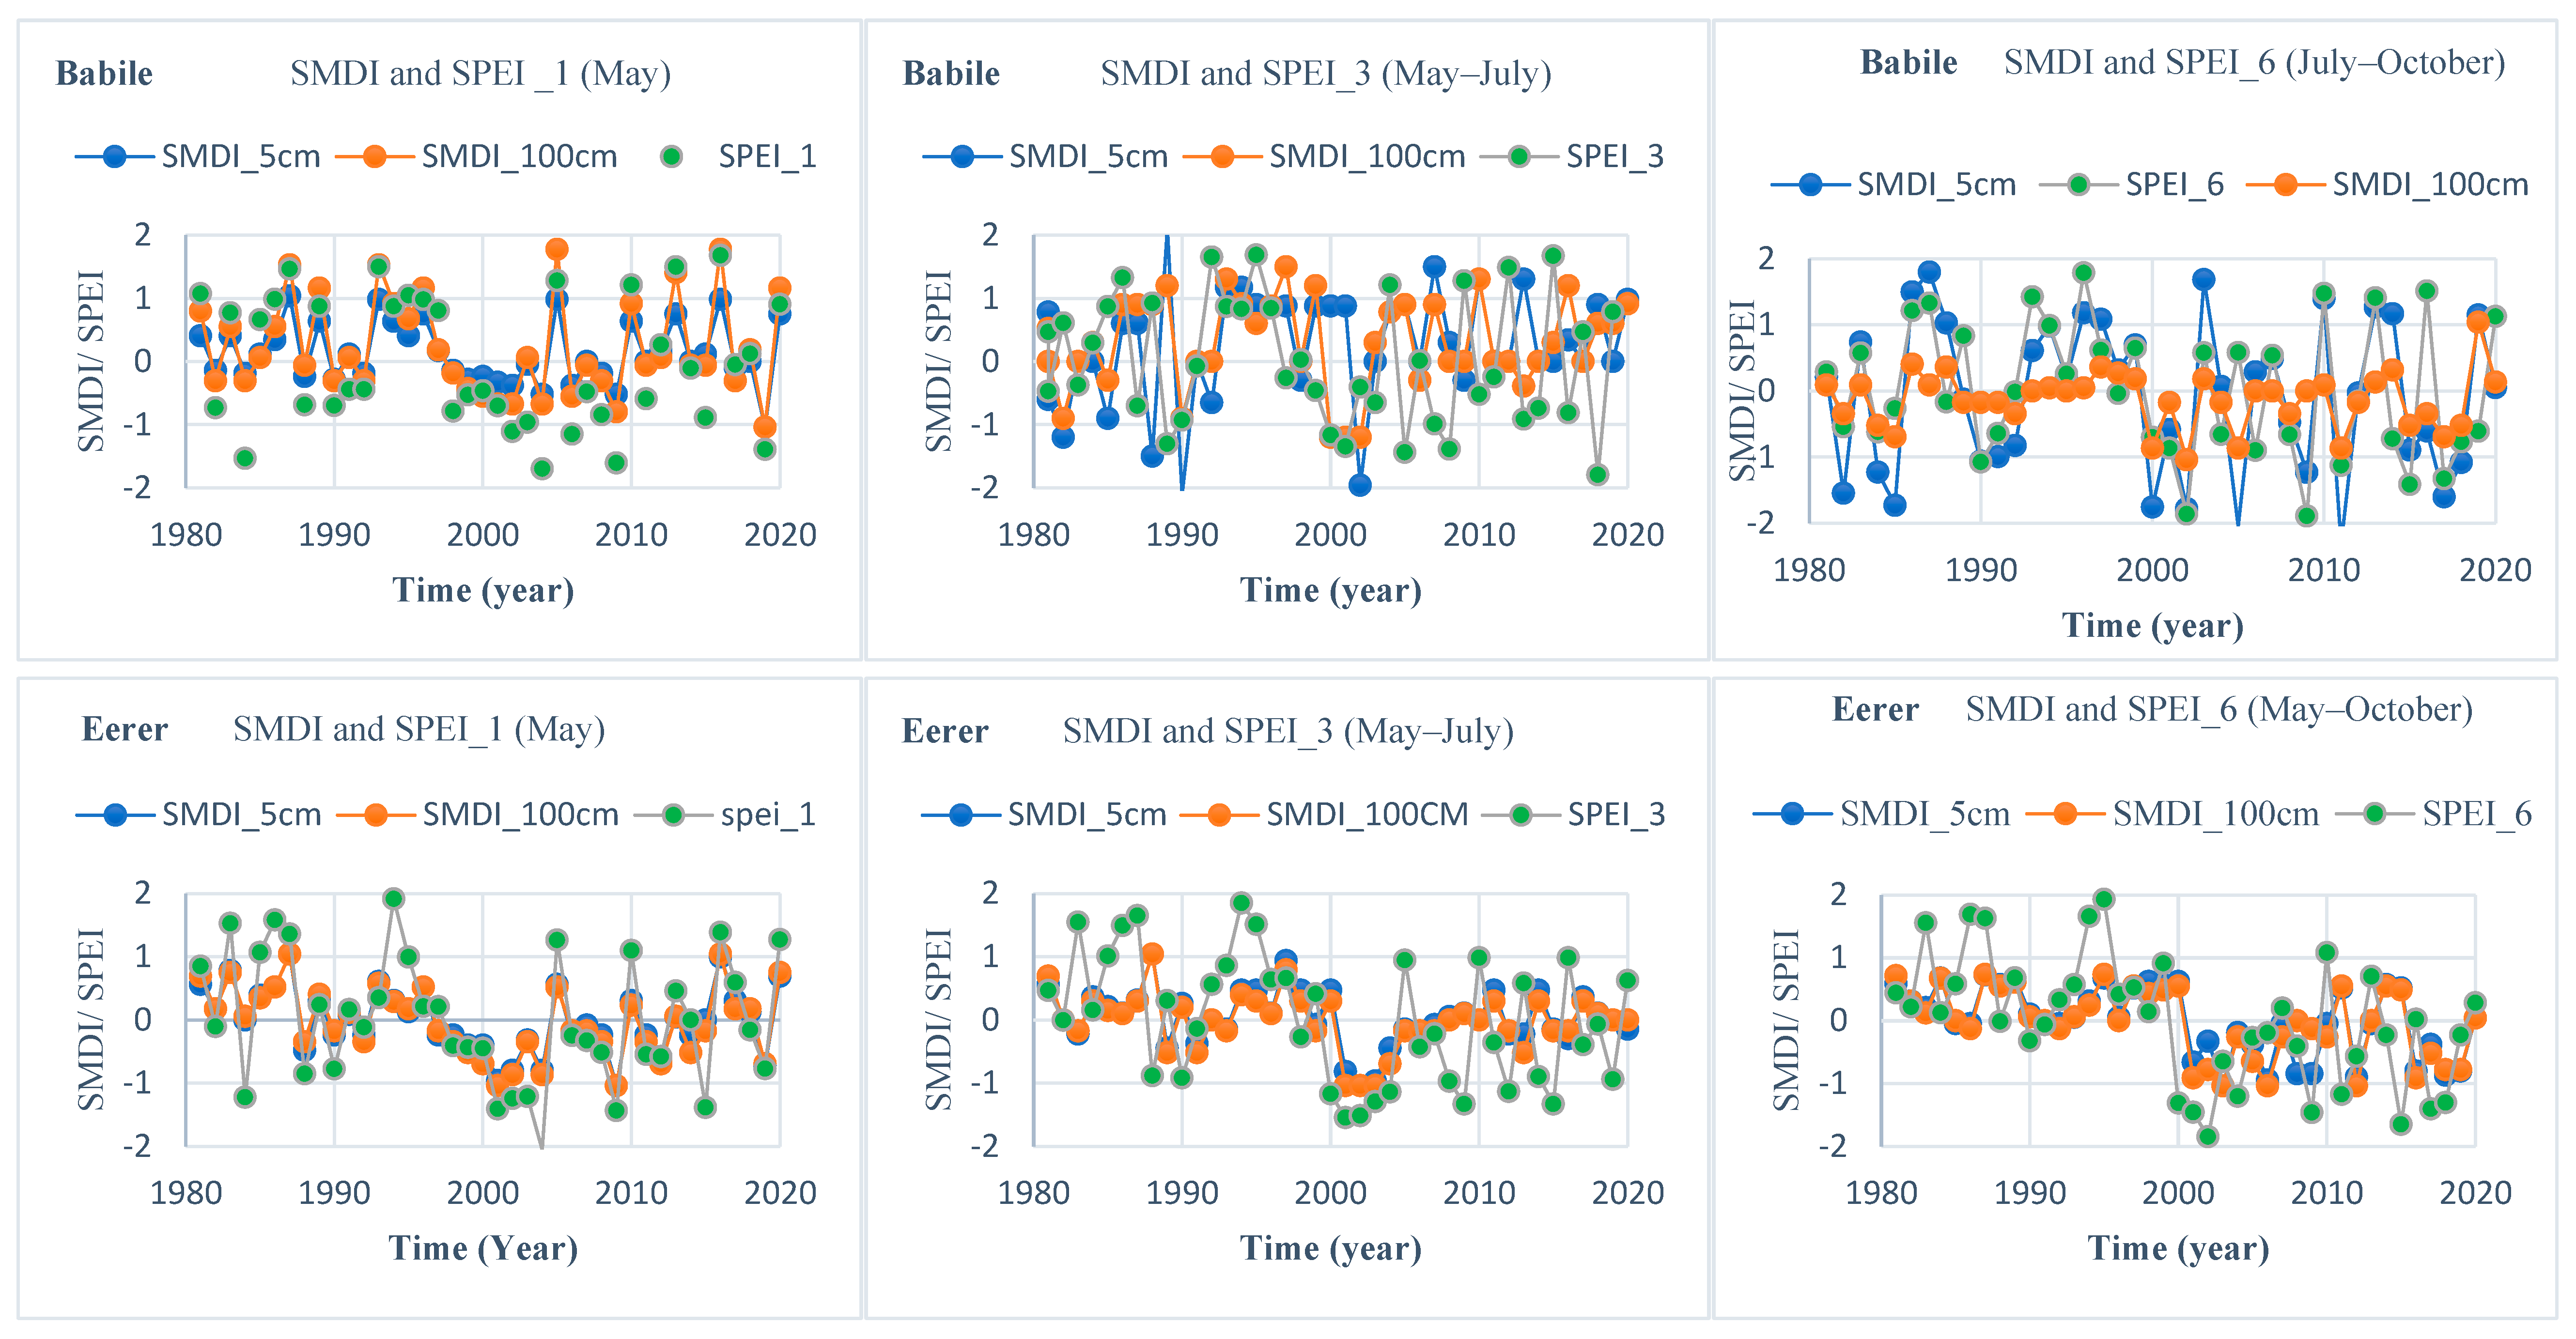
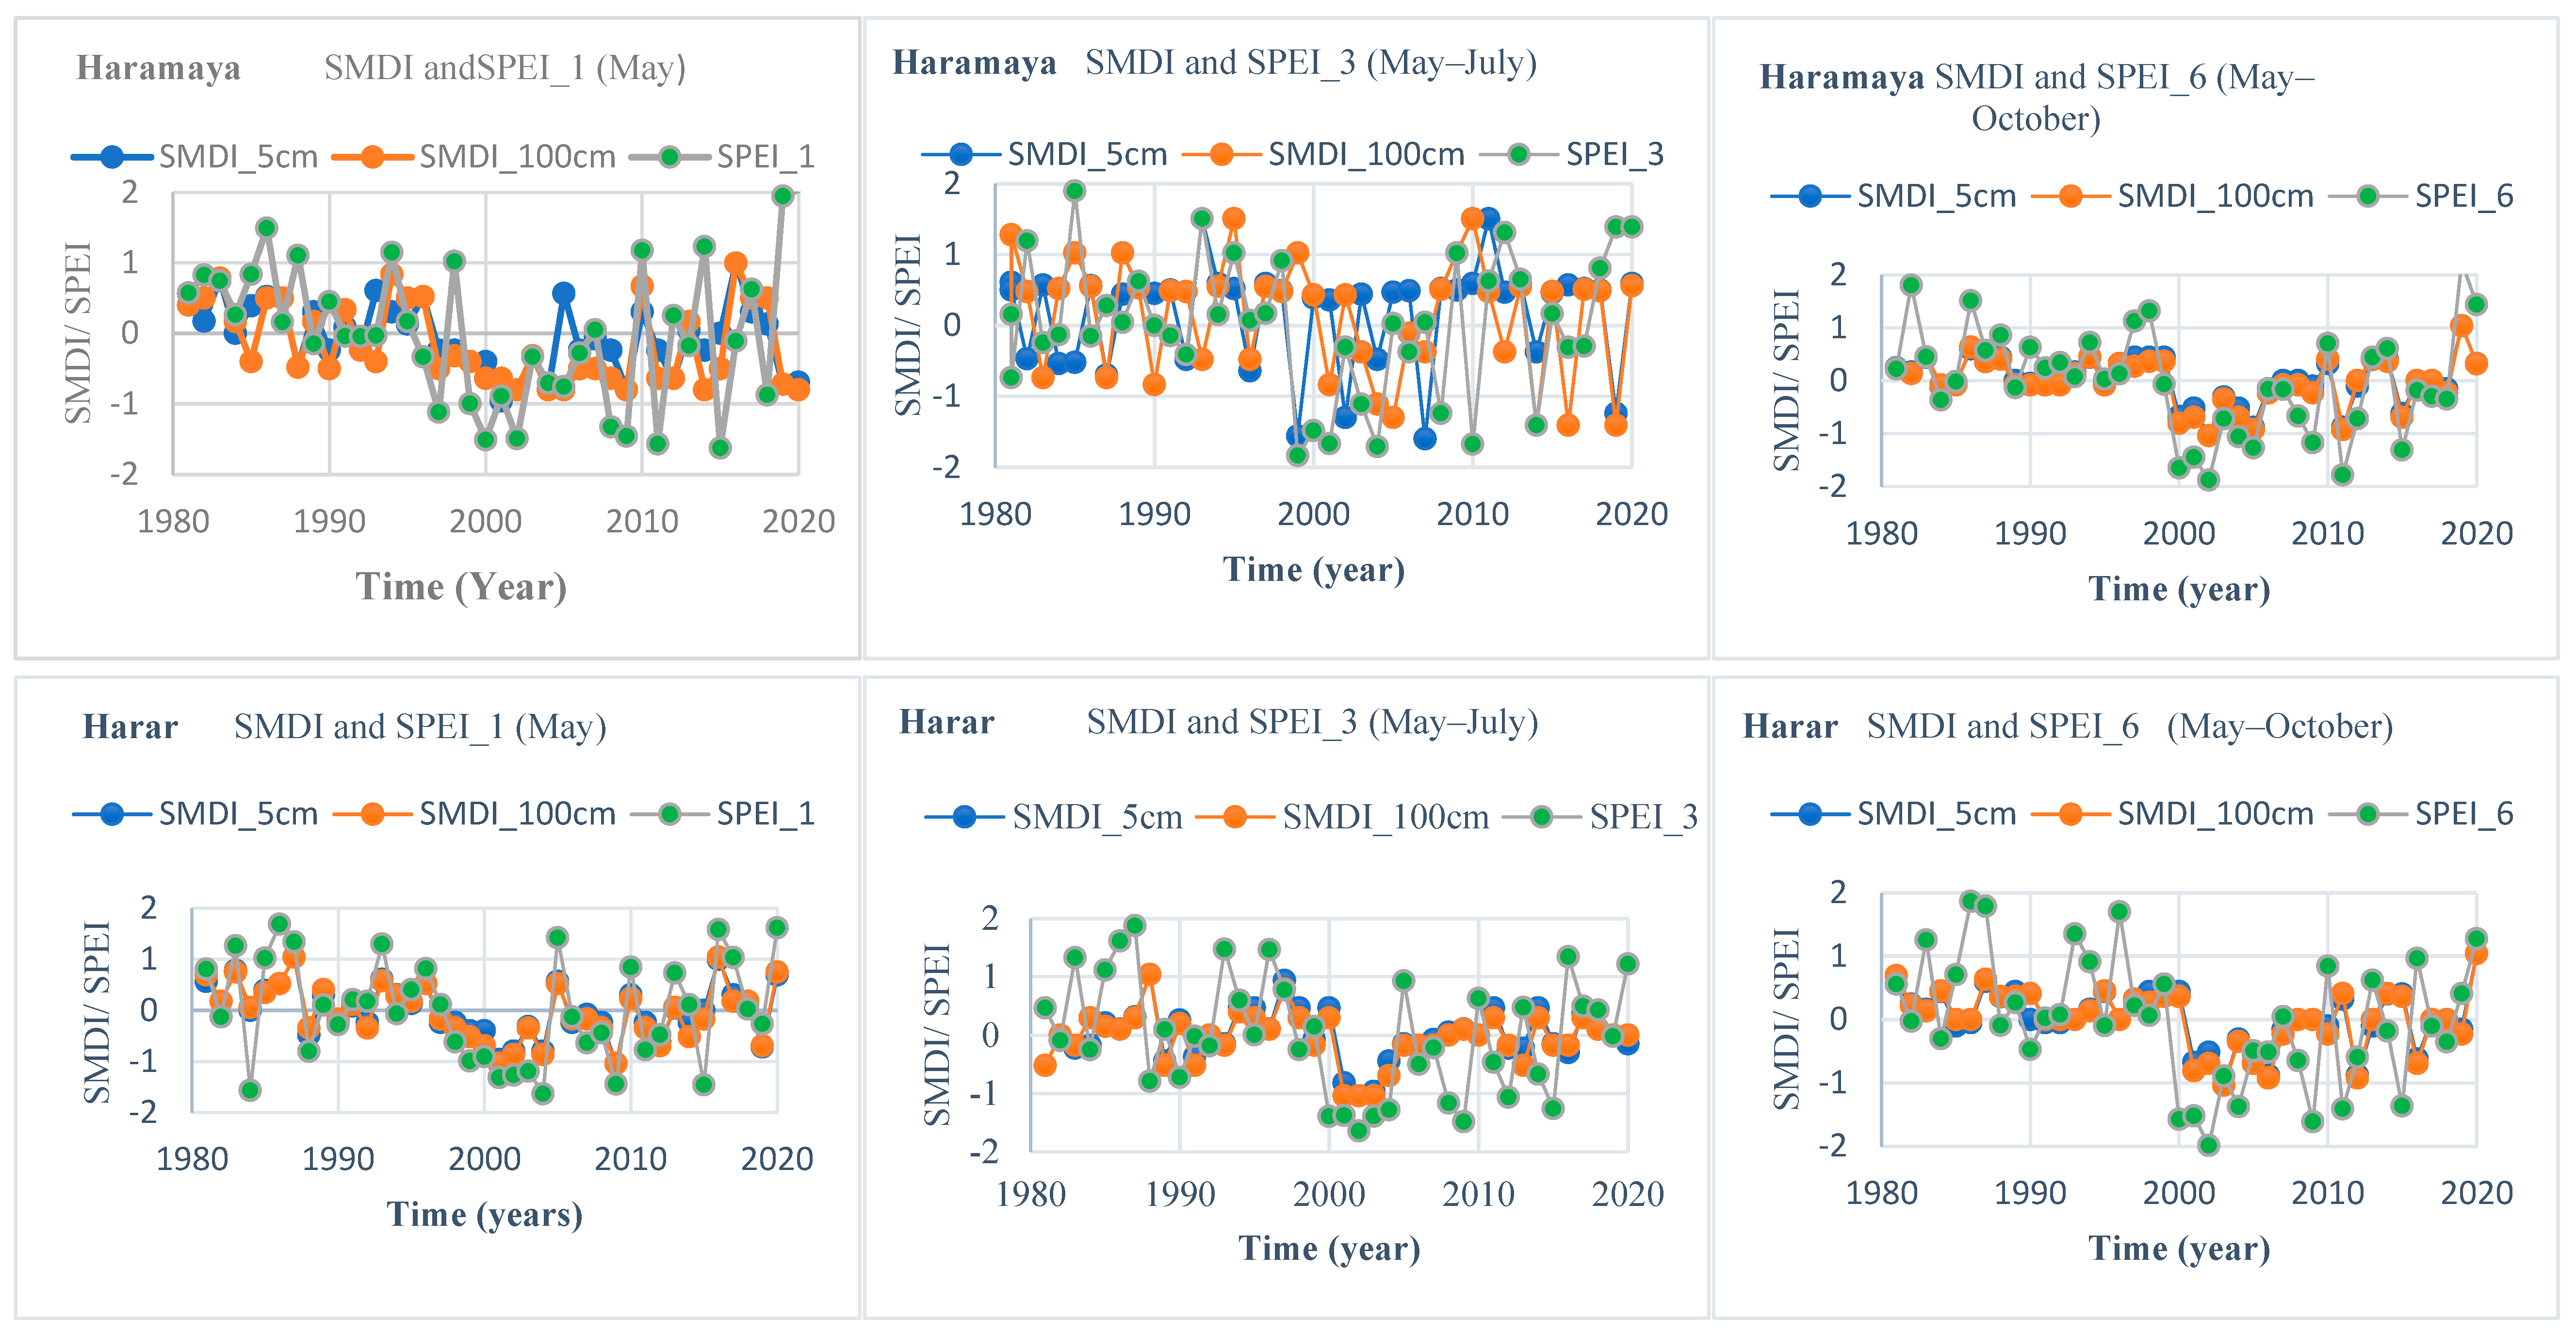
3.1. Variation of Drought under SPEI and SMDI

According to the analysis, there are seasonal variations in soil moisture deficit, potential evapotranspiration, and monthly precipitation for the years 1981 to 2020. These are a sign of different scales of drought occurring in the Erer Sub-basin.
Moreover, the results showed that the SPEI and SMDI have similar intra-year patterns of volatility. Figure 3 shows the temporal changes in SPEI, SMDI0-5, and SMDI5-100 over timescales of 1 to 6 months at all stations of the Erer Sub-basin during the spring crop growing season from 1981 to 2020. Compared to SMDI, SPEI fluctuated more consistently between 1981 and 2020, with a wetter stage between 1981 and 2000. However, as indicated by the SPEI result, all stations in the Sub-basin experienced a severe metrological drought in 2003. Moreover, the FGD results show that two-thirds of the participants confirm that metrological drought was severe in the Sub-basin, which was a cause of agricultural drought/moisture stress and a reduction in the crop yield by half. Thus, the results call for sustainable mitigation methods of drought risk reduction using NbS and other measures in the area.
Although a brief wetter phase was observed from 1990 to 2000, the SMDI0-5 indicates that a prolonged dry period persisted from 2010 to 2020. According to SMDI (0–5 and 5–100 cm), which shows typically continuous dry or wet conditions, the growth stage of spring crops altered equally at the 1- to 6-month timescales (Figure 3). SMDI5-100 cm generally did not exhibit the same rapid change as SMDI0-5 since there was a distinct short wetter phase in 1990–2009.
The drought levels determined by SPEI and SMDI (0–5 cm and 5–100 cm, respectively) did not always coincide, but SPEI fluctuated less over time than SMDI did. As shown in Figure 3, for instance, SPEI classified the year 2003 as a severe drought while SMDI considered it to be a normal year (both at a depth of 0–5 cm and 5–100 cm). In contrast, SPEI classified the years 1990 to 2009 as normal while SMDI considered them to be years of moderate drought (0–5 cm and 5–100 cm).
In accordance with traditional wisdom, distinct types of droughts originate from meteorological droughts, although there is a phase variation in time since they follow different development trajectories. It was determined that SPEI and SMDI0-5 were related on a 1- to 6-month timescale during the spring crop growth period (similar to SMDI0-5 versus SMDI5-100 with a different timescale and SPEI versus SMDI0-5 with a lagged time of some timescales) to analyze the relationship between agricultural drought and meteorological conditions. The results showed that surface soil moisture was quickly influenced by precipitation, temperature, and other factors, with SPEI being more closely correlated with SMDI0-5 than SMDI5-100 on each timeline.
The relationships between SPEI, SMD0-5, and SMDI5-100 in May to July (the “sowing-growth” phase of rain season, which is important for crops) indicate that the supply of soil moisture is reliant on precipitation and has some influence on the growth of crop. A stronger correlation exists between SPEI and surface soil moisture than between deep soil moisture, and both agricultural droughts as indicated by SMDI and meteorological droughts as represented by SPEI (Figure 3) demonstrate some hysteresis as precipitation increases.
The findings are comparable to several other findings (e.g., [11,12,25,36,68,69,70,71,72]). For example, in Ethiopia, large droughts occurred in 1983–1984 and 2002–2003, affecting more than 60% of the nation, according to a study [11] on climate variability and drought characterization for the period 1983–2012. The extreme drought years in our study were 1984 and 2002. According to [70], drought incidents occurred in Ethiopia’s central rift valley in the years 1984, 1994, 1995, 2001–2002, 2009, and 2014–2015. The north and northwest of Ethiopia had frequent and more severe drought circumstances around the years 1983–1984, according to research by [36] on the drought trend and periodicity in Ethiopia from 1979 to 2014. Using monthly rainfall records for the years 1984 to 2014, ref. [71] analyzed the patterns and trends of drought incidences in the northeast highlands and eastern area, which cover some of the Eerer sub-basin. The region endured spells of drought in 1984, 1987–1988, 1992–1993, 1999, 2003–2004, and 2007–2008, some of the worst drought years in Ethiopian history.
The results are also in line with records of Ethiopian drought experiences kept by EM DAT (the Global Disaster Database), which may be read at http://www.emdat.be/database (accessed on 1 December 2022).

3.2. The Relationship between SPEI and SMDI

Numerous drought types are related to notable regional variability and variations in temporal phases. Meteorological drought, which typically heralds the start of a drought episode, either causes or results in agricultural drought. Agricultural drought is thought to come after meteorological drought and was more severe, according to [36,73]. The relationship between soil moisture and the meteorological drought indicators (PDSI and SPI) was described in both [11,12]. Compared to SPEI, SMDI takes more factors into account, including evapotranspiration, soil characteristics, and root depth. One study [73] examined the drought starting dates and discovered that the agricultural drought index SMDI had a later onset than SPEI and that SPEI-3 had a higher relate with it. The Erer Sub-basin showed comparable results. One study [74] pointed out that when decreasing precipitation is almost the only source, increased evapotranspiration would swiftly evaporate soil moisture in dry locations. As a result, only shallow soil is considered in the correlations between soil moisture and meteorological drought indicators since shallow soil is more vulnerable to the impacts of precipitation deficit than deeper soil.
According to the present study, as depicted in Table 3, the SPEI generally has a similarity with SMDI0–5, which lagged SMDI0–5 by one or two months from a three-month timescale. The rainfall at all five stations considered in this study (Table 3) was concentrated on a three-month timescale but less so on a one-month timescale, which may not have been enough to supplement soil moisture and, as a result, insufficient groundwater recharge and pond storage. However, the patterns in the first month of the onset session were not significant. Because spatial-temporal variability is more influential than other drought indices for a given soil, climate, and geographic setting, it is crucial to examine how these variables interact. Table 3 displays the meteorological variables’ associations with the SPEI and SMDI that were statistically significant.

3.3. Nature-Based Solutions and Stakeholder Perspectives

The combination of ecosystem restoration and management, which designates land for sustainable harvesting along with land for natural habitat restoration and conservation to achieve a variety of goals, including biodiversity conservation, supporting livelihoods, and providing regulating ecosystem services, was the most prevalent natural-based drought management intervention in the study area. The most common form of nature-based intervention utilized to control the drought in the area was the creation or maintenance of natural ecosystems (e.g., tree plantations or planting exotic fast-growing fodder and grasses). The other most popular drought management strategy included restoration interventions, which mainly involved revegetating degraded land and restoring grasslands in arid regions by planting trees. The most typical drought management strategy in the study area was landscape-scale interventions. Even though the literature search covered a wide range of topics about NbS, including related ideas and drought risk reduction, there was no research on stakeholder opinion on NbS approaches to drought risk-reduction. In order to better understand natural hazards, risks, susceptibility, and stakeholder readiness to respond to droughts, it is important to explore stakeholder perspectives and comparable ideas on drought risk reduction. Regarding reducing the risk of a drought, little is said about how to lessen exposure to natural hazards or risks. The literature on drought risk reduction, according to [75,76], frequently focuses on the perception of hazards rather than the perception of drought risk preventive measures, which have significant theoretical and policy implications.
Moreover, various publications [43] discuss which community values address the co-benefits of NbS and related ideas. The authors of [77] conducted a comprehensive literature review on NbS with a focus on agricultural regions and the development of grey infrastructure (GI), green legacies, and related concepts. The review revealed several developments achieved to date. These options have already demonstrated their essential role in delivering drought risk reduction strategies that are adaptable, cost-effective, multipurpose, and sustainable. To encourage their upscaling and replication so that they become commonplace solutions, further studies and practical demonstrations are still needed in a number of domains. For instance, ref. [76] examined the NbS and GI stakeholders’ perceptions in the European countries of France and Italy, which were almost exclusively located in urban and pri-urban regions. In rural areas, they found that there was limited awareness of water-related NbS and little interest in or reaction to these ideas. Moreover, ref. [78] findings suggest that the co-benefits of NBS are large and well-liked by a range of stakeholder groups. Similar to this, one study [79] only examined co-benefits associated with recreational and aesthetic aspects; other advantages, such as ecological services, agriculture, health, wellness, cultural values, and economic development, were not investigated. The authors of [80] also state that, there was no overarching pattern in the increasing and decreasing patterns of the precipitation indices in eastern Africa. The finding allows for considerably more precise geographic planning of adaptation and mitigation strategies, including the identification of hotspot regions.
In addition, the finding of [81] provide useful information for enhancing the local early warning and drought monitoring systems. Again, the study aids in the development of impact-based drought mitigation strategies to protect the local populace’s lives as well as their livestock assets in order to raise local output and productivity.
Interestingly, in the present study, our FGD participants put greater emphasis on the contribution of community perspectives to ecosystem services, environmental protection, economic prospects, food security, and, notably, to decreasing natural disasters and droughts. There are alternative avenues for learning about more natural solutions that are equally significant sources of information. One good option is training at universities or similar institutions, which are helpful for constructing a foundational understanding of reducing disaster risk, especially drought. Instead of conceiving themselves as ‘experts of the soil’ in their routine work, the FGD participants/farmers believe that they should seek NbS information from the local agricultural bureau, Farmers’ Union, and agricultural advisors. This means that they have a poor understanding of the risks related to muddy droughts. This finding coincides with the findings of [79].

Findings from the Stakeholders’ Interview

The FGDs with all stakeholder groups from all levels were accepted by a total of thirty people, most of whom were observers rather than active participants or founders. In agricultural regions, the notion of NbS has attracted a lot of interest from research and national policymakers, but in rural areas, this knowledge and attention is less known. In this study, the researchers were the source for around one-third of the FGD participants’ initial exposure to NbS concepts and related terminologies. The NbS issues also incorporated concepts about landscape management, surface and groundwater restoration techniques, and agricultural practices. Another FGD participant also came across the NbS concepts in a rural setting. In general, the Erer Sub-basin’s key sources of information on NbS should include Haramaya University, the National Research Center, and international and local NGOs. The majority of stakeholders seek new ideas on creative ways to address the danger of drought as well as on using research as a springboard to reduce risks in their Sub-basin. All stakeholder groups must find solutions that are appealing and appropriate from an economic standpoint, such as creative and new business models for farmers and landowners.
In the Sub-basin, a more severe agricultural drought, which affects both crop and livestock products, is being driven by meteorological drought. Additionally, the findings are in line with EM DAT’s (The International Disaster Database) records of Ethiopian drought experiences, which are accessible at http://www.emdat.be/database (accessed on 10 December 2022). The stakeholders confirmed this during the interviews, and suggested possible nature-based solutions such as a grey structure (conserving mountainous areas in support of professionals), a green approach (implementing and sustaining the ongoing green legacy initiated by the Ethiopian government), and a blue approach (sustaining indigenous knowledge called “sand storage dam”, which is used as a water supply system during dry periods, practicing rainwater harvesting during the rainy season and then use it as supply during drought/moisture stress periods). In 2022 alone, more than 500 million seedlings were plants that have premium values in local and international markets such as avocadoes, mangoes, apples, and papayas; of this, 1.5% was undertaken in the study area. This directly feeds into the current drive of becoming food self-sufficient by promoting sustainable agriculture as envisaged in Sustainable Development Goal 2 and 13. Directly linked to Goal 13 of the SDGs, this initiative complements Ethiopia’s efforts to reduce its vulnerability. In addition, it promotes sustainable forest management, forest conservation, reforestation, and restoration of damaged land and soil. The initiative’s ability to tackle numerous goals is its most creative feature overall. Ending desertification, managing the danger of drought, and restoring overused and degraded natural resources like surface soil and water are all huge advantages of this. Ethiopia’s efforts to meet the Sustainable Development Goals by 2030 will be greatly aided by the magnitude of the interlinkages. Hence, the effectiveness of the NbS in the catchment has already started and we found that it is important to strengthen the awareness of NbS in such a way that the community reduces the drought risks in the catchment.
From the FGD, we found that local stakeholders are willing to deal with drought risks if there is proof that a sizable portion of the population will gain from their ecosystem improvement efforts. For instance, 10% of individuals surveyed openly chose traditional grey solutions because they were well-known and dependable, according to [79]. This highlighted the value of demonstration pilots and capacity building, according to the authors. Stakeholders should not have any issues with the solutions’ coordination or tenure and should be able to finance them, according to [79]. In addition, agricultural issues that impact drought/moisture stress reduction techniques are highlighted by [78]. One third of the stakeholders in this study indicated that they had not heard of NbS before the start of the FGDs; however, the implemented NbS in the area significantly lessen the effects of meteorological and agricultural drought. A study conducted in drought-prone areas by [82] found that 24% of respondents cited construction and maintenance costs as obstacles to mainstreaming grey structures. Furthermore, ref. [79] noted that stakeholders expressed a need for quantitative assessments of the effectiveness of the selected measures in reducing drought risk and the projected consequences, especially with regard to the costs and benefits of the selected actions. Table 4 compares the advantages of NbS and stakeholders’ viewpoints with other findings from the literature.
With the exception of a few isolated farming communities, explanation models have failed to explain why stakeholders do not transfer their views into action, despite several attempts to do so [86]. The FGD results also revealed a lower level of community involvement in their Sub-basin’s drought management utilizing natural remedies. This demonstrates that assessing risks and being aware of them may not always result in preventive action and may occasionally even result in conflicting attitudes. Despite the fact that NbS is commonly understood, there are frequently not enough incentives to take action or people opt for dubious practical solutions. A solution being implemented jointly by many stakeholders and the value of discourse are examples of variables that can spur action. Assessment frameworks can set the groundwork for business models linked to the installation, management, and monitoring of NbS or new opportunities that come from such measures by describing the value that results for the various stakeholders. It is essential to stay in touch with the stakeholders throughout the Living Lab procedures and see how their perceptions of NbS alter given the high expectations that the stakeholders held throughout the FGDs.

4. Conclusions and Recommendations

The present study analyzed and diagnosed drought vulnerability and its management through nature-based solutions in the Erer Sub-basin of Ethiopia. Ethiopia has experienced droughts for years and for the past two decades the country has suffered a series of persistent severe drought occurrences that have had a detrimental effect on both the natural ecosystem and the populations who depend on it. According to research, ecosystems can protect people from the effects of climate change. We address a gap in the literature on adaptation to climate change and impacts attribution by giving qualitative evidence that NbS can be a significant adaptation strategy that can help drought impact reduction in a changing environment. To effectively influence NbS policy and practice, scientists currently lack the empirical evidence and experience needed. So, the goal of this study was to analyze and identify drought vulnerability and its management through NbS.
The temporal fluctuations in SMDI (agricultural drought) and SPEI (meteorological drought) at different timescales (1, 3, and 6 months) were investigated in order to assess drought for the five selected locations in the Erer Sub-basin throughout the growth seasons of key crops between 1981 and 2020. Quantitative research was done utilizing a Living Labs approach to classify and rate NbS’s effectiveness in lowering the danger of drought. Overall, the study found that the frequency, length, and severity of droughts have been on the rise. According to the results of the drought analysis, SPEI’s versions were less trustworthy than SMDI0–5 and SMDI5–100. Between May and July, SPEI demonstrated better associations with SMDI0–5 at one- and two-month delays. SPEI and SMDI5–100 performed better in terms of capturing actual drought occurrences than SMDI0–5.
Applying the Living Labs approach, which encourages participation from all parties by convening on an equal footing, helped us the researchers to foster a climate of trust and understanding that will assist the development and implementation of NbS solutions. Farmers, in particular, and landowners who provided the data regarding the NbS solutions, frequently initially viewed NbS as a hindrance to their economic potential for generating income from their fertile land. Therefore, it was essential to provide this group with concrete instances to show how NbS might present a compelling opportunity from an economic perspective. Thus, the researchers understood that the co-benefits of NbS must be quantified and evaluated using reliable methodologies, tools, and indicators in a way that is both transparent and broadly recognized. Gaining acceptance of NbS over traditional grey solutions, mainstreaming it, fostering learning and trust-building, and establishing a firm cooperation process were found to be essential methodological factors.
During the FGDs, the stakeholders suggested NbS such as habitat restoration, physical soil and water conservation structure restoration, reforestation, rehabilitation of blue structures, reconstruction of gray infrastructure, land enclosures, private land conservation measures, reserves, conservancies, and locally managed areas with specific set-aside. They also repeatedly stressed the need for rehabilitating the degraded land with exotic species, the practice of rainwater harvesting during the rainy seasons so that it can be used during drought/moisture stress periods. The findings suggest that a new, comprehensive approach to reducing the risk of drought is urgently needed with the arid Sub-basin especially focusing on climatic extenuation measures and management through NbS. Given that increased drought risk is anticipated as a result of environmental and climate change impacts, the necessity for such a medium- to large-scale NbS strategy and its execution may even be more critical for future drought mitigation in the catchment areas.
NbS are crucial in our case study for minimizing the effects of the drought. We predict that the danger of drought will increase in the future as a result of increased human influence on the climate, thus further research should be done to determine how the use of NbS in mitigating other extreme climate events will change over the course of Ethiopia’s history as it becomes drier. As well as taking into account the diverse NbS kinds and settings across the country, more research is required to determine when and under what circumstances human influence on the climate will ultimately outweigh the promise of NbS for lessening the impact of drought. NbS must also be completely incorporated into a larger range of climate adaptation options.

Author Contributions

Conceptualization, D.W.S.; Methodology, D.W.S., A.K.K., N.T., B.G., S.A. and J.Y.H.; Software, D.W.S., A.K.K. and N.T.; Validation, D.W.S., N.T. and B.G.; Formal analysis, D.W.S., A.K.K., N.T., B.G. and S.A.; Investigation, D.W.S., N.T. and B.G.; Resources, D.W.S. and J.Y.H.; Data curation, D.W.S.; Writing—original draft, N.T. and B.G.; Writing—review & editing, D.W.S., S.A. and J.Y.H.; Supervision, D.W.S., A.K.K. and J.Y.H.; Project administration, D.W.S.; Funding acquisition, D.W.S. and S.A. All authors have read and agreed to the published version of the manuscript.

Funding

This research was funded by Norwegian Agency for Development Cooperation (NORAD) through the Environmental Risk Management Under Increasing Extremes and Uncertainty (MERIT) project of Haramaya University with grant number 974 767 880.

Institutional Review Board Statement

Not applicable for this study.

Informed Consent Statement

Consent and respects for FGD participants were the main ethical considerations in this research study. In terms of ethics, the study’s precision, accuracy, and applicability were preserved by the researchers’ adherence to the essential ethical norms, which are indestructible. First, the FGD participants were openly told what the research’s goal was, the nature of the study was made clear to them, and no effort was made to compel the volunteers to guarantee permission. There were no tricks or phony performances present. The FGD participants’ dignity and sense of self-respect were not in any way threatened by the researchers. Instead, the researchers made every effort to improve the individuals ‘autonomy and independence from any kind of mental or physical pressure. Additionally, the researchers supported FGD participant privacy and ensured that each study method fairly distributes the advantages to all research FGD participants. Additionally, the researchers followed logical steps at each level of data congregation. Second, all study FGD participants provided written informed consent after the researchers received approval from the relevant local authorities. This ensured that an FGD participant information was kept private during the whole trial. Generally speaking, respect and moral considerations were offered to the research FGD participants.

Data Availability Statement

Crop root distribution data is available through Girma and Tasisa [50]. Soil moisture data can be freely downloaded from https://ldas.gsfc.nasa.gov/gldas (accessed on 21 December 2022).

Acknowledgments

We are grateful to the Norwegian Agency for Development Cooperation (NORAD) for the financial support through the Environmental Risk Management Under Increasing Extremes and Uncertainty (MERIT) project through Haramaya University. We thank Haramaya University for the logistic support. We are also indebted to all MERIT project team members who collaborated with us during project development.

Conflicts of Interest

The authors state that none of their known financial or personal conflict appeared to have a bearing on the research provided in this paper.

References

  1. Hamal, K.; Sharma, S.; Khadka, N.; Haile, G.G.; Joshi, B.B.; Xu, T.; Dawadi, B. Assessment of drought impacts on crop yields across Nepal during 1987–2017. Meteorol. Appl. 2020, 27, e1950. [Google Scholar] [CrossRef]
  2. Pais, I.P.; Reboredo, F.H.; Ramalho, J.C.; Pessoa, M.F.; Lidon, F.C.; Silva, M.M. Potential impacts of climate change on agriculture—A review. Emir. J. Food Agric. 2020, 32, 397–407. [Google Scholar] [CrossRef]
  3. Bowling, L.C.; Cherkauer, K.A.; Lee, C.I.; Beckerman, J.L.; Brouder, S.; Buzan, J.R.; Doering, O.C.; Dukes, J.S.; Ebner, P.D.; Frankenberger, J.R.; et al. Agricultural impacts of climate change in Indiana and potential adaptations. Clim. Chang. 2020, 163, 2005–2027. [Google Scholar] [CrossRef]
  4. Montiel-González, C.; Montiel, C.; Ortega, A.; Pacheco, A.; Bautista, F. Development and validation of climatic hazard indicators for roselle (Hibiscus sabdariffa L.) crop in dryland agriculture. Ecol. Indic. 2021, 121, 107140. [Google Scholar] [CrossRef]
  5. Zarei, A.R.; Moghimi, M.M. Modified version for SPEI to evaluate and modeling the agricultural drought severity. Int. J. Biometeorol. 2019, 63, 911–925. [Google Scholar] [CrossRef] [PubMed]
  6. Aghili, F.; Gamper, H.A.; Eikenberg, J.; Khoshgoftarmanesh, A.H.; Afyuni, M.; Schulin, R.; Jansa, J.; Frossard, E. Green Manure Addition to Soil Increases Grain Zinc Concentration in Bread Wheat. PLoS ONE 2014, 9, e101487. [Google Scholar] [CrossRef]
  7. Camaille, M.; Fabre, N.; Clément, C.; Barka, E.A. Advances in Wheat Physiology in Response to Drought and the Role of Plant Growth Promoting Rhizobacteria to Trigger Drought Tolerance. Microorganisms 2021, 9, 687. [Google Scholar] [CrossRef]
  8. Daryanto, S.; Wang, L.; Jacin, P.A. Global Synthesis of Drought Effects on Maize and Wheat Production. PLoS ONE 2016, 11, e0156362. [Google Scholar] [CrossRef] [Green Version]
  9. Madadgar, S.; AghaKouchak, A.; Farahmand, A.; Davis, S.J. Probabilistic estimates of drought impacts on agricultural production. Geophys. Res. Lett. 2017, 44, 7799–7807. [Google Scholar] [CrossRef]
  10. Araneda-Cabrera, R.J.; Bermúdez, M.; Puertas, J. Assessment of the performance of drought indices for explaining crop yield variability at the national scale: Methodological framework and application to Mozambique. Agric. Water Manag. 2020, 246, 106692. [Google Scholar] [CrossRef]
  11. Araya, A.; Stroosnijder, L. Assessing drought risk and irrigation need in northern Ethiopia. Agric. For. Meteorol. 2011, 151, 425–436. [Google Scholar] [CrossRef]
  12. Belayneh, A.; Adamowski, J. Drought forecasting using new machine learning methods. J. Water Land Dev. 2013, 18, 3–12. [Google Scholar] [CrossRef] [Green Version]
  13. Haile, G.G.; Tang, Q.; Sun, S.; Huang, Z.; Zhang, X.; Liu, X. Droughts in East Africa: Causes, impacts and resilience. Earth-Science Rev. 2019, 193, 146–161. [Google Scholar] [CrossRef]
  14. Łabędzki, L.; Bąk, B. Meteorological and agricultural drought indices used in drought monitoring in Poland: A review. Meteorol. Hydrol. Water Manag. 2014, 2, 3–14. [Google Scholar] [CrossRef] [Green Version]
  15. Keshavarz, M.R.; Vazifedoust, M.; Alizadeh, A. Drought monitoring using a Soil Wetness Deficit Index (SWDI) derived from MODIS satellite data. Agric. Water Manag. 2014, 132, 37–45. [Google Scholar] [CrossRef]
  16. Anderson, M.C.; Hain, C.; Wardlow, B.; Pimstein, A.; Mecikalski, J.R.; Kustas, W.P. Evaluation of Drought Indices Based on Thermal Remote Sensing of Evapotranspiration over the Continental United States. J. Clim. 2011, 24, 2025–2044. [Google Scholar] [CrossRef]
  17. Wang, A.; Lettenmaier, D.P.; Sheffield, J. Soil Moisture Drought in China, 1950–2006. J. Clim. 2011, 24, 3257–3271. [Google Scholar] [CrossRef]
  18. Dai, A. Drought under global warming: A review. Wiley Interdiscip. Rev. Clim. Chang. 2011, 2, 45–65. [Google Scholar] [CrossRef] [Green Version]
  19. Palmer, W.C. Keeping Track of Crop Moisture Conditions, Nationwide: The New Crop Moisture Index. Weatherwise 1968, 21, 156–161. [Google Scholar] [CrossRef]
  20. Pauwels, V.R.N.; Wood, E.F. The Importance of Classification Differences and Spatial Resolution of Land Cover Data in the Uncertainty in Model Results over Boreal Ecosystems. J. Hydrometeorol. 2000, 1, 255–266. [Google Scholar] [CrossRef]
  21. Dutra, E.; Viterbo, P.; Miranda, P.M.A. ERA-40 reanalysis hydrological applications in the characterization of regional drought. Geophys. Res. Lett. 2008, 35, 116–122. [Google Scholar] [CrossRef]
  22. Sheffield, J.; Andreadis, K.M.; Wood, E.F.; Lettenmaier, D.P. Global and Continental Drought in the Second Half of the Twentieth Century: Severity–Area–Duration Analysis and Temporal Variability of Large-Scale Events. J. Clim. 2009, 22, 1962–1981. [Google Scholar] [CrossRef]
  23. Köksal, E.S. Irrigation water management with water deficit index calculated based on oblique viewed surface temperature. Irrig. Sci. 2008, 27, 41–56. [Google Scholar] [CrossRef]
  24. Chen, X.; Li, Y.; Yao, N.; Liu, D.L.; Javed, T.; Liu, C.; Liu, F. Impacts of multi-timescale SPEI and SMDI variations on winter wheat yields. Agric. Syst. 2020, 185, 102955. [Google Scholar] [CrossRef]
  25. Mehari, G.; Asfaw, K.; Kibrom, A.; Girma, B. Analyzing Drought Conditions, Interventions and Mapping of Vulnerable Areas Using NDVI and SPI Indices in Eastern Ethiopia, Somali Region. Ethiop. J. Environ. Stud. Manag. 2017, 10, 1137–1150. [Google Scholar]
  26. Smith, D.M.; Matthews, J.H.; Bharati, L.; Borgomeo, E.; McCartney, M.P.; Mauroner, A.; Anisha, N. Adaptation’s Thirst: Accelerating the Convergence of Water and Climate Action; Background Paper Prepared for the 2019 Report of the Global Commission on Adaptation; IWMI: Manila, Philippines, 2019. [Google Scholar]
  27. Klüver, H.; Mahoney, C.; Opper, M. Framing in context: How interest groups employ framing to lobby the European Commission. J. Eur. Public Policy 2015, 22, 481–498. [Google Scholar] [CrossRef]
  28. Cohen-Shacham, E.; Walters, G.; Janzen, C.; Maginnis, S. (Eds.) Nature-Based Solutions to Address Global Societal Challenges; IUCN: Gland, Switzerland, 2016; p. xiii+97. [Google Scholar] [CrossRef] [Green Version]
  29. Carsten, N.; Timo, A.; Katherine, N.I.; Graciela, M.R.; Kerry, A.W.; Ben, D.; Dagmar, H.; Lawrence, J.-W.; Hans, K.; Eszter, K.; et al. The science, policy and practice of nature-based solutions: An interdisciplinary perspective. Sci. Total Environ. 2017, 579, 1215–1227. [Google Scholar] [CrossRef]
  30. Somarakis, G.; Stagakis, S.; Chrysoulakis, N. (Eds.) Thinknature Nature-Based Solutions Handbook; Think Nature Project funded by the EU Horizon 2020 Research and Innovation Programme; European Union: Brussels, Belgium, 2019. [Google Scholar]
  31. Eggermont, H.; Balian, E.; Azevedo, J.M.N.; Beumer, V.; Brodin, T.; Claudet, J.; Fady, B.; Grube, M.; Keune, H.; Lamarque, P.; et al. Nature-based solutions: New influence for environmental management and research in Europe. GAIA-Ecol. Perspect. Sci. Soc. 2015, 24, 243–248. [Google Scholar] [CrossRef]
  32. Maes, J.; Jacobs, S. Nature-based solutions for Europe’s sustainable development. Conserv. Lett. 2017, 10, 121–124. [Google Scholar] [CrossRef] [Green Version]
  33. Shi, W.; Cao, J.; Zhang, Q.; Li, Y.; Xu, L. Edge Computing: Vision and Challenges. IEEE Internet Things J. 2016, 3, 637–646. [Google Scholar] [CrossRef]
  34. Debortoli, D.; Nunes, R.; Yared, P. Optimal Time-Consistent Government Debt Maturity. Q. J. Econ. 2017, 132, 55–102. [Google Scholar] [CrossRef] [Green Version]
  35. Feroz, R.A.; Rouf, A.M.; Uddin, K. Groundwater situations and IWRM to overcome climate change induced challenges in a drought prone area of Bangladesh. J. Environ. Agric. Sci. 2015, 2, 14. [Google Scholar]
  36. Zeleke, T.T.; Giorgi, F.; Diro, G.T.; Zaitchik, B.F. Trend and periodicity of drought over Ethiopia. Int. J. Climatol. 2017, 37, 4733–4748. [Google Scholar] [CrossRef]
  37. Ministry of Agriculture and Livestock Resources. DRSLP-II: Feasibility Study, Design, and Preparation of Contract Documents for Various Multipurpose Community Water Distribution Systems in SNNP Region, Volume-V Environmental and Social Impact Assessment Study (Annual Report). 2021. Available online: https://www.afdb.org/sites/default/files/final.revised.esia_main_report-regional_water_distribution_system_in_snnp_region.pdf (accessed on 12 January 2023).
  38. Rasul, G.; Thapa, G.B. Sustainability of ecological and conventional agricultural systems in Bangladesh: An assessment based on environmental, economic and social perspectives. Agric. Syst. 2004, 79, 327–351. [Google Scholar] [CrossRef]
  39. Shiferaw, B.; Tesfaye, K.; Kassie, M.; Abate, T.; Prasanna, B.; Menkir, A. Managing vulnerability to drought and enhancing livelihood resilience in sub-Saharan Africa: Technological, institutional and policy options. Weather. Clim. Extrem. 2014, 3, 67–79. [Google Scholar] [CrossRef] [Green Version]
  40. Alemu, T.; Mengistu, A. Impacts of Climate Change on Food Security in Ethiopia: Adaptation and Mitigation Options: A Review. In Climate Change-Resilient Agriculture and Agroforestry: Ecosystem Services and Sustainability; Springer: Berlin/Heidelberg, Germany, 2019; pp. 397–412. [Google Scholar] [CrossRef]
  41. Tazeze, A.; Haji, J.; Ketema, M. Climate Change Adaptation Strategies of Smallholder Farmers: The Case of Babilie District, East Harerghe Zone of Oromia Regional State of Ethiopia. J. Econ. Sustain. Dev. 2012, 3, 1–12. [Google Scholar]
  42. Tessema, Y.A.; Aweke, C.S.; Endris, G.S. Understanding the process of adaptation to climate change by small-holder farmers: The case of east Hararghe Zone, Ethiopia. Agric. Food Econ. 2013, 1, 13. [Google Scholar] [CrossRef] [Green Version]
  43. Ferreira, V.; Barreira, A.P.; Loures, L.; Antunes, D.; Panagopoulos, T. Stakeholders’ Engagement on Nature-Based Solutions: A Systematic Literature Review. Sustainability 2020, 12, 640. [Google Scholar] [CrossRef] [Green Version]
  44. Gebre, A.B. Potential effects of agroforestry practices on climate change mitigation and adaptation strategies: A review. J. Nat. Sci. Res. 2016, 6, 83–89. [Google Scholar]
  45. National Meteorological Agency (NMA). Mean Monthly Rainfall Data; NMA: Addis Ababa, Ethiopia, 2015. [Google Scholar]
  46. Ministry of Agriculture (MOA). Agroecological Zones of Ethiopia; MOA: Addis Ababa, Ethiopia, 2000. [Google Scholar]
  47. Subramanya, D.K. Engineering Hydrology. In The McGraw-Hilll, 3rd ed.; Tata McGraw Hill Publishing Co., Ltd.: New Delhi, India, 2016. [Google Scholar]
  48. Kang, H.M.; Fadhilah, Y. Homogeneity Tests on Daily Rainfall Series in Peninsular Malaysia. Int. J. Contemp. Math. Math. Sci. 2012, 7, 9–22. [Google Scholar]
  49. Dai, Y.; Shangguan, W.; Duan, Q.; Liu, B.; Fu, S.; Niu, G. Development of a China Dataset of Soil Hydraulic Parameters Using Pedotransfer Functions for Land Surface Modeling. J. Hydrometeorol. 2013, 14, 869–887. [Google Scholar] [CrossRef] [Green Version]
  50. Girma, M.; Tasisa, T. Irrigation Water Potential and Land Suitability Assessment in Kurfa Chele-Girawa Watershed, Wabe Shebelle River Basin, Ethiopia. Turk. J. Agric. Food Sci. Technol. 2020, 8, 139–146. [Google Scholar] [CrossRef] [Green Version]
  51. Testa, G.; Gresta, F.; Cosentino, S.L. Dry matter and qualitative characteristics of alfalfa as affected by harvest times and soil water content. Eur. J. Agron. 2011, 34, 144–152. [Google Scholar] [CrossRef]
  52. Vicente-Serrano, S.M.; Beguería, S.; López-Moreno, J.I. A Multiscalar Drought Index Sensitive to Global Warming: The Standardized Precipitation Evapotranspiration Index. J. Clim. 2010, 23, 1696–1718. [Google Scholar] [CrossRef] [Green Version]
  53. Palmer, W.C. Meteorological Drought; US Department of Commerce Weather Bureau Research Paper: Washington, DC, USA, 1965; 59p.
  54. Hou, M.; Yao, N.; Li, Y.; Liu, F.; Biswas, A.; Pulatov, A.; Hassan, I. Better Drought Index between SPEI and SMDI and the Key Parameters in Denoting Drought Impacts on Spring Wheat Yields in Qinghai, China. Agronomy 2022, 12, 1552. [Google Scholar] [CrossRef]
  55. Zhang, Q.; Qi, T.; Singh, V.P.; Chen, Y.D.; Xiao, M. Regional Frequency Analysis of Droughts in China: A Multivariate Perspective. Water Resour. Manag. 2015, 29, 1767–1787. [Google Scholar] [CrossRef]
  56. Xu, K.; Yang, D.; Yang, H.; Li, Z.; Qin, Y.; Shen, Y. Spatio-temporal variation of drought in China during 1961–2012: A climatic perspective. J. Hydrol. 2015, 526, 253–264. [Google Scholar] [CrossRef]
  57. Zhou, Y.; Li, N.; Ji, Z.; Gu, X.; Fan, B. Temporal and Spatial Patterns of Droughts Based on Standard Precipitation Index (SPI) in Inner Mongolia during 1981–2010. J. Nat. Resour. 2013, 28, 1694–1706. [Google Scholar]
  58. Haile, G.G.; Tang, Q.; Leng, G.; Jia, G.; Wang, J.; Cai, D.; Sun, S.; Baniya, B.; Zhang, Q. Long-term spatiotemporal variation of drought patterns over the Greater Horn of Africa. Sci. Total Environ. 2020, 704, 135299. [Google Scholar] [CrossRef]
  59. Spinoni, J.; Naumann, G.; Carrao, H.; Barbosa, P.; Vogt, J. World drought frequency, duration, and severity for 1951–2010. Int. J. Clim. 2014, 34, 2792–2804. [Google Scholar] [CrossRef] [Green Version]
  60. Marshall, C.; Rossman, G.B. Designing Qualitative Research; SAGE: Thousand Oaks, CA, USA, 1998; p. 321. [Google Scholar]
  61. Zingraff-Hamed, A.; Hüesker, F.; Lupp, G.; Begg, C.; Huang, J.; Oen, A. Stakeholder Mapping to Co-Create Nature-Based Solutions: Who Is on Board? Sustainability 2020, 12, 8625. [Google Scholar] [CrossRef]
  62. Strauss, A.; Corbin, J. Basics of Qualitative Research, Grounded Theory Procedures, and Techniques, 336; SAGE: New Bury Park, CA, USA; London, UK; New Delhi, India, 1990. [Google Scholar]
  63. Reed, M.S.; Graves, A.; Dandy, N.; Posthumus, H.; Hubacek, K.; Morris, J.; Prell, C.; Quinn, C.H.; Stringer, L.C. Who’s in and why? A typology of stakeholder analysis methods for natural resource management. J. Environ. Manag. 2009, 90, 1933–1949. [Google Scholar] [CrossRef] [PubMed]
  64. Murray-Webster, R.; Simon, P. Making Sense of Stakeholder Mapping. In PM World Today Tips and Techniques; Connecting the World of Project Management; PM World Today: Addison, TX, USA, 2006; Volume VIII. [Google Scholar]
  65. Hunziker, M. Einstellung der Bevölkerung zu Möglichen Land Schaftsentwicklungen in den Alpen; Eidgenössische Forschungsanstalt WSL: Birmensdorf, Switzerland, 2000; p. 157. [Google Scholar]
  66. Mayring, P.; Brunner, E. Qualitative Inhaltsanalyse. In Handbuch Qualitative Forschungsmethoden in der Erziehungswissenschaft, 3rd ed.; Boller, H., Friebertshäuser, B., LangerPrengel, A.A., Richter, S., Eds.; Juventa: Weinheim, Germany, 2010; pp. 323–334. [Google Scholar] [CrossRef] [Green Version]
  67. Hong, M.; Lee, S.H.; Lee, S.J.; Choi, J.Y. Application of high-resolution meteorological data from NCAM-WRF to characterize agricultural drought in small-scale farmlands based on soil moisture deficit. Agric. Water Manag. 2021, 243, 106494. [Google Scholar] [CrossRef]
  68. Edossa, D.C.; Babel, M.S.; Das Gupta, A. Drought Analysis in the Awash River Basin, Ethiopia. Int. J. Water Resour. Manag. 2010, 24, 1441–1460. [Google Scholar] [CrossRef]
  69. Gebrehiwot, T.; Van der Veen, A.; Maathuis, B. Spatial and temporal assessment of drought in the Northern highlands of Ethiopia. Int. J. Appl. Earth Obs. Geoinf. 2010, 13, 309–321. [Google Scholar] [CrossRef]
  70. Viste, E.; Diriba, K.; Asgeir, S. Recent drought and precipitation tendencies in Ethiopia. In Theoretical Application of Climatology; Springer Verlag: Berlin/Heidelberg, Germany, 2013; Volume 112, pp. 535–551. [Google Scholar]
  71. Feyisa, S. Climate Variability and Drought in the Past 30 Years in Central Rift Valley of Ethiopia. J. Nat. Sci. Res. 2017, 7, 18–26. [Google Scholar]
  72. Yimer, M.; Fantaw, Y.; Menfese, T.; Kindie, T. Meteorological drought assessment in north east highlands of Ethiopia. Int. J. Clim. Chang. Strateg. Manag. 2018, 10, 142–160. [Google Scholar] [CrossRef] [Green Version]
  73. Bayissa, Y.; Maskey, S.; Tadesse, T.; Van Andel, S.J.; Moges, S.A.; Van Griensven, A.; Solomatine, D. Comparison of the Performance of Six Drought Indices in Characterizing Historical Drought for the Upper Blue Nile Basin, Ethiopia. Geosciences 2018, 8, 81. [Google Scholar] [CrossRef] [Green Version]
  74. Fan, Z.X.; Bräuning, A.; Xu, C.X.; Liu, W.J.; Gaire, N.P.; Than, K.Z. Drought reconstruction over the past two centuries in southern Myanmar using teak tree-rings: Linkages to the Pacific and Indian Oceans. Geophys. Res. Lett. 2020, 47, e2020GL087627. [Google Scholar]
  75. Buchecker, M.; Salvini, G.; Di Baldassarre, G.; Semenzin, E.; Maidl, E.; Marcomini, A. The role of risk perception in making flood risk management more effective. Nat. Hazards Earth Syst. Sci. 2013, 13, 3013–3030. [Google Scholar] [CrossRef] [Green Version]
  76. Han, S.; Kuhlicke, C. Reducing Hydro-Meteorological Risk by Nature-Based Solutions: What Do We Know about People’s Perceptions? Water 2019, 11, 2599. [Google Scholar] [CrossRef] [Green Version]
  77. Piacentini, S.M.; Rossetto, R. Attitude and Actual Behaviour towards Water-Related Green Infrastructures and Sustainable Drainage Systems in Four North-Western Mediterranean Regions of Italy and France. Water 2020, 12, 1474. [Google Scholar] [CrossRef]
  78. Pagano, A.; Pluchinotta, I.; Pengal, P.; Cokan, B.; Giordano, R. Engaging stakeholders in the assessment of NBS effectiveness in flood risk reduction: A participatory System Dynamics Model for benefits and co-benefits evaluation. Sci. Total Environ. 2019, 690, 543–555. [Google Scholar] [CrossRef] [PubMed]
  79. Heitz, C.; Spaeter, S.; Auzet, A.-V.; Glatron, S. Local Stakeholders’ Perception of Muddy Flood Risk and Implications for Management Approaches: A Case Study in Alsace (France). Land Use Policy 2009, 26, 443–451. [Google Scholar] [CrossRef]
  80. Gebrechorkos, S.H.; Hülsmann, S.; Bernhofer, C. Changes in temperature and precipitation extremes in Ethiopia, Kenya, and Tanzania. Int. J. Clim. 2019, 39, 18–30. [Google Scholar] [CrossRef] [Green Version]
  81. Gidey, E.; Mhangara, P.; Gebregergs, T.; Zeweld, W.; Gebretsadik, H.; Dikinya, O.; Mussa, S.; Zenebe, A.; Girma, A.; Fisseha, G.; et al. Analysis of drought coping strategies in northern Ethiopian highlands. SN Appl. Sci. 2023, 5, 195. [Google Scholar] [CrossRef]
  82. Bark, R.H.; Martin-Ortega, J.; Waylen, K.A. Stakeholders’ views on natural flood management: Implications for the nature-based solutions paradigm shift? Environ. Sci. Policy 2021, 115, 91–98. [Google Scholar] [CrossRef]
  83. Pagliacci, F.; Defrancesco, E.; Bettella, F.; D’Agostino, V. Mitigation of Urban Pluvial Flooding: What Drives Residents’ Willingness to Implement Green or Grey Stormwater Infrastructures on Their Property? Water 2020, 12, 3069. [Google Scholar] [CrossRef]
  84. Hoyle, H.; Jorgensen, A.; Warren, P.; Dunnett, N.; Evans, K. “Not in their front yard” The opportunities and challenges of introducing perennial urban meadows: A local authority stakeholder perspective. Urban For. Urban Green. 2017, 25, 139–149. [Google Scholar] [CrossRef]
  85. Venkataramanan, V.; Lopez, D.; McCuskey, D.J.; Kiefus, D.; McDonald, R.I.; Miller, W.M.; Packman, A.I.; Young, S.L. Knowledge, attitudes, intentions, and behavior related to green infrastructure for flood management: A systematic literature review. Sci. Total Environ. 2020, 720, 137606. [Google Scholar] [CrossRef]
  86. Wamsler, C.; Alkan-Olsson, J.; Björn, H.; Falck, H.; Hanson, H.; Oskarsson, T.; Simonsson, E.; Zelmerlow, F. Beyond participation: When citizen engagement leads to undesirable outcomes for nature-based solutions and climate change adaptation. Clim. Chang. 2020, 158, 235–254. [Google Scholar] [CrossRef] [Green Version]
Figure 1. Location and elevation map of the study area.
Sustainability 15 11613 g001
Figure 2. General approaches of the study.
Sustainability 15 11613 g002
Figure 3. Temporal variations of the monthly SPEI, SMDI0–5, and SMDI5–100 at the 1- to 6-month timescales during the growing seasons.
Sustainability 15 11613 g003aSustainability 15 11613 g003bSustainability 15 11613 g003c
Table 1. Summary of the metrological stations.
S/NStation NameLat.Long.Time SeriesMissed (%)Remark
1Harar9.3142.101981–20204.38Filled
2Haramaya9.4042.031981–20205.63Filled
3Kombolcha9.3642.121981–20209.83Filled
4Babile9.2242.321981–20203.88Filled
5Eerer9.3341.221981–20205.68Filled
Table 2. Dry/wet condition classification based on SPEI and SMDI [54].
Dry/Wet Severity LevelRange of SPEIRange of SMDI
Extreme wet2 ≤ SPEI2 ≤ SMDI
Severe wet1.5 ≤ SPEI < 21.5 ≤ SMDI < 2
Moderate wet1 ≤ SPEI < 1.51 ≤ SMDI < 1.5
Mild wet0.5 ≤ SPEI < 10.5 ≤ SMDI < 1
Normal−0.5 < SPEI < 0.5−0.5 < SMDI < 0.5
Mild dry−1 < SPEI ≤ −0.5−1 < SMDI ≤ −0.5
Moderate dry−1.5 < SPEI ≤ −1−1.5 < SMDI ≤ −1
Severe dry−2 < SPEI≤ −1.5−2 < SMDI ≤ −1.5
ExtremeSPEI ≤ −2SMDI ≤ −2
Table 3. Multiple correlations of drought index at different timescales of stations in the Sub-basin.
BabileSMDI-1 (0–5 cm)SMDI-1 (5–100 cm)SPEI_1
SMDI-1 (0–5 cm)1
SMDI-1 (5–100 cm)0.971
SPEI_10.910.911
BabileSMDI-3 (0–5 cm)SMDI-3 (5–100 cm)SPEI_3
SMDI-3 (0–5 cm)1
SMDI-3 (5–100 cm)0.871
SPEI_30.930.921
BabileSMDI (0–5 cm)SMDI (5–100 cm)SPEI_6
SMDI_6 (0–5 cm)1
SMDI_6 (5–100 cm)0.931
SPEI_60.880.911
BabileSMDI-3 (0–5 cm)SMDI-6 (5–100 cm)SPEI_1
SMDI-3 (0–5 cm)1
SMDI-6 (5–100 cm)0.881
SPEI_10.890.871
EererSMDI-1 (0–5 cm)SMDI-1 (5–100 cm)SPEI_1
SMDI-1 (0–5 cm)1
SMDI-1 (5–100 cm)0.961
SPEI_10.840.831
EererSMDI-3 (0–5 cm)SMDI-3 (5–100 cm)SPEI_3
SMDI-3 (0–5 cm)1
SMDI-3 (5–100 cm)0.981
SPEI_30.880.931
EererSMDI-6 (0–5 cm)SMDI-6 (5–100 cm)SPEI-6
SMDI-6 (0–5 cm)1
SMDI-6 (5–100 cm)0.931
SPEI–60.840.801
EererSMDI-3 (0–5 cm)SMDI-6 (5–100 cm)SPEI_1
SMDI-3 (0–5 cm)1
SMDI-6 (5–100 cm)0.931
SPEI_10.870.891
HaramayaSMDI-3 (0–5 cm)SMDI-6 (5–100 cm)SPEI_1
SMDI-3 (0–5 cm)1
SMDI-6 (5–100 cm)0.971
SPEI_10.860.871
HaramayaSMDI-1 (0–5 cm)SMDI-1 (5–100 cm)SPEI_1
SMDI-1 (0–5 cm)1
SMDI-1 (5–100 cm)0.861
SPEI_10.870.891
HaramayaSMDI-3 (0–5 cm)SMDI-3 (5–100 cm)SPEI_3
SMDI-3 (0–5 cm)1
SMDI-3 (5–100 cm)0.941
SPEI_30.860.911
HaramayaSMDI-6 (0–5 cm)SMDI-6 (5–100 cm)SPEI_6
SMDI-6 (0–5 cm)1
SMDI-6 (5–100 cm)0.991
SPEI_60.890.891
HararSMDI-1 (0–5 cm)SMDI-1 (5–100 cm)SPEI_1
SMDI-1 (0–5 cm)1
SMDI-1 (5–100 cm)0.961
SPEI_10.880.851
HararSMDI-3 (0–5 cm)SMDI-3 (5–100 cm)SPEI_3
SMD I -3 (0–5 cm)1.00
SMD I -3 (5–100 cm)0.941.00
SPEI_30.860.911.00
HararSMDI-6 (0–5 cm)SMDI-6 (5–100 cm)SPEI_6
SMDI-6 (0–5 cm)1
SMDI-6 (5–100 cm)0.991
SPEI_60.800.891
HararSMDI-3 (0–5 cm)SMDI-6 (5–100 cm)SPEI_1
SMDI-3 (0–5 cm)1
SMDI-6 (5–100 cm)0.931
SPEI_10.890.931
KombolchaSMDI-1 (0–5 cm)SMDI (5–100 cm)SPEI_1
SMDI-1 (0–5 cm)1
SMDI-1 (5–100 cm)0.941
SPEI_10.870.881
KombolchaSMDI-3 (0–5 cm)SMDI-3 (5–100 cm)SPEI_3
SMDI-3 (0–5 cm)1
SMDI-3 (5–100 cm)0.911
SPEI_30.870.861
KombolchaSMDI-6 (0–5 cm)SMDI-6 (5–100 cm)SPEI_6
SMDI-6 (0–5 cm)1
SMDI-6 (5–100 cm)0.971
SPEI_60.960.871
KombolchaSMDI-3 (0–5 cm)SMDI-6 (5–100 cm)SPEI_1
SMDI-3 (0–5 cm)1
SMDI-6 (5–100 cm)0.941
SPEI_10.860.871
Table 4. Comparison between FGD with stakeholders and literature findings.
DescriptionFGD Participants PerspectivesFindings from the Literature Review
Stakeholder
familiarity with NbS and related concepts
About one third have not encountered the concept of NbS before the start of the FGDs, “entry-point” knowledge often
provided by Haramaya University and related offices
Despite their ignorance, farmers and land users, according to [79], believe themselves to be experts. The majority of the literature emphasizes the value of NbS initiatives for education and promoting awareness/knowledge, as in [83].
NbS benefits
perceived by
stakeholders
FGD participants mainly reference benefits of nature and express potential economic opportunitiesAccording to [76], the majority of urban NbS
literature values co-benefits for society,
and managerial viewpoints are related to easier maintenance [82].
Concerns of
stakeholders with NbS
Evidence of durability or functionality is largely missing, effectiveness is lower, maintenance is costlier, and fear of invasive speciesNbS is less effective, particularly in severe events [78], and solutions that lack visual appeal are not widely adopted [84].
Perceived barriers to NbS by stakeholdersLack of knowledge, FGDs could help to overcome
or address this issue
Many times, people are unaware of NbS evolution and the value of stakeholder involvement, as demonstrated by [75,85].
Collaborative
processes
Expectations relate to raising awareness, learning, experiencing hands-on cases, gathering experience,
demonstrating effectiveness and viability,
and new attractive business models
Mixed experiences, critical reflections, e.g., [86], as well as positive reports, e.g., [75].
Disclaimer/Publisher’s Note: The statements, opinions and data contained in all publications are solely those of the individual author(s) and contributor(s) and not of MDPI and/or the editor(s). MDPI and/or the editor(s) disclaim responsibility for any injury to people or property resulting from any ideas, methods, instructions or products referred to in the content.

