
Measuring the Competition Index in the Indonesian Manufacturing Industry: The Structure–Conduct–Performance Paradigm

Abstract
:1. Introduction
2. Literature Review
- (i)
- The degree of organization: the number of trade associations;
- (ii)
- Prices: NL price versus EU prices;
- (iii)
- Concentration: HHI, the number of firms, and the import rate;
- (iv)
- Dynamics: the market growth, churn rate, survival rate, and R&D rate.
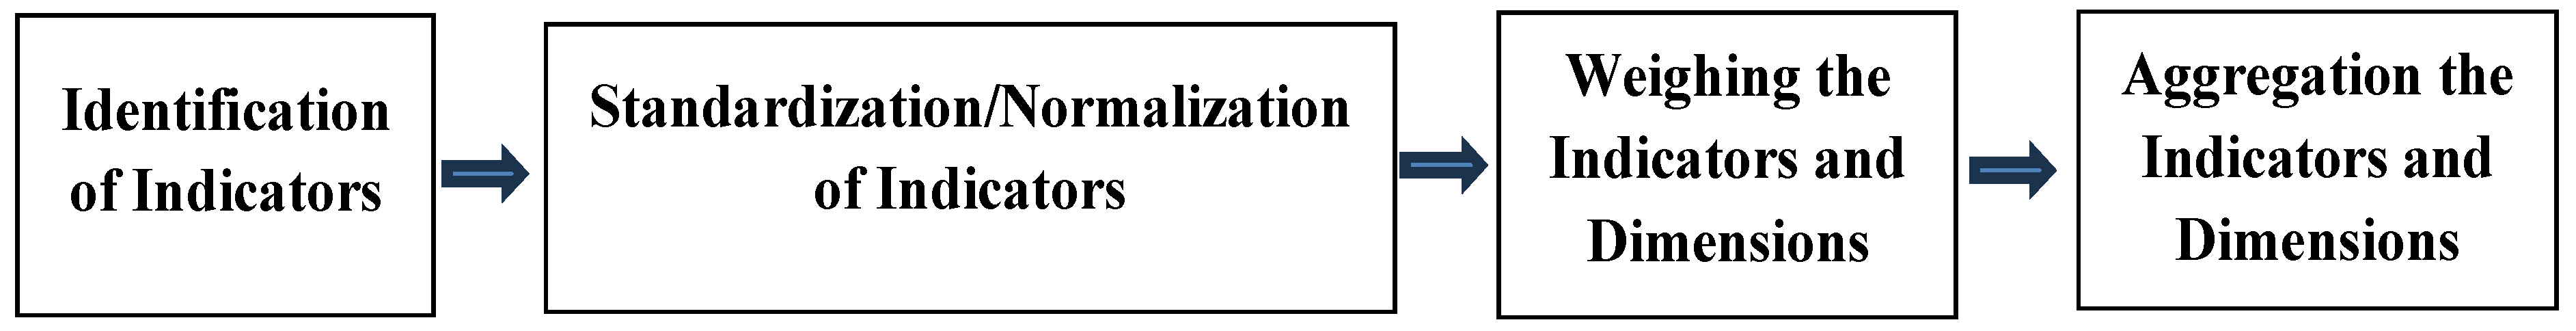
3. Modeling Approach
3.1. Identification of the Indicators in Each Dimension of the SCP
3.2. Indicator Standardization/Normalization
3.3. Weighing the Indicators in Each Dimension
3.4. Score Summation
4. Data
5. Results
6. Conclusions
Funding
Institutional Review Board Statement
Informed Consent Statement
Data Availability Statement
Acknowledgments
Conflicts of Interest
References
- Boone, J. A new way to measure competition. Econ. J. 2008, 118, 1245–1261. [Google Scholar] [CrossRef]
- Setiawan, M.; Effendi, N. Survey of Industrial Concentration and Price-cost Margin of the Indonesian Manufacturing Industry. Int. Econ. J. 2016, 30, 123–146. [Google Scholar] [CrossRef]
- Tan, Y. Efficiency and Competition in Chines Banking; Chandos Publishing: Oxfordshire, UK; Elsevier: Amsterdam, The Netherlands, 2016. [Google Scholar]
- Hartley, K.; Belin, J. The Global Defence Industry in The Economics of Global Defence Industry, 1st ed.; Routledge: Oxfordshire, UK, 2019. [Google Scholar] [CrossRef]
- Aliyi, I.; Faris, A.; Ayele, A.; Oljirra, A.; Bayessa, M. Profitability and market performance of smallholder vegetable production: Evidence from Ethiopia. Heliyon 2021, 7, e08008. [Google Scholar] [CrossRef] [PubMed]
- Setiawan, M.; Oude Lansink, A. Dynamic Technical Efficiency and Industrial Concentration of the Indonesian Food and Beverages Industry. Br. Food J. 2018, 120, 108–119. [Google Scholar] [CrossRef]
- Bain, J.S. Relation of profit rate to industry concentration: American manufacturing, 1936–1940. Q. J. Econ. 1951, 65, 293–325. [Google Scholar] [CrossRef]
- Zellner, J.A. A Simultaneous Analysis of Food Industry Conduct. Am. J. Agric. Econ. 1989, 71, 105–115. [Google Scholar] [CrossRef]
- Schmalensee, R. The new industrial organization and the economic analysis of modern markets. In Advances in Economic Theory; Hildenbrand, W., Ed.; Cambridge University Press: Cambridge, UK, 1982. [Google Scholar]
- Setiawan, M.; Emvalomatis, G.; Oude Lansink, A. Market Structure, Conduct, and Performance: Evidence from the Indonesian Food and Beverages Industry. Empir. Econ. 2013, 45, 1149–1165. [Google Scholar] [CrossRef]
- Kimani, P.; Wamukota, A.; Manyala, J.O.; Mlewa, C.M. Factors influencing financial performance in marine small-scale fisheries value chain in Kenya. Mar. Policy 2020, 122, 104218. [Google Scholar] [CrossRef]
- Khan, T.A.; Chakraborty, I. Dynamic Interactions Between Structure and Performance in the Textile and Clothing Industry in India: An Econometric Approach. J. Quant. Econ. 2022, 20, 173–209. [Google Scholar] [CrossRef]
- Lartey, T.; James, G.A.; Danso, A.; Boateng, A. Interbank market structure, bank conduct, and performance: Evidence from the UK. J. Econ. Behav. Organ. 2023, 210, 1–25. [Google Scholar] [CrossRef]
- Petit, L. The Economic Detection Instrument of the Netherlands Competition Authority: The Competition Index. 2012. Available online: https://ssrn.com/abstract=1992774 (accessed on 10 January 2022).
- Indonesian Bureau of Central Statistics. “Economy and Trade Report”. 2015. Available online: www.bps.go.id (accessed on 10 December 2022).
- Bird, K. Concentration in Indonesia manufacturing 1975–93. Bull. Indones. Econ. Stud. 1999, 35, 43–73. [Google Scholar] [CrossRef]
- Rosenthal, R. A model in which an increase in the number of sellers leads to a higher price. Econometrica 1980, 48, 1575–1579. [Google Scholar] [CrossRef]
- Stiglitz, J. Imperfect information in the product market. In Handbook of Industrial Organization; Schmalen-see, R., Willig, R., Eds.; Elsevier: Amsterdam, The Netherlands, 1989; pp. 769–847. [Google Scholar]
- Bulow, J.; Klemperer, P. Prices and the winner’s curse. RAND J. Econ. 1999, 33, 1–21. [Google Scholar] [CrossRef]
- Amir, R. Market Structure, Scale Economies and Industry Performance. CORE Discuss. Pap. Ser. 2003, 65, 29. [Google Scholar] [CrossRef]
- Pruteanu-Podpiera, A.; Weill, L.; Schobert, F. Market Power and Efficiency in the Czech Banking Sector; CNB Work. Pap. Ser.; Czech National Bank: Prague, Czech Republic, 2007. [Google Scholar]
- Maudos, J.; Fernadez de Guevara, J. Banking competition, financial dependence and economic growth. Munich Pers. RePEc Arch. 2006, 15254. Available online: https://ideas.repec.org/p/pra/mprapa/15254.html (accessed on 20 January 2023).
- Aghion, P.; Bloom, N.; Blundell, R.; Griffith, R.; Howitt, P. Competition and Innovation: An Inverted-U Relationship. Q. J. Econ. 2005, 120, 701–728. [Google Scholar]
- Nevo, A. Measuring market power in the ready-to-eat cereal industry. Econometrica 2001, 69, 307–342. [Google Scholar] [CrossRef]
- Klette, T.J. Market Power, Scale Economies and Productivity: Estimates from a panel of establishment data. J. Ind. Econ. 1999, 47, 451–476. [Google Scholar] [CrossRef]
- Hamid, F.S. The effect of market structure on Bank’s Profitability and Stability: Evidence from the ASEAN-5 Countries. Int. Econ. J. 2017, 31, 578–598. [Google Scholar] [CrossRef]
- World Economic Forum. Global Competitiveness Report; World Economic Forum: Geneva, Switzerland, 2020. [Google Scholar]
- Setiawan, M. Persistence of Price-Cost Margin and Technical Efficiency in the Indonesian Food and Beverages Industry. Int. J. Econ. Bus. 2019, 26, 315–326. [Google Scholar] [CrossRef]
- Setiawan, M. Dynamic Productivity Growth and Its Determinants in the Indonesia Food and Beverages Industry. Int. Rev. Appl. Econ. 2019, 33, 774–788. [Google Scholar] [CrossRef]
- Setiawan, M.; Emvalomatis, G.; Oude Lansink, A. Industrial Concentration and Price Cost Margin in Indonesian Food and Beverages Industry. Appl. Econ. 2012, 44, 3805–3814. [Google Scholar] [CrossRef]
- Lipczynski, J.; Wilson, J.; Goddard, J. Industrial Organization: Competition, Strategy, Policy, 2nd ed.; Prentice Hall: Hemel Hempstead, UK, 2005. [Google Scholar]
- Grout, S.; Sonderegger, P.A. Predicting Cartels. Office of Fair Trading Working Papers (773). 2005. Available online: https://research-information.bris.ac.uk/en/publications/predicting-cartels-oft-773 (accessed on 20 December 2021).
- Lorenz, C. Screening markets for cartel detection: Collusive markers in the CFD cartel-audit. Eur. J. Law Econ. 2008, 26, 213–232. [Google Scholar] [CrossRef]
- Harrington, J.E. Detecting cartels. In Handbook in Antitrust Economics; Buccirossi, P., Ed.; MIT Press: Cambridge, MA, USA, 2006. [Google Scholar]
- Setiawan, M.; Emvalomatis, G.; Oude Lansink, O. Dynamics of industrial concentration and technical inefficiency in the Indonesian food and beverage industry. Agribus. Int. J. 2022, 38, 734–739. [Google Scholar] [CrossRef]
- CEDS. Regional Competitiveness Index of Indonesian Provinces, Unpublised Research Report of CEDS Universitas Padjadjaran; CEDS Press: Bandung, Indonesia, 2001.
- OECD. Handbook of Constructing Composite Indicators: Methodology and User Guide; OECD Publications: Paris, France, 2008.
- Hausman, J.A. Specification Tests in Econometrics. Econometrica 1978, 46, 1251–1271. [Google Scholar] [CrossRef]
- Wooldridge, J.M. Introductory Econometrics: A Modern Approach; Cengage: Boston, MA, USA, 2019. [Google Scholar]

| Previous Research | Method of Estimating Competition | Application of the SCP Paradigm |
|---|---|---|
| Boone [1] | This research used relative profit differences (RPD) to measure the competition which only represented the dimension of performance. | This research missed the application of the dimensions of structure and conduct in the estimation. |
| Pruteanu-Podpiera et al. [21], Maudos and de Guevara [22], Aghion et al. [23], Nevo [24], and Klette [25] | This research used the price-cost margin as a measure of competition. | This research only applied the single dimension of performance, instead of applying all dimensions of the SCP. |
| Hartley and Belin [4], Setiawan et al. [10,30], Khan and Chakraborty [12], Lartey et al. [13], Hamid [26], and Setiawan [28] | The high industrial concentration can be an indication of low competition because high industrial concentration positively affected the price-cost margin. | This research only applied the dimension of structure (industrial concentration) as a measure of competition that may affect the performance. |
| Petit [14] | This research applied four dimensions, i.e., (i) the degree of organization, (ii) prices, (iii) concentration, and (iv) dynamics. | This research was not specific in measuring the competition, but measured the cartel. Thus, this research did not fully apply the SCP paradigm nor the dimensions of SCP as a measure of competition. |
| Kimani et al. [11] | This research used the respective market structure and conduct as a measure of competition that can affect the performance. | This research still applied partial dimensions of the market structure and conduct to measure competition. |
| Setiawan and Oude Lansink [6] and Setiawan [29] | This research applied industrial concentration to indicate the competition which affected the efficiency. | This research only applied the dimensions of structure and performance. |
| Dimension | Indicator | Definition and Measures | Effect on Competition |
|---|---|---|---|
| Structure | Herfindahl–Hirschman index | The sum of the total squared market shares of all firms in the industry. | (−) |
| Net entry | The difference between the number of firms in the industry between two consecutive years. | (+) | |
| Turnover of four big firms | Percentage of four big firms in the previous year doesn’t still stay in the four big firms in the current year of the industry. | (+) | |
| Conduct | Capacity utilization | Average percentage of capacity used for the production in the industry. | (+) |
| Growth of market share | Average growth of market share of the firms in the industry. | (+) | |
| Performance | Price-cost margin | Average ratio between price and marginal cost represented by the formula: | (−) |
| Productivity | Average ratio between the output and number of labor. | (+) |
| Variable | Mean | Std Deviation | Coefficient of Variation |
|---|---|---|---|
| HHI | 0.303 | 0.254 | 0.839 |
| Net entry | 1.296 | 22.761 | 17.563 |
| Turn over for four big firms | 0.331 | 0.238 | 0.719 |
| Capacity utilization (%) | 75.849 | 7.861 | 0.104 |
| Growth of market share | 0.275 | 0.309 | 1.124 |
| Price-cost margin | 0.181 | 0.714 | 3.945 |
| Productivity | 0.586 | 0.124 | 0.212 |
| Dimension | Indicator | Weight | Bartlett’s Test of Sphericity |
|---|---|---|---|
| Structure (0.381) | Herfindahl–Hirschman index | 0.370 | p-value = 0.000 |
| Net entry | 0.431 | ||
| Turnover of four big firms | 0.199 | ||
| Conduct (0.372) | Capacity utilization | 0.500 | p-value = 0.000 |
| Growth of market share | 0.500 | ||
| Performance (0.247) | Price-cost margin | 0.500 | p-value = 0.000 |
| Productivity | 0.500 |
| Period | Structure | Conduct | Performance | Competition Index |
|---|---|---|---|---|
| 1990–1994 | 0.486 | 0.393 | 0.295 | 0.404 |
| 1995–1999 | 0.481 | 0.367 | 0.409 | 0.421 |
| 2000–2004 | 0.536 | 0.383 | 0.249 | 0.408 |
| 2005–2009 | 0.614 | 0.388 | 0.260 | 0.442 |
| 2010–2015 | 0.554 | 0.367 | 0.357 | 0.436 |
| 1990–2015 | 0.535 | 0.379 | 0.316 | 0.423 |
| KBLI | Industry | Competition Index | S | C | P |
|---|---|---|---|---|---|
| 32905 | Coconut fiber | 0.542 | 0.579 | 0.680 | 0.287 |
| 26220 | Computer accessory | 0.519 | 0.580 | 0.526 | 0.420 |
| 32120 | Jewelry imitation | 0.499 | 0.550 | 0.545 | 0.356 |
| 26710 | Photographic equipment | 0.495 | 0.620 | 0.468 | 0.346 |
| 14302 | Embroidery clothes | 0.495 | 0.613 | 0.424 | 0.405 |
| 33122 | Repair special machine | 0.489 | 0.506 | 0.496 | 0.454 |
| 33190 | Repair other equipment | 0.488 | 0.513 | 0.478 | 0.464 |
| 14111 | Finished clothes from textile convection | 0.477 | 0.699 | 0.363 | 0.310 |
| 20129 | Other fertilizer | 0.476 | 0.556 | 0.490 | 0.337 |
| 31001 | Furniture, wood | 0.476 | 0.683 | 0.375 | 0.312 |
| 28291 | Machinery and printing | 0.475 | 0.449 | 0.518 | 0.451 |
| 32904 | Safety equipment | 0.473 | 0.490 | 0.459 | 0.469 |
| 32909 | Other processing industry | 0.472 | 0.618 | 0.409 | 0.335 |
| 23921 | Clay bricks | 0.471 | 0.596 | 0.411 | 0.359 |
| 16292 | Goods, rattan plaits, and bamboo plaits | 0.471 | 0.603 | 0.433 | 0.315 |
| 32201 | Musical instr., trad. | 0.469 | 0.531 | 0.456 | 0.398 |
| 31002 | Furniture, rattan, and bamboo | 0.468 | 0.654 | 0.385 | 0.306 |
| 13912 | Embroidery textile | 0.467 | 0.581 | 0.421 | 0.351 |
| 16291 | Goods and rattan plaits | 0.466 | 0.613 | 0.406 | 0.324 |
| 23122 | Glass prod and technical | 0.465 | 0.535 | 0.472 | 0.351 |
| KBLI | Industry | Competition Index | Structure | Conduct | Performance |
|---|---|---|---|---|---|
| 12012 | Cigarettes and other | 0.307 | 0.346 | 0.253 | 0.299 |
| 10313 | Dried fruit and vegetables | 0.338 | 0.423 | 0.327 | 0.226 |
| 58110 | Installation machine and industrial equipment | 0.338 | 0.351 | 0.368 | 0.273 |
| 26513 | Electronic measuring equipment | 0.339 | 0.370 | 0.344 | 0.285 |
| 33149 | Repair electrical equipment | 0.341 | 0.350 | 0.359 | 0.303 |
| 26210 | Computer | 0.345 | 0.336 | 0.357 | 0.303 |
| 20123 | Compound fertilizer and macro primary | 0.352 | 0.427 | 0.304 | 0.297 |
| 25130 | Steam generator | 0.358 | 0.379 | 0.411 | 0.247 |
| 30200 | Train | 0.358 | 0.395 | 0.402 | 0.239 |
| 10320 | Canned fruit and vegetables | 0.364 | 0.377 | 0.386 | 0.299 |
| 17013 | Value paper | 0.364 | 0.362 | 0.400 | 0.314 |
| 10391 | Soybean tempe | 0.364 | 0.403 | 0.350 | 0.316 |
| 11010 | Liquors | 0.365 | 0.417 | 0.299 | 0.373 |
| 10779 | Other food nec | 0.366 | 0.377 | 0.383 | 0.306 |
| 25200 | Gun and ammunition | 0.366 | 0.312 | 0.404 | 0.384 |
| 10532 | Other process of edible ice (not ice cube) | 0.367 | 0.381 | 0.379 | 0.301 |
| 10722 | Brown sugar | 0.368 | 0.351 | 0.408 | 0.315 |
| 26792 | Binocular and optic instrument (not glasses) | 0.368 | 0.385 | 0.396 | 0.309 |
| 33141 | Repair electric motor, generator, and transformer | 0.370 | 0.377 | 0.432 | 0.268 |
| 26791 | Camera and projectors | 0.370 | 0.428 | 0.424 | 0.206 |
| Independent Variable | Performance Variable |
|---|---|
| Intercept | 0.179 (0.009) p-value = 0.000 |
| Structure | 0.141 (0.011) p-value = 0.000 |
| Conduct | 0.160 (0.017) p-value = 0.000 |
| p-value of Wald-statistics | 0.000 |
Disclaimer/Publisher’s Note: The statements, opinions and data contained in all publications are solely those of the individual author(s) and contributor(s) and not of MDPI and/or the editor(s). MDPI and/or the editor(s) disclaim responsibility for any injury to people or property resulting from any ideas, methods, instructions or products referred to in the content. |
© 2023 by the author. Licensee MDPI, Basel, Switzerland. This article is an open access article distributed under the terms and conditions of the Creative Commons Attribution (CC BY) license (https://creativecommons.org/licenses/by/4.0/).
Share and Cite
Setiawan, M. Measuring the Competition Index in the Indonesian Manufacturing Industry: The Structure–Conduct–Performance Paradigm. Sustainability 2023, 15, 11726. https://doi.org/10.3390/su151511726
Setiawan M. Measuring the Competition Index in the Indonesian Manufacturing Industry: The Structure–Conduct–Performance Paradigm. Sustainability. 2023; 15(15):11726. https://doi.org/10.3390/su151511726
Chicago/Turabian StyleSetiawan, Maman. 2023. "Measuring the Competition Index in the Indonesian Manufacturing Industry: The Structure–Conduct–Performance Paradigm" Sustainability 15, no. 15: 11726. https://doi.org/10.3390/su151511726
APA StyleSetiawan, M. (2023). Measuring the Competition Index in the Indonesian Manufacturing Industry: The Structure–Conduct–Performance Paradigm. Sustainability, 15(15), 11726. https://doi.org/10.3390/su151511726