Article

Effect of Solvent Pretreatment on the Flash Pyrolysis Performance of Yinggema Lignite

1
Xinjiang Energy Co., Ltd., Urumqi 830018, China
2
State Key Laboratory of Chemistry and Utilization of Carbon-Based Energy Resources, Key Laboratory of Coal Clean Conversion & Chemical Engineering Process, College of Chemical Engineering, Xinjiang University, Urumqi 830046, China
3
Qingdao Institute of Bioenergy and Bioprocess Technology, Chinese Academy of Sciences, Qingdao 266101, China
4
Key Laboratory of Coal Processing and Efficient Utilization, Ministry of Education, China University of Mining & Technology, Xuzhou 221116, China
5
School of Chemical Engineering, Minhaj University Lahore, Lahore 54000, Punjab, Pakistan
*
Author to whom correspondence should be addressed.
Sustainability 2023, 15(15), 11760; https://doi.org/10.3390/su151511760
Submission received: 15 May 2023 / Revised: 14 July 2023 / Accepted: 27 July 2023 / Published: 31 July 2023
(This article belongs to the Special Issue Separation and Utilization of Coal-Based Solid Waste)

Abstract

:
Yinggema lignite (YL) was pretreated with isometric acetone/carbon disulfide mixed solvent to obtain the residue (RYL) and, then, RYL was separated by density difference with carbon tetrachloride to obtain the light residue (LRYL). The flash pyrolysis performances of YL and LRYL were analyzed by thermogravimetry–Fourier transform infrared spectrometer–Gas chromatography/mass spectrometer (TG-FTIR-GC/MS). The results showed that solvent pretreatment could remove some small molecules in the coal and swell the used coal, leading to the increase in pyrolysis reactivity. The intensity and absorption peak area of C=O from LRYL were significantly reduced compared to YL, resulting from the high hydrogen-donating ability of acetone. The main gaseous products of both samples are H2O, CH4, CO2, and CO; the hydrocarbons detected by GC/MS in the pyrolysis products of YL and LRYL at 450 °C were mainly alkanes, alkenes, and arenes, with the higher relative contents of alkanes of 31.1% and 36.2%, followed by arenes of 27.1% and 22.6%, respectively. The oxygen-containing compounds were mainly alcohols and phenols. It is speculated that the pretreated coal could expose more oxygen-containing functional groups, facilitating their conversion to phenolic hydroxyl groups during the pyrolysis process, resulting in more phenolic compounds.

1. Introduction

Lignite is composed of similar but not identical molecular structures that are highly cross-linked in three dimensions—a network of “basic structure unit”, mainly benzene rings and naphthalene rings connected by bridge bonds [1,2]. There are also many small compounds in coal, mostly derived from the original components of coal-forming plants, which are mainly associated by noncovalent bonds, such as hydrogen bonds, van der Waals force, and π–π interaction, and dispersed in the macromolecular network structure of coal. Usually, by nondestructive means such as solvent pretreatment, the noncovalent bond and weak covalent bond could be disrupted and weakened [3,4,5].
Solvent pretreatment is one of the most common methods to regulate the composition and structure of coal. In the pretreatment process, the solvent first penetrates the macromolecular network of the coal, weakening the intermolecular force; then, it joins with the soluble molecules and finally diffuses out through the pore structure of the coal [6,7]. And the pore structure was also changed. Various methods have been used to improve the treatment effect [8,9]. Iino et al. [10] treated several raw coals with a CS2/NMP mixture solvent at room temperature and the results of the characterization of the raw coals and residues suggested that the chemical reaction between coal and solvent did not occur to a significant extent during the pretreatment process. Cooke et al. [11] investigated the pretreatment of Cretaceous bituminous coal by quinoline under ultrasonic radiation and the results showed that at least 58% of the organic matter was mobile and could be extracted from the coal without destroying any chemical bonds.
Pyrolysis of coal is a complex free-radical reaction involving the breaking and formation of chemical bonds and the process is closely related to the macromolecular network structure of the coal. Xie et al. [12] performed a semiquantitative characterization of the chemical structure of six coal samples with different ranks by infrared structure parameters and the pyrolysis reactivity of the samples was quantitatively characterized by a comprehensive devolatilization index. The results showed that a well positive correlation was established between the infrared structure parameter and the pyrolysis reactivity. Jiang et al. [13] investigated the pyrolysis product distribution of Shenmu coal by a thermogravimetric analyzer coupled with Fourier transform infrared spectroscopy (TG-FTIR) and a pyrolyzer coupled with gas chromatography/mass spectrometry (Py-GC/MS). The main volatile species detected from TG-FTIR were CO2, CO, CH4, C2H4, aliphatic hydrocarbons, light arenes, and other oxygen-containing compounds. According to the flash pyrolysis results by Py-GC/MS, the volatile species could be divided into eleven species, including alkenes, cycloalkenes, alkanes, cycloalkanes, arenes, phenols, ethers, ketones, alcohols, N-containing species, and other species.
Pyrolysis is indeed an important step for coal conversion and an effective method for the hierarchical utilization of coal. Pore structure, functional group, pyrolysis reactivity, and kinetic parameters can be combined to develop a new model for the devolatilization process to speculate on the pyrolysis mechanism and to predict the distribution of pyrolysis products.
In our group, Yinggema lignite was subjected to thermal dissolution with cyclohexane as the solvent at 160 °C under 4 MPa [14]. However, the infrared characteristics, thermal conversion behavior, and pyrolysis products distribution of the coal were not investigated. Based on previous work, in this study, Yinggema lignite (YL) was pretreated with a mixture solvent to obtain the residue (LRYL). The composition and distribution of the flash pyrolysis products from YL and LRYL were analyzed by thermogravimetry–Fourier transform infrared spectrometer–gas chromatography/mass spectrometer (TG-FTIR-GC/MS).

2. Experimental

2.1. Material

The coal sample used in this experiment was selected from the Yinggema coal mine in Naomaohu, Hami, Xinjiang Uygur Autonomous Region, China, which is a typical low-rank coal. The sample was pulverized to pass through a 200-mesh sieve (<74 μm) followed by desiccation in a dryer at 105 °C for 12 h before use.

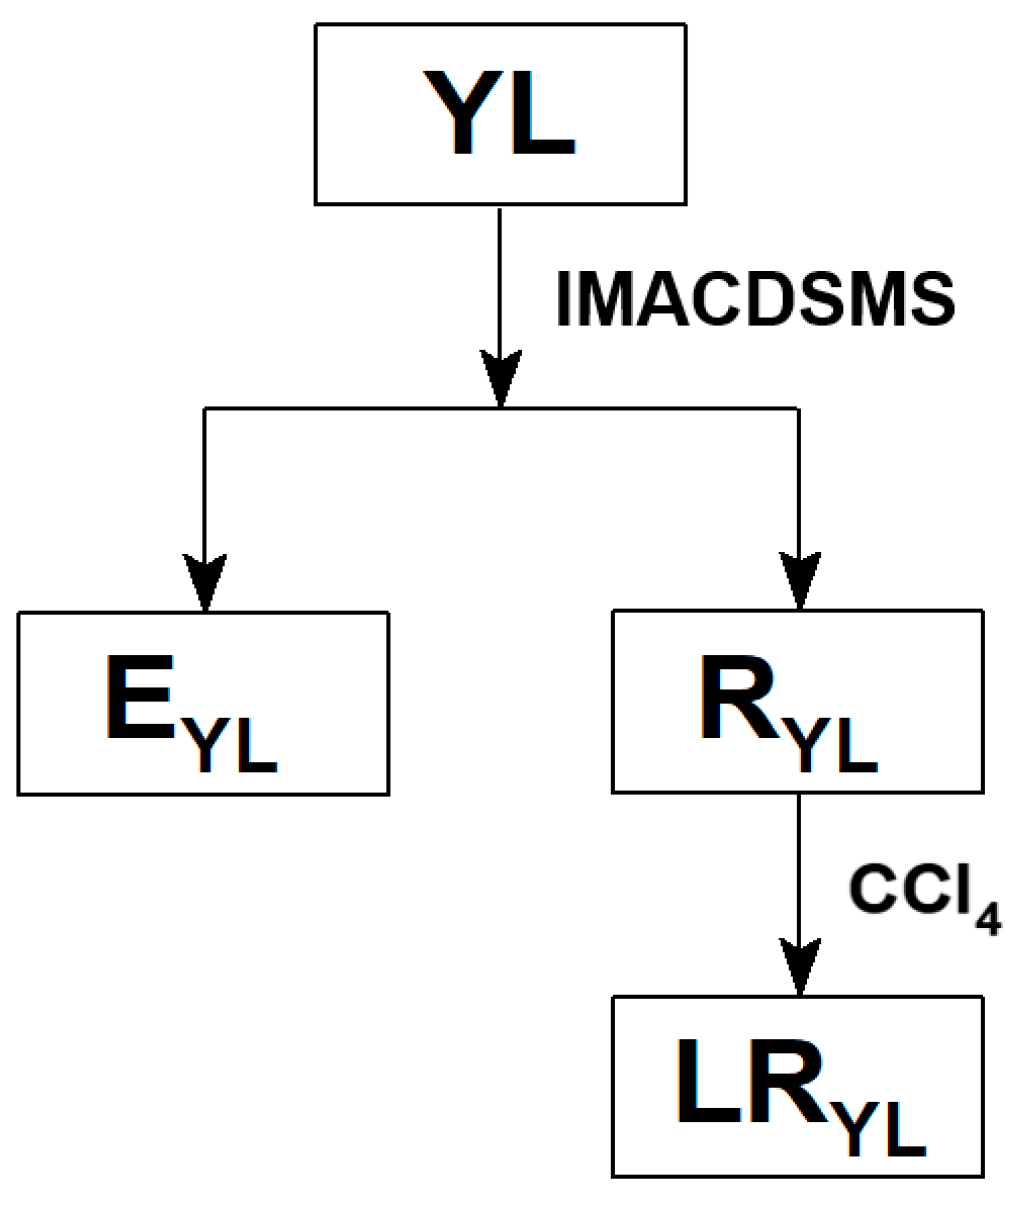
2.2. Preparation of LRYL

As shown in Figure 1, YL (10 g) was added to a conical flask with 200 mL of isometric acetone/carbon disulfide mixed solvent (IMACDSMS) in it. The conical flask was placed in an ultrasonic instrument at room temperature for 1.5 h. Then, the mixture in the flask was filtered to obtain the liquid (EYL) and residue (RYL). RYL was further treated with 200 mL of carbon tetrachloride under the condition of ultrasonication for 1 h; then, the mixture was poured into a separatory funnel, standing for 0.5 h. Subsequently, layering appeared in the funnel and the bottom precipitate (heavy residue) was removed in this step. The upper mixture from the separatory funnel was filtered and the filter cake was dried at 105 °C for 12 h to obtain LRYL.

2.3. Analysis Methods

2.3.1. Proximate and Ultimate Analyses

According to GB/T212-91 (China), moisture, ash, and volatile and fixed carbon from the coal were analyzed in our laboratory. Vario EL III elemental analyzer was used to analyze the relative content of the main organic elements in the sample.

2.3.2. FTIR Analysis

The structure characteristics of functional groups of the samples were analyzed by EQUINOX-55 infrared spectrometer. The wavelength range was selected as 400–4000 cm−1, with a resolution of 4 cm−1 and the wavenumber accuracy is 0.01 cm−1.

2.3.3. TG-DTG Analysis

An SDTQ-600 thermogravimetric analyzer was used to analyze the mass loss behavior of each sample from room temperature to 1253 K at a heating rate of 10 K/min.

2.3.4. TG-FTIR-GC/MS Analysis

(1)
TG analysis in the experiment. The test temperature was controlled at 40–800 °C, with a heating rate of 20 °C/min, the purge gas flow rate was selected as 20 mL/min, and a set of data was recorded every 6 s;
(2)
FTIR analysis in the experiment (scanning range: 400–4000 cm−1, resolution: 4 cm−1). Spectrum Omnic 8.2 was used for the recording and analysis of FTIR data, with which the baseline can be automatically corrected and related information on volatile gases can be analyzed synchronously;
(3)
GC/MS analysis in the experiment (mass-to-charge ratio (m/z) range: ≥5, scan time: 1 s). Time-intensity data is recorded by mass spectrometry and TurboMass Ver6.1.2 software is used for processing and analysis. The results were affected by air in the initial detection stage, so only stable data were selected. The ion flow diagram of the required m/z signal was isolated from the total ion flow diagram and it was distributed to corresponding gas species to obtain evolution information of the gas intensity.

3. Results and Discussion

3.1. Coal Analysis

Table 1 shows the proximate and ultimate analyses of YL and LRYL. It can be seen that the moisture and ash contents of LRYL are 6.79% and 6.53%, reduced by 4.63% and 37.75%, compared to YL, respectively, which might be attributed to some of the inorganic components or minerals in YL being removed by the solvent pretreatment process [15]. In addition, the volatile yield of LRYL was reduced by 10.75%, suggesting that the treatment by the mixture solvent could cause the small molecules in the coal to be dissolved, and some intermolecular forces might be destroyed, leading to a reduction of volatile yield.
The results of the ultimate analysis show that the C and H contents of LRYL are decreased, while the content of O element increases significantly, indicating that some of the hydrocarbons in the coal were dissolved in the solvent pretreatment process, while the oxygen-containing functional groups and bridge bonds were nearly not broken, resulting in a relative increase in the O element.

3.2. FTIR Analysis

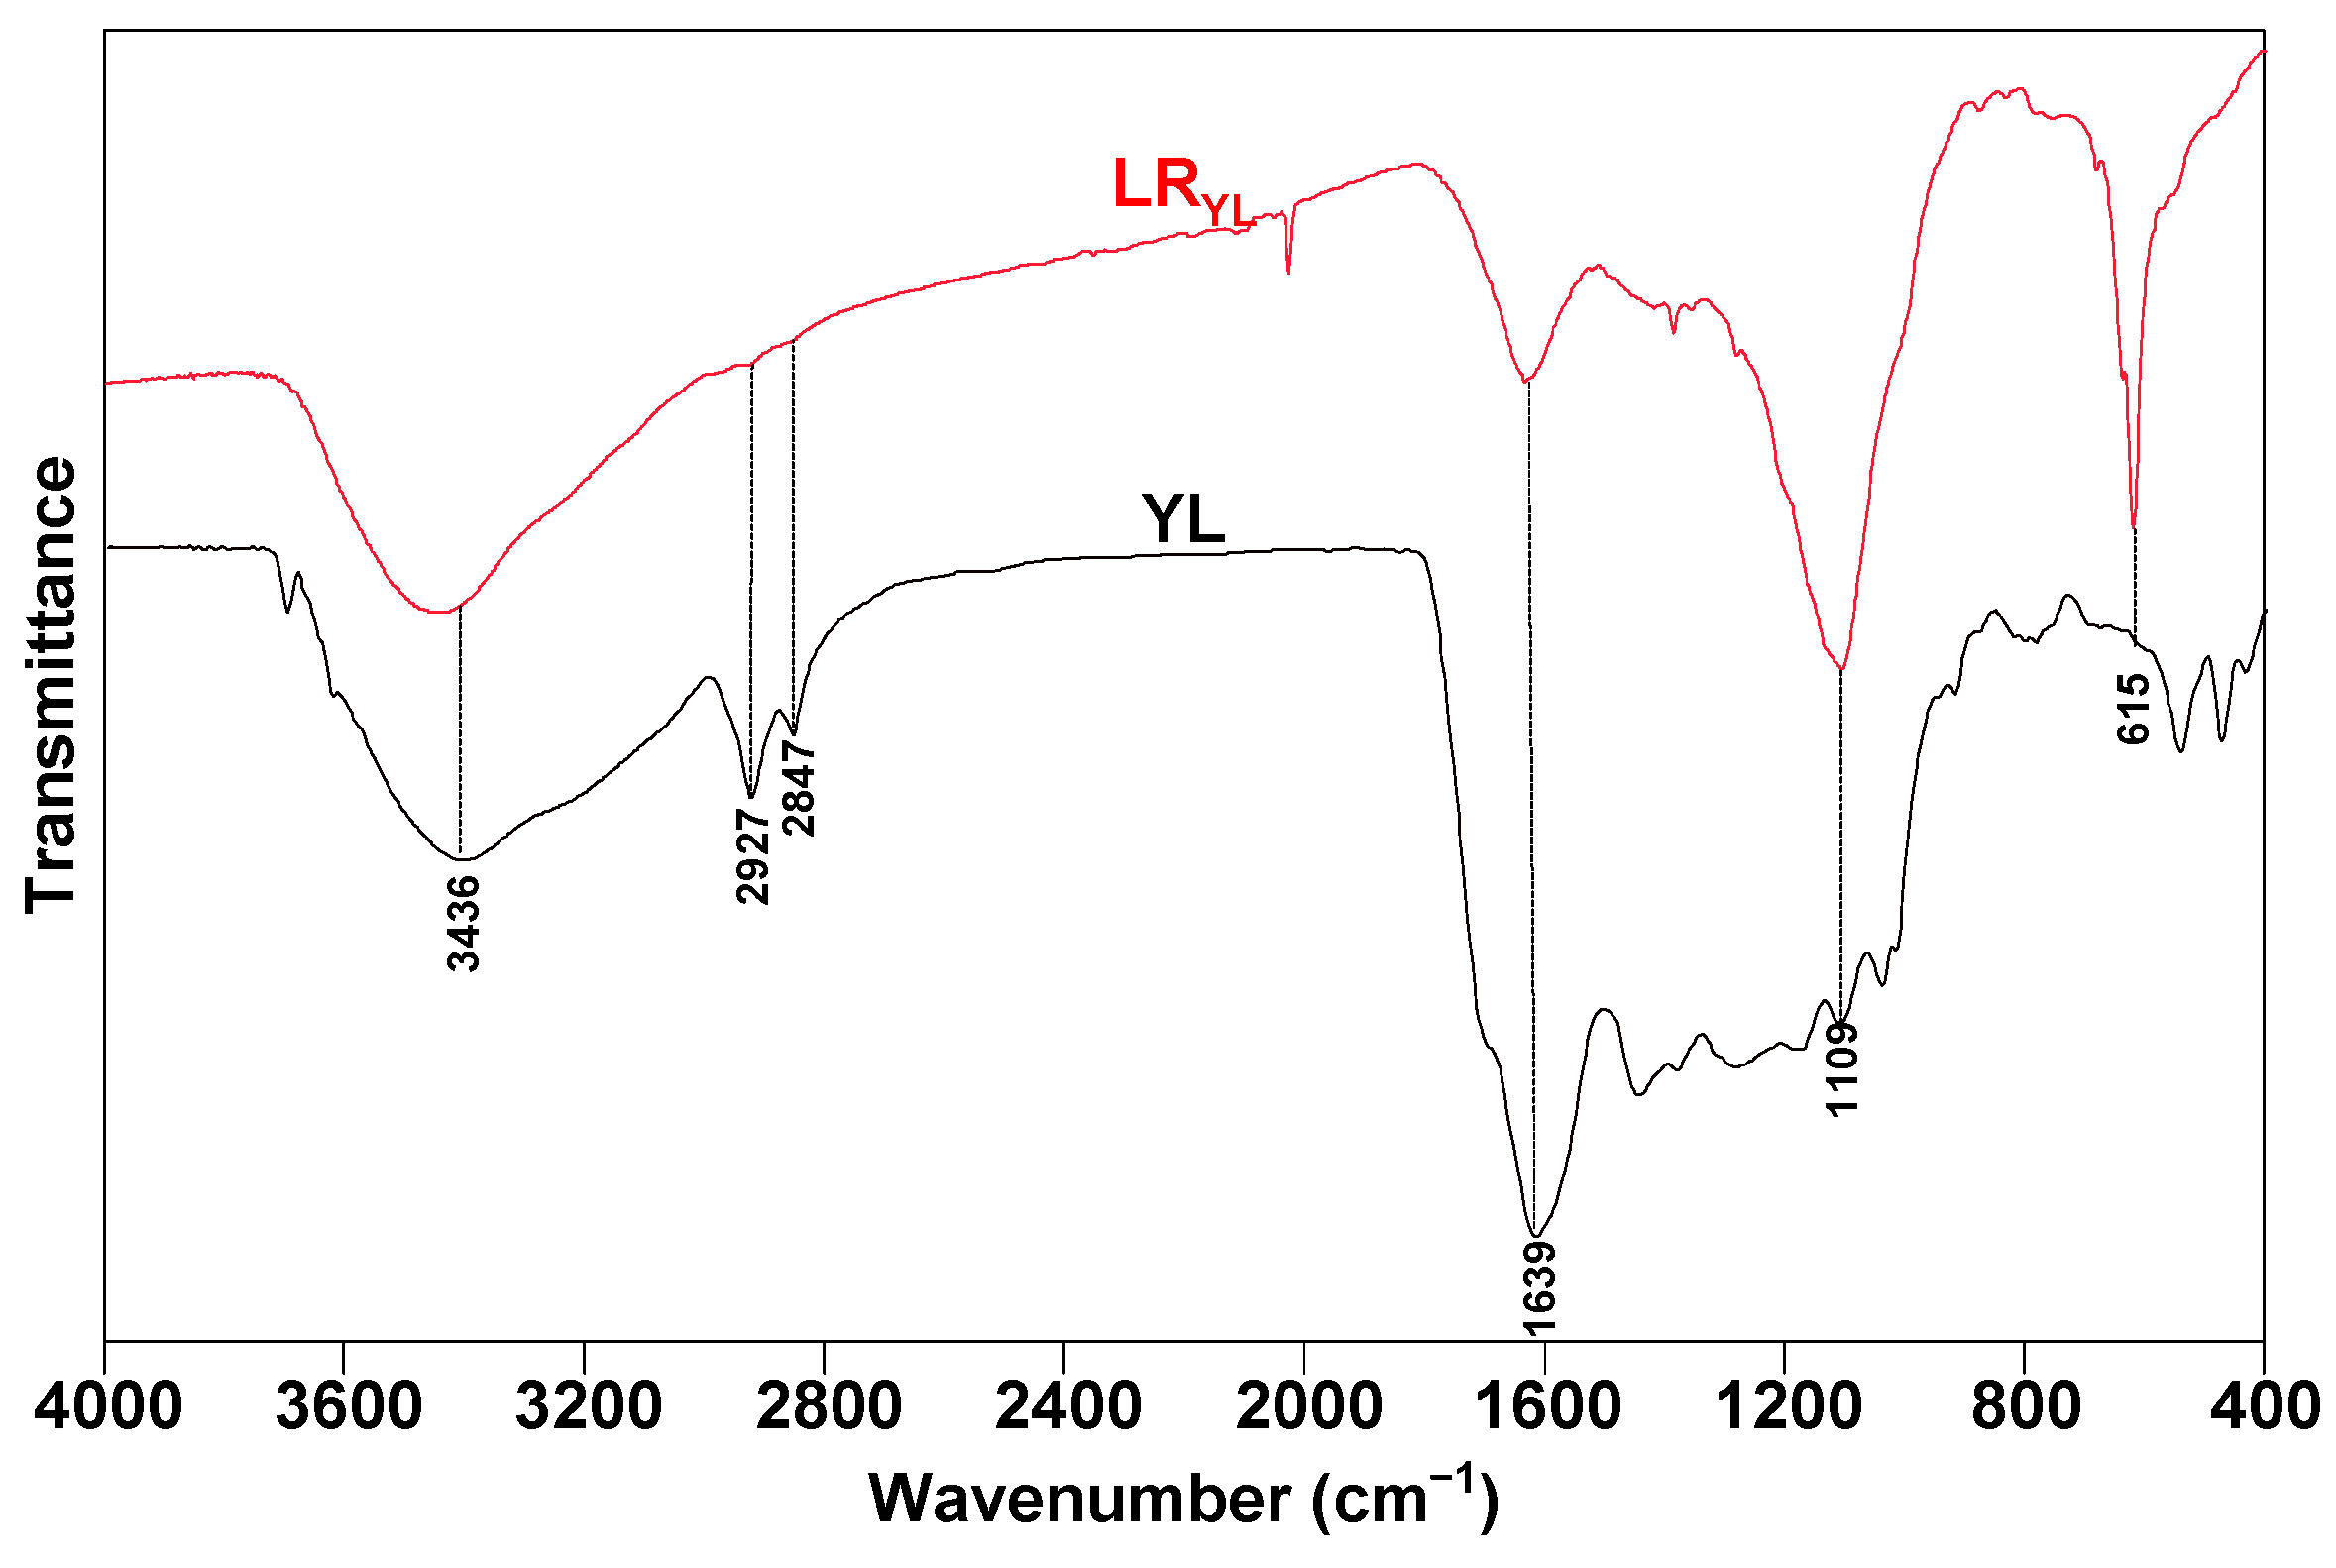
3.2.1. FTIR Profiles of the Samples

As presented in Figure 2, there is a large difference in the absorption peaks at 3436 cm−1, 2927 cm−1, 2847 cm−1, 1639 cm−1, 1109 cm−1, and 615 cm−1 for LRYL compared to YL, indicating that solvent treatment can obviously change the peak profile of coal.
The peak around 3436 cm−1 belonged to the –OH group. The increase in the intensity of the absorption peak, including self-associated –OH and cyclic –OH (see Table 2) in LRYL, suggests that the aromatic lamellae of LRYL are more ordered and the spatial arrangement of the macromolecule structure, which is more compact [16].
The absorption peaks observed at 2847 cm−1 and 2927 cm−1 are attributed to the asymmetric stretching vibrations of –CH3 and –CH2 in alkanes, respectively, and the peak intensity of LRYL is weaker compared to YL, speculating that there is removal of some small hydrocarbons during the pretreatment step.
The C=O absorption peak area and intensity at 1639 cm−1 of LRYL is significantly lower, presumably due to the strong hydrogen donating ability of acetone, which might destroy the C=O group. The peak intensity of the stretching vibration of -Si-O in LRYL, at around 1109 cm−1, is stronger than that of YL, speculating that the substitution reaction, like Si–OH=Si–O–M (M=Si or Al), might occur during the pretreatment process.

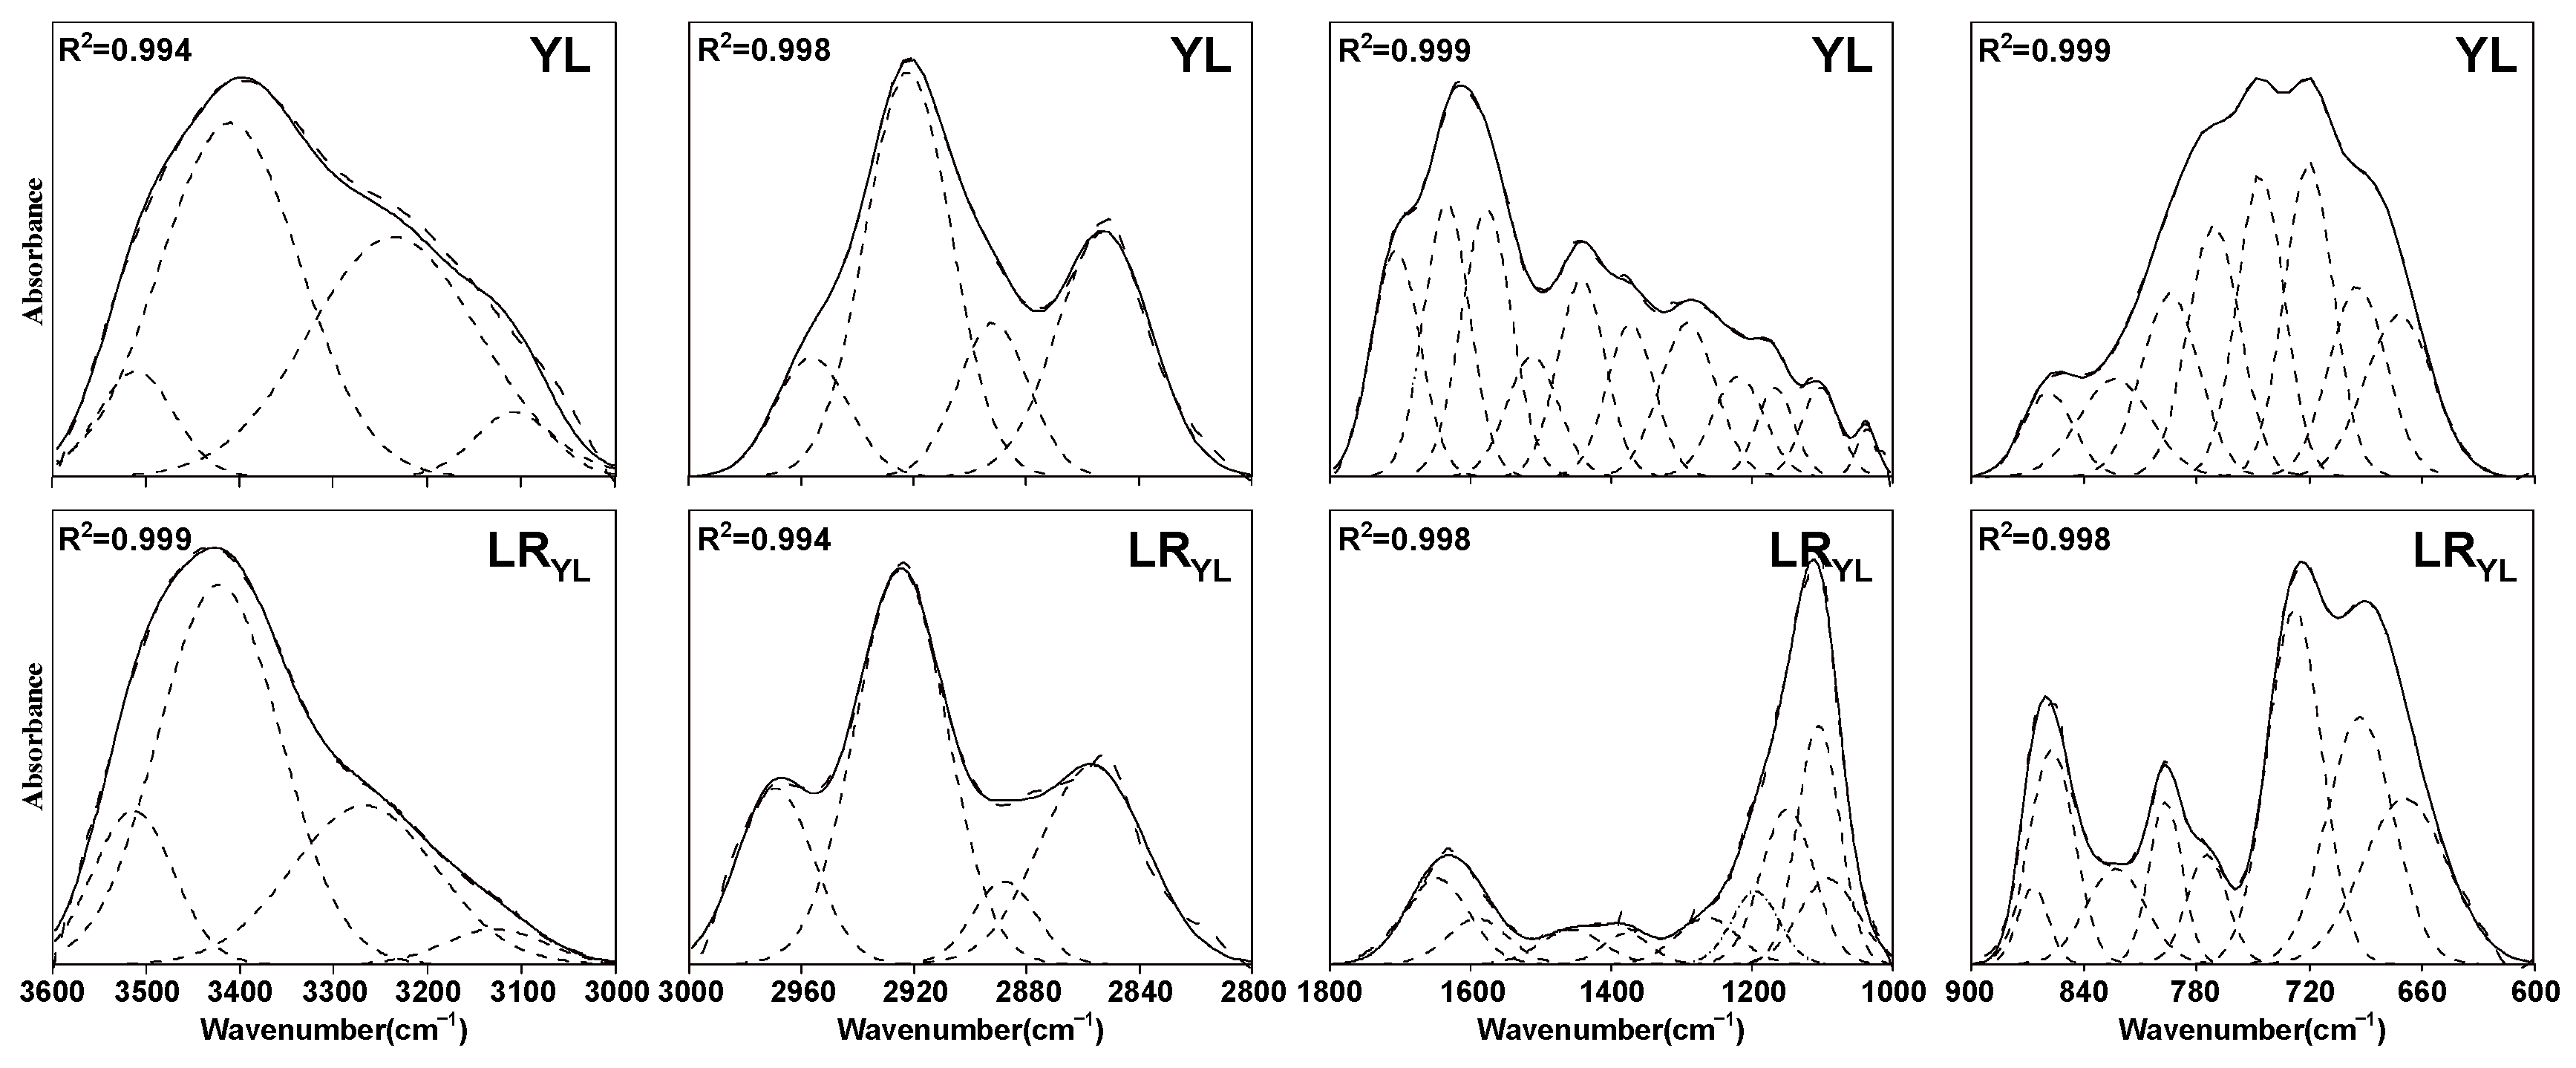
3.2.2. FTIR Semiquantitative Analysis

Due to the complexity of the coal structure, overlapping absorption peaks exist in its infrared spectra, and the peaks are difficult to analyze directly. Therefore, reasonable infrared structure parameters can represent the actual FTIR organic structure data [17]. In this paper, the infrared spectra of the samples were fitted by Peakfit 4.12 software, and a semiquantitative analysis was performed. The results were displayed in Figure 3 and Table 2.
According to Lambert–Beer law, the area of the absorption peak is proportional to the content of the corresponding functional group, provided that both the concentration and thickness of the coal samples are the same. Zhao et al. [18,19] calculated the infrared structure parameters, such as Ia, Ib, and Ic, each of which is a ratio of specific absorption peak area in the same sample, and the parameters can represent the relative content of the corresponding functional group. The semiquantitative calculation formulars are listed in Table 3 and the difference between the two samples for all the parameters is shown in Figure 4.
Ia1 and Ia2 are defined as the ratios of peak areas of the carboxyl and phenolic hydroxyl groups to the total peak areas of all functional groups. Ia3 represents the relative content of the carboxyl group to the phenolic hydroxyl group. As shown in Figure 4a, both Ia1 and Ia3 of LRYL decrease obviously, while Ia2 increases significantly, indicating that the relative content of the carboxyl groups decreased and the phenolic hydroxyl groups increased after the solvent pretreatment process, indicating that the mixture solvent might attack the C=O group and convert it into a C–O group, resulting in the increase of phenolic hydroxyl groups.
Ib1 and Ib2 are defined as the ratios of aliphatic hydrogens and aromatic hydrogens to the total peak areas of all functional groups and Ib3 represents the relative change of aliphatic hydrogens to aromatic hydrogens. The value of Ib3 can be used to reveal the distribution of the hydrogen element in the sample and is an important parameter reflecting the aromaticity of the sample. As displayed in Figure 4b, the relative content of aliphatic hydrogen and aromatic hydrogen in LRYL is reduced by 84.7% and 62.5%, respectively, indicating that solvent treatment affected the distribution of aliphatic and aromatic hydrogens, with a stronger effect on aliphatic hydrogens.
Ic1 is defined as the ratio of the relative content of asymmetric –CH2 to –CH3 groups in the aliphatic structure, representing the length of bridge bonds and aliphatic side chains. Ic2 is defined as the ratio of aromatic C–H to aromatic ring C=C, representing the abundance of the hydrogen element in the aromatic structure. The higher the value, the lower the number of substituents on the aromatic ring. Ic3 is defined as the ratio of the sum of two isolated aromatic hydrogens (1H and 2H) to the total aromatic hydrogens, representing the proportion of aromatic rings with high substitution in the overall aromatic rings. Ic1 reflects the distribution of the hydrogen element in the aliphatic structure, while Ic2 and Ic3 represent the degree of substitution in the aromatic rings from different perspectives. As illustrated in Figure 4c, Ic1 and Ic2 decreased by 32.15% and 44.73% for LRYL compared to YL, indicating that the distribution range of the hydrogen element in the aliphatic structure increased and the degree of substitution of the aromatic rings increased.

3.3. TG-DTG Analysis

As illustrated in Figure 5a, the mass losses of YL and LRYL are 48.55% and 46.94%, respectively, with a slight decrease in the mass loss of LRYL compared to YL. As shown in Figure 5b, the difference in the maximum mass loss peak temperature between the two samples is not significant (around 450 °C), indicating that the macromolecular network structure of the coal was not damaged during the solvent treatment process.
Before 180 °C, the mass loss was mainly due to the release of free water and part of the bound water in the sample, as well as the volatilization of some physically adsorbed small molecules. In the temperature region from 180 °C to 300 °C, some of the weaker intermolecular forces in the sample were destroyed. In this stage, decarboxylation, the release of higher boiling organic matter, and/or the removal of small molecules adsorbed in the sample by capillary action, might take place. In addition, a pronounced mass loss rate peak is observed at 210 °C for LRYL, suggesting that the solvent treatment might weaken the intermolecular forces to some extent, resulting in the increase of the internal pore size of the sample, enhancing the diffusion ability of the organic matter from the sample, making it easier for the pyrolysis process.
The mass loss rate of both samples reached its maximum at around 450 °C and the pyrolysis reaction of the two samples is violent at the temperature, with rapid mass loss—the release of large amounts of volatile compounds. And the temperature region around 450 °C is the main stage of the cracking reaction of the macromolecular structure in the two samples. Based on DTG data, pyrolysis characteristic parameters of the two samples can be obtained, as shown in Table 4. The comprehensive devolatilization index (D = [(dM/dT)max − (dM/dT)mean]/(Tmax − Ti − ΔT1/2)) was calculated for both samples with reference to the literature [12]. The results present that the value of D of LRYL is higher than that of YL, indicating better pyrolysis reactivity.
In order to investigate the pyrolysis process of the two samples in detail, the DTG profiles of the two samples were fitted by Peakfit software [20], and the results are displayed in Figure 6 and Table 5. As shown in Figure 6, before 300 °C, the bound water in the coal was released, and weak chemical bonds, with bond energy less than 150 kJ/mol, such as carboxyl groups, were decomposed. The temperature range of 300–420 °C was mainly attributed to the breakage of Cal–O, S–N, and S–S bonds, with bond energy in the range of 150–230 kJ/mol. The rapid pyrolysis region of coal (420–550 °C) was dominated by the release of large amounts of volatile organic compounds from the network of coal, including the breaking of bonds, such as Cal–Cal, Cal–H, Cal–O, and Car–N in the samples with bond energy in the range of 210–320 kJ/mol; simultaneously, the stabilization of macromolecular fragments might occur and coal tar might be formed. The stage in the range of 550–650 °C was mainly attributed to the breaking of Car–Cal, Car–O, S–N, and S–S bonds in the sample. As the rate of tar cracking exceeds the rate of tar formation, the alkyl aromatic form of tar was prone to cracking and small aromatic molecules containing C–C groups might be produced. After 700 °C, the temperature region was defined as the slow condensation stage, where the aromatic rings condensed to produce H2, and a small amount of CO was also produced, derived from the reaction of coke and CO2.

3.4. TG-FTIR-GC/MS Test

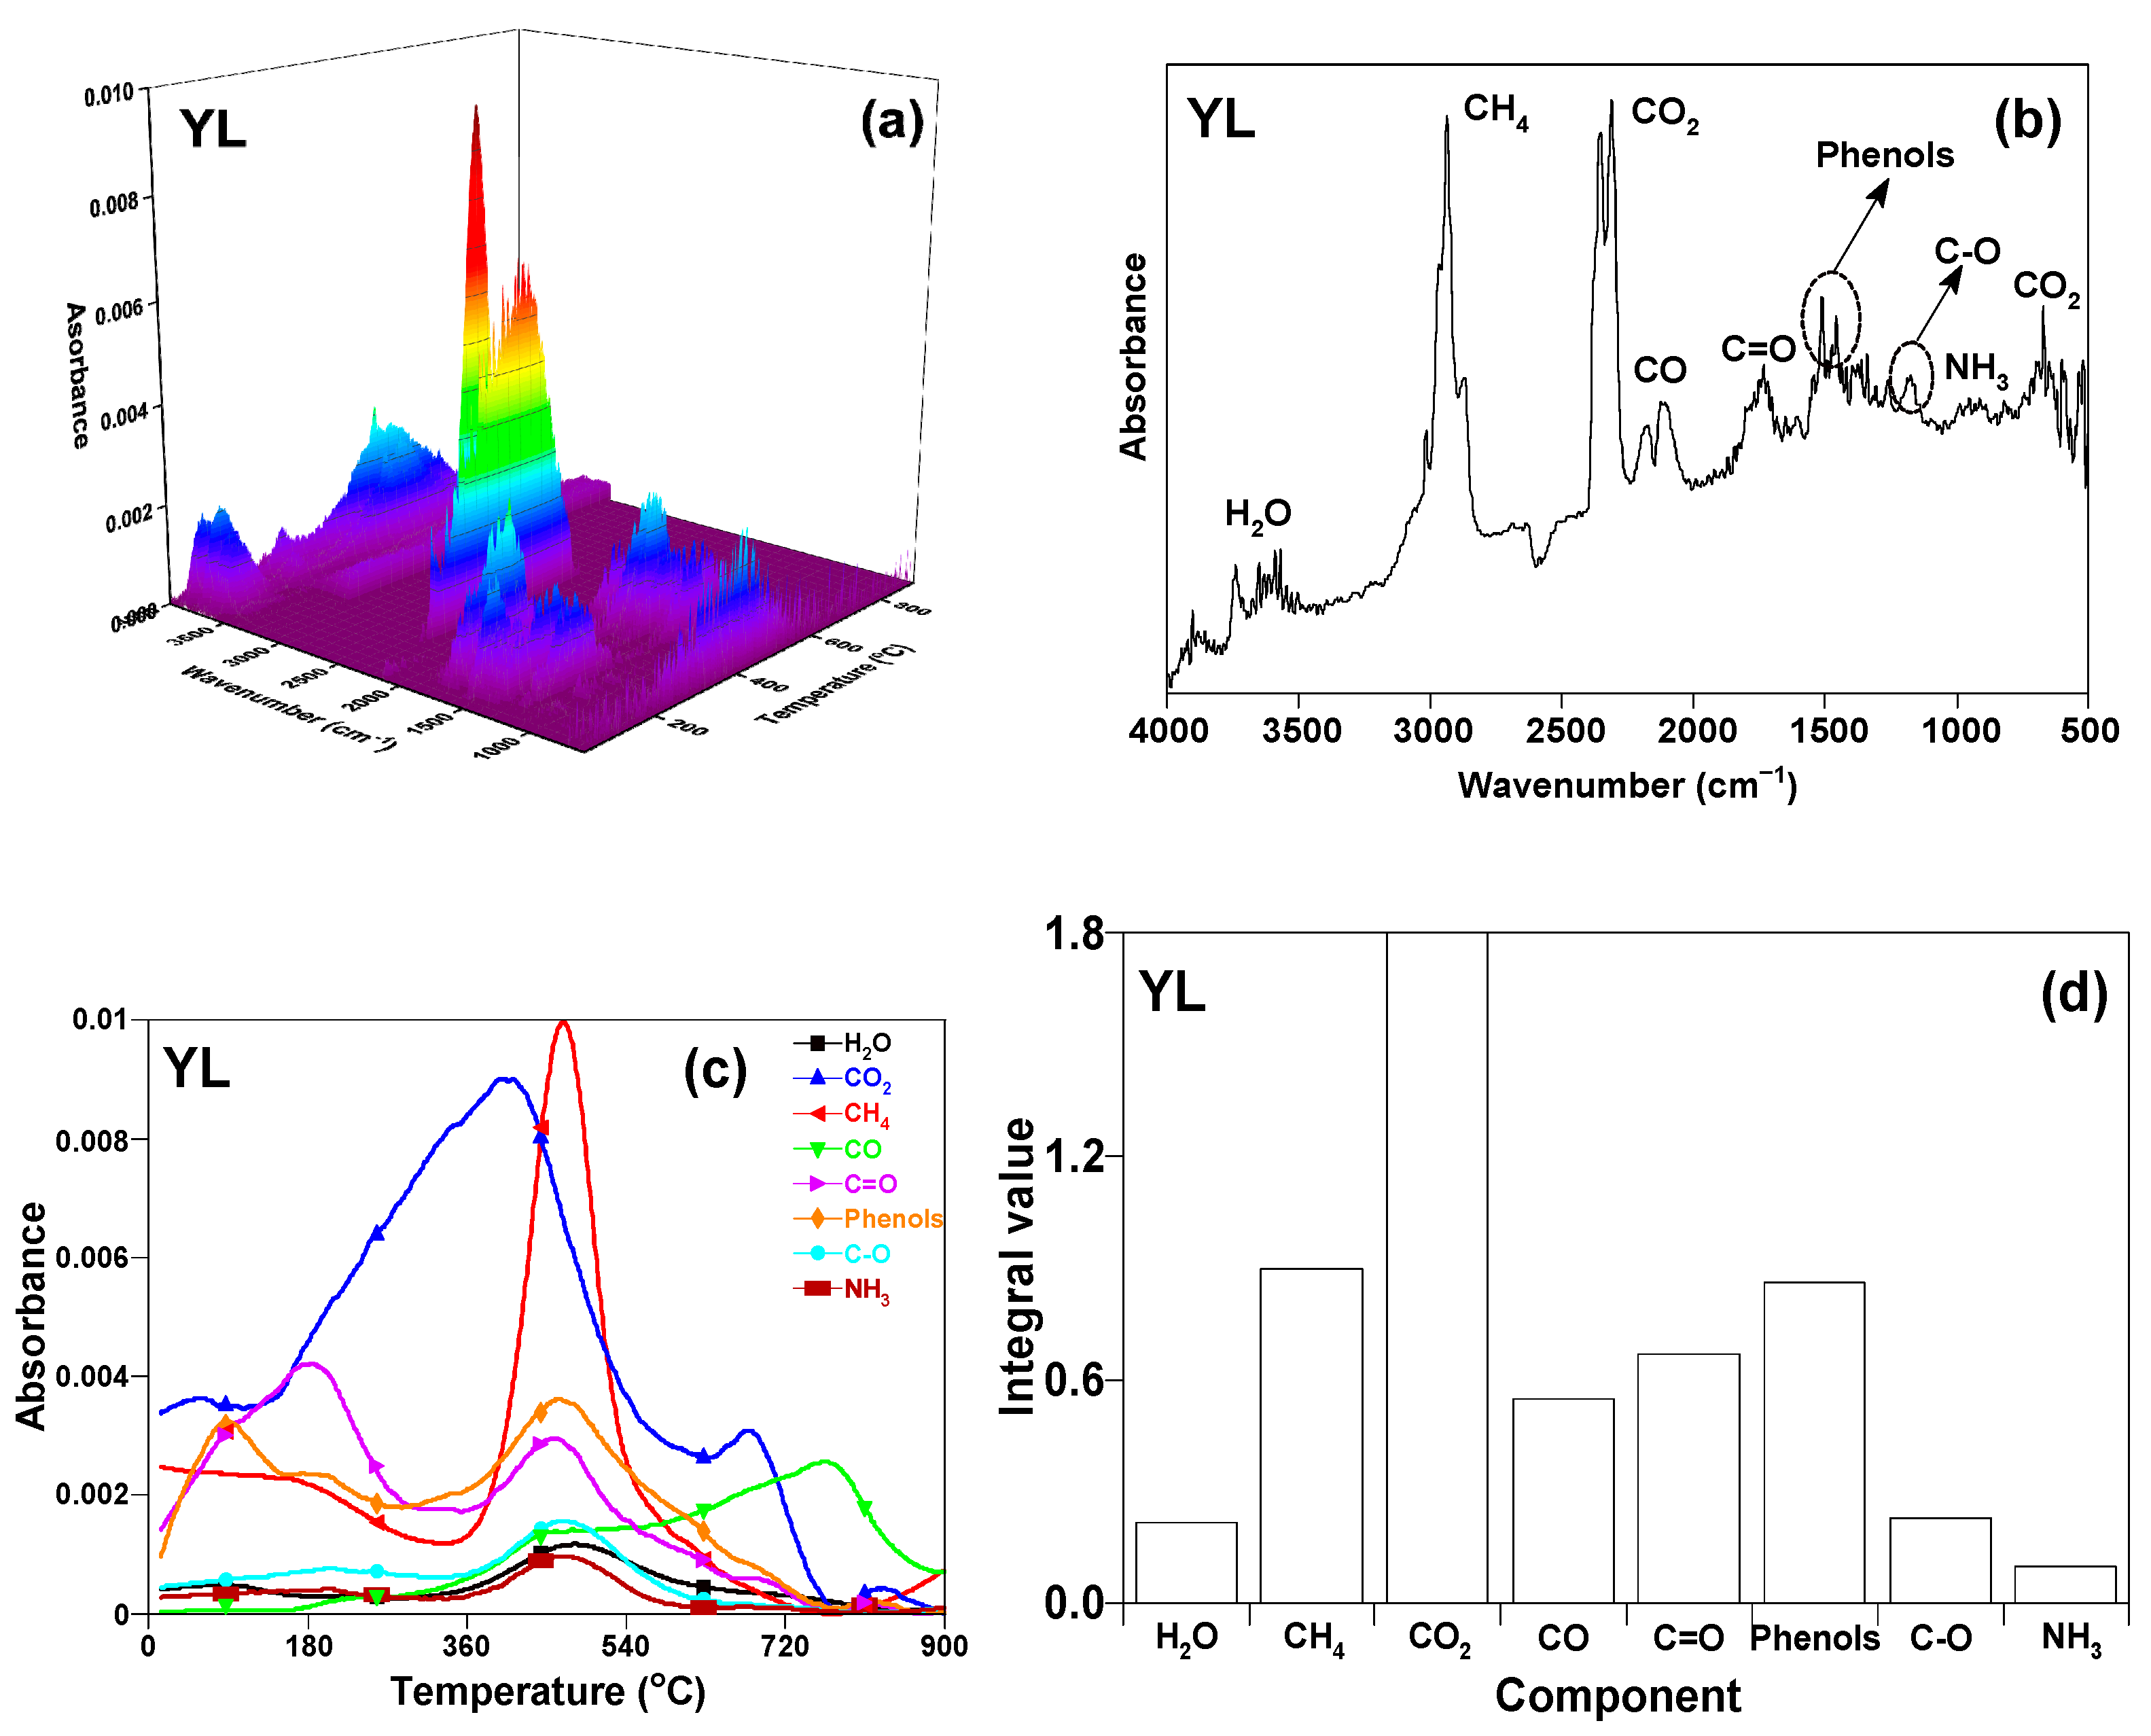
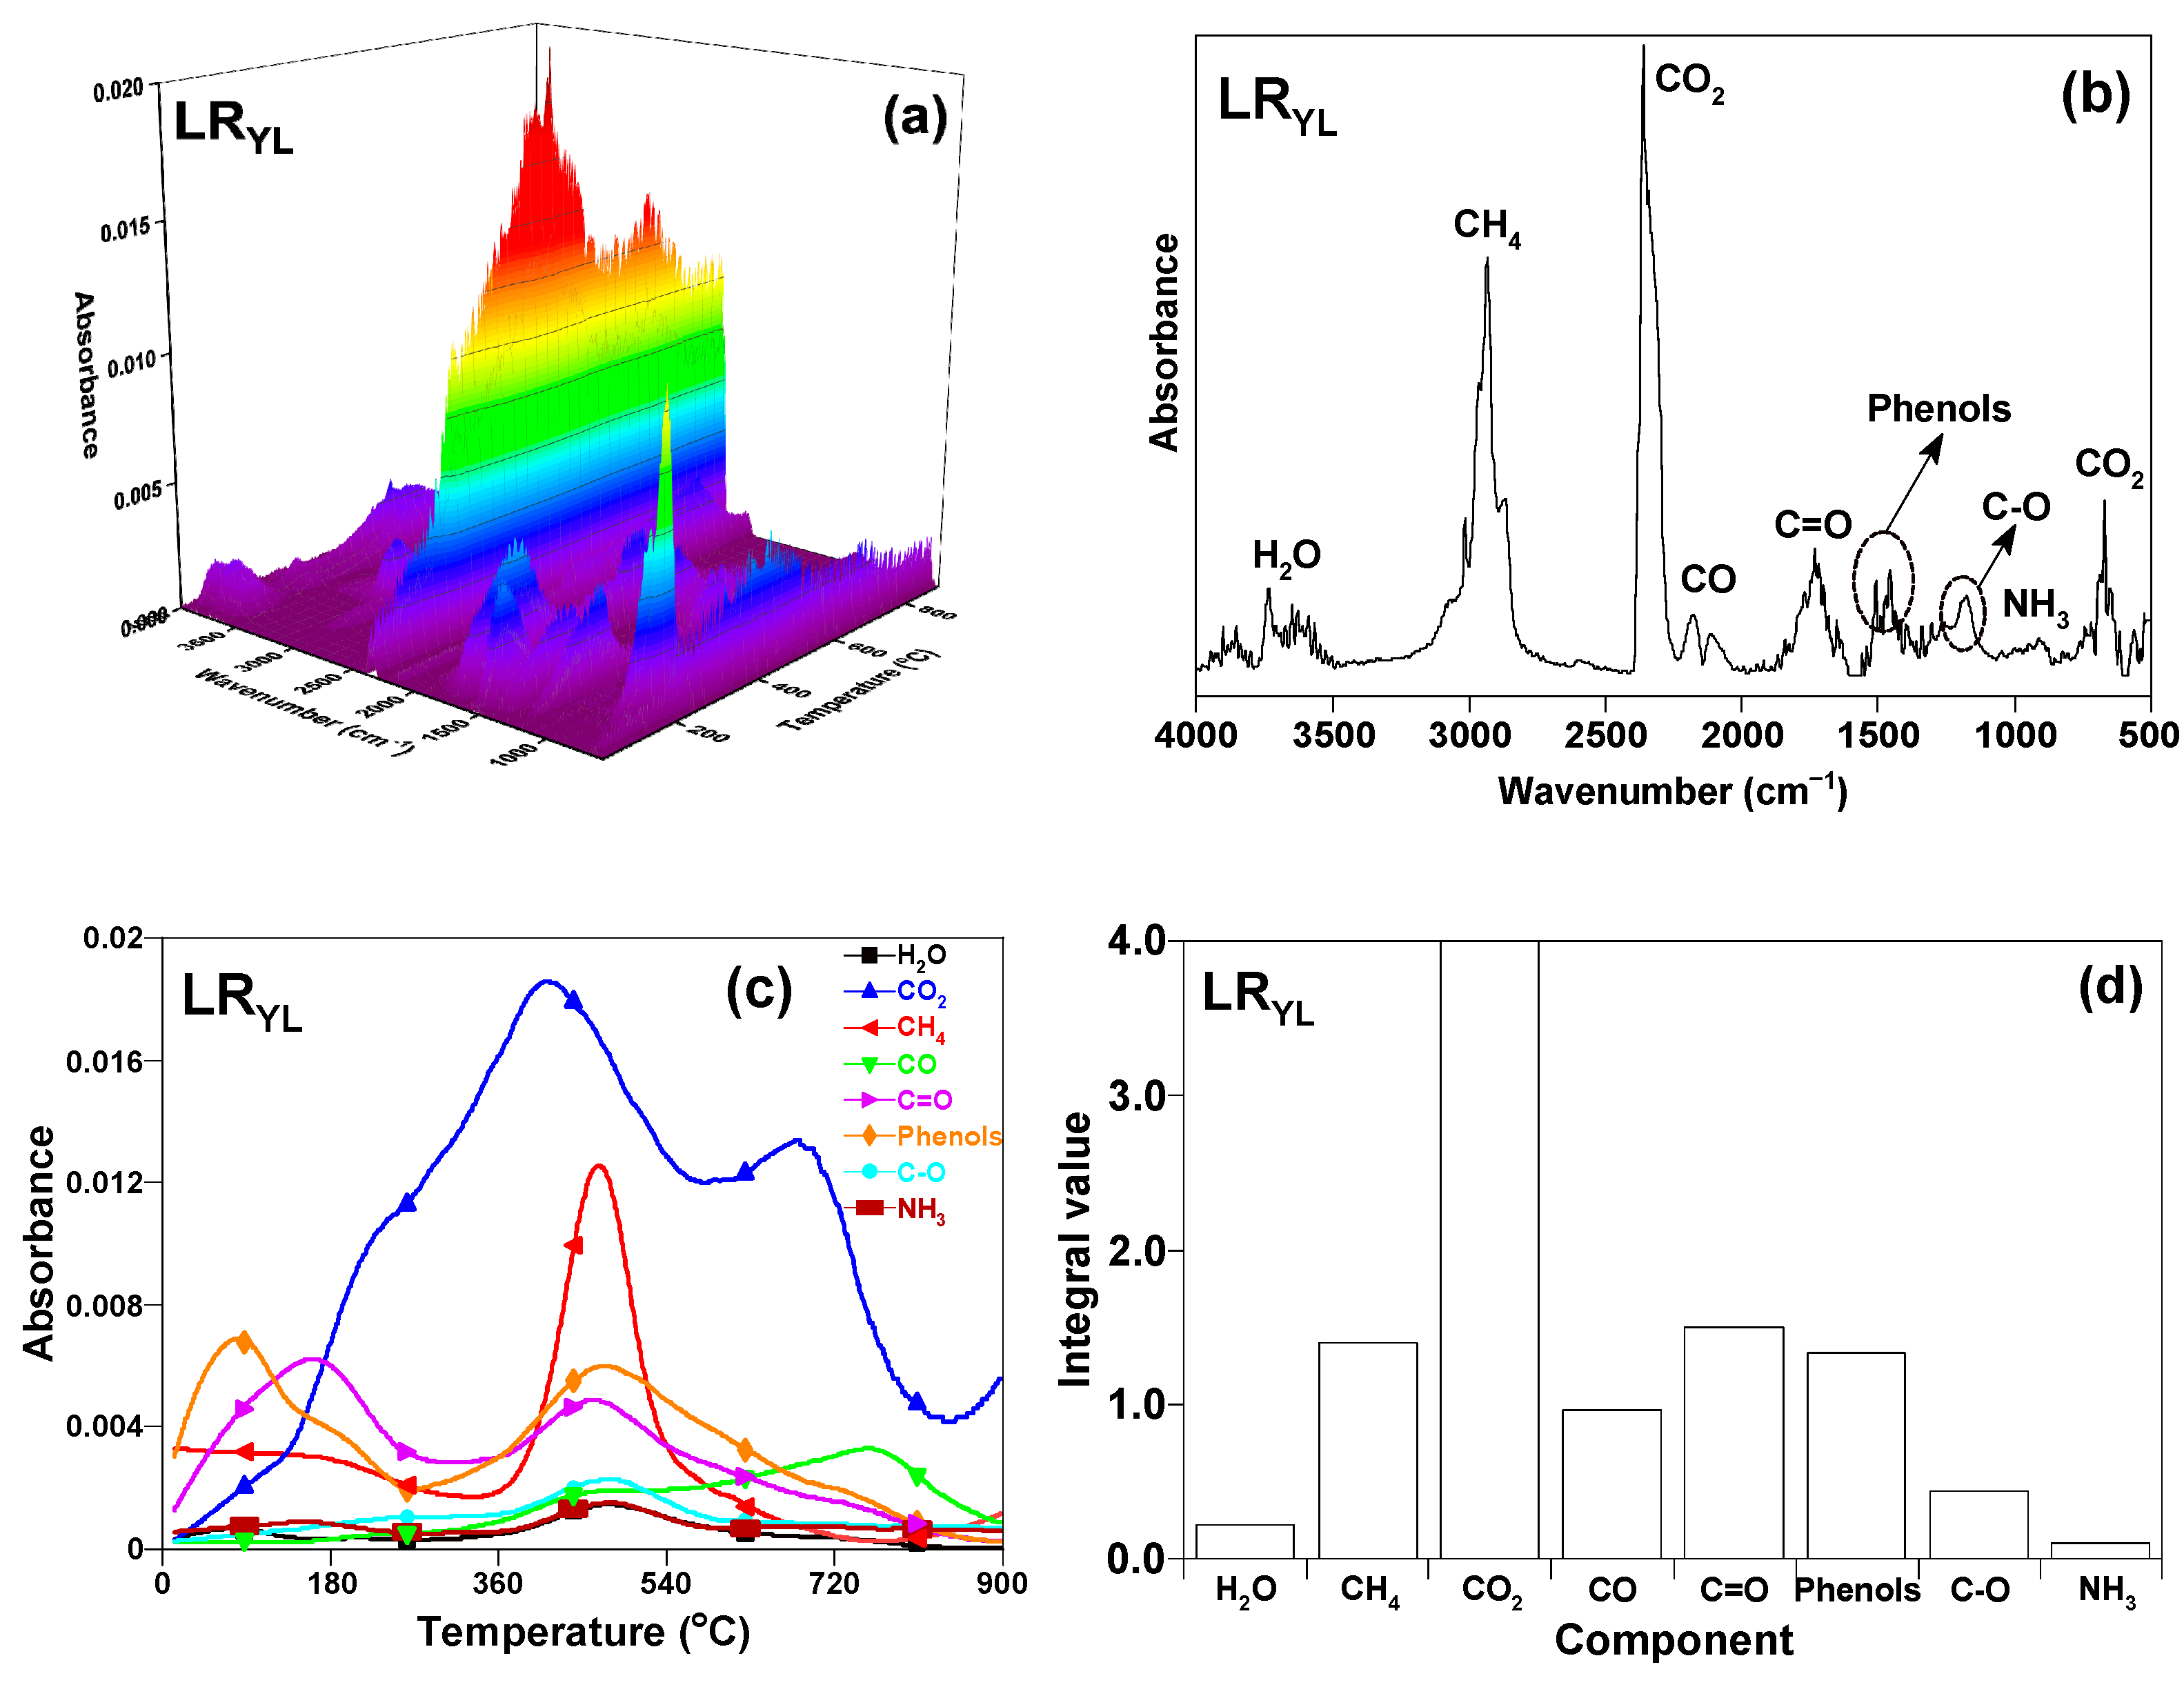
3.4.1. TG-FTIR Profile

TG-FTIR diagrams of the pyrolysis products from the two samples are presented in Figure 7 and Figure 8. As shown in Figure 7a and Figure 8a, both samples show many absorption peaks in the 500–4000 cm−1 range, suggesting that there are many functional groups in the products. Overall, compared to YL, the absorption peaks intensity of the pyrolysis products from LRYL is significantly higher, which might be explained by the loose pore structure of LRYL, facilitating the escape of a large amount of volatile organic compounds during the pyrolysis process.
As illustrated in Figure 7b and Figure 8b, the samples display weak peaks in the range of 3500–4000 cm−1 at 450 °C, where the stretching vibration peak of –OH reflects the release of hydroxyl-containing compounds such as H2O and alcohols. Absorption peaks observed at 2800–3000 cm−1 are attributed to the stretching vibrations of –CH3 and –CH2, demonstrating the release of aliphatic small organic compounds such as CH4 and C2H6. The release of CH4 might originate from the cleavage of methoxy to produce free radicals (CH2 or CH3) at higher temperature (CH2/CH3 + H → CH4).
The maximum absorption intensity region for both samples is located at 2200–2400 cm−1, which is associated with the release of CO2, mainly caused by the cleavage of the carboxyl functional group and/or by the scission and detachment of the C–O bond. A weak absorption peak between 2000–2200 cm−1 is related to the release of CO, probably derived from the cleavage of the carbonyl group. A distinct absorption peak that appeared in the range 1600–1900 cm−1 might correspond to the C=O peak of aldehydes, ketones, and organic acids. C-C skeleton vibration at 1450–1600 cm−1 is attributed to the aromatic ring. And bending vibration at 1300–1400 cm−1 and stretching vibration at 1000–1200 cm−1 might, probably, be caused by aromatic ring structures containing hydroxyl groups; thus, the identification of functional groups with both an aromatic ring and hydroxyl can be performed. In addition, the absorption peak at 966 cm−1 was thought to be caused by NH3 [21].
As demonstrated in Figure 7c and Figure 8c, at pyrolysis temperatures of less than 200 °C, there are clear absorption peaks of CH4, phenols, and C=O, which might be derived from the release of CH4 adsorbed in the pore structure of the samples and the formation of small amounts of phenolic compounds, as well as the decomposition of carboxylic acids. With the increase of the pyrolysis temperature, at 400–600 °C, the release of C–O, C=O, –OH, acids, phenols, and alcohols mainly occurred, indicating that this interval is the main pyrolysis stage. Among them, the absorption peaks of CO2 and CH4 showed the maximum intensity. The main absorption peaks between 600–800 °C were attributed to CO2 and CO, which were most likely due to the secondary conversion of C=O and C-O-containing organics, including chain breakage and reforming. Furthermore, the CO absorption peak was also presumed to be the reaction of coke with CO2 (C + CO2 → 2CO) at a higher temperature. In summary, the main gaseous products are H2O, CH4, CO2, and CO, as well as small amounts of NH3 during the pyrolysis process of the two samples.

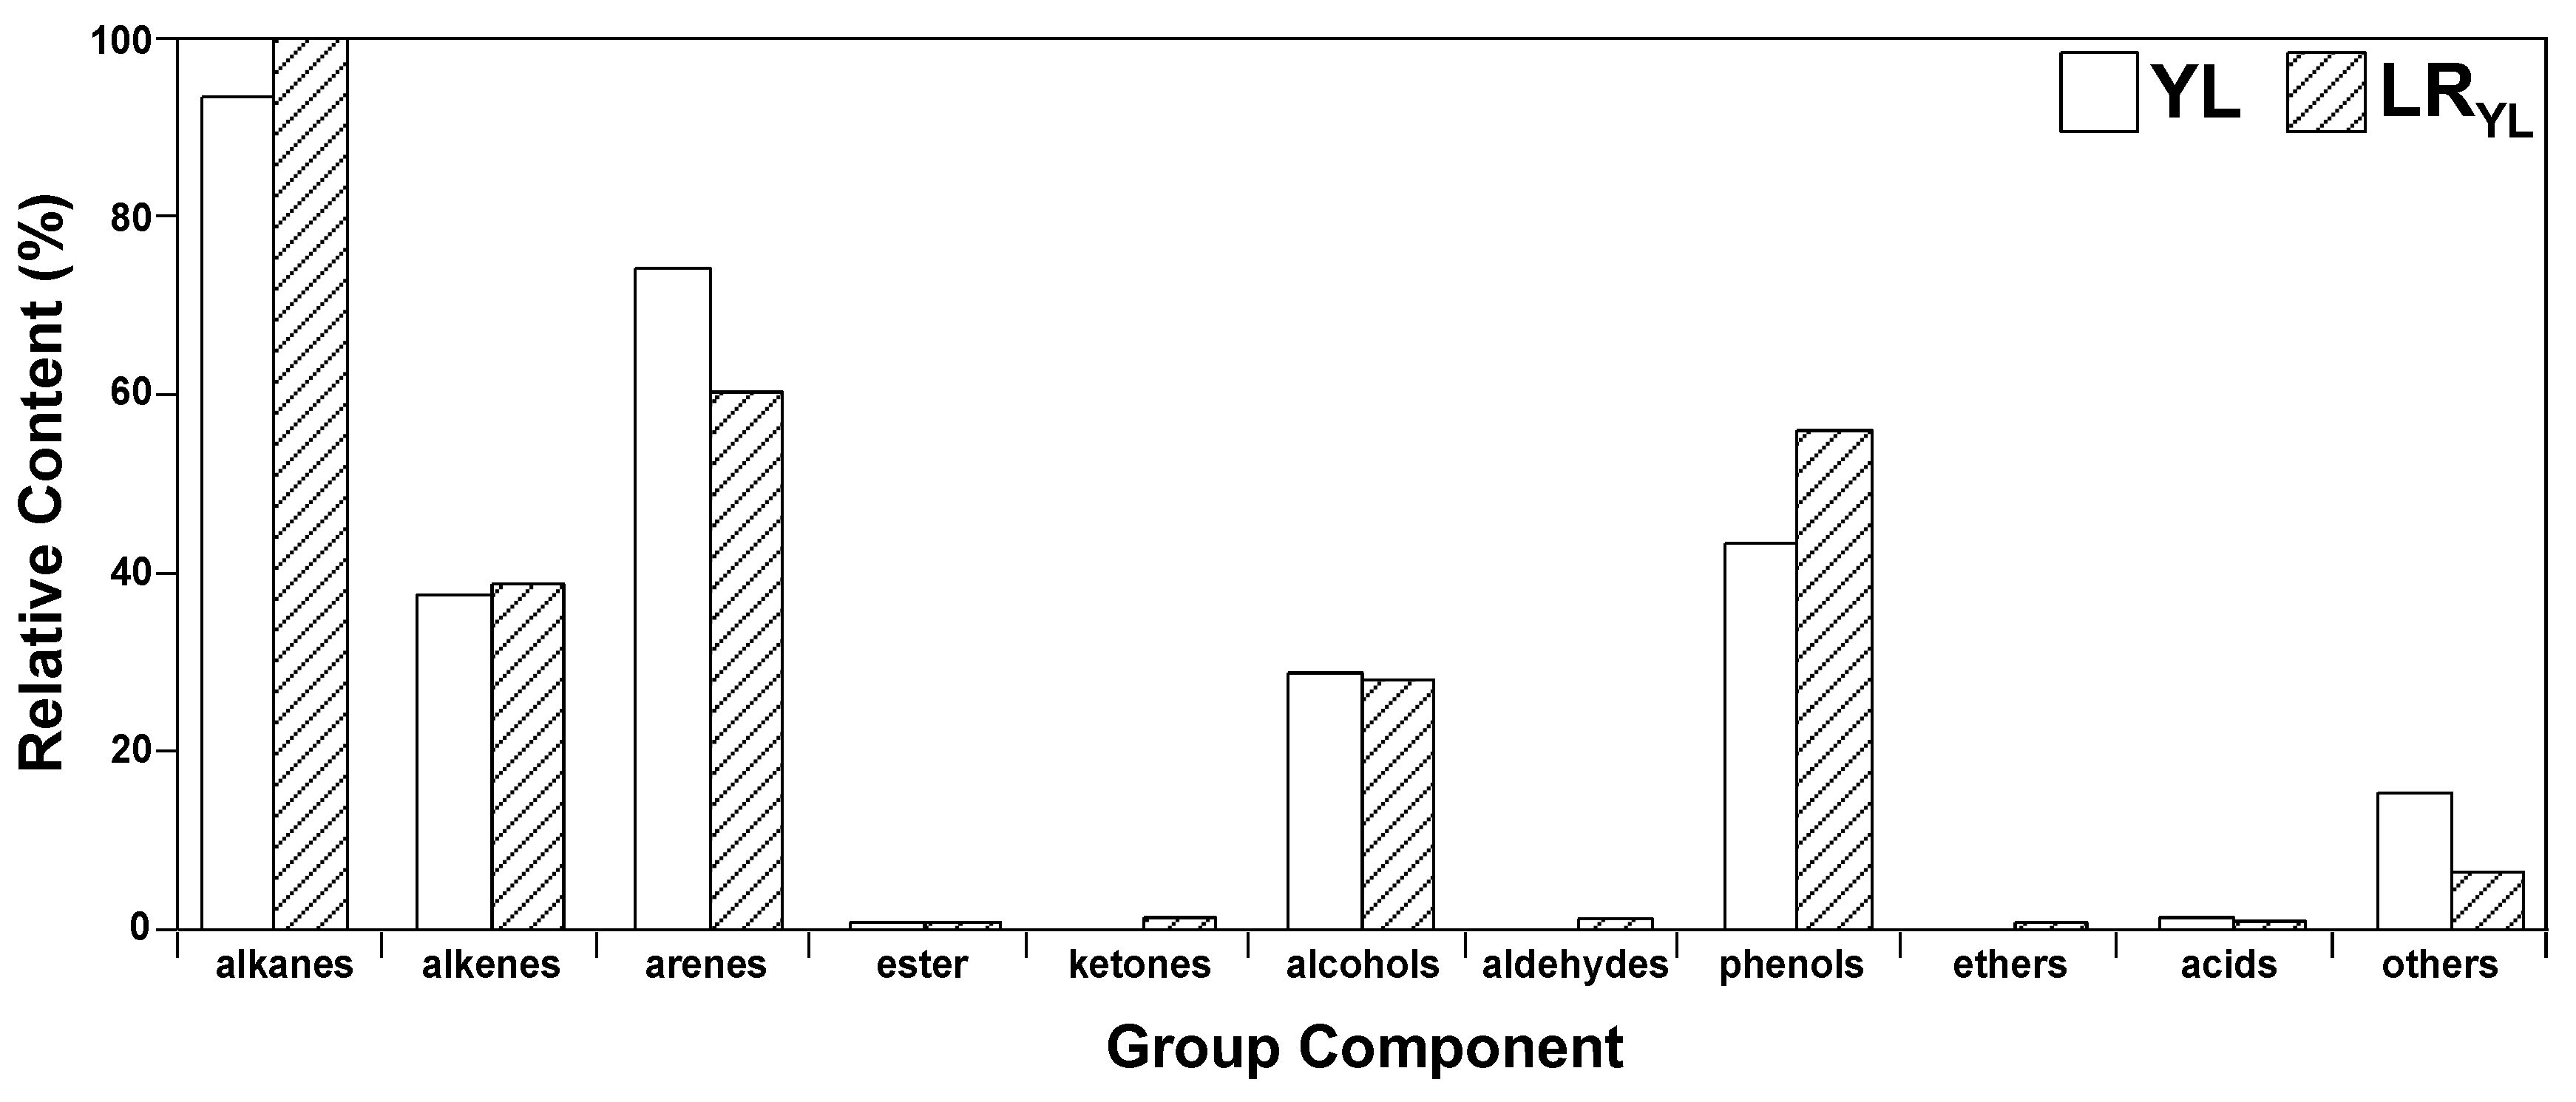
3.4.2. Flash Pyrolysis Products Distribution (GC/MS Results)

Flash pyrolysis products from YL and LRYL at 450 °C were analyzed by TG-FTIR-GC/MS test (Figures S1 and S2). The results showed that 55 organic compounds were detected in the pyrolysis products from YL, and 53 from LRYL (Tables S1–S5). All the compounds can be classified by their group composition into alkanes, alkenes, arenes, oxygen-containing compounds, and other heteroatoms-containing compounds. And the oxygen-containing organic compounds can be subdivided into alcohols, phenols, ketones, ethers, and carboxylic acids.
Figure 9 presents the distribution of the relative content of each group composition from the two coal samples. Hydrocarbons detected by GC/MS in the pyrolysis products of YL and LRYL at 450 °C were mainly alkanes, alkenes, and arenes, with higher relative contents of alkanes of 31.1% and 36.2%, followed by arenes of 27.1% and 22.6%, respectively. The oxygen-containing compounds were mainly alcohols and phenols, with a small difference in the relative content of alcohols and a large difference in phenols (17.6% and 22.1%, respectively), indicating that the process of solvent pretreatment might expose more oxygen-containing groups and bridge bonds, facilitating their conversion to phenolic hydroxyl groups during the pyrolysis process, resulting in more phenolic compounds.
Figure 10 illustrates the possible mechanisms of bond breakage in coal pyrolysis. The core of the basic structure unit of coal mainly consists of aromatic, hydrogenated aromatic, alicyclic, and heterocyclic rings, with alkyl side chains and other small functional groups located at the edges of the basic structure, and each group is connected to the rings by bridge bonds to form the three-dimensional macromolecular network structure. The breakage of chemical bonds and the decomposition of functional groups from coal can produce coke, coal tar, and gaseous products [22,23]. The formation of H2O was associated with the carboxyl and hydroxyl groups. The radical of ·H could be broken off from a carboxyl group and react with ·OH in another carboxyl group to produce water. At a higher temperature, ·H can also react with ·OH in phenols or alcohols to produce water.
The formation of CO2 was also related to the decomposition of the carboxyl group. In addition, a portion of CO2 was generated by the breakage of oxygen-containing groups connected to the aromatic ring. While CO2 can form CO and H2O if it reacts with ·H, the formation of CO was mainly derived from the decomposition of carbonyl groups and might also be associated with the disproportionation of coke with CO2 at a higher temperature (C + CO2 = 2CO).
Moreover, CH3 can be formed by the breakage of –O–CH3 during pyrolysis, which can react with H to form CH4. At a higher temperature, CH3 could also be formed by the breakage of aliphatic C–C, and the CH3 could then react with ·H to form CH4. Of course, small radical fragments can combine with ·H to form other stable gaseous hydrocarbons, such as C2H6 and C3H8. On the other hand, the fragments of larger molecular weight radicals generated by cleavage can combine with ·H to form tar. During this process, the radicals generated by the breakage of aryl ethers and oxygen-containing bridge bonds might react with ·H or·OH to form phenolic or alcoholic compounds.
Moreover, oxygen-containing groups and aliphatic side chains on the macromolecular radicals can also be broken to form aliphatic and aromatic compounds. Undeniably, aromatic groups and aliphatic groups can also react by rearrangement and condensation to produce coal tar and semicoke with a larger molecular weight, while releasing ·H to form H2.

4. Conclusions

Composition and structure characteristics and pyrolysis products distribution of Yinggema lignite (YL) and its solvent-treated residue (LRYL) were analyzed by thermogravimetry–Fourier transform infrared spectrometer–gas chromatography/mass spectrometer (TG-FTIR-GC/MS). Solvent pretreatment could cause the small molecules in the coal to be dissolved and cause some intermolecular forces to be weakened, leading to the Increase of pyrolysis reactivity, while the macromolecular network structure of the coal was not disrupted during the treatment. The main pyrolysis gaseous products from both samples were H2O, CH4, CO2, and CO, and small amounts of NH3. For the flash pyrolysis products at 450 °C, the detectable hydrocarbons by GC/MS were mainly alkanes, olefins, and aromatics, and the tested oxygen-containing compounds were mainly alcohols and phenols. Hence, the formation of pyrolysis products can be facilitated by the solvent pretreatment process.
For sustainable development, we can use a solvent to treat coal. On the one hand, the soluble portion can be obtained by the “extraction effect” and the process might be strengthened by some methods, such as ultrasonic, microwave, ball milling, and so on, and the solvent can also be recycled for reuse. On the other hand, by flash pyrolysis, many chemicals will be produced from the solvent-treated coal, and the chemicals can be separated or converted into high-valued products or intermediates. Thus, the long production line, with high energy consumption and high carbon emissions, for the products or intermediates, might be avoided in the future.

Supplementary Materials

The following supporting information can be downloaded at: https://www.mdpi.com/article/10.3390/su151511760/s1, Figure S1. Total ion flow chromatography of YL; Figure S2. Total ion flow chromatography of LRYL; Table S1. Alkanes detected in YL and LRYL; Table S2. Alkenes detected in YL and LRYL; Table S3. Arenes detected in YL and LRYL; Table S4. Oxygen-containing organic compounds detected in YL and LRYL; Table S5. Other organic compounds detected in YL and LRYL.

Author Contributions

Conceptualization, X.-Y.W.; Methodology, H.K.; Software, T.W. and X.-B.H.; Validation, Y.-Y.M.; Investigation, W.-C.G.; Resources, J.G.; Data curation, H.K. and Y.-Y.M.; Writing—original draft, H.K.; Writing—review & editing, W.-L.M.; Supervision, N.A.; Project administration, X.-Y.W. All authors have read and agreed to the published version of the manuscript.

Funding

The project was supported by the special project for regional collaborative innovation from the Xinjiang Uyghur Autonomous Region (2022E01057), the Scientific Research Program from Xinjiang Energy Co., Ltd. “Composition/structure characteristics and catalytic cracking of organic matter in middle-low rank coal in Xinjiang”, “Composition and structure analysis of low-middle rank coal in Xinjiang and its thermochemical transformation”, and “Testing, identification and analysis of organic matter composition and structure in medium and low rank coal”.

Data Availability Statement

No new data were created or analyzed in this study. Data sharing is not applicable to this article.

Conflicts of Interest

The authors declare no conflict of interest.

References

  1. Kan, H.; Wang, Y.; Mo, W.-L.; Wei, X.-Y.; Mi, H.-Y.; Ma, K.-J.; Zhu, M.-X.; Guo, W.-C.; Guo, J.; Niu, J.-M.; et al. Effect of solvent swelling with different enhancement method on the microstructure and pyrolysis performance of Hefeng subbituminous coal. Fuel 2023, 332, 126066. [Google Scholar] [CrossRef]
  2. Tahmasebi, A.; Yu, J.-L.; Han, Y.-N.; Yin, F.-K.; Bhattacharya, S.; Stokie, D. Study of chemical structure changes of Chinese lignite upon drying in superheated steam, microwave, and hot air. Energy Fuels 2012, 26, 3651–3660. [Google Scholar] [CrossRef]
  3. Rathsack, P.; Kroll, M.-M.; Otto, M. Analysis of high molecular compounds in pyrolysis liquids from a german brown coal by FT-ICR-MS. Fuel 2014, 115, 461–468. [Google Scholar] [CrossRef]
  4. Wang, S.-Q.; Tang, Y.-G.; Schobert, H.-H.; Guo, Y.-N.; Gao, W.-H.; Lu, X.-K. FTIR and simultaneous TG/MS/FTIR study of Late Permian coals from Southern China. J. Anal. Appl. Pyrol. 2013, 100, 75–80. [Google Scholar] [CrossRef]
  5. Hu, X.-B.; Xu, H.; Mo, W.-L.; Fan, X.; Guo, W.-C.; Guo, J.; Niu, J.-M.; Mi, H.-Y.; Ma, Y.-Y.; Wei, X.-Y. Effect of sequential thermal dissolution on structure and pyrolysis characteristics of Naomaohu lignite. Fuel 2023, 331, 125930. [Google Scholar] [CrossRef]
  6. Zhao, X.-Y.; Zong, Z.-M.; Cao, J.-P.; Ma, Y.-M.; Han, L.; Liu, G.-F.; Zhao, W.; Li, W.-Y.; Xie, K.-C.; Bai, K.-F.; et al. Difference in chemical composition of carbon disulfide extractable fraction between vitrinite and inertinite from Shenfu-Dongsheng and Pingshuo coal. Fuel 2008, 87, 565–567. [Google Scholar] [CrossRef]
  7. Zhou, G.-L.; Wu, J.-J.; Miao, Z.-Y.; Hu, X.-L.; Li, X.; Shi, X.; Cai, Z.-D.; Shang, Y.-K. Effects of process paramenters on pore structure of semi-coke prepared by solid heat carrier with dry distination. Int. J. Min. Sci. Technol. 2013, 23, 423–428. [Google Scholar] [CrossRef]
  8. Li, X.; Priyanto, D.-E.; Ashida, R.; Miura, K. Two-stage conversion of low-rank coal or biomass into liquid fuel under mild conditions. Energy Fuels 2015, 29, 3127–3133. [Google Scholar] [CrossRef]
  9. Kong, J.; Wei, X.-Y.; Zhao, M.-X.; Li, Z.-K.; Yan, H.-L.; Zheng, Q.-X.; Zong, Z.-M. Effects of sequential extraction and thermal dissolution on the structure and composition of Buliangou subbituminous coal. Fuel Process. Technol. 2016, 148, 324–331. [Google Scholar] [CrossRef]
  10. Iino, M.; Takanohashi, T.; Ohsuga, H.; Toda, K. Extraction of coals with CS2/N–methyl-2-pyro lidinone mixed solvent at room temperature. Fuel 1988, 67, 1639–1647. [Google Scholar] [CrossRef]
  11. Cooke, N.-E.; Fuller, O.-M.; Gaikwad, R.-P. Ultrasonic extraction of coal. Fuel 1989, 68, 1227–1233. [Google Scholar] [CrossRef]
  12. Xie, X.; Zhao, Y.; Qiu, P.-H.; Lin, D.; Qian, J.; Hou, H.-M.; Pei, J.-T. Investigation of the relationship between infrared structure and pyrolysis reactivity of coals with different ranks. Fuel 2018, 216, 521–530. [Google Scholar] [CrossRef]
  13. Jiang, Y.; Zong, P.-J.; Tian, B.; Xu, F.-F.; Tian, Y.-Y.; Qiao, Y.-Y.; Zhang, J.-H. Pyrolysis behaviors and product distribution of Shenmu coal at high heating rate: A study using TG-FTIR and Py-GC/MS. Fuel 2019, 179, 72–80. [Google Scholar] [CrossRef]
  14. Wu, Z.-F.; Wei, X.-Y.; Mo, W.-L.; Kang, Y.-H.; Zhang, X.-Q.; Shan, X.-K.; Liu, G.-H.; Fan, X. Catalytic hydroconversion of the light residue from Yinggemajianfeng lignite over a solid superacid. Fuel 2022, 310, 122470. [Google Scholar] [CrossRef]
  15. Yu, X.-Y.; Wei, X.-Y.; Li, Z.-K.; Zhang, D.-D.; Zong, Z.-M. Two-step depolymerization of Zhaotong lignite in ethanol. Fuel 2017, 196, 391–397. [Google Scholar] [CrossRef]
  16. He, X.-Q.; Liu, X.-F.; Nie, B.-S.; Song, D.-Z. FTIR and Raman spectroscopy characterization of functional groups in various rank coals. Fuel 2017, 206, 555–563. [Google Scholar] [CrossRef]
  17. Xie, X.; Liu, L.; Lin, D.; Zhao, Y.; Qiu, P.-H. Influence of different state alkali and alkaline earth metal on chemical structure of Zhundong coal char pyrolyzed at elevated pressures. Fuel 2019, 254, 115691. [Google Scholar] [CrossRef]
  18. Zhao, Y.; Liu, L.; Qiu, P.-H.; Xie, X.; Chen, X.-Y.; Lin, D.; Sun, S.-Z. Impacts of chemical fractionation on Zhundong coal’s chemical structure and pyrolysis reactivity. Fuel Process. Technol. 2017, 155, 144–152. [Google Scholar] [CrossRef]
  19. Chen, X.-Y.; Zhao, Y.; Liu, L.; Zhang, L.-Y.; Zhang, Z.; Qiu, P.-H. Evaluation of chemical structure, pyrolysis reactivity and gaseous products of Shenmu coal of different particle sizes. J. Anal. Appl. Pyrol. 2018, 130, 294–304. [Google Scholar] [CrossRef]
  20. Shi, L.; Liu, Q.-Y.; Guo, X.-J.; Wu, W.-Z.; Liu, Z.-Y. Pyrolysis behavior and bonding information of coal—A TGA study. Fuel Process. Technol. 2013, 108, 125–132. [Google Scholar] [CrossRef]
  21. Cai, H.-M.; Liu, J.-Y.; Xie, W.-M.; Kuo, J.-H.; Buyukadaba, M.; Evrendilek, F. Pyrolytic kinetics, reaction mechanisms and products of waste tea via TG-FTIR and Py-GC/MS. Energy Convers. Manag. 2019, 184, 436–447. [Google Scholar] [CrossRef]
  22. Lei, Z.; Cheng, Z.-W.; Ling, Q.; Liu, X.-C.; Cui, P.; Zhao, Z.-G. Investigating the trigger mechanism of Shenfu bituminous coal pyrolysis. Fuel 2022, 313, 122995. [Google Scholar] [CrossRef]
  23. Qiang, L.-Y.; Bai, B.-Y.; Peng, Z.-W.; Zhang, S.-S.; Chang, H.; Su, M.; Xu, L.; Ma, X.-X. Research on the relationship between the structure and pyrolysis characteristics of pretreated Shendong coal. Fuel 2021, 305, 121515. [Google Scholar] [CrossRef]
Figure 1. Pretreatment process of Yinggema lignite.
Sustainability 15 11760 g001
Figure 2. Infrared spectra of two samples.
Sustainability 15 11760 g002
Figure 3. FTIR fitting results of the two samples.
Sustainability 15 11760 g003
Figure 4. Distribution of the infrared structural parameters of the two samples (a) Changes of carboxyl and phenolic hydroxyl groups; (b) Changes of aliphatic and aromatic hydrogen; (c) Changes of internal characteristics of aliphatic and aromatic structures.
Sustainability 15 11760 g004
Figure 5. TG (a) and DTG (b) profiles of samples.
Sustainability 15 11760 g005
Figure 6. Thermogravimetric fitting diagram of two samples.
Sustainability 15 11760 g006
Figure 7. TG-FITR diagram of YL (a) 3D infrared spectrum; (b) TG-FTIR spectrum for volatiles at 450 °C; (c) absorbance of volatiles with the increasing of temperature; and (d) yield of emissions from the pyrolysis of YL.
Sustainability 15 11760 g007
Figure 8. TG-FITR diagram of LRYL (a) 3D infrared spectrum; (b) TG-FTIR spectrum for volatiles at 450 °C; (c) absorbance of volatiles with the increasing of temperature; and (d) yield of emissions from the pyrolysis of LRYL.
Sustainability 15 11760 g008
Figure 9. Distribution of group component of YL and LRYL (450 °C).
Sustainability 15 11760 g009
Figure 10. Possible broken mechanisms of the coal sample. * represents free radical fragments.
Sustainability 15 11760 g010
Table 1. Proximate and ultimate analyses (wt %) of samples.
SampleProximate AnalysisUltimate AnalysisH/CO/C
MadAadVadFCad #CHNSO #
YL7.1210.4949.2033.1971.895.170.880.7421.320.860.22
LRYL6.796.5343.9142.7757.634.262.70.5434.871.030.53
# By difference.
Table 2. Relative content of functional groups for the two samples.
Wavenumber (cm−1)Functional GroupContent (Area %)
YLLRYL
3600–3500OH-π1.35452.4973
3500–3350Self-associated OH9.376212.0334
3350–3260OH-ether O7.03709.4466
3260–3170Cyclic OH0.85771.5695
2950–2930Asymmetric aliphatic –CH30.27270.3891
2930–2900Asymmetric aliphatic –CH21.48971.2416
2900–2870Aliphatic –CH0.46570.1348
2870–2850Symmetric aliphatic –CH20.98631.1413
1700Carboxylic acids C=O10.32211.6679
1650Conjugated C=O17.86293.9661
1600–1480C=C in ARs11.60049.9983
1480–1400Asymmetric –CH3, –CH28.90355.1319
1400–1240Symmetric –CH312.02579.2693
1240–1160Phenols C–OH8.045620.9652
1160–1090Grease C–O3.208114.5576
1090–1030Alkyl ethers3.93858.1450
900–860Five adjacent H deformation (1H)0.11100.1306
860–810Four adjacent H deformation (2H)0.79960.1693
810–750Three adjacent H deformation0.77130.2125
750–720Two adjacent H deformation0.57150.3327
Table 3. Semiquantitative calculation of FTIR spectra for YL and LRYL.
IndexIndex CalculationAssignment
Ia1Acaboxyl/AtotalCarboxyl content
Ia2Aphenolic hydroxyl/AtotalPhenolic hydroxyl content
Ia3Acarboxyl/Aphenolic hydroxylRelative change of carboxyl to phenolic hydroxyl
Ib1Aaliphatic hydrogen/AtotalAliphatic hydrogen content
Ib2Aaromatic hydrogen/AtotalAromatic hydrogen content
Ib3Aaliphatic hydrogen/Aaromatic hydrogenRelative change of aliphatic to aromatic structure
Ic1ACH2/ACH3Length and branching degree of aliphatic side chain
Ic2Aaromatic hydrogen/Aaromatic ring c=cCondensation degree of aromatic ring
Ic3A1H and 2H/Aaromatic hydrogenProportion of the aromatic rings with high substitution degree in the entire aromatic ring system
Table 4. Pyrolysis characteristic parameters of the two samples.
SampleTi (°C)Tf (°C)Tmax (°C)ΔT1/2 (°C)(dM/dT)max(dM/dT)meanD
YL20070045067−0.1815−0.048121.44 × 10−9
LRYL14074044066−0.1716−0.049432.08 × 10−9
Ti: initial volatile release temperature; Tmax: the maximum volatile release rate temperature; Tf: the temperature at the end of the main pyrolysis stage (Tf = 2Tmax − Ti); (dM/dt)max: the maximum volatile release rate; ΔT1/2: the temperature interval corresponding to (dM/dt)/(dM/dt)max = 1/2; (dM/dt)mean: the mean volatile release rate.
Table 5. Chemical bond assignment for DTG profile.
Temperature Range (°C)Possible OriginBond Energy (kJ·mol−1)
<300Release of bonded water and decomposition of carboxylic acid<150
300–420Breakage of bonds between Cal and O, S and N, and S–S150–230
420–550Breakage of bonds between Cal and Cal, H, O, and Car–N210–320
550–650Breakage of bonds between Car and Cal, O, and S300–430
650–740Decomposition of carbonates in coals to generate CO2>400
>700Polycondensation of Aromatic rings to generate H2
Disclaimer/Publisher’s Note: The statements, opinions and data contained in all publications are solely those of the individual author(s) and contributor(s) and not of MDPI and/or the editor(s). MDPI and/or the editor(s) disclaim responsibility for any injury to people or property resulting from any ideas, methods, instructions or products referred to in the content.

