Article

Urban Planning and Green Landscape Management Drive Plant Diversity in Five Tropical Cities in China

1
Sanya Nanfan Research Institute of Hainan University, Hainan Yazhou Bay Seed Laboratory, Sanya 572025, China
2
Collaborative Innovation Center of Nanfan and High-Efficiency Tropical Agriculture, School of Tropical Agriculture and Forestry, Hainan University, Haikou 570228, China
3
School of Biological Sciences, University of Hong Kong, Hong Kong, China
*
Author to whom correspondence should be addressed.
Sustainability 2023, 15(15), 12045; https://doi.org/10.3390/su151512045
Submission received: 3 July 2023 / Revised: 2 August 2023 / Accepted: 3 August 2023 / Published: 7 August 2023
(This article belongs to the Special Issue Urban Forests, Plant Systematics and Germplasm Innovation)

Abstract

:
Green space is essential in urban areas to maintain, and improve human well-being. To better understand the impact of environmental and socioeconomic changes on the sustainability of tropical urban green space landscapes, work is needed to explore the patterns of plant diversity and its drivers in urban green spaces. We explore urban floristic diversity patterns based on samples from 826 urban functional units located in five cities in the tropical coastal region of China. Field surveys were conducted to obtain data on plant diversity, land use types, socioeconomic characteristics, and environmental characteristics within these units. Plant diversity within the cities varied significantly among land-use types, with high-rise housing, parks, and universities exhibiting higher diversity. The diversity of cultivated plant species and the regional economy showed a significant positive correlation (β coefficient = 0.15, p-value < 0.05), while an increase in the diversity of spontaneously growing plant species and native species was linked to building age (β coefficient = 0.12, p-value < 0.01; β coefficient = 0.13, p-value < 0.01). Management also affected plant species diversity, with watering and maintenance frequency having a positive association. Urban plant diversity patterns result from a combination of multiple factors, and different drivers affect native vs. non-native plant diversity Socio-economic factors are the primary driver of urban plant diversity patterns, as space management and maintenance determine what can grow in different areas. This study has important practical significance for policymakers and managers in developing and managing urban green spaces more sustainably.

1. Introduction

Urban plant diversity is an important element of urban ecology, social function, and the well-being of residents, serving as the green infrastructure and life support system of urban ecosystems [1,2,3]. However, rapid urbanization has resulted in environmental changes, particularly through altering land use patterns and the introduction of alien plant species, consequently reducing the provision of urban ecosystem services and homogenizing the species composition of urban areas [4,5]. Urban green spaces are important pieces of ecological infrastructure, and provide a resource for mitigating urbanization issues such as heat reduction and brownfield space restoration [6,7], mitigating air pollution through the adsorptive function of plants [8], sequestering carbon [9], etc. Although there is growing research on urban plant diversity in temperate regions, little is known about the distribution patterns and driving mechanisms of urban plant diversity in the global tropics [10], particularly in the Chinese tropics where urban plant diversity has received little attention [11]. To conserve urban plant diversity, maintenance, and sustainability, it is essential to understand the spatial distribution patterns of plant diversity, including cultivated and spontaneously growing plant species, native and non-native plant species, and the effects of natural and anthropogenic activities [12,13]. Previous studies have shown that plant diversity at the regional scale is often correlated with temperature, precipitation, wind speed, solar radiation, and elevation [14,15]. Our study aimed to investigate whether these environmental factors have the same effect on each UFU across tropical Chinese cities. Therefore, this study investigated the spatial distribution patterns of plant diversity and their drivers in five tropical regions of China, namely Zhanjiang, Haikou, Danzhou, Sanya, and Yazhou.
Urban green spaces can include a combination of natural and cultivated plants. Cultivated species, including trees, shrubs, and groundcover herbaceous species, are typically cultivated in nurseries and planted in urban green spaces, thereby requiring significant resources such as time and money [16,17,18]. Conversely, spontaneously germinating plants (that are not deliberately planted or sowed) are increasingly perceived as an important constituent of urban vegetation [19]. The emergence of spontaneously growing plant species does not require economic investments, and provides valuable ecosystem services that benefit urban residents [20]. These services include the regulation of microclimates, and the provision of plant resources for pollinators [21,22], including more native species [23]. Moreover, plants which are good at spreading and can both grow spontaneously and exploit many conditions for growth, can adapt quickly to urbanization [24]. A better comprehension of the drivers of diverse types of plant diversity in urban regions could enhance the management and conservation of biodiversity in urban areas worldwide and provide a solid foundation for achieving sustainable cities.
This study integrates remote sensing techniques and field surveys to collect data pertaining to plant diversity, land use types, socio-economic factors, and environmental conditions within the study area. The primary objective is to address the following inquiries: (1) What is the spatial distribution pattern of plant diversity in tropical cities? Are there differences in the distribution of different categories of plants (cultivated and spontaneously growing, native and non-native) across different areas and types of urban green spaces? (2) To what extent do natural factors and human activities impact plant diversity in tropical cities? Are there identifiable correlations between environmental factors, land use types, socio-economic factors, and plant diversity? (3) How can urban plant diversity be effectively managed to optimize the provisioning of urban ecosystem services and promote sustainable urban development? We aim to provide a foundation for informed decision-making in the planning, management, and conservation of urban green spaces. Furthermore, the experiences and lessons garnered from this research will facilitate conservation and management in urban areas worldwide.

2. Materials and Methods

2.1. Study Area

The study area encompasses five cities within the tropical coastal region of China, namely Zhanjiang (109.67°~110.97°, 20.22°~21.95°), Haikou (110.12°~110.71°, 19.53°~20.08°), Danzhou (108.93°~109.77°, 19.18°~19.87°), Sanya (108.94°~109.81°, 18.16°~18.62°), and Yazhou (108.93°~109.80°, 18.15°~18.62°) (Figure 1). While the four cities of Zhanjiang, Haikou, Danzhou, and Sanya are situated in varying latitudinal gradients, Yazhou and Sanya fall within the same latitudinal region. Yazhou was selected due to the construction of the Yazhou Bay Science and Technology City, which has led to rapid urbanization, different socio-economic conditions, and different green management levels when compared to the other four cities. The five cities are located on the southern coast of mainland China and the northern, northwestern, and southern coasts of Hainan Province, respectively. The vegetation types in these regions are predominantly evergreen broad-leaved forests, and the climate is regulated by the oceanic climate throughout the year. Selection of these specific cities was driven by their representation of the tropical coastal regions, diverse latitudinal gradients, and the presence of distinctive characteristics related to urban green spaces. By focusing on these cities, our research aims to provide insights into the management and conservation of urban green areas in tropical coastal environments.

2.2. Data Collection

2.2.1. Field Survey

Field surveys of plant species were conducted during the growing seasons (June–October) of 2021 and 2022. During this period, plant growth and abundance is highest, and many plants are flowering or fruiting, which makes it easier to identify each species. Sampling areas were established in the five study areas using stratified random sampling, based on urban functional units (UFUs) from previous studies [25,26] as shown in Figure 1. The total area of each city was divided into differently sized grids to ensure the same number of points could be representatively placed in each city. In order for the results of the study to be statistically significant, we included at least 100 functional units in each city. Zhanjiang was divided into 0.65 × 0.65 km grids, Haikou into 1 × 1 km grids, Danzhou into 0.5 × 0.5 km grids, Sanya into 2 × 2 km grids, and Yazhou into 0.5 × 0.5 km grids (Figure 1).
We selected representative UFUs in each grid (Figure 1), each of which had one major function and one dominant land-use type, but also varied in green space coverage, maintenance strategies, and socioeconomic characteristics [27]. To select UFUs, we focused on the most common land use types in each grid. For example, in Sanya Yalong Bay, commercial and residential are the most common land use types. Therefore, we selected UFUs such as resort hotels and food plazas, including the Phoenix Island Resort (Figure 2(A1)). In addition to common land use types, we also selected UFUs with unique cultural significance and long histories, such as the Bell Tower in Haikou (Figure 2(B1)), Yazhou Ancient City (Figure 2(C1)), and Shuinan Village (Figure 2(A2)), one of the four major villages in Hainan. We also considered UFUs with an important ecological significance, function, or value, such as Zhanjiang Southland Tropical Garden (Figure 2(B2)) and Danzhou Huaguoshan Park (Figure 2(C2)). This study uses the U.S. urban forestry classification system [28] and the UFU classification from previous studies in China [29,30]. To avoid duplicate sampling, we ensured that all major land use types were sampled, and each UFU represented only one major land use type [29].
During the field survey, we established 1–3 plant quadrats for each UFU according to the size of the green area of each UFU. These included large tree plots (20 m × 20 m) in which five understory-shrub plots (5 m × 5 m) and five herbaceous undergrowth plots (1 m × 1 m) were located at the corners and centers of the tree plots (Supplementary Materials Annex S2). Trees were defined as woody perennials with a single main stem and a distinct canopy, while shrubs were defined as perennial woody plants without a distinct trunk or canopy, usually ranging from 0.5–5 m in height [31,32]. It should be noted that the same plant may belong to different categories of trees, shrubs, or herbs depending on its morphological characteristics. To provide a visual representation of the plants observed in tropical cities during our field survey, we include a collection of characteristic plant photographs in Figure 2.
During our field surveys, we collected information on species (species, abundance, tree height, DBH, crown width, to understand structure of plots). We identified each species manually, utilizing the Aiplants application (www.aiplants.cn, accessed on 1 June through 31 October, 2021 and 2022) for photo identification if necessary. In cases where photo-identification was not possible, we took photos from multiple angles and sought help from plant taxonomists. To ensure accuracy, we cross-checked all species with images from the Chinese Natural Herbarium (www.cfh.ac.cn, accessed on 1 June through 31 October, 2021 and 2022). Each species was classified as either cultivated or spontaneously growing, with some plants being both depending on the UFU. For species whose establishment could not be directly determined, we consulted with the green space manager for confirmation. We further subdivided the plants into native and non-native species based on the Flora of Hainan [33], Exotic Plants of China [34], and the List of Invasive Plants of China [35].

2.2.2. Environment Variables

We selected data from the 30 s resolution Bioclim2 dataset, which includes four variables (annual mean temperature, max temperature of warmest month, min temperature of coldest month, and annual precipitation) from the WorldClim database (http://www.worldclim.org, accessed on 12 April 2023), as well as the solar radiation, wind speed, and elevation dataset at the same resolution. The data presented in these datasets represent a 30-year average from 1970–2000 [36]. We processed the data using Arcgis 10.8 software and extracted them into each UFU, resulting in seven environmental variables: annual mean temperature, max temperature of warmest month, min temperature of coldest month, annual precipitation, monthly mean solar radiation, monthly mean wind speed, and elevation.

2.2.3. Socioeconomic Variables

We differentiated UFUs into two levels of detail: primary and detailed UFUs, as outlined in Supplementary Materials Annex S1 (refer to Section 2.2 for details on the classification process). To evaluate the socioeconomic characteristics of UFUs, we employed a set of indicators, including house prices, building age, population density, and maintenance factors (such as trimming frequency, fertilization, and watering). House prices were sourced from either the sample field surveys or house sale websites (https://anjuke.com, https://www.58.com, or https://esf.fang.com, accessed on 1 June through 31 October, 2021 and 2022) for the year of the sample survey. We gathered information on the age of construction through consultation with administrative sources and maintenance personnel. We used the methods introduced by Wang et al., 2015 [29] and Nizamani et al., 2021 [30] to ascertain the number of dwellings per building and floor, and to estimate the population in each UFU by multiplying these numbers. The population was then divided by the area of each UFU (in km2) to obtain the population density (in thousands of persons per km2). Trimming (times/year), fertilization (times/year), and watering frequency (times/year) were selected as maintenance measures for urban green spaces, and are likely to relate to pesticide and herbicide use. We collected data on these measures through interviews with five local maintenance staff members in each UFC, and averaged their responses to minimize memory errors.

2.3. Data Analysis

We used data from five distinct cities and regions to analyze the drivers of plant species richness for each UFU using a generalized linear mixed-effects model. To ensure consistency among variables, we standardized and centered the independent variables following Gao et al., 2023 [37]. Additionally, we avoided covariance between variables by retaining only one variable in the model when the correlation coefficient between independent variables was greater than 0.7. We checked the variance inflation factor (VIF) of the model and removed any variables with a VIF greater than 5 until the VIF of all variables was ≤5 [38,39,40]. With urban ID as a random effect, fixed effects were categorized into three groups: land-use type, natural environment variables such as mean annual temperature, hottest month temperature, coldest month temperature, annual precipitation, mean monthly solar radiation, mean monthly wind speed, and elevation, and socioeconomic characteristics variables that included house price, population density, building age, and three variables associated with green space management and maintenance (trimming, fertilization, and watering). We fitted the model using REML’s R package “lme4” [41] and conducted t-tests using Satterthwaite’s method [‘lmerModLmerTest’]. Finally, we selected the best model based on the Akaike Information Criterion (AIC).
In order to demonstrate and compare the distribution of plant species numbers among various types of primary and detailed UFUs across different cities, we utilized the R package “ggplot 2” [42] to create two sets of box plots. The first set depicted the number of cultivated, spontaneously growing, and total species within each type of UFU (Figure 3), while the second set showed the number of native and non-native species (Figure 4). All statistical analyses were conducted using R 4.1.2 software.

3. Results

3.1. Major UFUs Distribution

A total of 826 UFUs were selected from five cities or regions, as presented in Supplementary Materials Annex S1. Given the layout of UFUs in the cities, we tried to reflect the overall proportions of each dominant function through the selection of UFUs for sampling. Five primary UFU types were identified, which included traffic areas in Zhanjiang (47, 26.3%), institutional business service areas in Haikou (63, 33.7%), residential areas in Danzhou (74, 46.3%), residential areas in Sanya (39, 26.0%), and institutional business service areas in Yazhou (49, 32.7%) (Supplementary Materials Annex S1). Additionally, we identified 13 detailed UFU types, with the most prevalent being road UFUs in Zhanjiang (44, 24.6%), high-rise residential UFUs in Haikou (42, 22.5%), high-rise residential UFUs in Danzhou (69, 43.1%), commercial area UFUs in Sanya (35, 23.3%), and high-rise residential UFUs in Yazhou (26, 17.3%) (Supplementary Materials Annex S1).

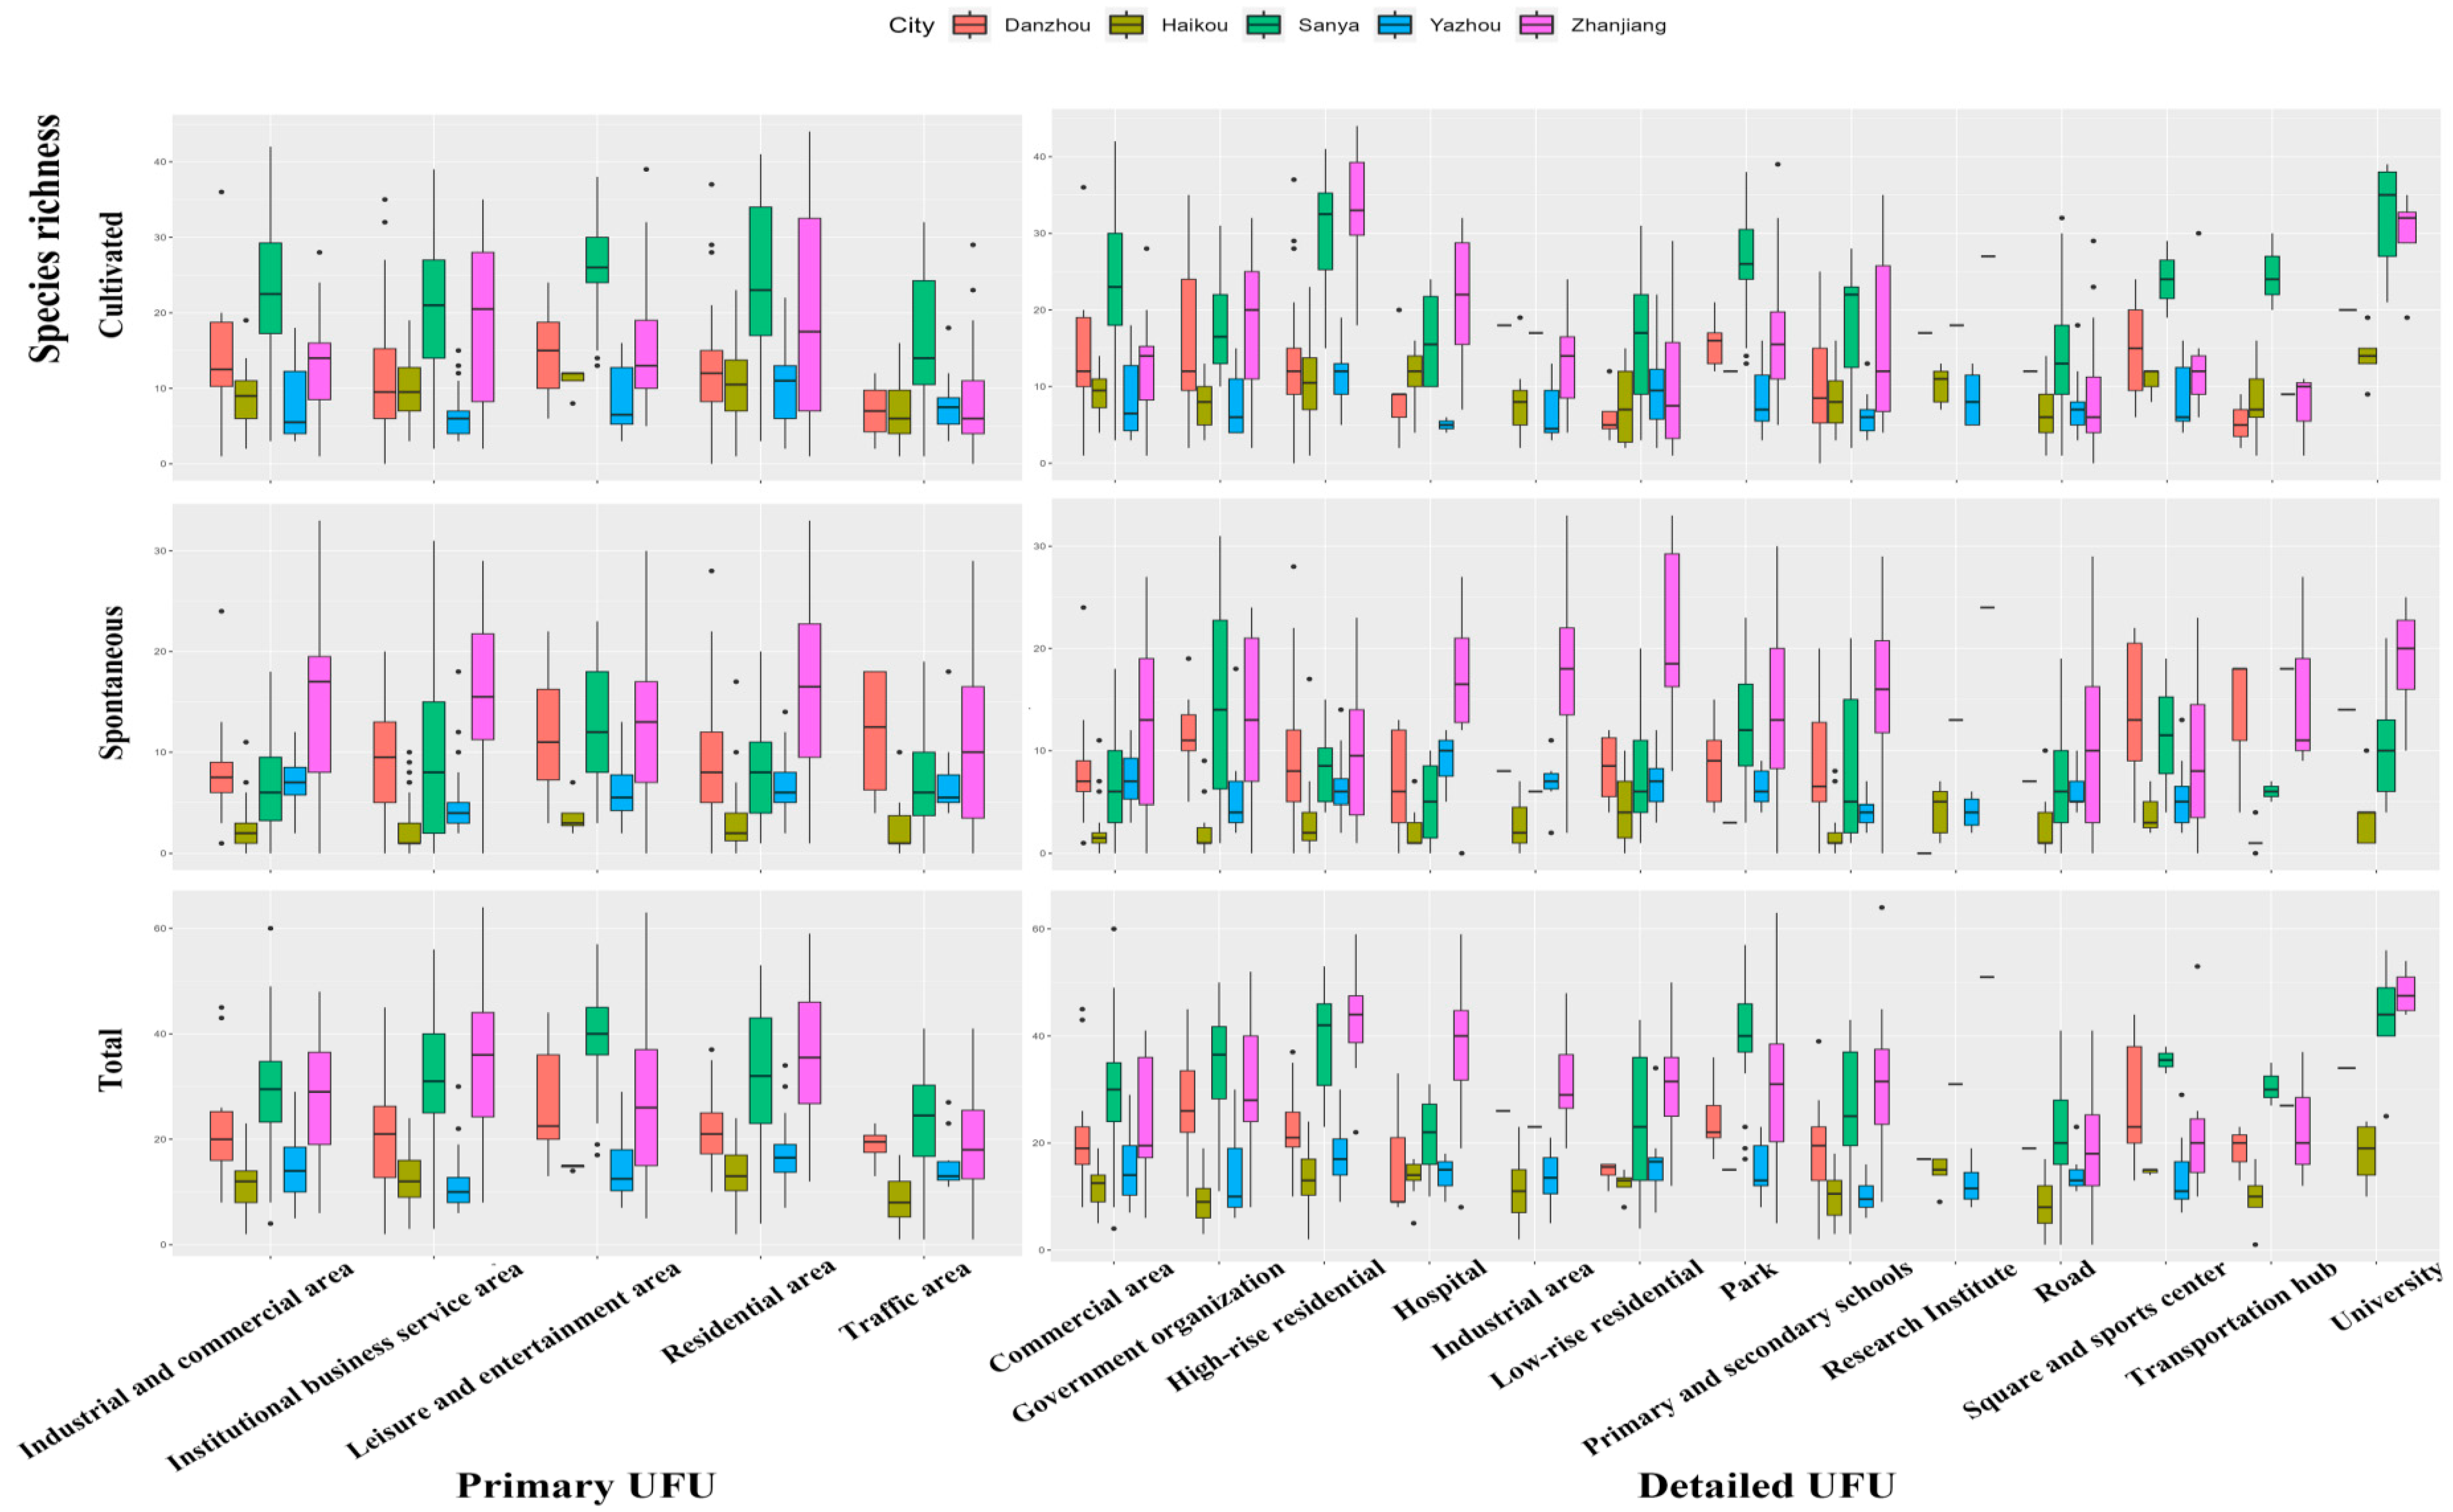
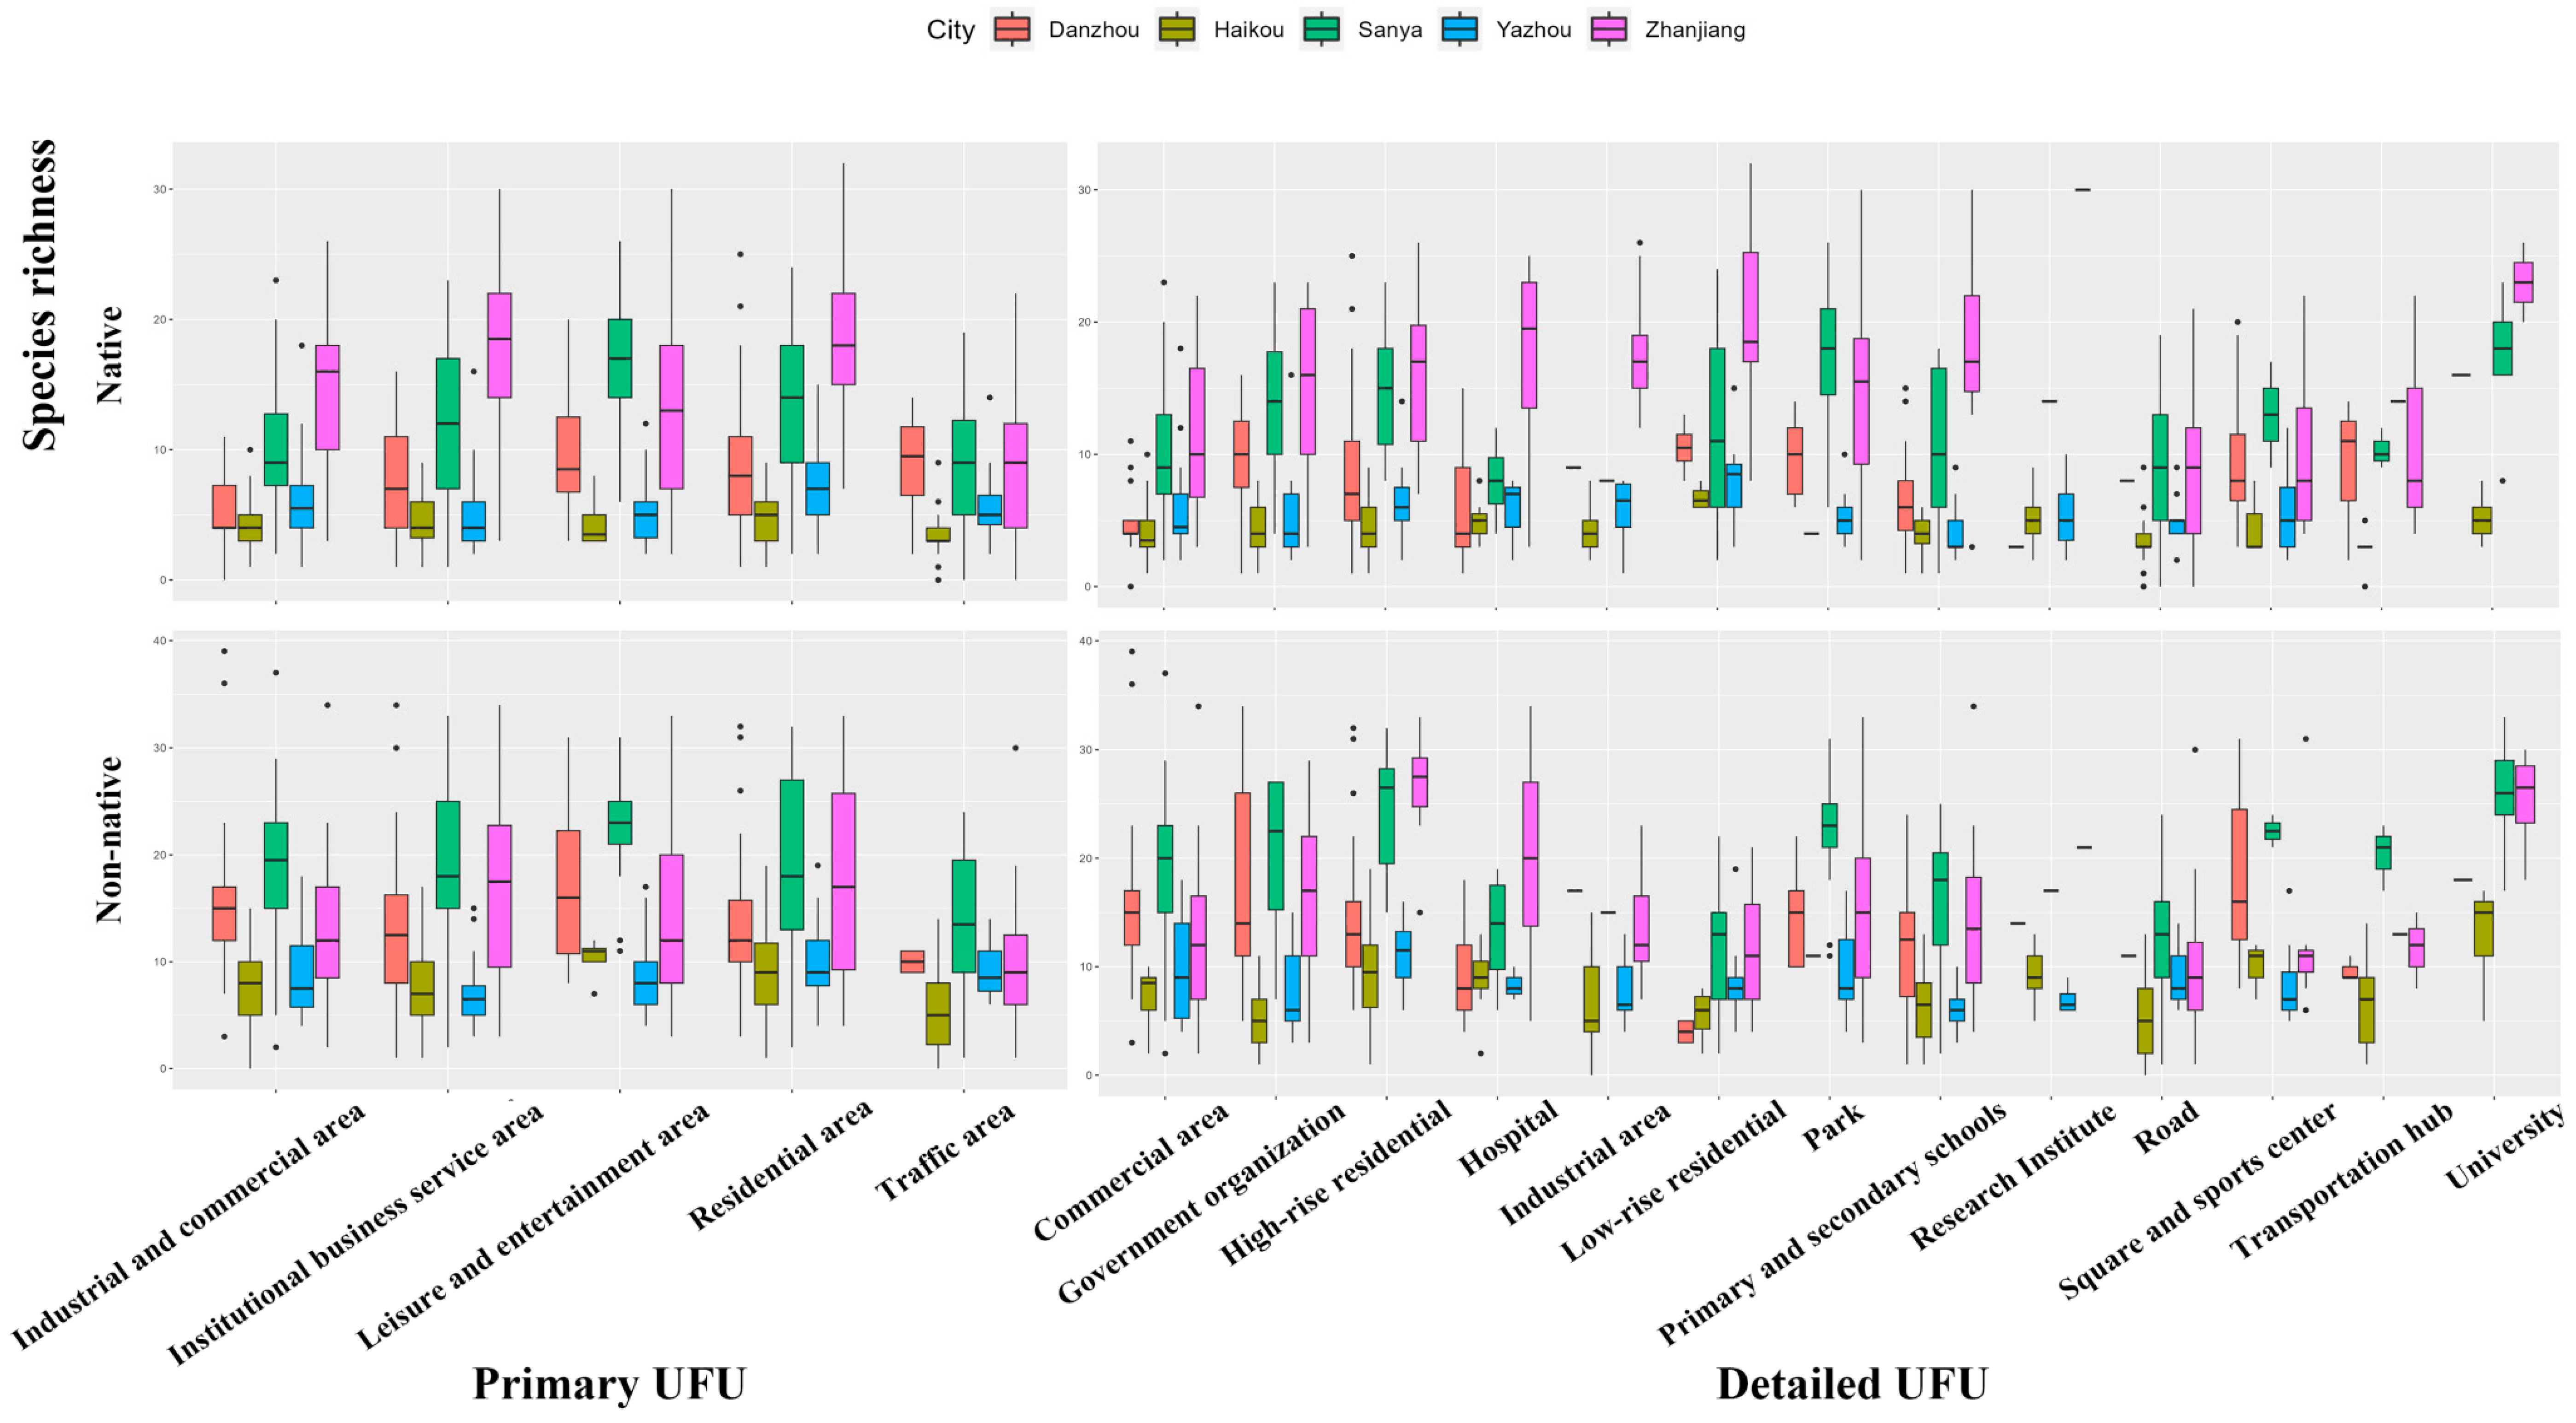
3.2. Plant Diversity Distribution Patterns

The mean and standard deviation (NAVG±SD) of species number within each type of urban UFU or the total number of species occurring within each type of urban UFU (N) are used to express the specific richness values.
Zhanjiang had the highest overall species richness in the Institutional Business Service Area–Institute category and Institutional Business Service Area–University category (N = 51 and NAVG±SD = 48.25 ± 4.65, respectively). Sanya had highest species richness in the Institutional Commercial Service Area–University category (NAVG±SD = 42.8 ± 10.38) and Recreation Area–Parks category (NAVG±SD = 39.57 ± 9.5). As for cultivated species, Danzhou had highest species richness in the Residential Area–High-Rise Residential category (NAVG±SD = 33.17 ± 7.4), followed by in the Institutional Commercial Service Area–University category (NAVG±SD = 32 ± 6.93). Conversely, Yazhou demonstrated the lowest cultivated species richness among the five cities, especially in the Residential Area–High-Rise Residences category (NAVG±SD = 11.38 ± 3.69). Zhanjiang had highest richness of spontaneously growing plant species, predominantly in the Institutional Commercial Service Area–Institutional category (N = 24) and the Residential Area–Low-Rise Residential category (NAVG±SD = 21.28 ± 7.84). Haikou had the lowest spontaneously growing plant species richness, predominantly in the Residential Area–Lower Residential Areas category (NAVG±SD = 4.5 ± 3.84) (Figure 3, Supplementary Materials Annex S4).
Zhanjiang had the highest native species richness, especially in the Institutional Business Service Area–Institute category (N = 30) and Institutional Business Service Area–University category (NAVG±SD = 23 ± 2.24). Following this, Sanya had high native species richness in the Recreation Area–Parks category (NAVG±SD = 17.35 ± 5.03). Haikou recorded the lowest native species richness, especially in the Residential Area–Low-Rise Residential category (NAVG±SD = 6.75 ± 0.83). Zhanjiang also had the highest non-native species richness, predominantly in the Residential Area–High-Rise Residential category (NAVG±SD = 26.75 ± 4.58) and Institutional Commercial Service Area–University category (NAVG±SD = 25.25 ± 4.55). Yazhou had the lowest non-native species richness, mainly in the Residential Area–High-Rise Residential category (NAVG±SD = 11.25 ± 2.97) (Figure 4, Supplementary Materials Annex S4).
Zhanjiang and Sanya had a higher total number of species than the other three cities (Figure 3). Although some differences in species richness were observed among the five cities, certain trends emerged. Institutional commercial service areas such as universities, and residential areas with high-rise residences, tended to have more cultivated species, while spontaneously growing plant species were typically concentrated in residential areas with low-rise residences and transportation areas, such as transportation hubs. Interestingly, residential areas with low-rise housing were identified as a hotspot for native plant species diversity, whereas residential areas with high-rise housing tended to host more non-native species.
Figure 3. Boxplots of cultivated, spontaneously growing, and total plant species number for each type of primary UFU and detailed UFU. Black dots represent maximum and minimum recorded values.
Sustainability 15 12045 g003
Figure 4. Boxplots of native and non-native plant species number for each type of primary UFU and detailed UFU. Black dots represent maximum and minimum recorded values.
Sustainability 15 12045 g004

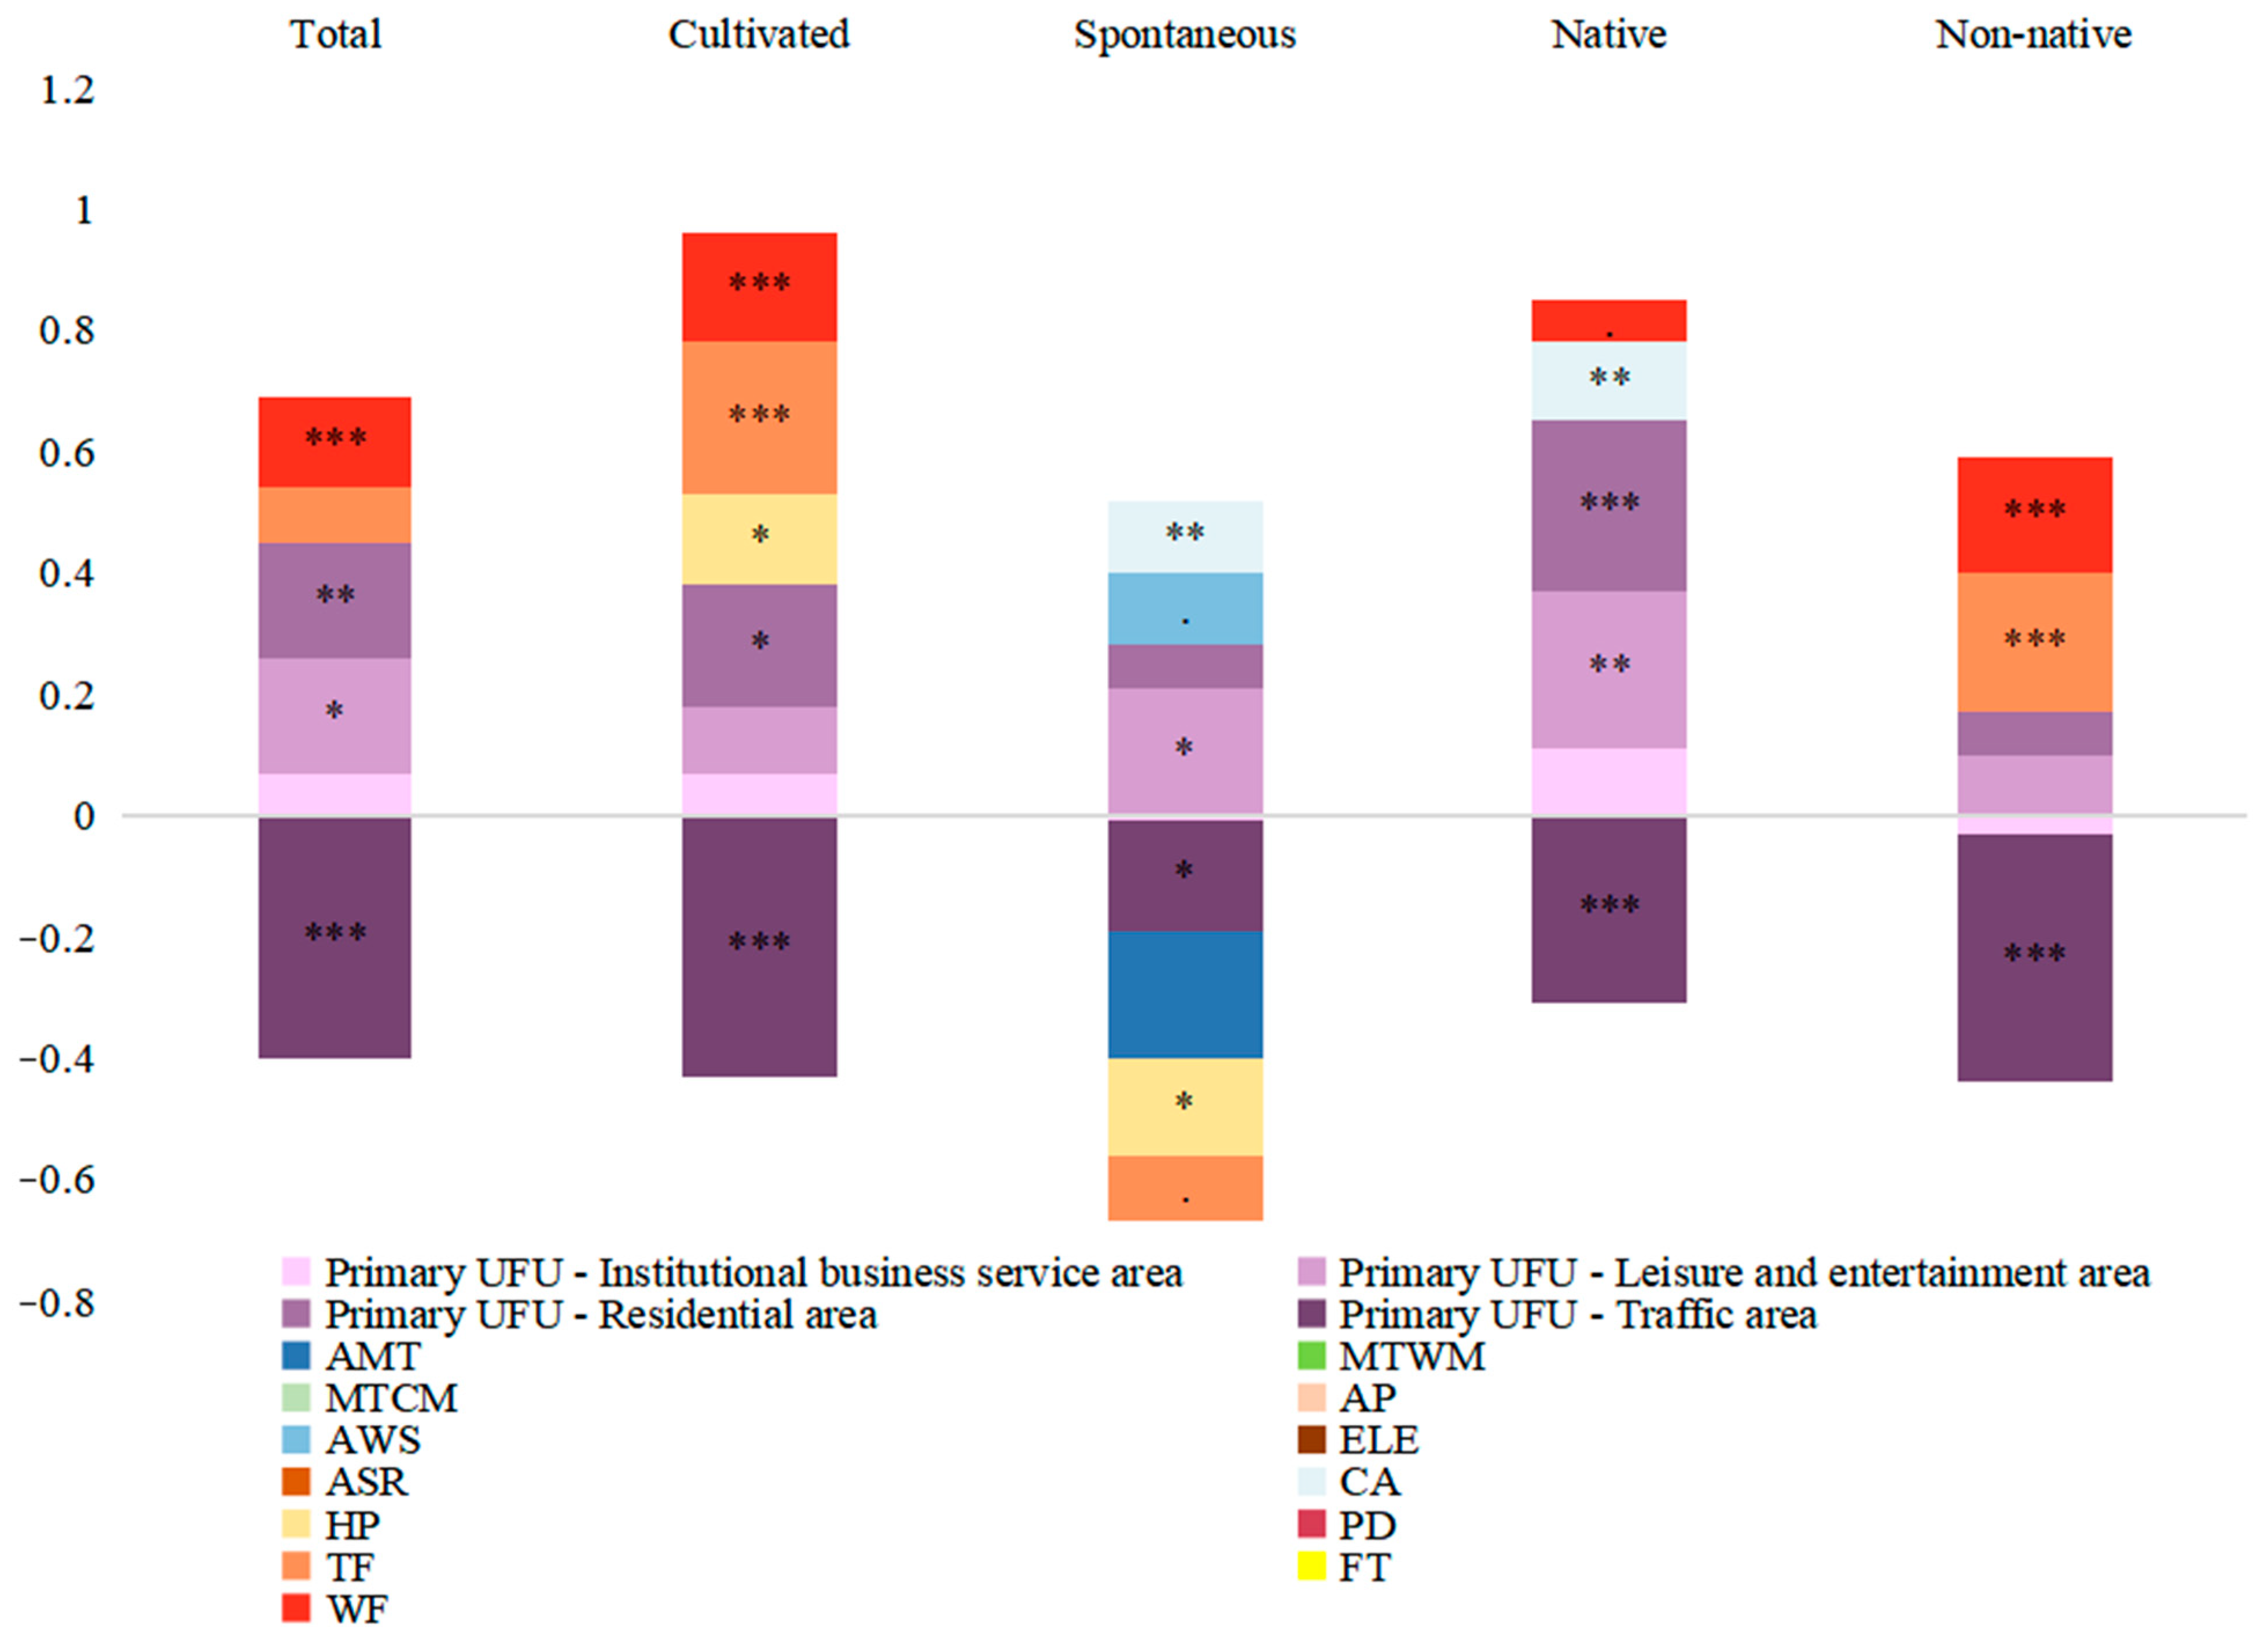
3.3. The Factors Affecting Urban Plant Diversity

Generalized linear mixed-effects models show significant differences in plant diversity across various primary UFUs (Table 1, Figure 5). The diversity of total species number in residential and recreational areas was significantly higher than that of industrial and commercial areas, while the diversity of total species number in transportation areas was significantly lower than that of industrial and commercial areas (Table 1, Figure 5). Total species richness was influenced by land use (i.e., type of UFU) and had a significantly high positive correlation with watering frequency (β coefficient = 0.15, p-value < 0.001) (Table 1, Figure 5). Cultivated species richness was jointly influenced by land use, house price, trimming frequency, and watering frequency, and was significantly and positively correlated with house price (β coefficient = 0.15, p-value < 0.05), particularly regarding trimming frequency and watering frequency (Trimming: β coefficient = 0.25, p-value < 0.001; watering: β coefficient = 0.18, p-value < 0.001) (Table 1, Figure 5). Spontaneously growing plant species richness was influenced by land use and significantly positively correlated with years of establishment (β coefficient = 0.12, p-value < 0.01), but negatively correlated with house prices (β coefficient = 0.16, p-value < 0.05) (Table 1, Figure 5), likely due to higher maintenance costs to “remove weeds”. The abundance of native and non-native species was also influenced by land use, where the abundance of native species was mainly related to the year of establishment (β coefficient = 0.13, p-value < 0.01), and the abundance of non-native species was highly significantly and positively correlated with trimming frequency and watering frequency (Trimming: β coefficient = 0.23, p-value < 0.001; watering: β coefficient = 0.19, p-value < 0.001) (Table 1, Figure 5). Thus, more cultivated species are clearly grown in higher income areas where maintenance has greater attention, whereas native diversity is higher in areas allowed to mature but where there is less management effort.
Table 1. Analysis of the factors influencing plant diversity in five cities (Zhanjiang, Haikou, Danzhou, Sanya, and Yazhou) of China. We constructed a generalized linear mixed-effects model. The minimum AIC values of the equation help determine whether to include the variable in the model, with “-” indicating exclusion from the models. Signif. codes: 0 “***” 0.001 “**” 0.01 “*” 0.05 “.” 0.1 “ ” 1.
TotalCultivatedSpontaneously GrowingNativeNon-Native
Random effects
Group NameVarianceStd.Dev.VarianceStd.Dev.VarianceStd.Dev.VarianceStd.Dev.VarianceStd.Dev.
City (Intercept)0.400.630.430.650.330.560.340.590.430.66
Residual0.400.63 0.46 0.680.440.660.410.640.480.69
Number of obs: 733, groups: City, 5
Fixed effects
β coefficientβ coefficientβ coefficientβ coefficientβ coefficient
(Intercept)−0.13−0.07−0.09−0.17−0.04
Primary UFU—Institutional business service area0.070.07−0.010.11−0.03
Primary UFU—Leisure and entertainment area0.19 *0.110.21 *0.26 **0.10
Primary UFU—Residential area0.19 **0.20 *0.070.28 ***0.07
Primary UFU—Traffic area−0.40 ***−0.43 ***−0.18 *−0.31 ***−0.41 ***
Annual mean temperature--−0.21--
Annual wind speed--0.12 .--
Construction age (year)--0.12 **0.13 **-
Housing price (Yuan)-0.15 *−0.16 *--
Trimming frequency (times/year)0.090.25 ***−0.11 .-0.23 ***
Watering frequency (times/year)0.15 ***0.18 ***-0.07 .0.19 ***
AIC1441.61547.31517.71453.41570.9

4. Discussion

4.1. Socioeconomic Factors Dominate Urban Plant Diversity

Urban biodiversity is influenced by a range of environmental, biological, and anthropogenic factors that determine the species composition and richness across different spatial scales [43]. In most circumstances, plant diversity is primarily driven by climatic and geographic factors [44,45]. Only spontaneously growing plant species abundance was weakly correlated with mean annual temperature and wind speed, suggesting that temperature affects the growth of spontaneously growing plant species, while wind speed contributes to their spread (Table 1). Unlike other studies conducted in regions with greater temperature and wind speed variations between cities [46,47,48,49,50], our study was undertaken in China’s tropical coastal region where such variation is relatively limited. However, it is possible that environmental factors have a screening effect on the species and composition of urban plants [51], which warrants further investigation in future research.
We adopted the definition of UFUs proposed by Wang et al. (2013) [27], in which they represent unique land cover and land use with distinct economic and social functions in an urban matrix. We found a positive and significant correlation between house prices and the abundance of cultivated species (Table 1); similar findings have previously been recorded [16]. Wealth, or municipalities with financial resources, often have the means to promote biodiversity management; areas with a high level of biodiversity are simply more attractive [52]. Developers and designers of commercial and residential high-rise buildings also aim to increase plant diversity through continuous green space management to attract consumers.
We also show that during initial planning and design stages, prior structures and natural greenery are often fully removed and replaced with different, often non-native flora, resulting in a loss of original vegetation [53,54]. Cultivated plants, including various tree and shrub species along with individual herbs, are transplanted from nurseries to specially designated green spaces, with maintenance protocols such as pruning and watering being commonplace in order to improve cultivated plant survival [55]. Cultivated plant species and non-native species are more common in areas with frequent watering, though this may relate more to the level of maintenance or even the management budget, whereas there was a weak correlation observed between native species richness and watering frequency (Table 1). Additionally, our results demonstrate a positive and significant correlation between both cultivated plant species and non-native species, and mowing/maintenance frequency, while spontaneously growing plant species showed a negative correlation (Table 1). This can be attributed to the human manipulation of urban green spaces to promote certain cultivated species and increase aesthetic value through pruning and maintenance practices, resulting in the selective removal of spontaneously growing plant species, or “weeds”, to maintain consistency within the space.
The results of the study demonstrate a significant and positive correlation between the diversity of spontaneously growing plant species and native species and the age of buildings (Table 1). These results support the legacy effect hypothesis [56,57,58]. The construction age of urban green spaces reflects the history of urban development and its impact on such spaces. As buildings age, there is a greater opportunity for plants to germinate and grow from seeds in the vicinity, and for seeds to accumulate in the seedbank. Urban history may influence the structure and composition of urban green spaces due to differences in plant species accumulation, growth times, and past management decisions [59,60,61,62]. However, plant functional diversity was not considered in the study, and may provide a more effective measure for understanding the response of plant community assembly patterns, and thus could be considered in future studies.

4.2. Effect of Land Use Type on Plant Diversity

Primary UFU’s in residential and recreational areas exhibited higher total numbers of species than the commercial and industrial sectors, while the transportation zones displayed substantially lower diversity in the total number of species than the commercial and industrial areas (Table 1). High-rise residential areas, parks, and institutional commercial service areas such as universities exhibited greater plant diversity.
High-rise residential communities typically have well-planned green spaces that are established early in their development. Developers allocate significant funds toward creating and maintaining green areas in order to satisfy the aesthetic preferences of their customers and attract clients; thus, local income is likely to relate to funds available for landscaping [21,63]
Among the different functional units, universities and parks with larger green space patches demonstrated a higher plant diversity [64]. This is likely because these public green spaces are subject to more frequent and extensive management practices [65,66].
Plant community composition in university and park areas may peak in marginal and less accessible areas. The creation of parks has proved to be an effective safeguarding mechanism for the maintenance of native diversity within cities [67,68]. However, green space planners often prioritize human needs over ecological value [68], designing parks around human preferences, entertainment, safety, and facilitating visitor movement (walkways etc.), rather than prioritizing native diversity. Managing space to balance diversity and use could be useful in addressing various urban challenges, such as mitigating the urban heat island effect, enhancing urban ecosystem services (e.g., improved air and water quality, carbon sequestration, and pollination support for urban flora), reducing stormwater runoff, fostering biodiversity in urban landscapes, and promoting human health and well-being through increased access to green spaces [69,70,71,72].

5. Conclusions

Plant diversity patterns are influenced by a combination of factors. The historical context of urbanization must be taken into account when studying urban plant diversity. Human management of green spaces has both positive and negative impacts on plant diversity, with ornamental and non-native species being more adaptable to maintenance, while spontaneously growing plant species decline.
To enhance our understanding of urban plant diversity and its drivers, we recommend additional long-term observations of sampling sites that can expand spatial and temporal coverage and better reflect management and other factors, as well as expanding to other dimensions of diversity, such as that of pollinator richness, the inclusion of measurements of other types of ecosystem service provision, and monitoring of other elements of management. We show the potential to increase the use of native species in developments to maximize their survival prospects, reduce costs, and support other elements of urban biodiversity. This approach promotes a healthier environment by protecting vital ecosystem services in order to improve overall human well-being.

Supplementary Materials

The following supporting information can be downloaded at: https://www.mdpi.com/article/10.3390/su151512045/s1.

Author Contributions

J.C.: Formal analysis, Investigation, Methodology, Software, Validation, Visualization, Writing—original draft, Writing—review and editing. M.Z.: Formal analysis, Investigation, Writing—review and editing, Data curation. L.G.: Formal analysis, Investigation, Methodology, Software, Writing—original draft, Writing—review and editing. H.Z.: Validation, Visualization, Writing—review and editing. A.C.H.: Formal analysis, Writing—original draft, Writing—review and editing. H.W.: Conceptualization, Data curation, Formal analysis, Funding acquisition, Investigation, Methodology, Project administration, Resources, Software, Supervision, Validation, Visualization, Writing—original draft, Writing—review and editing. All authors have read and agreed to the published version of the manuscript.

Funding

This study was supported by National Natural Science Foundation of China (32160273), the Project of Sanya Yazhou Bay Science and Technology City (SCKJ-JYRC-2022-83), open funding from East China Normal University (SHUES2021A08, SHUES2022A06), the PhD Scientific Research and Innovation Foundation of Sanya Yazhou Bay Science and Technology City (HSPHDSRF-2023-12-010), and funding from the Collaborative Innovation Center of Nanfan and High-Efficiency Tropical Agriculture, Hainan University (XTCX2022NYB09).

Institutional Review Board Statement

Ethical review and approval were waived for this study, as this study was analyzed through data on green space and plant diversity management, such as watering frequency. Data were obtained through website surveys and questionnaires, and were analyzed through information such as the frequency of plant diversity management, such as watering frequency, obtained through their consultation around the residential area, which does not involve privacy such as personal property.

Informed Consent Statement

Informed consent was obtained from all subjects involved in the study.

Data Availability Statement

Data will be made available on request.

Conflicts of Interest

We declare that we have no financial and personal relationships with other people or organizations that can inappropriately influence our work, there are no professional or other personal interest of any nature or kind in any product, service, and/or company that could be construed as influencing the position presented in, or the review of, the manuscript entitled Urban Planning and Green Landscape Management Drive Plant Diversity in Five Tropical Cities in China.

References

  1. Ma, S.J.; Wang, R.S. Socio-economic-natural complex ecosystems. J. Ecol. 1984, 4, 1–9. [Google Scholar]
  2. Wang, R.S.; Liu, J.R. Urban ecology and ecological habitat construction. J. Mod. Urban Res. 2010, 3, 28–31. [Google Scholar]
  3. Hobbie, S.E.; Grimm, N.B. Nature-based approaches to managing climate change impacts in cities. Philos. Trans. R. Soc. B 2020, 375, 20190124. [Google Scholar] [CrossRef] [PubMed] [Green Version]
  4. Elmqvist, T.; Fragkias, M.; Goodness, J.; Güneralp, B.; Marcotullio, P.J.; McDonald, R.I.; Seto, K.C. Urbanization, Biodiversity and Ecosystem Services: Challenges and Opportunities: A Global Assessment; Springer: Berlin/Heidelberg, Germany, 2013. [Google Scholar]
  5. Muller, N.; Werner, P.; Kelcey, J.G. Urban Biodiversity and Design; John Wiley & Sons: Hoboken, NJ, USA, 2010. [Google Scholar]
  6. Escobedo, F.J.; Giannico, V.; Jim, C.Y.; Sanesi, G.; Lafortezza, R. Urban forests, ecosystem services, green infrastructure and nature-based solutions: Nexus or evolving metaphors? Urban For. Urban Green. 2019, 37, 3–12. [Google Scholar] [CrossRef]
  7. Semeraro, T.; Scarano, A.; Buccolieri, R.; Santino, A.; Aarrevaara, E. Planning of urban green spaces: An ecological perspective on human benefits. Land 2021, 10, 105. [Google Scholar] [CrossRef]
  8. Jim, C.Y.; Chen, W.Y. Assessing the ecosystem service of air pollutant removal by urban trees in Guangzhou (China). J. Environ. Manag. 2008, 88, 665–676. [Google Scholar] [CrossRef]
  9. Nowak, D.J.; Crane, D.E. Carbon Storage and Sequestration by Urban Trees in the USA. Environ. Pollut. 2002, 116, 381–389. [Google Scholar] [CrossRef]
  10. Cheng, X.L.; Cubino, J.P.; Balfour, K.; Zhu, Z.X.; Wang, H.F. Drivers of spontaneous and cultivated species diversity in the tropical city of Zhanjiang, China. Urban For. Urban Green. 2022, 67, 127428. [Google Scholar] [CrossRef]
  11. Liu, H.; Ren, M.X.; Richards, J.; Song, X.Q. Tropical China Plant diversity, Ecology and Conservation—A Glimpse at the Current State. Bot. Rev. 2017, 83, 1–4. [Google Scholar] [CrossRef]
  12. Lepczyk, C.A.; Aronson, M.F.; Evans, K.L.; Goddard, M.A.; Lerman, S.B.; MacIvor, J.S. Biodiversity in the city: Fundamental questions for understanding the ecology of urban green spaces for biodiversity conservation. BioScience 2017, 67, 799–807. [Google Scholar] [CrossRef] [Green Version]
  13. Chang, C.R.; Chen, M.C.; Su, M.H. Natural versus human drivers of plant diversity in urban parks and the anthropogenic species-area hypotheses. Landsc. Urban Plan. 2021, 208, 104023. [Google Scholar] [CrossRef]
  14. Irl, S.D.; Harter, D.E.; Steinbauer, M.J.; Gallego Puyol, D.; Fernández-Palacios, J.M.; Jentsch, A.; Beierkuhnlein, C. Climate vs. topography–spatial patterns of plant species diversity and endemism on a high-elevation island. J. Ecol. 2015, 103, 1621–1633. [Google Scholar] [CrossRef]
  15. Kessler, M.; Kluge, J.; Hemp, A.; Ohlemüller, R. A global comparative analysis of elevational species richness patterns of ferns. Glob. Ecol. Biogeogr. 2011, 20, 868–880. [Google Scholar] [CrossRef]
  16. Hope, D.; Gries, C.; Zhu, W.; Fagan, W.F.; Redman, C.L.; Grimm, N.B.; Nelson, A.L.; Martin, C.; Kinzig, A. Socioeconomics Drive Urban Plant diversity. Proc. Natl. Acad. Sci. USA 2003, 100, 8788–8792. [Google Scholar] [CrossRef] [PubMed]
  17. Avolio, M.L.; Pataki, D.E.; Trammell, T.L.E.; Endter-Wada, J. Biodiverse cities: The nursery industry, homeowners, and neighborhood differences drive urban tree composition. Ecol. Monogr. 2018, 88, 259–276. [Google Scholar] [CrossRef] [Green Version]
  18. Avolio, M.; Blanchette, A.; Sonti, N.F.; Locke, D.H. Time Is Not Money: Income Is More Important Than Lifestage for Explaining Patterns of Residential Yard Plant Community Structure and Diversity in Baltimore. Front. Ecol. Evol. 2020, 8, 85. [Google Scholar] [CrossRef] [Green Version]
  19. Cervelli, E.W.; Lundholm, J.T.; Du, X. Spontaneous urban vegetation and habitat heterogeneity in Xi’an. Landsc. Urban Plan. 2013, 120, 25–33. [Google Scholar] [CrossRef]
  20. Bonthoux, S.; Chollet, S.; Balat, I.; Voisin, L. Improving nature experience in cities: What are people’s preferences for vegetated streets? J. Environ. Manag. 2019, 230, 335–344. [Google Scholar] [CrossRef]
  21. Larson, J.L.; Kesheimer, A.J.; Potter, D.A. Pollinator assemblages on dandelions and white clover in urban and suburban lawns. J. Insect Conserv. 2014, 18, 863–873. [Google Scholar] [CrossRef]
  22. Yang, F.; Ignatieva, M.; Wissman, J.; Zhu, S. Relationships between multi-scale factors, plant and pollinator diversity, and composition of park lawns and other herbaceous vegetation in a fast growing megacity of China. Landsc. Urban Plan. 2019, 185, 117–126. [Google Scholar] [CrossRef]
  23. Huang, L.; Qian, S.; Li, T.; Yang, Y.C. Masonry walls as sieve of urban plant assemblages and refugia of native species in Chongqing, China. Landsc. Urban Plan. 2019, 191, 103620. [Google Scholar] [CrossRef]
  24. Smith, L.S.; Fellowes, M.D.E. The grass-free lawn: Management and species choice for optimum ground cover and plant diversity. Urban For. Urban Green. 2014, 13, 433–442. [Google Scholar] [CrossRef]
  25. Wang, H.-F.; Cheng, X.-L.; Nizamani, M.M.; Balfour, K.; Da, L.; Zhu, Z.-X.; Qureshi, S. An Integrated approach to study spatial patterns and drivers of land cover within urban functional units: A multi-city comparative study in China. Remote Sens. 2020, 12, 2201. [Google Scholar] [CrossRef]
  26. Zhang, H.-L.; Cubino, J.P.; Nizamani, M.M.; Harris, A.; Cheng, X.-L.; Da, L.; Sun, Z.; Wang, H.-F. Wealth and land use drive the distribution of urban green space in the tropical coastal city of haikou, china. Urban For. Urban Green. 2022, 71, 127554. [Google Scholar] [CrossRef]
  27. Wang, H.F.; Qiu, J.X.; Breuste, J.; Friedman, R.C.; Zhou, W.Q.; Wang, X.K. Variations of urban greenness across urban structural units in Beijing, China. Urban For. Urban Green. 2013, 12, 554–561. [Google Scholar] [CrossRef]
  28. Anderson, J.R.; Hardy, E.E.; Roach, J.T. A land use and land cover classification system for use with remote sensor data. Prof. Pap. Geol. Surv. 1976, 964, 1–28. [Google Scholar]
  29. Wang, H.F.; Qureshi, S.; Knapp, S.; Friedman, C.R.; Hubacek, K. A basic assessment of residential plant diversity and its ecosystem services and disservices in Beijing, China. Appl. Geogr. 2015, 64, 121–131. [Google Scholar] [CrossRef]
  30. Nizamani, M.M.; Harris, A.J.; Cheng, X.L.; Zhu, Z.X.; Jim, C.Y.; Wang, H.F. Positive relationships among aboveground biomass, tree species diversity and urban greening management in tropical coastal city of Haikou. Ecol. Evol. 2021, 11, 12204–12219. [Google Scholar] [CrossRef]
  31. FAO. The Global Forest Resources Assessment 2000 (FRA 2000): Terms and Definitions; FAO: Rome, Italy, 1998. [Google Scholar]
  32. UNECE/FAO. Forest Resources of Europe, CIS, North America, Australia, Japan and New Zealand; United Nations: New York, NY, USA, 2000. [Google Scholar]
  33. Chen, H.Y. Botany of Hainan; Science Press: Beijing, China, 1964. [Google Scholar]
  34. He, J. Exotic Plants in China; Shanghai Science and Technology Press: Shanghai, China, 2012; p. 761. [Google Scholar]
  35. Ma, J.S.; Yan, X.L.; Shou, H.Y. The Checklist of the Chinese Invasive Plants; China Higher Education Press: Beijing, China, 2013. [Google Scholar]
  36. Fick, S.E.; Hijmans, R.J. WorldClim 2: New 1 km spatial resolution climate surfaces for global land areas. Int. J. Climatol. 2017, 37, 4302–4315. [Google Scholar] [CrossRef]
  37. Gao, Z.W.; Pan, Y.J.; Peter, M.V.B.; Ellen, C.; Xing, D.L.; Yang, Y.Y.; Xia, T.Y.; Luo, X.Y.; Song, K.; Da, L.J.; et al. Beta diversity of urban spontaneous plants and its drivers in 9 major cities of Yunnan province, China. Landsc. Urban Plan. 2023, 234, 104741. [Google Scholar] [CrossRef]
  38. Menard, S. Applied Logistic Regression Analysis; Sage: Washington, DC, USA, 2002. [Google Scholar]
  39. Vittinghoff, E.; Glidden, D.V.; Shiboski, S.C.; McCulloch, C.E. Regression Methods in Biostatistics: Linear, Logistic, Survival, and Repeated Measures Models; Springer: Berlin/Heidelberg, Germany, 2006. [Google Scholar]
  40. Gareth, J.; Daniela, W.; Trevor, H.; Robert, T. An Introduction to Statistical Learning: With Applications in R; Spinger: Berlin/Heidelberg, Germany, 2013. [Google Scholar]
  41. Bates, D.; Maechler, M.; Bolker, B.; Walker, S. Fitting Linear Mixed-Effects Models Using lme4. J. Stat. Softw. 2015, 67, 1–48. [Google Scholar] [CrossRef]
  42. Wickham, H. ggplot2: Elegant Graphics for Data Analysis; Springer: New York, NY, USA, 2016. [Google Scholar]
  43. Aronson, M.F.; Nilon, C.; Lepczyk, C.; Zipperer, W. Hierarchical filters determine community assembly of urban species pools. Ecology 2016, 97, 2952–2963. [Google Scholar] [CrossRef] [PubMed] [Green Version]
  44. La Sorte, F.A.; Aronson, M.F.J.; Williams, N.S.G.; Celesti-Grapow, L.; Cilliers, S.; Clarkson, B.D.; Dolan, R.W.; Hipp, A.; Klotz, S.; Kühn, I.; et al. Beta diversity of urban floras. Glob. Ecol. Biogeogr. 2014, 23, 769–779. [Google Scholar] [CrossRef]
  45. Liu, J.J.; Yu, M.J.; Tomlinson, K.; Slik, J.W.F. Patterns and drivers of plant biodiversity in Chinese university campuses. Landsc. Urban Plan. 2017, 164, 64–70. [Google Scholar] [CrossRef]
  46. Harris, A.J.; Dee, J.; Palmer, M.W. The effects of taxonomic rank on climatic calibrations: A test using extant floras of United States counties. Rev. Palaeobot. Palynol. 2017, 244, 316–324. [Google Scholar] [CrossRef]
  47. Cheval, S.; Dumitrescu, A.; Adamescu, M.; Cazacu, C. Identifying climate change hotspots relevant for ecosystems in Romania. Clim. Res. 2020, 80, 165–173. [Google Scholar] [CrossRef]
  48. Mcfadden, I.R.; Sandel, B.; Tsirogiannis, C.; Morueta-Holme, N.; Svenning, J.; Enquist, B.J.; Kraft, N.J. Temperature shapes opposing latitudinal gradients of plant taxonomic and phylogenetic β diversity. Ecol. Lett. 2019, 22, 1126–1135. [Google Scholar] [CrossRef]
  49. Li, J.; Fan, G.; He, Y. Predicting the current and future distribution of three Coptis herbs in China under climate change conditions, using the MaxEnt model and chemical analysis. Sci. Total Environ. 2020, 698, 134141. [Google Scholar] [CrossRef]
  50. Korell, L.; Auge, H.; Chase, J.M.; Harpole, W.S.; Knight, T.M. Responses of plant diversity to precipitation change are strongest at local spatial scales and in drylands. Nat. Commun. 2021, 12, 2489. [Google Scholar] [CrossRef]
  51. Kendal, D.; Williams, N.; Williams, K. A cultivated environment: Exploring the global distribution of plants in gardens, parks and streetscapes. Urban Ecosyst. 2012, 15, 637–652. [Google Scholar] [CrossRef]
  52. Leong, M.; Dunn, R.R.; Trautwein, M.D. Biodiversity and socioeconomics in the city: A review of the luxury effect. Biol. Lett. 2018, 14, 20180082. [Google Scholar] [CrossRef] [Green Version]
  53. Walker, J.S.; Grimm, N.B.; Briggs, J.M.; Gries, C.; Dugan, L. Effects of urbanization on plant species diversity in central Arizona. Front. Ecol. Environ. 2009, 7, 465–470. [Google Scholar] [CrossRef]
  54. Szlavecz, K.; Warren, P.; Pickett, S.T.A. Biodiversity on the urban landscape. In Human Population: Its Influences on Biological Diversity, Ecological Studies; Cincotta, R.P., Gorenflo, L.J., Eds.; Springer: New York, NY, USA, 2011; pp. 75–101. [Google Scholar]
  55. Faeth, S.H.; Warren, P.S.; Shochat, E.; Marussich, W.A. Trophic dynamics in urban communities. BioScience 2005, 55, 399. [Google Scholar] [CrossRef]
  56. Dow, K. Social dimensions of gradients in urban ecosystems. Urban Ecosyst. 2000, 4, 255–275. [Google Scholar] [CrossRef]
  57. Yang, J.; Yan, P.; He, R.; Song, X. Exploring land-use legacy effects on taxonomic and functional diversity of woody plants in a rapidly urbanizing landscape. Landsc. Urban Plan. 2017, 162, 92–103. [Google Scholar] [CrossRef]
  58. Helm, J.; Dutoit, T.; Saatkamp, A.; Bucher, S.F.; Leiterer, M.; Römermann, C. Recovery of Mediterranean steppe vegetation after cultivation: Legacy effects on plant composition, soil properties and functional traits. Appl. Veg. Sci. 2019, 22, 71–84. [Google Scholar] [CrossRef]
  59. Lubbe, C.S.; Siebert, S.J.; Cilliers, S.S. Political legacy of south africa affects the plant diversity patterns of urban domestic gardens along a socio-economic gradient. Sci. Res. Essays 2010, 5, 2900–2910. [Google Scholar]
  60. Clarke, L.W.; Jenerette, G.D.; Davila, A. The luxury of vegetation and the legacy of tree biodiversity in Los Angeles, CA. Landsc. Urban Plan. 2013, 116, 48–59. [Google Scholar] [CrossRef]
  61. Larson, K.L.; Hoffman, J.; Ripplinger, J. Legacy effects and landscape choices in a desert city. Landsc. Urban Plan. 2017, 165, 22–29. [Google Scholar] [CrossRef]
  62. Roman, L.A.; Pearsall, H.; Eisenman, T.S.; Conway, T.M.; Fahey, R.T.; Landry, S.; Vogt, J.; van Doorn, N.S.; Grove, J.M.; Locke, D.H.; et al. Human and biophysical legacies shape contemporary urban forests: A literature synthesis. Urban For. Urban Green. 2018, 31, 157–168. [Google Scholar] [CrossRef]
  63. Larson, K.L.; Nelson, K.C.; Samples, S.R.; Hall, S.J.; Bettez, N.; Cavender-Bares, J.; Groffman, P.M.; Grove, M.; Heffernan, J.B.; Hobbie, S.E.; et al. Ecosystem services in managing residential landscapes: Priorities, value dimensions, and cross-regional patterns. Urban Ecosyst. 2016, 19, 95–113. [Google Scholar] [CrossRef]
  64. Zhang, N. Landscape Ecology; Science Press: Beijing, China, 2017. [Google Scholar]
  65. Ramer, H.; Nelson, K.C. Applying ‘action situation’concepts to public land managers’ perceptions of flowering bee lawns in urban parks. Urban For. Urban Green. 2020, 53, 126711. [Google Scholar] [CrossRef]
  66. Grafius, D.R.; Corstanje, R.; Harris, A.J. Linking ecosystem services, urban form and green space configuration using multivariate landscape metric analysis. Landsc. Ecol. 2018, 33, 557–573. [Google Scholar] [CrossRef] [Green Version]
  67. Braun, V. Arguments for Protected Areas Multiple Benefits for Conservation and Use, eco.mont. J. Prot. Mt. Areas Res. 2010, 3, 42. [Google Scholar]
  68. Hilborn, R.; Sinclair, A. Biodiversity protection in the 21st century needs intact habitat and protection from over exploitation whether inside or outside parks. Conserv. Lett. 2021, 14, e12830. [Google Scholar] [CrossRef]
  69. Hiemstra, J.A.; Saaroni, H.; Amorim, J.H. The Urban Heat Island: Thermal Comfort and the Role of Urban Greening. In Future City, The Urban Forest; Pearlmutter, D., Ed.; Springer: Cham, Switzerland, 2017; Volume 7. [Google Scholar] [CrossRef]
  70. Schwarz, N.; Moretti, M.; Bugalho, M.N.; Davies, Z.G.; Haase, D.; Hack, J.; Hof, A.; Melero, Y.; Pett, T.J.; Knapp, S. Understanding biodiversity-ecosystem service relationships in urban areas: A comprehensive literature review. Ecosyst. Serv. 2017, 27, 161–171. [Google Scholar] [CrossRef] [Green Version]
  71. Berland, A.; Shiflett, S.A.; Shuster, W.D.; Garmestani, A.S.; Goddard, H.C.; Herrmann, D.L.; Hopton, M.E. The role of trees in urban stormwater management. Landsc. Urban Plan. 2017, 162, 167–177. [Google Scholar] [CrossRef] [Green Version]
  72. Ma, B.; Zhou, T.; Lei, S.; Wen, Y.; Htun, T.T. Effects of urban green spaces on residents’ well-being. Environ. Dev. Sustain. 2019, 21, 2793–2809. [Google Scholar] [CrossRef]
Figure 1. Distribution of sampling points in five cities in tropical China Note: the green dots in the figure below represent sampling points; red polygons are city boundaries.
Sustainability 15 12045 g001
Figure 2. Figure of representative UFUs of each city ((A1) Phoenix Island Resort; (A2) Yazhou Shuinan Village; (B1) Bell Tower in Haikou; (B2) Zhanjiang Southland Tropical Garden; (C1) Yazhou Ancient City; (C2) Danzhou Huaguoshan Park) and plants ((A3) Bougainvillea spectabilis; (A4) Syzygium samarangense; (B3) Senna surattensis; (B4) Erythrina crista-galli; (C3) Passiflora foetida; (C4) Caesalpinia pulcherrima).
Sustainability 15 12045 g002
Figure 5. A generalized linear mixed-effects model with β coefficient for the factors influencing plant diversity in five cities, China (Zhanjiang, Haikou, Danzhou, Sanya, and Yazhou). Signif. codes: p-value 0 “***” 0.001 “**” 0.01 “*” 0.05 “.” 0.1 “ ” 1. Note: AMT, Annual Mean Temperature; MTWM, Max Temperature of Warmest Month; MTCM, Min Temperature of Coldest Month; AP, Annual Precipitation; AWS, Annual wind speed; ELE, Elevation; ASR, Annual solar radiation; CA, Construction age; HP, Housing price; PD, Population density; TF, Trimming frequency; FT, Fertilizing times; WF, Watering frequency.
Sustainability 15 12045 g005
Disclaimer/Publisher’s Note: The statements, opinions and data contained in all publications are solely those of the individual author(s) and contributor(s) and not of MDPI and/or the editor(s). MDPI and/or the editor(s) disclaim responsibility for any injury to people or property resulting from any ideas, methods, instructions or products referred to in the content.

