Article

Geometry Morphology and Distribution Characteristics of Permanent Gullies in the Greater and Lesser Khingan Mountains Forest Region of China

1
College of Resources and Environment, Jilin Agricultural University, Changchun 130118, China
2
Northeast Institute of Geography and Agroecology, Chinese Academy of Sciences, Harbin 150081, China
3
Arongqi Water Resources Bureau, Arongqi 162750, China
4
Zhalantun City Water Resources Bureau, Zhalantun 162650, China
5
University of Chinese Academy of Sciences, Beijing 100049, China
6
Institute of Soil and Water Conservation, Chinese Academy of Sciences and Ministry of Water Resources, Yangling 712100, China
*
Author to whom correspondence should be addressed.
Sustainability 2023, 15(15), 12056; https://doi.org/10.3390/su151512056
Submission received: 9 July 2023 / Revised: 2 August 2023 / Accepted: 3 August 2023 / Published: 7 August 2023
(This article belongs to the Section Soil Conservation and Sustainability)

Abstract

:
The Greater and Lesser Khingan Mountains (GKM and LKM), together form one of the main resources of the terrestrial natural ecosystem in northeast Asia and play a crucial role in climate regulation and soil and water conservation due to their distinctive geographical features and abundant vegetation cover. Nonetheless, the morphology and distribution of gullies in the two study areas remain unclear. This study focused on an investigation area of approximately 100 km2 within the forest areas of the GKM and LKM, where field measurements were conducted to record and analyze the morphological characteristics of the gullies. The study also explored the impact of slope and the aspects of gully development and established a gully volume estimation model in the study area. The findings indicate the following. Firstly, that the proportions of gullies with a length of 200–1000 m, a width of 2–6 m and a depth of 1–2 is 59.4%, 51.3% and 45.9%, respectively in the GKM, and 42.5%, 75.7% and 56%, respectively in the LKM. The measured gully density in the GKM was 0.3 gullies per km2, with an average length, width, and depth of 524.4 m, 2.4 m, and 1.0 m, respectively. In contrast, the measured gully density in the LKM was 0.45 gullies per km2, with an average length, width, and depth of 560.1 m, 3.9 m, and 1.8 m, respectively. Secondly, as the slope increased, the density of gullies and the degree of surface fragmentation gradually decreased. In the measured area of the GKM, gullies developed faster on the semi-sunny slope. However, in the measured area of the LKM, gullies were more evenly distributed across different slopes. A significant power function relationship between the volume and area (V-A) of gullies in the measured areas of the GKM (V = 0.37 A1.11, R2 = 0.94) and LKM (V = 0.32 A1.17, R2 = 0.94) was observed. These findings have important implications for soil conversation in forested areas of the black soil region in Northeast China.

1. Introduction

Gully erosion is a severe form of land degradation that poses significant threats to land, water resources, and the ecological environment [1,2]. Moreover, gully erosion can exacerbate flood disasters, worsen water quality, and disrupt ecosystems [3]. Gully erosion has become an increasingly prominent issue in recent years, exacerbated by global climate change and human activities, particularly in ecologically fragile areas such as the black soil region in Northeast China [4,5]. As a response to this issue, a growing number of studies have been dedicated to exploring the morphological characteristics, distribution patterns, and control methods of gully erosion, aiming to provide a scientific basis for decision making. Gullies are not limited to marly badlands or mountainous areas, but can also be found in soils affected by soil crusting, such as the loess found in Europe, in the Chinese Loess Plateau, and in North America, as well as the sandy soils in the Sahelian zone and northeast Thailand [6,7]. They can also occur in soils that are susceptible to piping and tunnelling, such as dispersive soils [8]. Meanwhile, Zheng et al. [9] have provided a comprehensive review of the research progress on gully erosion over the past 60 years, covering topics that include comparisons of gully erosion concepts, the critical models for gully erosion occurrence, the influencing factors of gully erosion process, the prediction models of gully erosion, research methods and technologies, and proposed key areas for future research. Additionally, recent studies have focused on investigating the relationship between gully erosion and ecological factors, such as land use and vegetation cover, with the aim of improving the understanding of the mechanisms and laws of gully erosion [10,11,12,13].
The Northeast of China is subject to multiple erosion forces, such as hydraulic, wind, and freeze–thaw. These alternate or synchronize in time and overlap or interweave in space, leading to the coexistence of multiple erosion types that interact with each other [14]. According to the 2022 China Water Resources Bulletin, the area’s soil erosion accounts for 26.79% of the total land area, with gully erosion alone causing land damage exceeding 5000 km2. The characteristics of gully erosion in this region are significantly different from those in other regions, with shorter formation time and faster development speed. Current research on gullies primarily focuses on spatial differentiation characteristics, influencing factors, and field measurement and remote sensing interpretation to study the distribution of gullies [15,16,17]. Wang et al. [18] used unmanned aerial vehicle (UAV)-derived orthoimages and digital terrain models (DTMs) with centimeter-level resolution obtained from 2015 to 2020 to periodically monitor the geomorphic, morphological, and volume changes of a stabilized gully in a small agricultural watershed (6 ha) in the southern black soil region of northeast China. The study conducted annual and seasonal assessments of erosion rates in the region and demonstrated the strong adaptability and various advantages of multitemporal UAV data for short to medium-term (≤5 years) erosion rate assessments compared with submeter resolution satellite images. Li et al. [19]. used high-resolution WorldView 2 stereo images (0.5 m) and ENVI5.3 software to analyze the morphology characteristics of gullies in the mountainous and hilly areas of Northeast China’s black soil region and developed a volume estimation model. Li et al. [13] investigated the evolution of gullies in Guangrong village, Hailun city, Heilongjiang province. The authors found that 93% of the incised gullies originated from pre-existing channels in 1968, and that their development process was mainly characterized by channel merging and gully wall widening. Despite the advanced capabilities of current LiDAR technology to penetrate cloud cover and areas with dense vegetation, it still encounters limitations with regard to pristine forested regions and expansive watersheds [20]. The interpretation results often underestimate the actual outcomes. The Chinese Ministry of Water Resources used 2.5 m resolution remote sensing images to conduct the first national water conservancy census in 2013, finding that more than 80% of the 295,663 gullies in the black soil region of Northeast China had been developed into farmland [21]. However, identifying gullies in the forested areas was challenging due to the dense vegetation cover. The thick canopy and undergrowth made it difficult to visually spot and delineate the gully features accurately. Moreover, in some areas, gullies were partially obscured by fallen leaves and debris, further complicating the field measurements. Therefore, the field investigation is still a more effective method by which to obtain the three-dimensional information of each gully than are remote sensing interpretation and LiDAR in a larger region.
The Greater and Lesser Khingan Mountains, which protect over 1/10 of China’s cultivated land and the largest grassland, are critical sources and water conservation areas for the Nenjiang and Heilongjiang river systems and their tributaries [22]. Thus, they have a special status in the overall national ecological protection strategy. Despite this, little research has been undertaken on gullies in the forested areas, and the morphology and development status of gullies remain unclear. This is extremely detrimental to the search for a comprehensive and in-depth understanding of the current status of gully erosion in forest areas, to the making of informed decisions on gully management, and to the implementation of effective prevention measures.
In this study, field measurements were conducted to determine the morphological parameters of every gully in an area of approximately 100 km² in both the Greater and Lesser Khingan Mountains. The aim was to clarify the development and distribution characteristics of gullies, gully volume estimation and the relationship between gully morphology and topographic distribution patterns in the forest areas of the Greater and Lesser Khingan Mountains. The results of the study deepen our understanding of the current situation of gully erosion in the Northeastern black soil region of China and provide a scientific basis for decision making on gully erosion control measures.

2. Materials and Methods
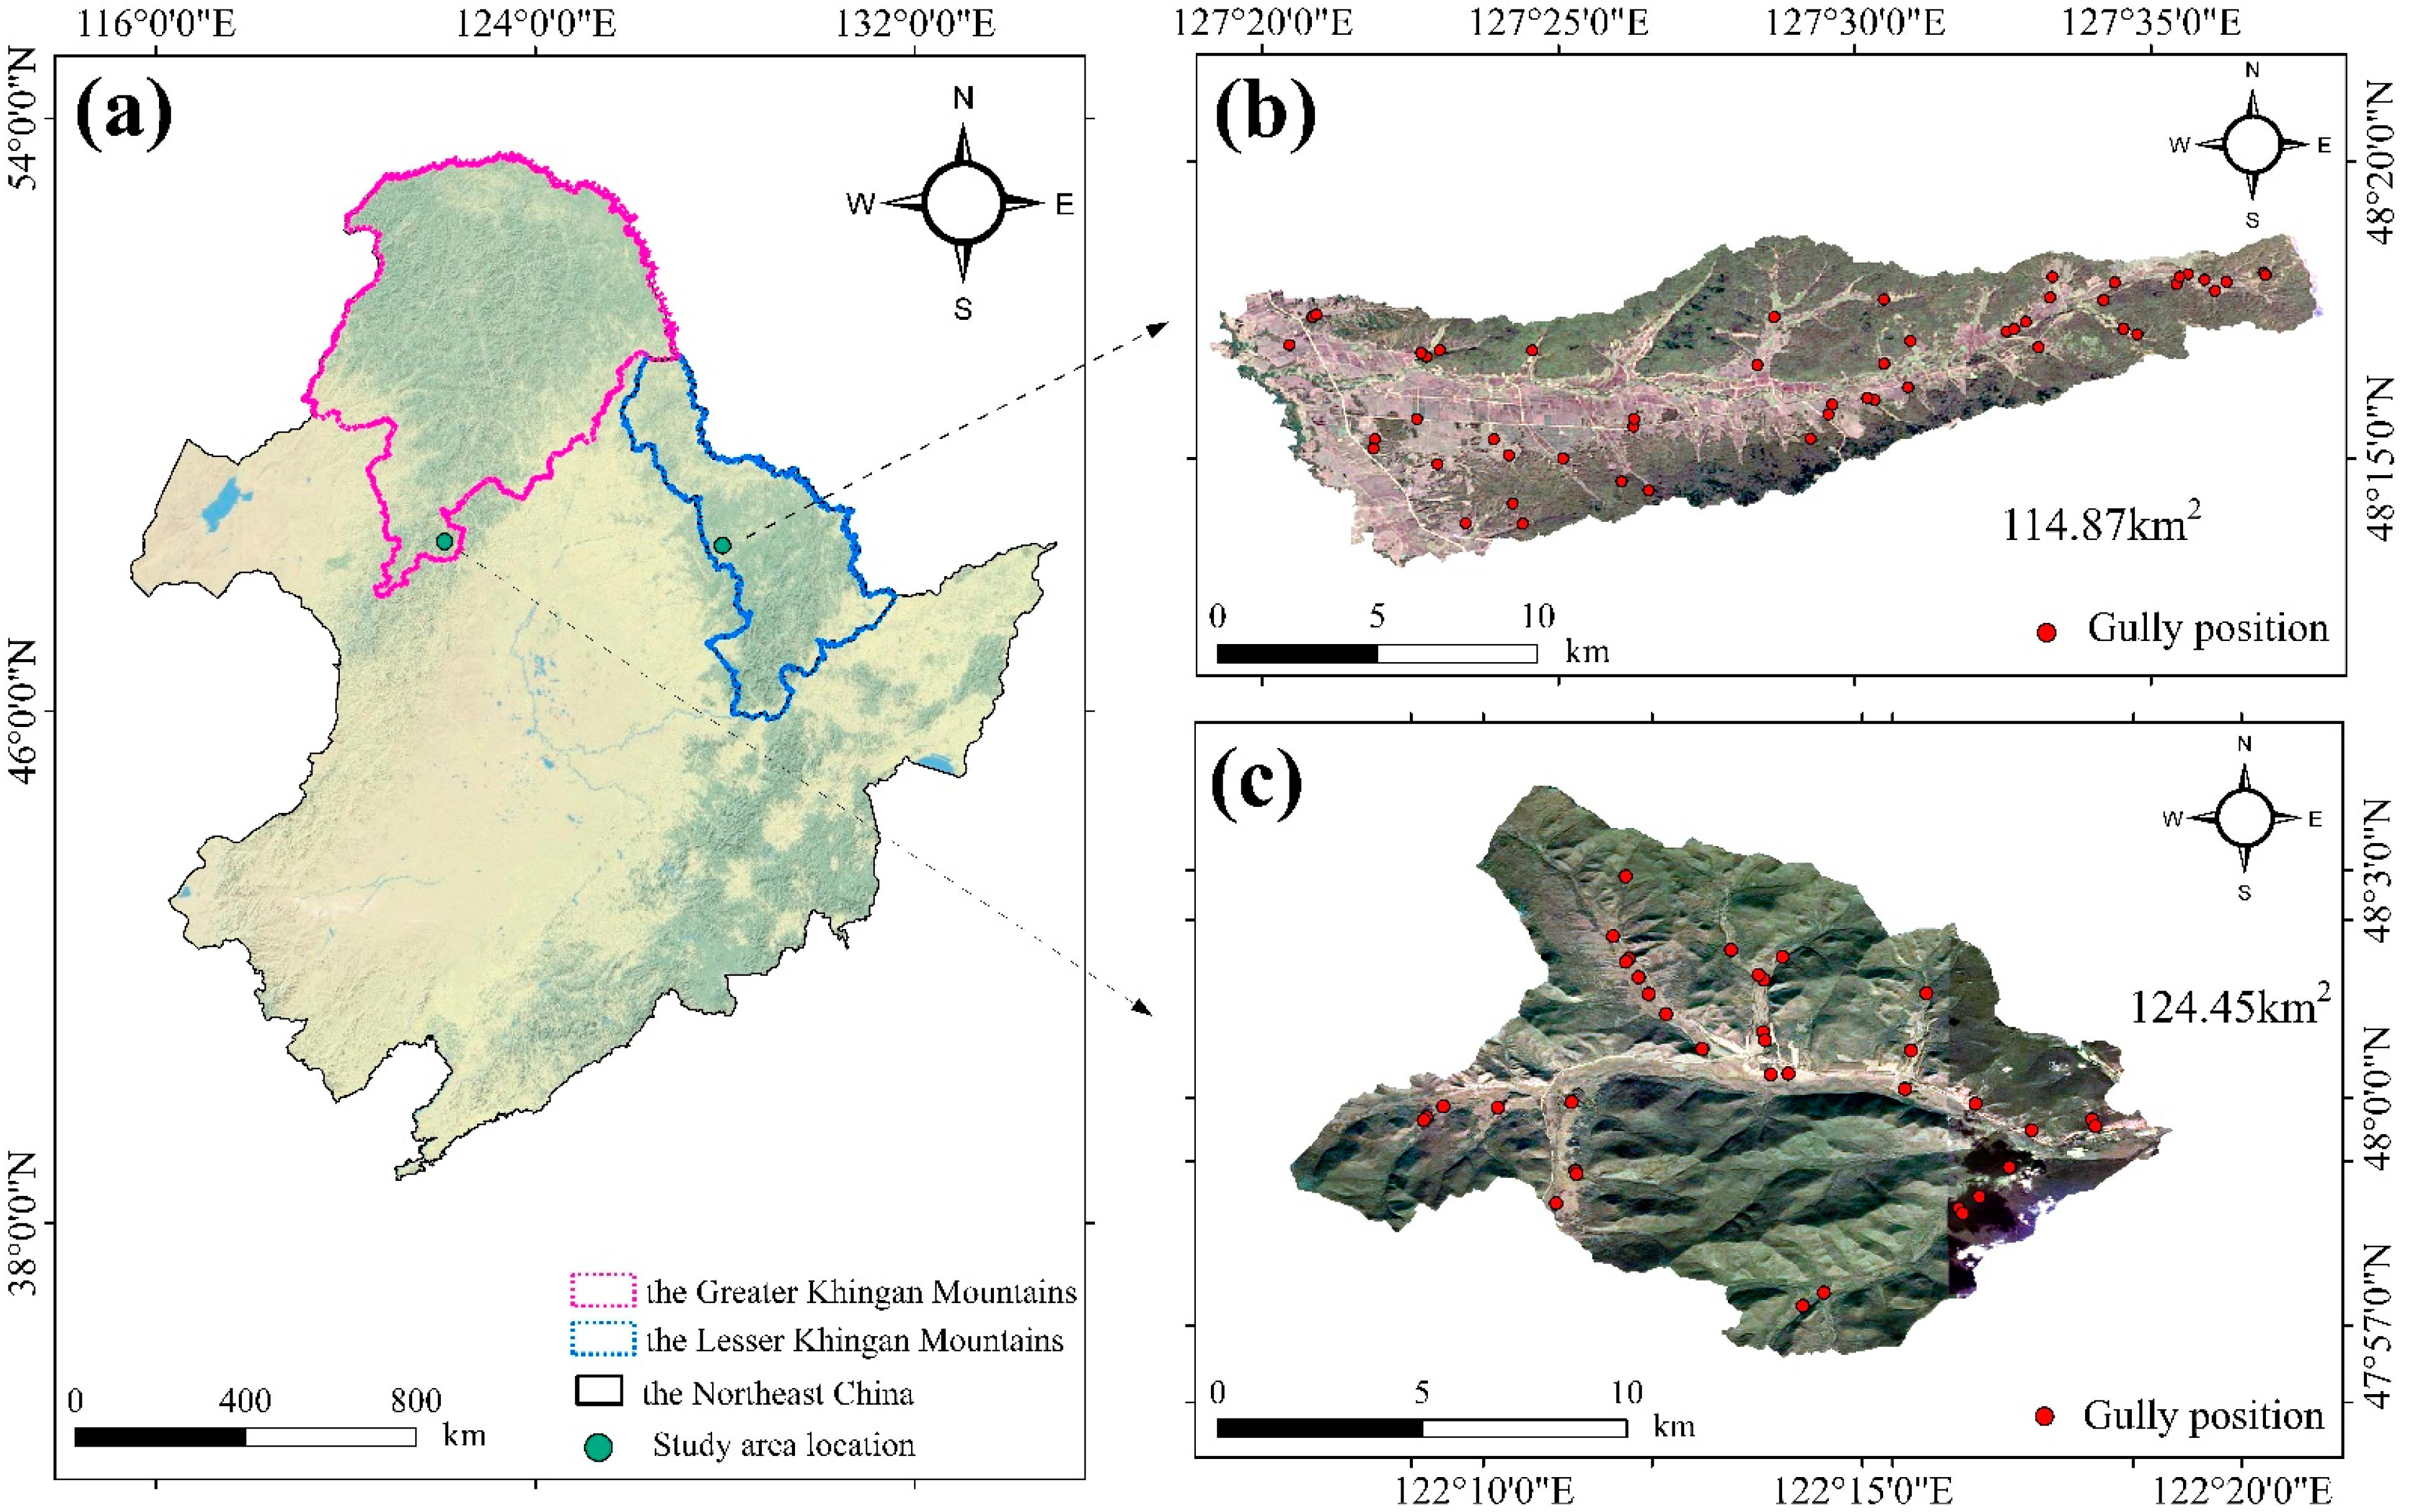
2.1. Study Area

The study conducted field measurements in two forested areas: Dashimen forest in the southern part of Zhalantun city, situated in the Greater Khingan Mountains with an average slope of 11.8° and Jianshe forest in the eastern part of Beian city, situated in the Lesser Khingan Mountains with an average slope of 3.6° (Figure 1). Zhalantun City is located on the eastern foot of the Greater Khingan Mountains and to the west of the Songnen plain in China. The region is characterized by mountainous terrain in the northwest and hilly terrain in the southeast. It mainly falls into three major types: medium-to-low mountainous areas, hilly, and river valleys. The predominant rock types in this area are schist, followed by granite and quartzite, which are widely distributed throughout the region. The winter in this region is long and bitterly cold, while the summer is short with concentrated rainfall. The spring and autumn experience rapid temperature changes. The average annual temperature is 2.7 °C, and the average annual precipitation is 500 mm. Within the territory of Zhalantun city, the soil horizon is characterized by black soil, belonging to the black soil zone of the Songnen plain. There are primarily six types of soils, namely brown coniferous forest soil, dark brown soil, black soil, meadow soil, marsh soil, and paddy soil. The forest in this area is sparsely distributed, and the dominant tree species include Quercus serrata and black birch.
On the other hand, for Beian city (Table 1), located on the southwest foothills of the Lesser Khingan Mountains, the terrain of the entire area presents an east-high-west-low and north-high-south-low pattern. This complex topography results in considerable climate variability. Most of the city is characterized by lacustrine deposits, and the geological conditions for mineralization are relatively poor. The average annual temperature is approximately 0.8 °C, while annual precipitation varies from 358.8–773.8 mm. During winter, early spring, and late autumn, it is primarily influenced by the Siberian cold high-pressure system, which is characterized by prevailing northerly winds, low precipitation, and dry air, and results in cold temperatures. In the territory of Beian city, there are primarily two soil types: black soil and dark brown soil. The natural forests in this area are characterized by poplar and birch, while the planted forests are mainly composed of larch and camphor.

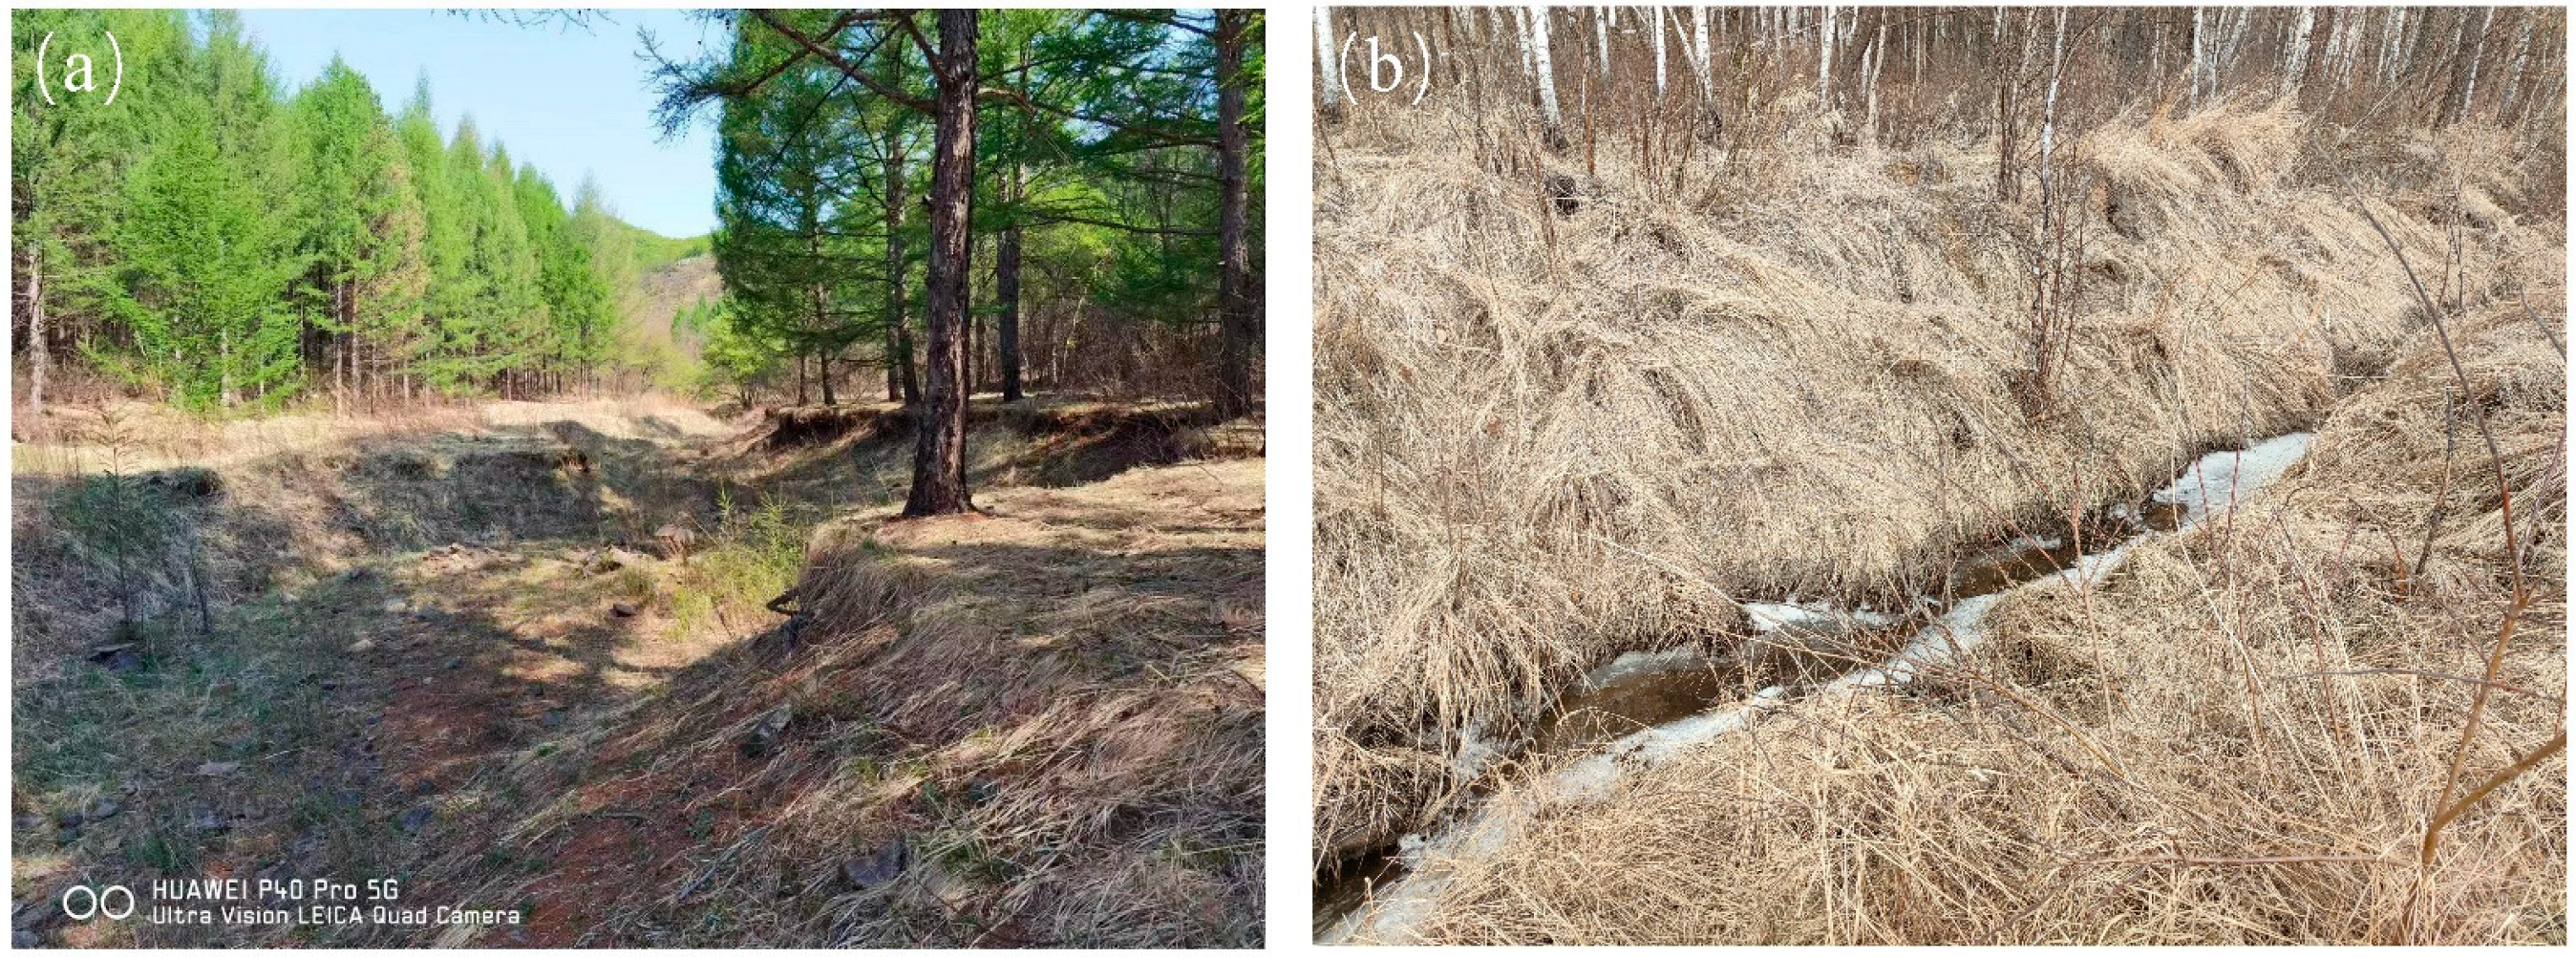
2.2. Methodology for Field Survey of Gully

The field survey was conducted in April and May 2022, in the LKM and GKM, respectively. The survey area was determined based on topographic features and land use. Prior to the field survey, high-definition satellite images of the survey area were collected using Omap (version 9.7.1 Beijing Yuanshenghua Network Technology Co., Ltd. Beijing, China, www.ovital.com, accessed on 15 April 2022) to preliminarily identify the distribution of gullies within the area. The survey area was divided into sub-areas, and specific survey routes were developed. Each team, comprising two individuals, surveyed the sub-areas. Upon locating a gully, the team numbered it and measured the position of the gully head, tail, and cross-section using GPS. A laser rangefinder (NF-273L red light) was used to measure the width above and below the gully, as well as the depth in and far from the gully. The development status and land use type were also recorded, and photographs of the cross-sections were taken [9]. To ensure that the measured sections represented the morphological characteristics of gullies, at least 5 sections were set for gullies <100 m in length, and 8–15 sections were generally set for gullies >100 m in length. Each surveyed gully was marked on the Omap to avoid duplication or omission. After the field survey was completed, the information of each gully in the surveyed area was summarized, and the geographic location information of the gullies was imported into ArcMap 10.2. The line file number of each gully corresponded to the number of the gully in the survey and was manually corrected using high-definition satellite images to minimize error. Figure 2 shows the real status of gullies in the two study areas.
The gully data obtained from field measurements were used to extract the length of each gully using ArcMap10.2. Microsoft Excel 2021 was utilized to compute various parameters, including gully area, gully volume, ground lacerative degree, and gully density. These parameters were calculated using the following methods.
The number density of gullies is the number of gullies per unit area, calculated as shown in Equation (1):
f = N A
where f represents the density of gullies, expressed in units of per km2; N represents the total number of gullies; A represents the area of the region, in km2.
The gully area is calculated as shown in Equation (2):
S A = i n W i n L
where SA represents the gully area in km2, Wi denotes the width of the i-th measuring point on the gully, L represents the length of the gully in m, and n is the number of measurements taken.
The formula for calculating the trench volume is shown in Equation (3):
V G = i = 1 n ( W i u + W i d ) 2 D i L i
where VG represents gully volume in m3, Wiu is the average width of the gully at the i-th measurement point, Wid is the average width of the gully at the bottom of the i-th segment, Di is the average depth of the i-th segment, and Li is the length of the slope measured for the i-th segment.
The gully density is an indicator of the total length of gullies per unit area, which is calculated according to Equation (4):
G D = L g A
where GD represents gully density in km/km2, and Lg is the total length of gullies within the area, in km.
The ground lacerative degree represents the total area of gullies per unit area and is calculated as shown in Equation (5):
G L D = S A
where GLD is the ground lacerative degree in km2/km−2 and S is the total area of gullies in the region, in km2.
The root mean square error is the square root of the average of the squared differences between predicted values and true values, divided by the number of observations, n, and is calculated according to Equation (6):
R M S E = i = 1 n ( V G i V M i ) 2 n
where VGi and VMi are the measured and modelled gully volumes (m3), respectively.
Downloading 12.5 m resolution DEM within the study area as a data source via Google Earth, various tools in ArcMap10.2′s ArcToolbox, including 3D Analyst and Spatial Analyst, were used to intersect the gullies polyline shape file with slope layer from DEM, the average ditch width in the study area is much less than the DEM resolution, and the topographic slope is considered to be approximately equal to the gully slope. The slope gradients of the Greater and Lesser Khingan Mountains were reclassified into the following categories: 0–2°, 2–4°, 4–6°, 6–8°, 8–10°, 10–12°, 12–14°, 14–16°, 16–18°, 18–20°, 20–22°, 22–24°, 24–26°, 26–28°, 28–30°, and 30–32°. Gully parameters for different slopes and aspects were obtained from this information. By overlaying the gully parameters of the same slope and aspect, all of the gully parameter values for that slope and aspect were obtained. The slope aspect classification is as follows: N represents the north-facing slope (shaded slope), S represents the south-facing slope (sunny slope), NW and NE represent the northwest and northeast slopes, respectively (semi-shaded slopes), and SW and SE represent the southwest and southeast slopes, respectively (semi-sunny slopes).
Correlation analysis of the parameters of length, width, depth, area, and volume in the study areas of GKM and LKM was conducted using IBM SPSS Statistics 27.0.1, and the correlation statistical graphs were plotted using Origin 2023.

3. Results

3.1. General Characteristics of Gully Morphology

After field measurements, a total of 87 gullies were identified in the study area of the GKM and LKM (Figure 3). As shown in Table 2, the GKM study area had 37 gullies with a density of 0.32 gullies per km2, and the gully lengths ranged from 26.33 m to 3303.2 m, while the widths and depths ranged from 0.40 m to 7.65 m and 0.4 m to 2.48 m, respectively. The average length, width, depth, area, and volume of the gullies in this area were 524.42 m, 2.45 m, 1.09 m, 1243.93 m2, and 1153.18 m3, respectively. The GD in this area was 0.12 km/km−2, and GLD was 0.05%. In the LKM study area, there were 50 gullies, resulting in a gully density of 0.40 gullies per km². The range of gully lengths, widths, and depths were 14.70 m to 2182.23 m, 0.9 m to 9.0 m, and 0.5 m to 8.0 m, respectively. The average gully length, width, and depth were 560.13 m, 3.93 m, and 1.79 m, which were 1.07 times, 1.60 times, and 1.64 times greater than those in the GKM. The individual gully area and volume in this area could reach 2455.94 m2 and 3365.55 m3, or 2.0 times and 2.9 times greater than those in the Greater Khingan Mountains forest area, respectively. Although the GD was similar to that of the GKM, the GLD was only 0.03 km/km−2.

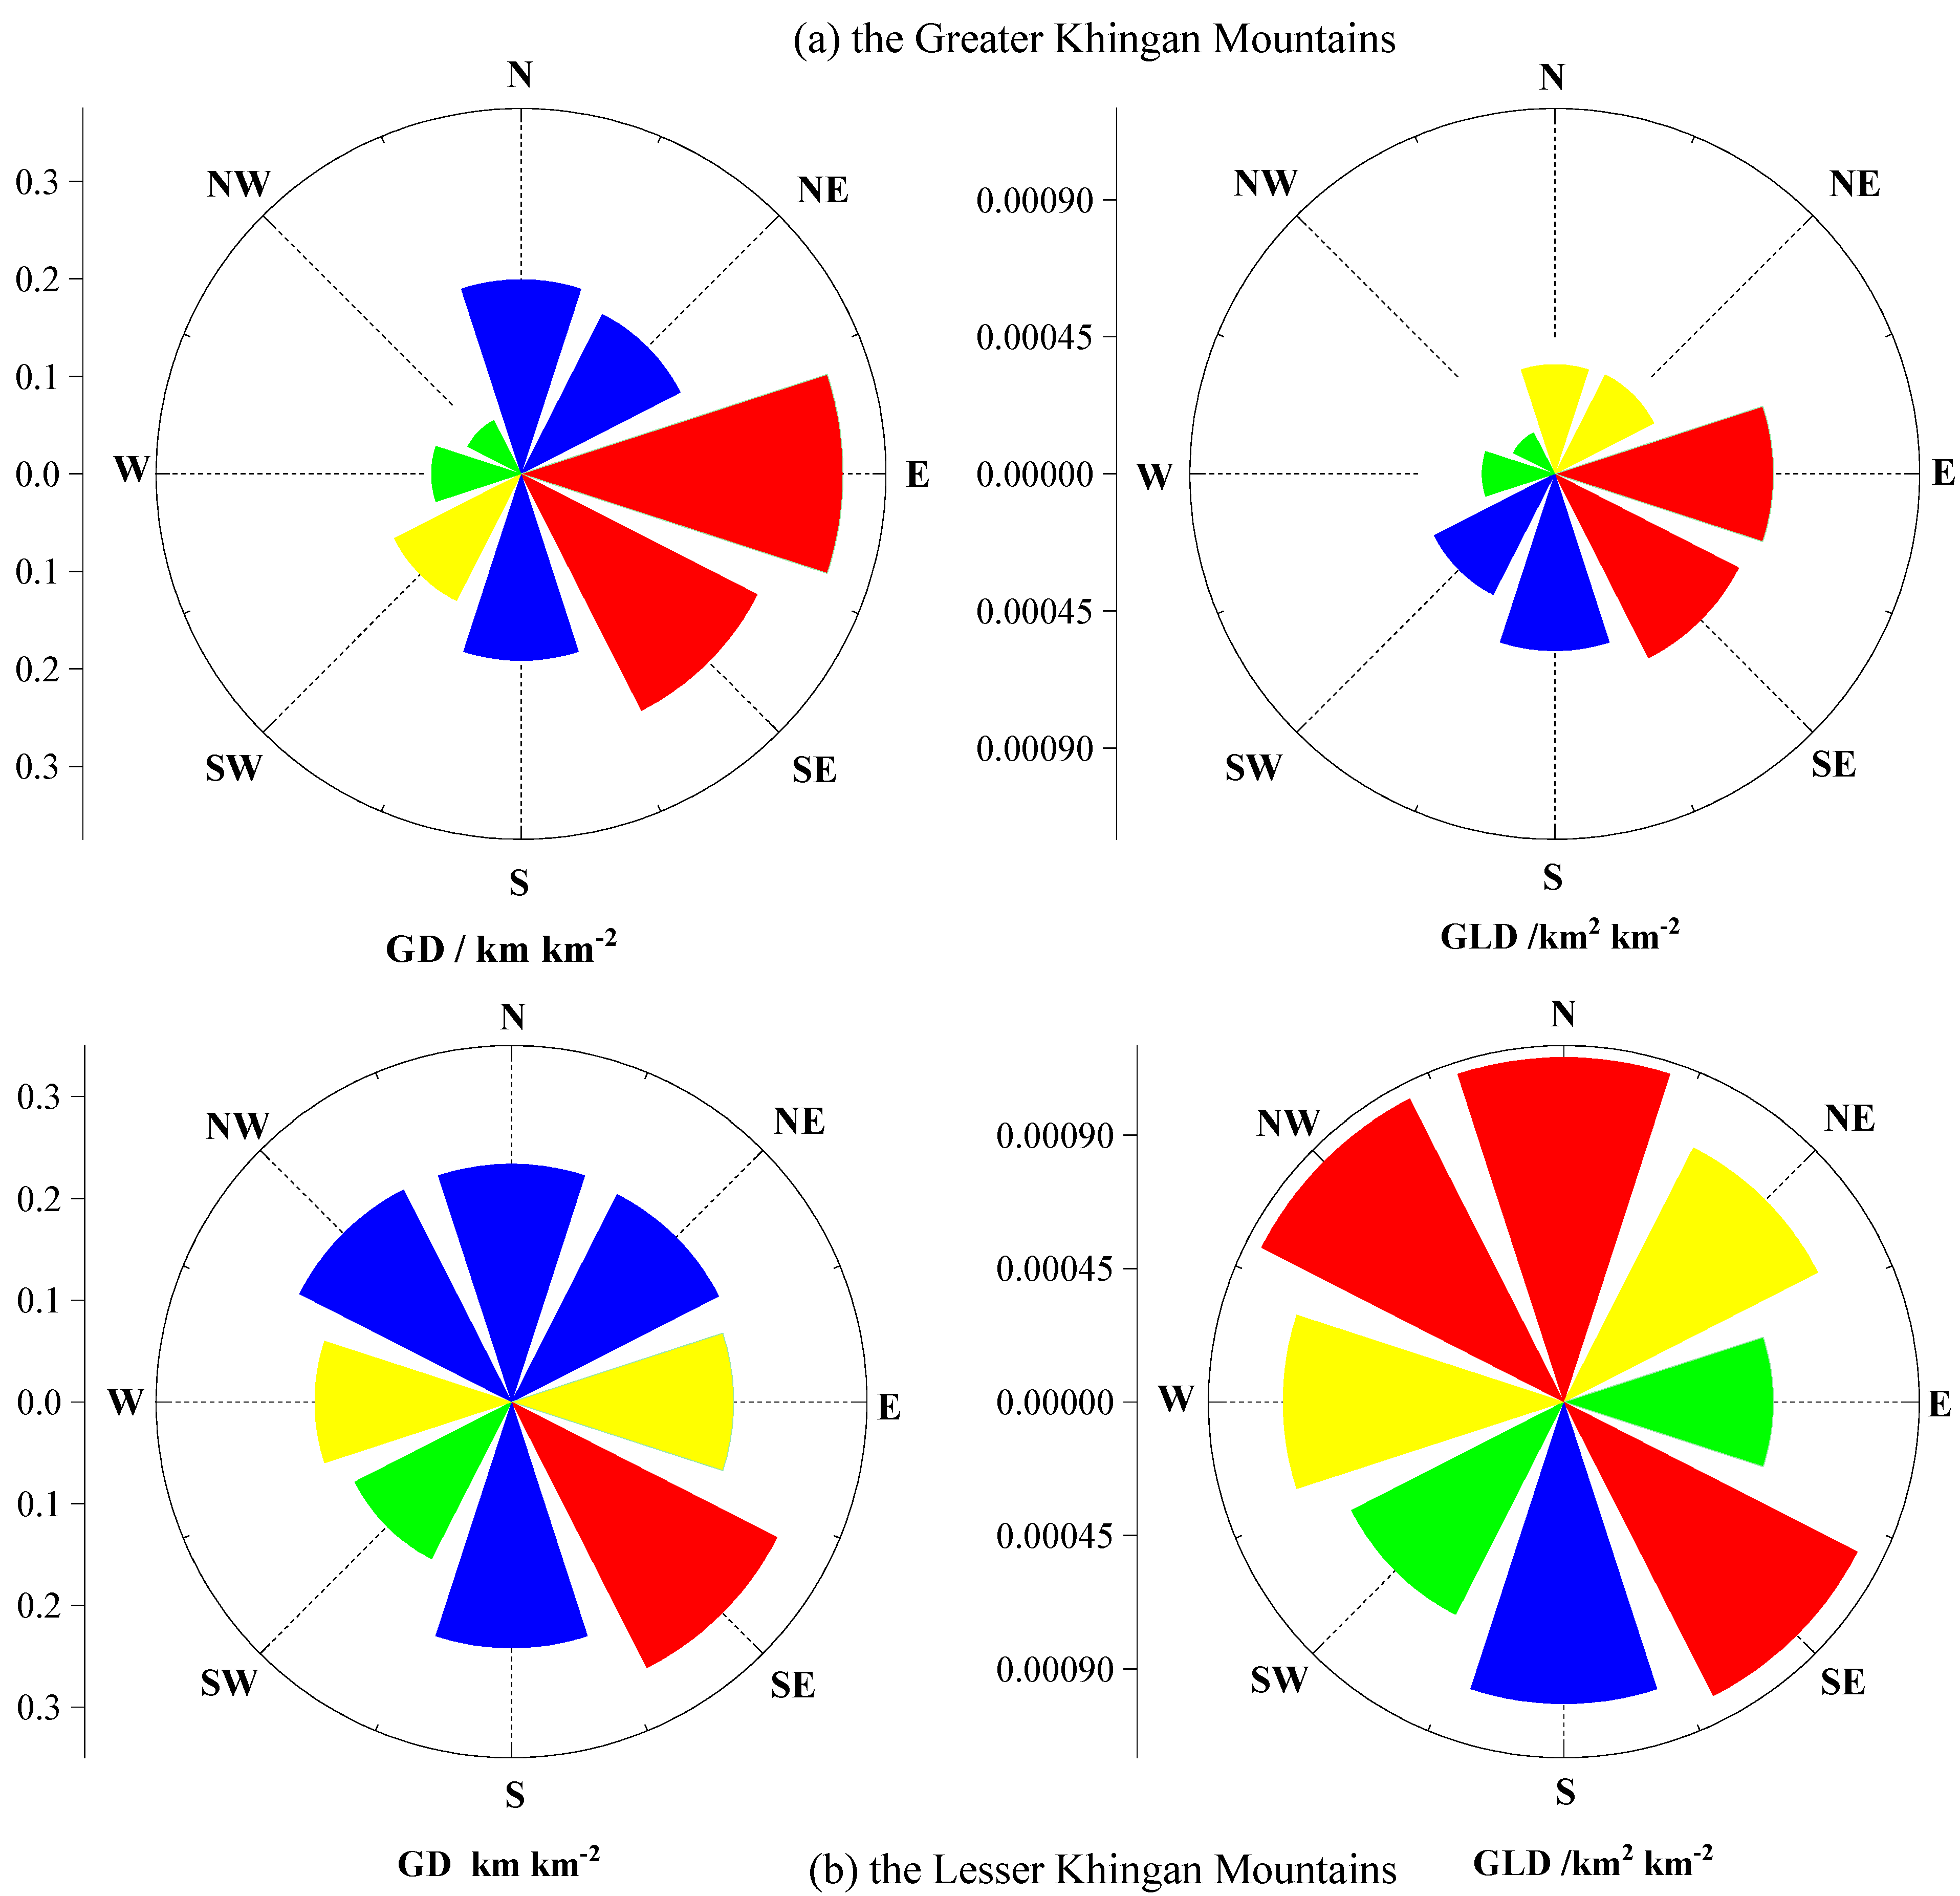
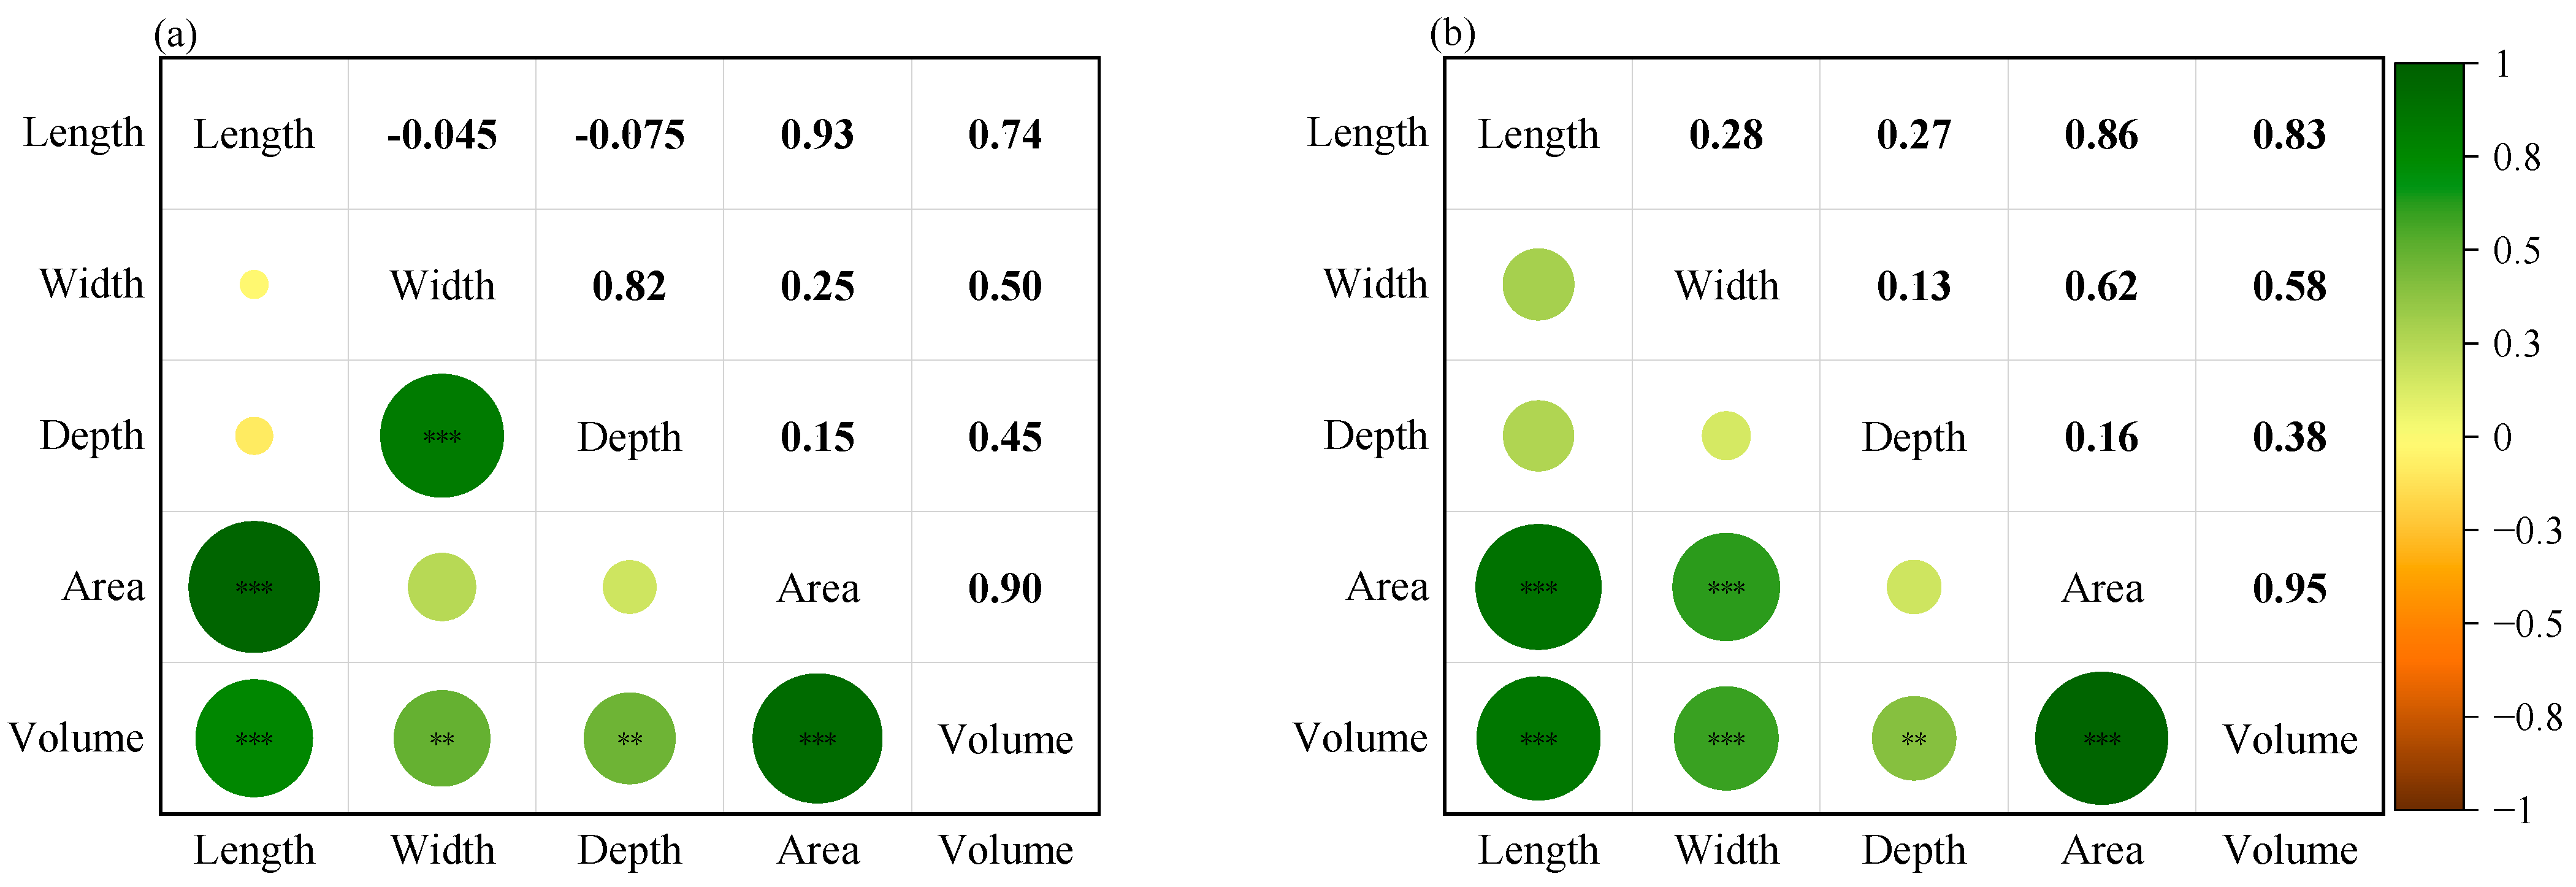
3.2. Gully Morphology Distribution Characteristics

According to Figure 4, over 75% of the gullies in both study areas are longer than 100 m, with the highest percentage of gullies in the LKM study area being in the 200–500 m and 1000–2500 m length categories, at 30% and 24%, respectively, followed by the 100–200 m length category, at 20%. Gullies with lengths less than 100 m account for only 14%. However, in the GKM study area, gullies are concentrated in the 200–1000 m length range, accounting for 62.2% of the total, while gullies in the <50 m, 50–100 m, and 1000–2500 m length categories are almost equally distributed, accounting for 10.8%. The 100–200 m length category has the lowest percentage, at only 5.4%.
The width of gullies in the LKM is mostly distributed between 2–6 m, accounting for 62% of the total, followed by the 4–8 m category at 36%, while gullies with a width of 8–10 m are the least common, accounting for only 2%. In contrast, in the GKM, gullies are mostly distributed between 0–4 m, accounting for 86.5% of the total, followed by the 4–6 m category at 8.1%, while gullies with a width of 6–8 m are the least common, accounting for only 5.4%.
The frequency distribution of gully depths in the study areas of the GKM and LKM follows an increasing-then-decreasing trend with increasing width categories. In the LKM, gully depths are mostly distributed within the range of 1.5–2 m, accounting for 38% of the total, followed by the range of 0.5–1.5 m, which represents 36% of the total. The percentage of gullies deeper than 2.5 m is the lowest, at only 6%. In the GKM, gully depths are mostly distributed within the range of 0.5–1.5 m, accounting for 73% of the total, followed by the range of 1.5–2 m, which represents 16.2% of the total. The percentage of gullies in the remaining width categories is only 10.8%.
The gully area distribution in the LKM is relatively even among the same level. The average proportion of the three level ranges, namely <0.05 hm2, 0.10–0.2 hm2, and >0.3 hm2, is about 25.3%. The proportion of the 0.05–0.1 hm2 level is 14% of the total, while gullies with an area of 0.2–0.3 hm2 only account for 10%. On the other hand, in the GKM, the gully area is mainly concentrated in the level of <0.05 hm2, accounting for 43.2% of the total.
In the LKM, the single gully volume is mainly distributed in the range of 500–2000 m3, accounting for 36% of the total, followed by 100–500 m3, accounting for about 20%. The gullies in the three volume ranges of 2000–5000 m3, 5000–10,000 m3, and >10,000 m3 have an average proportion of about 12.7%. The proportion of gullies with a volume less than 100 m3 is the smallest, at only 6%. In the GKM, gullies with volumes of 100–500 m3 and 500–2000 m3 account for the largest proportion, reaching 40.5% and 32.4% respectively, followed by gullies in the <100 m3 and 2000–5000 m3 ranges, accounting for 10.8%. The proportion of gullies in the 5000–10,000 m3 range is the smallest, at only 5.5%.

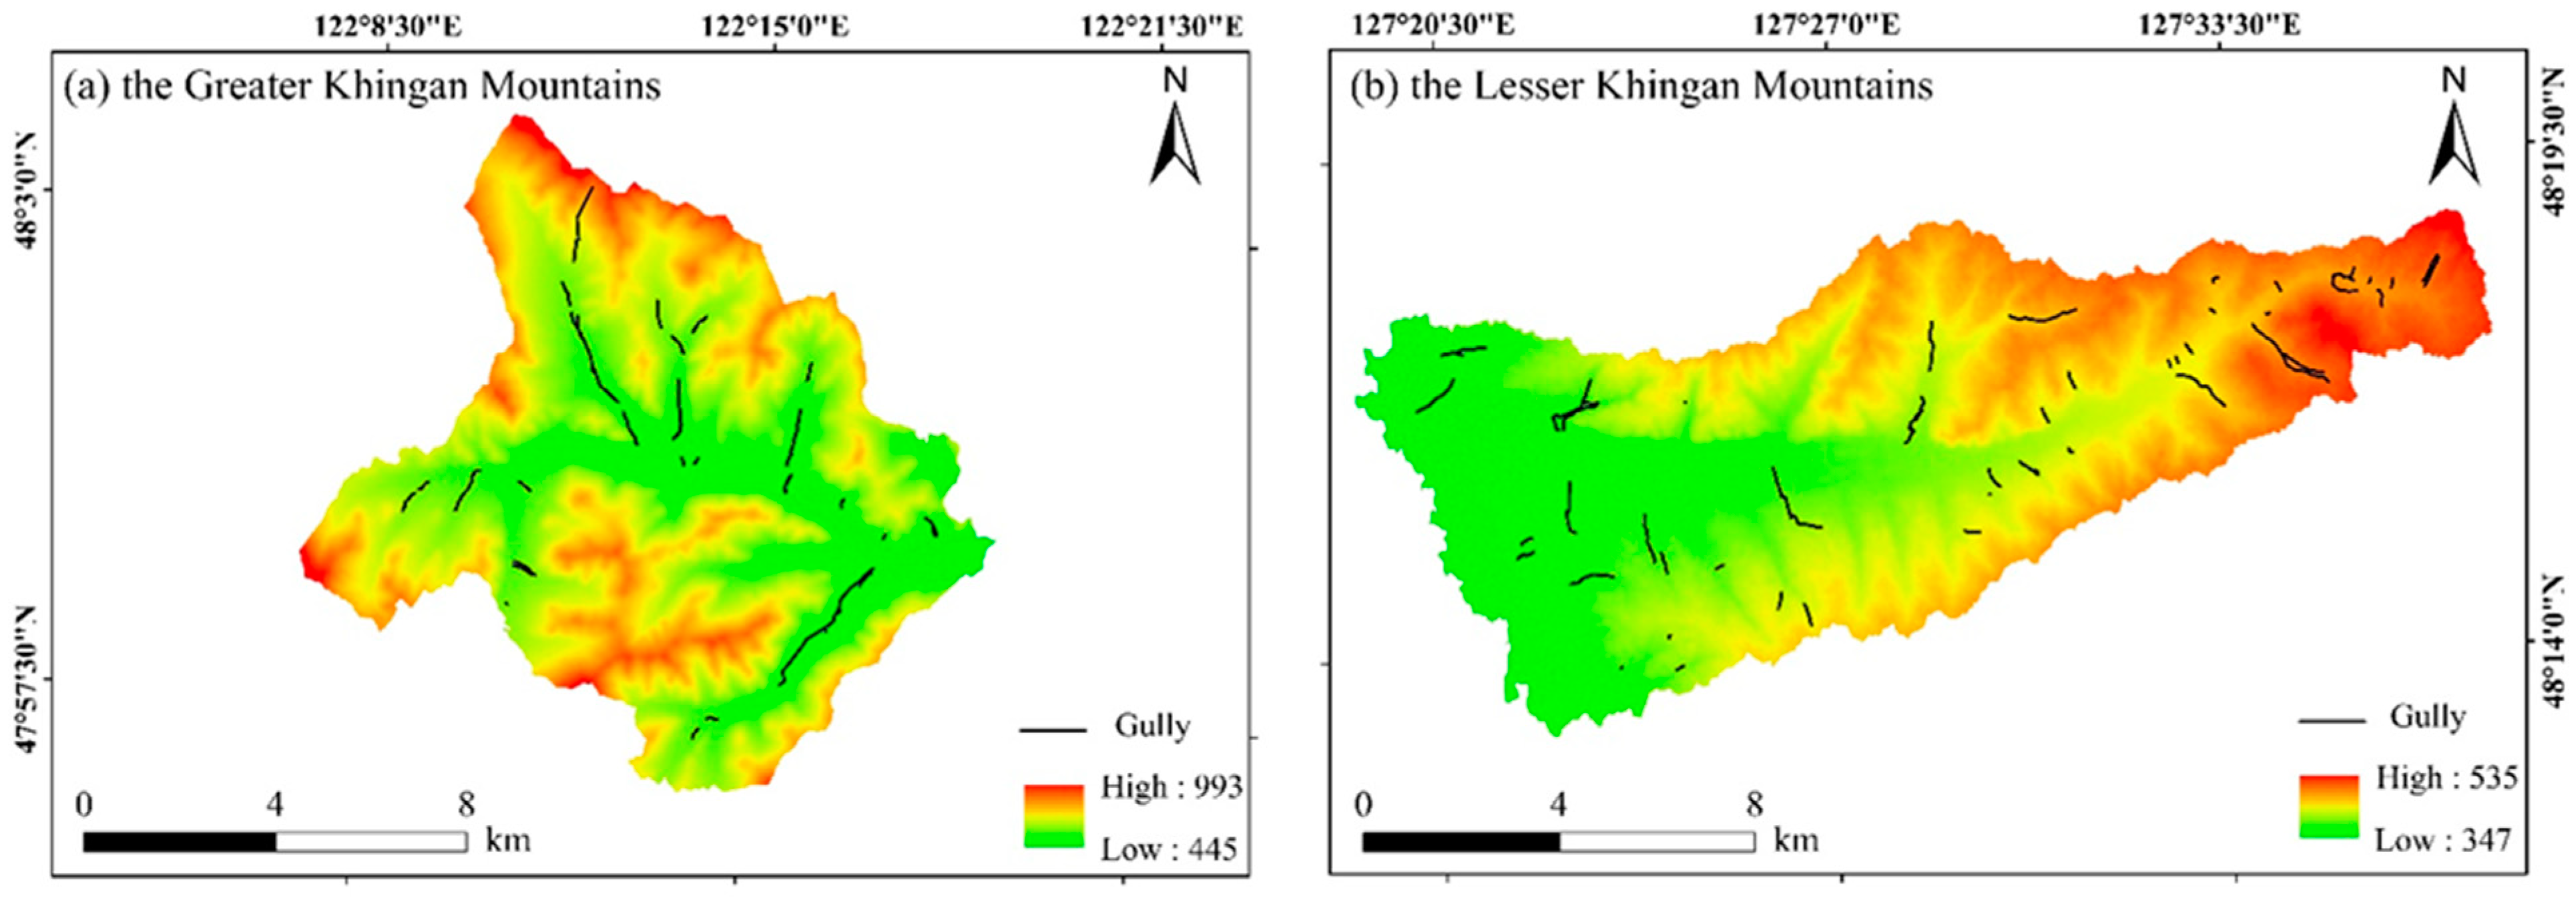
3.3. Topographical Distribution

The variations of gully density and surface fragmentation with slope in the forest area of GKM and LKM are shown in Figure 5. In the study area of the GKM, GD and GLD are highest at slopes between 0–1°. As a slope increases from 0–6°, GD and GLD sharply decrease from 0.89 km/km−2 to 0.12 km/km−2 and from 0.0017 km2/km−2 to 0.0003 km2/km−2, respectively. Subsequently, both of these show a slow fluctuating decrease with the increase of slope. The fitted results indicate that GD and GLD exhibit a significant exponential decrease with slope (p < 0.05).
Figure 6 illustrates the changes in GD and GLD along eight slope orientations: north (N), northeast (NE), east (E), southeast (SE), south (S), southwest (SW), west (W), and northwest (NW) in the GKM and LKM. In the study area of the GKM, the gully density (0.33 km/km−2) and surface fragmentation (0.0007 km2/km−2) were highest on the east-facing slope, followed by the southeast-facing slope. The northwest-facing slope had the lowest gully density (0.06 km/km−2) and surface fragmentation (0.0002 km2/km−2). In the study area of the LKM, the southeast-facing slope had the highest gully density (0.29 km/km−2), followed by the south-facing slope, while the southwest-facing slope had the lowest gully density (0.17 km/km−2). In contrast with the GKM study area, surface fragmentation was highest on the north-facing and northwest-facing slopes (0.0012 km2/km−2) in the LKM study area, followed by the southeast-facing slope, and lowest on the east-facing slope (0.0007 km2/km−2).

3.4. Gully Volume Estimation

As shown in Figure 7a, in the measured area of the GKM, a gully’s volume is strongly positively correlated with the gully area and length, and significantly positively correlated with the gully width and depth. Among these, the correlation with the gully area is the strongest (correlation coefficient of 0.93), followed by gully length, width, and depth. Therefore, the gully area can be used as the preferred parameter for estimating the volume of gullies in the GKM. Regression analysis shows that the gully volume is in an extremely significant power function relationship with the gully area (V = 0.37 A1.11, R2 = 0.94), and that this relationship can be used to estimate the volume of gullies in the GKM (Figure 8a).
The correlation between gully volume and other gully morphological parameters in the measured area of the LKM is almost identical to that of the GKM, where the gully area is the parameter with the highest correlation with volume, followed by gully length, width, and depth (Figure 7b). As shown in Figure 8b, the gully volume in the LKM is in an extremely significant power function relationship with the gully area (V = 0.32A1.17, R2 = 0.94).

4. Discussion

4.1. The Uniqueness of Gully Morphology in the Greater and Lesser Khingan Mountains

The main factors that affect gully erosion are terrain, rainfall, composition of the ground material, soil thickness, land use, and human activities [23,24]. The average annual rainfall in Beian city is higher than that in Zhalantun city (Table 1). The soil in the LKM is relatively thick, with a loose texture and low gravel content, making the soil highly erodible. Compared with the LKM, the soil in both the small and large ranges of the GKM is relatively thin and contains a high percentage of gravel. The average slope of the LKM (3°) is smaller than that of the GKM (12°), resulting in a larger catchment area for the LKM. It can be observed from research that the area of forest destruction is greater in the LKM, and the vegetation coverage is lower than that of the GKM. Due to the loose texture and low gravel content of the soil in the LKM, the gully downcutting is more severe. Additionally, lateral erosion during water flow scouring causes bank collapse and gully widening. Therefore, the average length, width, and depth of the LKM are slightly greater than those of the GKM.
Compared with other regions (Table 3), the average length of gullies in this study area is significantly higher than those of the Loess plateau, Yuanmou dry–hot valley, Ethiopia, and Tanzania. However, the average width of gullies is smaller. Previous studies have indicated that the slopes of the Loess plateau and Yuanmou dry–hot valley are steeper than those of the Northeast China black soil region, while their watershed areas are much smaller. In contrast, the Northeast China black soil region has an average annual temperature of 0 °C and is prone to freeze–thaw erosion, which promotes gully development. In the Loess plateau, the gullies tend to be wider and deeper due to the collapsibility of the loess [25]. The Yuanmou dry–hot valley, characterized by high annual temperatures, steep slopes, and loose soil, has wider gullies. In Tanzania, the region is prone to high erosive rainfall, which contributes to soil erosion. Additionally, the topographic features and soil properties are also driving factors in the formation of gullies. The soil structure in the area is relatively weak, primarily composed of sandy soil, but the subsoil contains a higher clay content, making the soil more susceptible to erosion [26]. The erosion degree of gullies is also closely related to climatic conditions, such as rainfall. The study area is located in the Northeast China black soil region, where the annual rainfall is relatively low, providing a suitable environment for gully development. Apart from climatic and geological conditions, human activities also have an impact on the formation and development of gullies. Excessive land use and unreasonable water resource development may exacerbate soil erosion, thereby promoting gully erosion. The study area of this article is located in the black soil region of China, and its soil structure is not significantly different from those of the rolling hilly or mountainous hilly regions. Therefore, it is inferred that the differences in the morphology of gullies in two areas may be attributed to the influence of other environmental factors, such as differences in climatic conditions, vegetation cover, human activities, and land use. Climatic conditions, such as precipitation patterns and temperature variations, can directly affect the erosive forces acting on the landscape. Vegetation cover acts as a natural protective barrier against erosion, and its presence or absence can impact the vulnerability of the soil to erosion. Additionally, human activities and land use practices, such as deforestation, agriculture, and construction, can alter the surface characteristics and exacerbate erosion processes.

4.2. Topographic Distribution Pattern

The results show that the GD and GLD degree in the study area decreased with increasing slope, while different results were found in other related studies. In the northeast Manchurian sandy land, the gully density and GLD increased with slope until reaching a peak, after which they decreased with increasing slope. This suggests that the relationship between GD, GLD, and slope may be influenced by various factors, such as topography, land use, and human activities. The average slopes in the GKM and LKM were 11.8° and 3.6°, respectively, while in the rolling hilly region in Northeast China, it was 2.44°. In the GKM forest area, areas with high slope had extremely high vegetation cover and almost no human activity. Vegetation cover may be a factor that leads to the different relationship between slope and GD and GLD in this area because vegetation can reduce the flow velocity of water and erosion, thus reducing the formation and development of erosion gullies. On the other hand, in the Rolling hilly region inNortheast China, due to the relatively flat terrain and low vegetation cover, gullies were promoted by both natural and human factors, leading to a different relationship between slope and GD and GLD compared with other areas. In addition, although the GLD and GD exhibit an exponential distribution in the GKM, while a linear distribution is observed in the LKM, the relationship between GD and GLD in the GKM is nearly linear within areas of an average slope of 0–12°. This pattern suggests that in the GKM, the development of gullies is primarily influenced by water flow and human activities, particularly in areas with lower slopes. Water flow plays a significant role in erosion and channel deepening, while human activities alter surface hydrological conditions and promote the formation of gullies.
The research indicates that GD and GLD on the semi-sunny slopes of the GKM are higher than those on the shady slopes. Li et al. [19] have also found that erosion on sunny or semi-sunny slopes is stronger than on shady or semi-shady slopes. In the study area, the sunny and semi-sunny slopes receive more solar radiation during the day than the shady and semi-shady slopes, and the temperature difference between day and night is also greater. This leads to differential effects of freeze–thaw cycles on the development of gullies. In addition, the sunny slopes also accelerate snow melting, leading to concentrated water flow and to the surface soil texture becoming loose, thereby decreasing erosion resistance, which is one of the reasons for the higher density of erosion gullies on the sunny slopes. Furthermore, local wind direction and rainfall also affect the development of erosion gullies. In Northeast China, warm and humid air currents mostly come from the Pacific, and in summer, there are prevailing south winds that have a greater impact on the erosion of the windward slopes by raindrops [32].
The LKM, however, has a gentler slope and a more evenly distributed solar radiation due to its lower overall slope. Consequently, the gullies that form in this area display a relatively uniform pattern. This implies that the slope could be the primary factor that influences the development of gullies in the LKM.

4.3. Estimation Model for Gully Volume

A gully’s volume (V) is a key parameter that reflects the degree of gully erosion [33]. Obtaining parameters such as gully length (L) and gully area (A) is simpler and more accurate than estimating gully volume. Therefore, studying the relationship between V–A and V–L is of great significance for further research on gully erosion. It has been found that the V–A relationship in both the GKM and the LKM follows a power function V = a·Ab, where b can be considered as the growth rate of gully depth per unit area of gully cross-section [34,35]. The b value in the GKM (1.11) is smaller than that in the LKM (1.17), indicating a greater risk of gully erosion in the latter. This phenomenon can be attributed to the smaller average slope angle and larger watershed area in the LKM, which facilitates gully formation, and the low content of soil gravel, which makes the gully easy to undercut. Additionally, the large deforestation area and frequent human activities in the LKM also increase the risk of gully erosion. Further studies have found that the b value in the study area is larger than the rolling hilly region in Northeast China but smaller than the mountainous and hilly region there (Table 4), indicating a slower rate of gully incision per unit area of gully cross-section in the rolling hilly region. The gully development in the rolling hilly region may be mainly characterized by advancing gully heads and widening gully banks, while gully incision is the dominant process in the mountainous and hilly region. The b value in the study area is similar to that in the Loess plateau of China and to Ethiopia.

4.4. Significance and Limitation of This Study

In summary, this study utilized manual field measurements to gain insights into the actual conditions of gullies developed in forested areas of Northeast China. The findings provide valuable references for local gully control and soil management. Additionally, we built a V–A gully volume model, so that gully volume could be calculated using the gully area obtained by a combination of field measurement and remote sensing interpretation. Moreover, the main factors influencing gully erosion in forested areas have been identified as terrain, soil, climate, vegetation, and human activities, providing critical parameters/factors for the development of gully erosion models in future studies. However, there is a limitation in this study. Although field investigations are indeed effective in problem-solving, they still involve some degree of error and can be time consuming and labor intensive. In the future, a combination of manual and high precision measurement technology can be employed to enhance measurement accuracy. The freeze–thaw cycle has been proven to have a great influence on gully development and should be analyzed in future studies.

5. Conclusions

The aim of this study was to investigate the morphological characteristics and influencing factors of, and to develop an estimation model for, erosion volume in the forested areas of the Greater and Lesser Khingan Mountains (GKM and LKM). Based on field surveys, 37 gullies with an average length of 524.42 m, width of 2.45 m, depth of 1.09 m, area of 1243.93 m2, and volume of 1153.18 m3 were found in a 114.87 km2 area of the GKM, while 50 gullies with an average length of 560.13 m, width of 3.93 m, depth of 1.79 m, area of 2445.94 m2, and volume of 3365.55 m3 were discovered in a 124.45 km2 area of the LKM. Gullies in the LKM exhibit larger dimensions than those in the GKM. The GD of the two study areas is similar, but the GLD in the GKM is slightly higher than in the LKM. Overall, GD and GLD decrease with increasing slope. Gullies develop more quickly on the semi-sunny slopes of the GKM, while gullies in the LKM are distributed more evenly on different slope aspects. The volume estimation models for the GKM and LKM are V = 0.37 A1.11 (R2 = 0.94) and V = 0.32 A1.17 (R2 = 0.94), respectively.

Author Contributions

Conceptualization, Z.W.; Methodology, Z.W., P.Z. and P.W.; Software, Z.W.; Validation, Z.W.; Formal analysis, Z.W., Q.S., X.L. and P.W.; Investigation, Z.W. and Z.C.; Resources, Z.W., M.G. and X.L.; Data curation, Z.W., J.W. and P.Z.; Writing—original draft, Z.W.; Writing—review & editing, Q.S., M.G. and P.W.; Visualization, Q.S.; Funding acquisition, J.W. All authors have read and agreed to the published version of the manuscript.

Funding

This study was founded by the National Key Research and Development Program of China (2021YFD1500800) and the Heilongjiang Provincial Natural Science Foundation of China (YQ2021C036).

Institutional Review Board Statement

Not applicable.

Informed Consent Statement

Not applicable.

Data Availability Statement

Summarized data are presented and available in this manuscript and rest of the data used and/or analyzed are available from the corresponding author on reasonable request.

Conflicts of Interest

The authors declare that they have no known competing financial interests or personal relationships that could have appeared to influence the work reported in this paper.

References

  1. Rahmati, O.; Tahmasebipour, N.; Haghizadeh, A.; Pourghasemi, H.R.; Feizizadeh, B. Evaluating the influence of geo-environmental factors on gully erosion in a semi-arid region of Iran: An integrated framework. Sci. Total Environ. 2017, 579, 913–927. [Google Scholar] [CrossRef] [PubMed]
  2. Wu, L.; Liu, X.; Ma, X. Impacts of Grain for Green project on spatiotemporal variations of soil erosion in a typical watershed of Chinese Loess hilly and gully region. Fresenius Environ. Bull. 2016, 25, 4506–4516. [Google Scholar]
  3. Tsegaye, B. Effect of land use and land cover changes on soil erosion in Ethiopia. Int. J. Agric. Sci. Food Technol. 2019, 5, 26–34. [Google Scholar]
  4. Guo, X.; Shao, Q. Spatial pattern of soil erosion drivers and the contribution rate of human activities on the Loess Plateau from 2000 to 2015: A boundary line from northeast to southwest. Remote Sens. 2019, 11, 2429. [Google Scholar] [CrossRef] [Green Version]
  5. Wang, X.; Zhao, X.; Zhang, Z.; Yi, L.; Zuo, L.; Wen, Q.; Liu, F.; Xu, J.; Hu, S.; Liu, B. Assessment of soil erosion change and its relationships with land use/cover change in China from the end of the 1980s to 2010. Catena 2016, 137, 256–268. [Google Scholar] [CrossRef]
  6. Mounirou, L.A.; Yonaba, R.; Tazen, F.; Ayele, G.T.; Yaseen, Z.M.; Karambiri, H.; Yacouba, H. Soil erosion across scales: Assessing its sources of variation in Sahelian landscapes under semi-arid climate. Land 2022, 11, 2302. [Google Scholar] [CrossRef]
  7. Mounirou, L.A.; Yonaba, R.; Koïta, M.; Paturel, J.-E.; Mahé, G.; Yacouba, H.; Karambiri, H. Hydrologic similarity: Dimensionless runoff indices across scales in a semi-arid catchment. J. Arid Environ. 2021, 193, 104590. [Google Scholar] [CrossRef]
  8. Valentin, C.; Poesen, J.; Li, Y. Gully erosion: Impacts, factors and control. Catena 2005, 63, 132–153. [Google Scholar] [CrossRef]
  9. Fenli, Z.; Ximeng, X.; Chao, Q. A review of gully erosion process research. Nongye Jixie Xuebao/Trans. Chin. Soc. Agric. Mach. 2016, 47, 48–59+116. [Google Scholar]
  10. Li, M.; Li, T.; Zhu, L.; Meadows, M.E.; Zhu, W.; Zhang, S. Effect of land use change on gully erosion density in the black soil region of Northeast China from 1965 to 2015: A case study of the Kedong County. Front. Environ. Sci. 2021, 9, 652933. [Google Scholar] [CrossRef]
  11. Su, Z.; Xiong, D.; Dong, Y.; Yang, D.; Zhang, S.; Zhang, B.; Zheng, X.; Zhang, J.; Shi, L. Influence of bare soil and cultivated land use types upstream of a bank gully on soil erosion rates and energy consumption for different gully erosion zones in the dry-hot valley region, Southwest China. Nat. Hazards 2015, 79, 183–202. [Google Scholar] [CrossRef]
  12. Xu, Q.; Chen, W.; Zhao, K.; Zhou, X.; Du, P.; Guo, C.; Ju, Y.; Pu, C. Effects of land-use management on soil erosion: A case study in a typical watershed of the hilly and gully region on the Loess Plateau of China. Catena 2021, 206, 105551. [Google Scholar] [CrossRef]
  13. Li, H.; Cruse, R.M.; Liu, X.; Zhang, X. Effects of topography and land use change on gully development in typical mollisol region of Northeast China. Chin. Geogr. Sci. 2016, 26, 779–788. [Google Scholar] [CrossRef] [Green Version]
  14. Zhang, G.; Yang, Y.; Liu, Y.; Wang, Z. Advances and prospects of soil erosion research in the black soil region of northeast China. J. Soil Water Conserv. 2022, 36, 1–12. [Google Scholar]
  15. Wang, R.; Zhang, S.; Pu, L.; Yang, J.; Yang, C.; Chen, J.; Guan, C.; Wang, Q.; Chen, D.; Fu, B. Gully erosion mapping and monitoring at multiple scales based on multi-source remote sensing data of the Sancha River Catchment, Northeast China. ISPRS Int. J. Geo-Inf. 2016, 5, 200. [Google Scholar] [CrossRef] [Green Version]
  16. Zhang, S.; Li, F.; Li, T.; Yang, J.; Bu, K.; Chang, L.; Wang, W.; Yan, Y. Remote sensing monitoring of gullies on a regional scale: A case study of Kebai region in Heilongjiang Province, China. Chin. Geogr. Sci. 2015, 25, 602–611. [Google Scholar] [CrossRef]
  17. Zhang, T.; Liu, G.; Duan, X.; Wilson, G. Spatial distribution and morphologic characteristics of gullies in the Black Soil Region of Northeast China: Hebei watershed. Phys. Geogr. 2016, 37, 228–250. [Google Scholar] [CrossRef]
  18. Wang, R.; Sun, H.; Yang, J.; Zhang, S.; Fu, H.; Wang, N.; Liu, Q. Quantitative evaluation of gully erosion using multitemporal UAV data in the southern black soil region of Northeast China: A case study. Remote Sens. 2022, 14, 1479. [Google Scholar] [CrossRef]
  19. Li, Z.; Qi, Z.; Qin, W.; Chen, C.; Wu, K.; Feng, T. Gully volume estimation model using high-resolution satellite imaging in mountainous and hilly regions with black soil of Northeast China. Trans. Chin. Soc. Agric. Eng. 2021, 37, 122–130. [Google Scholar]
  20. Osorio, D.R.; Giraldo, S.; Mazuera, E.; Burbano, A.; Figueredo, E. Beyond Visualization: Remote Sensing Applications in Prehispanic Settlements to Understand Ancient Anthropogenic Land Use and Occupation in the Sierra Nevada de Santa Marta, Colombia. Lat. Am. Antiq. 2023, 1–21. [Google Scholar] [CrossRef]
  21. Zhang, X.; Liu, X. Current scenario of gully erosion and its control strategy in Mollisols areas of Northeast China. Trans. Chin. Soc. Agric. Eng 2021, 37, 320–326. [Google Scholar]
  22. Yu, X.; Changshun, Z.; Jie, X. Areas benefiting from water conservation in key ecological function areas in China. J. Resour. Ecol. 2015, 6, 375–385. [Google Scholar] [CrossRef]
  23. Wang, J.; Zhang, Y.; Deng, J.; Yu, S.; Zhao, Y. Long-term gully erosion and its response to human intervention in the tableland region of the chinese loess plateau. Remote Sens. 2021, 13, 5053. [Google Scholar] [CrossRef]
  24. Anderson, R.L.; Rowntree, K.M.; Le Roux, J.J. An interrogation of research on the influence of rainfall on gully erosion. Catena 2021, 206, 105482. [Google Scholar] [CrossRef]
  25. Bradford, J.M.; Piest, R.F. Erosional development of valley-bottom gullies in the upper midwestern United States. In Thresholds in Geomorphology; Routledge: Abingdon-on-Thames, UK, 2020; pp. 75–101. [Google Scholar]
  26. Achten, W.; Dondeyne, S.; Mugogo, S.; Kafriti, E.; Poesen, J.; Deckers, J.A.; Muys, B. Gully erosion in South Eastern Tanzania: Spatial distribution and topographic thresholds. Z. Geomorphol. 2008, 52, 225–235. [Google Scholar] [CrossRef]
  27. Zhang, S.; Han, X.; Cruse, R.M.; Zhang, X.; Hu, W.; Yan, Y.; Guo, M. Morphological characteristics and influencing factors of permanent gully and its contribution to regional soil loss based on a field investigation of 393 km2 in Mollisols region of northeast China. Catena 2022, 217, 106467. [Google Scholar] [CrossRef]
  28. Li, Z.; Zhang, Y.; Shang, G.; Qi, F.; Ma, Q.; Li, Y. Characterizing gully cross section and modelling gully volume in hilly loess region of western Shanxi Province. Trans. Chin. Soc. Agric. Eng. 2018, 34, 152–159. [Google Scholar]
  29. Dong, Y.F.; Xiong, D.H.; Su, Z.A.; Li, J.J.; Yang, D.; Zhai, J.; Lu, X.N.; Liu, G.C.; Shi, L.T. Critical topographic threshold of gully erosion in Yuanmou Dry-hot Valley in Southwestern China. Phys. Geogr. 2013, 34, 50–59. [Google Scholar] [CrossRef]
  30. Yibeltal, M.; Tsunekawa, A.; Haregeweyn, N.; Adgo, E.; Meshesha, D.T.; Masunaga, T.; Tsubo, M.; Billi, P.; Ebabu, K.; Fenta, A.A. Morphological characteristics and topographic thresholds of gullies in different agro-ecological environments. Geomorphology 2019, 341, 15–27. [Google Scholar] [CrossRef]
  31. Maerker, M.; Quénéhervé, G.; Bachofer, F.; Mori, S. A simple DEM assessment procedure for gully system analysis in the Lake Manyara area, northern Tanzania. Nat. Hazards 2015, 79, 235–253. [Google Scholar] [CrossRef]
  32. Han, G.; Zhang, G.; You, L.; Wang, Y.; Yang, L.; Yang, J.; Zhou, L.; Yuan, M.; Zou, X.; Cheng, H. Deflated rims along the Xiangshui River on the Xiliaohe Plain, Northeast China: A case of active fluvial–aeolian interactions. Geomorphology 2016, 257, 47–56. [Google Scholar] [CrossRef]
  33. Wu, H.; Xu, X.; Zheng, F.; Qin, C.; He, X. Gully morphological characteristics in the loess hilly-gully region based on 3D laser scanning technique. Earth Surf. Process. Landf. 2018, 43, 1701–1710. [Google Scholar] [CrossRef]
  34. Li, Z.; Zhang, Y.; Zhu, Q.; Yang, S.; Li, H.; Ma, H. A gully erosion assessment model for the Chinese Loess Plateau based on changes in gully length and area. Catena 2017, 148, 195–203. [Google Scholar] [CrossRef]
  35. Vanmaercke, M.; Panagos, P.; Vanwalleghem, T.; Hayas, A.; Foerster, S.; Borrelli, P.; Rossi, M.; Torri, D.; Casali, J.; Borselli, L. Measuring, modelling and managing gully erosion at large scales: A state of the art. Earth-Sci. Rev. 2021, 218, 103637. [Google Scholar] [CrossRef]
Figure 1. The location of the Greater and Lesser Khingan Mountains (a), the Lesser Khingan Mountains study area (b), and the Greater Khingan Mountains study area (c).
Sustainability 15 12056 g001
Figure 2. The gully photos taken from the Great Khingan Mountains (a) and Lesser Khingan Mountains (b).
Sustainability 15 12056 g002
Figure 3. The distribution of gullies in the two study areas.
Sustainability 15 12056 g003
Figure 4. Gully parameter classification.
Sustainability 15 12056 g004
Figure 5. The variation of gully density and gully lacerative degree with slope.
Sustainability 15 12056 g005
Figure 6. Differences in gully density and gully lacerative degree among different slope directions.
Sustainability 15 12056 g006
Figure 7. Correlation among gully morphological parameters, and the Greater Khingan Mountains (a), the Lesser Khingan Mountains (b). ** p ≤ 0.01, *** p ≤ 0.001.
Sustainability 15 12056 g007
Figure 8. Relationship between gully volume and gully area.
Sustainability 15 12056 g008
Table 1. Comparison of environmental factors.
ParametersThe Great Khingan MountainsThe Lesser Khingan Mountains
Vegetation cover67%91%
Gravel content27%52%
Average shape11.8°3.6°
Average temperature2.7 °C0.8 °C
Average rainfall500 mm566 mm
Soil textureClayLoam
Table 2. Morphology parameters of the gullies in the study area of the Great and Lesser Khingan Mountains.
ParametersThe Great Khingan MountainsThe Lesser Khingan Mountains
Study area (km2)114.87124.45
Average length (m)524.42560.13
Average width (m)2.453.93
Average depth (m)1.091.79
Average area (km2)1243.932445.94
Average volume (m3)1153.183365.55
f (gully km−2)0.320.40
GD (km/km−2)0.120.12
GLD (km2/km−2)0.050.03
Table 3. The gully parameters vary between different study areas [19,27,28,29,30,31].
Study AreaAverage Length
(m)
Average Width
(m)
Average Depth
(m)
The Greater Khingan mountains524.52.51.1
The Lesser Khingan mountains560.13.91.8
Rolling hilly region in northeast China [27]522.3215.052.77
Mountainous and hilly region of northeast China [19]81.95.31.05
Loess plateau [28]58.49.06.2
Yuanmou dry–hot Valley in Southwestern China [29]62.9218.69-
The upper Blue Nile basin, Ethiopia [30]138.255.52.4
The Lake Manyara basin, northern Tanzania [31]283.5465.61.21
Table 4. The estimation model for gully volume between different study areas [27,28,29,30,31].
Study AreaVolume Estimation Model
The Greater Khingan MountainsV = 0.37 A1.11, R2 = 0.94
RMSE = 31.48
The Lesser Khingan MountainsV = 0.32 A1.17, R2 = 0.94
RMSE = 26.84
Rolling hilly region in Northeast China [27]V = 2.96 A0.97, R2 = 0.85
Mountainous and hilly region of Northeast China [28]V = 0.18 A1.25, R2 = 0.90
Loess Plateau [29]V = 1.71 A1.14, R2 = 0.85
Yuanmou dry–hot valley in Southwestern China [30]V = 3.24 L1.27, R2 = 0.77
The upper Blue Nile basin, Ethiopia [31]V = 1.05 A1.15, R2 = 0.95
Disclaimer/Publisher’s Note: The statements, opinions and data contained in all publications are solely those of the individual author(s) and contributor(s) and not of MDPI and/or the editor(s). MDPI and/or the editor(s) disclaim responsibility for any injury to people or property resulting from any ideas, methods, instructions or products referred to in the content.

